
Sample Category Title
USD/CAD Daily Outlook
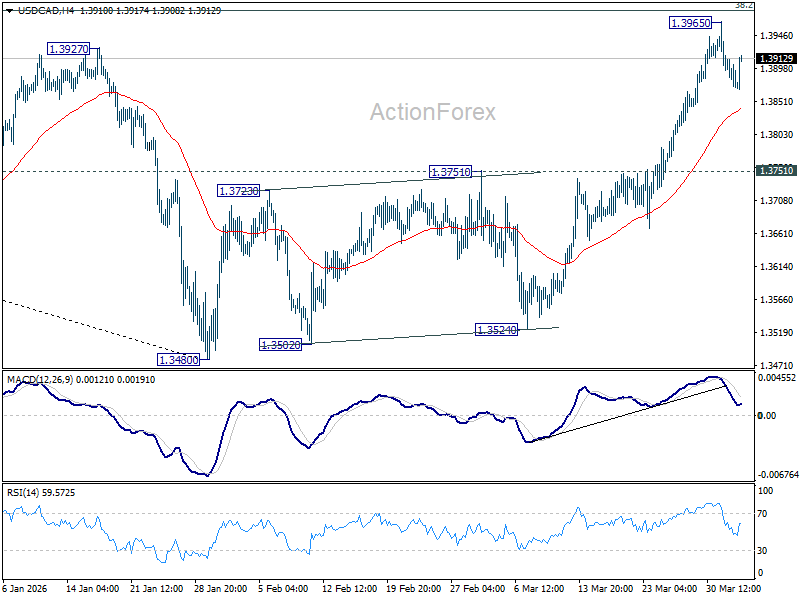
Daily Pivots: (S1) 1.3858; (P) 1.3890; (R1) 1.3907; More...
Intraday bias in USD/CAD stays neutral for the moment, and some more consolidations could be seen below 1.3965 temporary top. In case of another fall, downside should be contained above 1.3751 resistance turned support. On the upside, decisive break of 38.2% retracement of 1.4791 to 1.3480 at 1.3981 will argue that it's already reversing the whole down trend from 1.4791, and target 61.8% retracement at 1.4290. However, firm break of 1.3751 should indicate rejection by 1.3981, and keep the fall from 1.4791 intact. Bias will be back on the downside for retesting 1.3480 low.
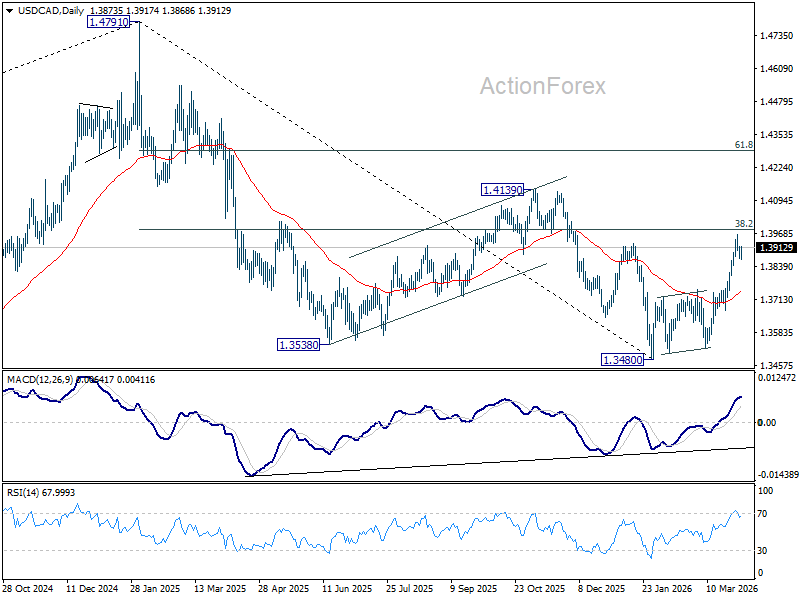
In the bigger picture, price actions from 1.4791 are seen as a corrective pattern to the whole up trend from 1.2005 (2021 low). Deeper fall could be seen, as the pattern extends, to 61.8% retracement of 1.2005 to 1.4791 at 1.3069. However, decisive break of 1.3927 resistance will argue that the correction has completed with three waves down to 1.3480 already. Further break of 1.4139 will confirm and bring retest of 1.4791 high.
Swiss CPI Rises to 0.3% yoy, But Underlying Inflation Stays Soft
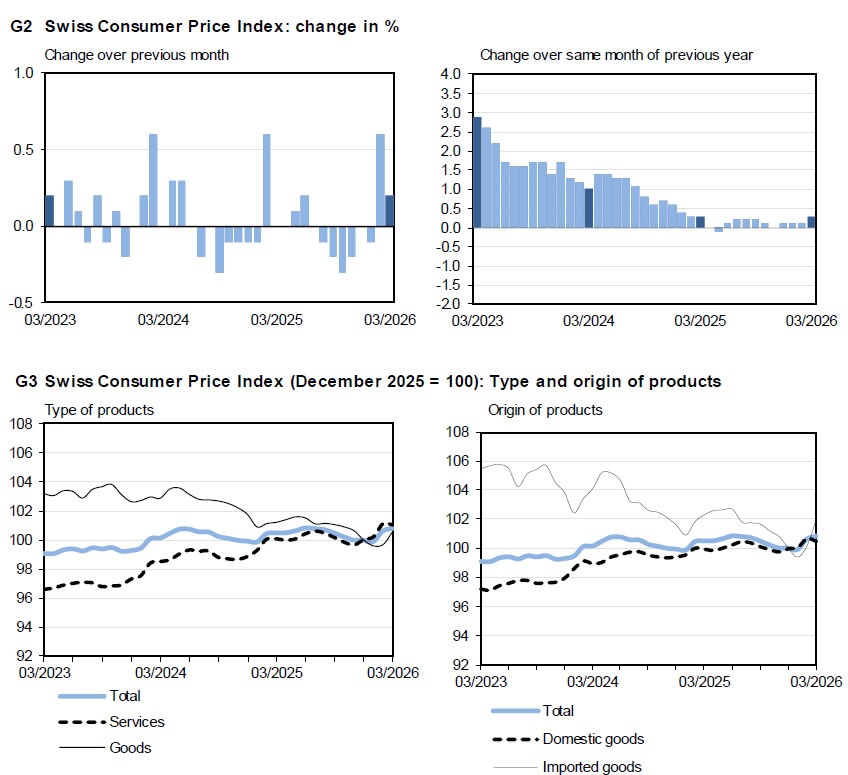
Swiss inflation remained subdued in March, with CPI rising 0.2% mom, below expectations of 0.5% mom. Annual inflation edged up from 0.1% yoy to 0.3% yoy, also missing forecasts of 0.5% yoy. The data highlights a continued lack of underlying price pressure despite some pickup in energy-related components.
The breakdown shows a clear divergence. Imported product prices rose sharply by 1.8% mom, driven by higher costs for heating oil and fuel. However, domestic product prices fell -0.2% mom, and core CPI was flat at 0.0% mom, signaling that internal inflation dynamics remain weak.
On a yearly basis, core CPI held steady at 0.4% yoy, while domestic price growth eased slightly from 0.6% yoy to 0.5% yoy. Import prices, although still negative at -0.3% yoy, rose significantly from -1.6% yoy, reflecting external cost pressures.
Overall, the data suggests that inflation in Switzerland is being driven by imported factors rather than domestic demand, keeping underlying price trends contained.
AUD/USD Daily Report
Daily Pivots: (S1) 0.6895; (P) 0.6930; (R1) 0.6964; More...
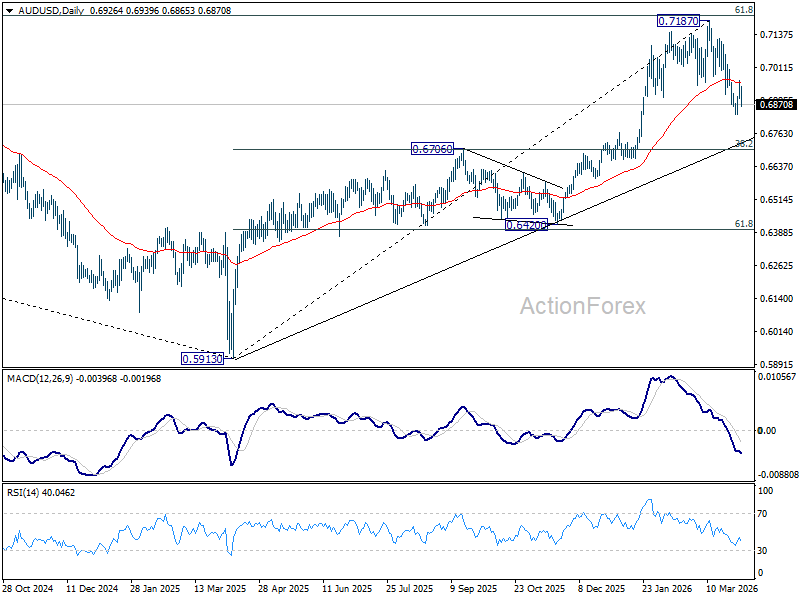
AUD/USD's recovery stalled at 0.6962 and reversed. But downside is contained above 0.6832 temporary low. Intraday bias remains neutral. first. Below 0.6832 will extend the decline from 0.7187 to 38.2% retracement of 0.5913 to 0.7187 at 0.6700. However, firm break of 0.6978 will argue that the correction has completed, and bring retest of 0.7817 high.
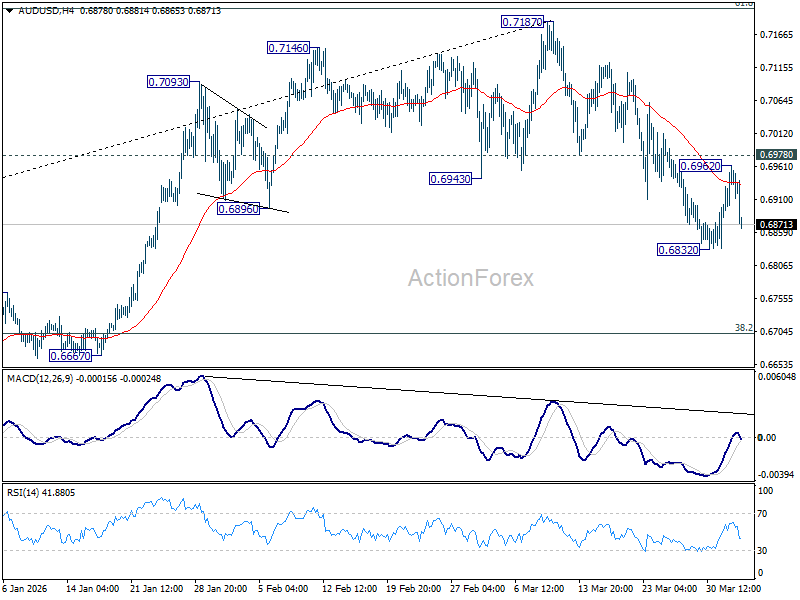
In the bigger picture, as long as 0.6706 cluster support holds, rise from 0.5913 (2024 low) should still be in progress. Decisive break of 61.8% retracement of 0.8006 to 0.5913 at 0.7206 will solidify the case that it's already reversing the down trend from 0.8006 (2021 high). However, firm break of 0.6706 will dampen this bullish case, and bring deeper fall back to 0.6420 support, and possibly below.
After Trump’s Iran War Address, Markets Price Pain—But Not Catastrophe Yet
Markets have flipped back into risk-off mode as oil rebounds above $110 following US President Donald Trump’s escalation signals at his highly anticipated Iran War update. Investors are now pricing a stagflation shock, with oil surging, stocks falling, and Dollar rebounding. However, the risk of a more catastrophic escalation remains underappreciated.
What makes the current moment particularly dangerous is timing. The next 72 hours, leading into a long weekend, present a high-risk window for escalation. With global markets set to close, the US, Israel, and Iran all have strategic incentives to act when immediate market reaction is limited.
Trump’s rhetoric has already laid the groundwork. His pledge to “hit them extremely hard over the next two to three weeks” defines a clear escalation window. Combined with the threat to “bring them back to the Stone Ages,” it signals a move toward broader infrastructure targeting rather than limited strikes.
If such actions begin, the nature of the conflict changes fundamentally. A coordinated campaign against infrastructure would likely trigger retaliation beyond Iran’s borders, particularly against regional oil producers. This is the scenario that markets are not yet fully pricing.
Iran’s response options would be increasingly asymmetric. With conventional capabilities degraded, retaliation could come through cyber attacks on US systems or targeted strikes on oil facilities in Saudi Arabia and the UAE. These actions would directly impact global supply and amplify the energy shock.
Despite these risks, current market pricing remains focused on inflation. The stagflation trade is back, with oil as the inflation trigger driving higher-for-longer interest rate expectations. Markets are pricing inflation and recession—and not yet disruption.
Brent above $110 reflects inflation fears, but a move above $120 would signal that markets are beginning to price physical supply disruption—something not yet fully embedded. The $120 level is the canary level for whether escalation risk becomes systemic.
Asset price moves reflect this partial adjustment. Asian equities are under pressure, led by a sharp drop in KOSPI, while Dollar is rebounding strongly. Loonie is supported by oil, and Yen is benefiting from risk aversion, while high-beta currencies such as Kiwi and Aussie are weakening.
The broader environment is one of maximum uncertainty. The gap between official messaging and operational signals has left markets without clarity. For now, markets remain in a transitional phase—adjusting to higher inflation risks but not yet to the possibility of systemic disruption. This creates a dangerous imbalance in expectations.
The key risk is not what markets are pricing now, but what they are not. If escalation intensifies, the current stagflation narrative could quickly give way to a more severe shock.
In Asia, at the time of writing, Nikkei is down -2.49%. Hong Kong HSI is down -1.43%. China Shanghai SSE is down -1.15%. Singapore Strait Times is down -0.90%. Japan 10-year JGB yield is up 0.087 at 2.391. Overnight, DOW rose 0.48%. S&P 500 rose 0.72%. NASDAQ rose 1.16%. 10-year yield rose 0.008 to 4.319.
From Exit Hopes to Escalation: Trump Address Raises Risk of Brent Break Above $120–125
Oil is back near $110—and the risk is now higher. Trump’s escalation signals have shifted markets sharply, with Brent potentially breaking above $120–125 as supply fears surge. Read more.
AUD/USD Daily Report
Daily Pivots: (S1) 0.6895; (P) 0.6930; (R1) 0.6964; More...
AUD/USD's recovery stalled at 0.6962 and reversed. But downside is contained above 0.6832 temporary low. Intraday bias remains neutral. first. Below 0.6832 will extend the decline from 0.7187 to 38.2% retracement of 0.5913 to 0.7187 at 0.6700. However, firm break of 0.6978 will argue that the correction has completed, and bring retest of 0.7817 high.
In the bigger picture, as long as 0.6706 cluster support holds, rise from 0.5913 (2024 low) should still be in progress. Decisive break of 61.8% retracement of 0.8006 to 0.5913 at 0.7206 will solidify the case that it's already reversing the down trend from 0.8006 (2021 high). However, firm break of 0.6706 will dampen this bullish case, and bring deeper fall back to 0.6420 support, and possibly below.
Chart Alert: Risk Off After Trump’s Speech – Intraday Outlook on S&P 500, Nasdaq 100, AUD/USD, Gold (XAU/USD), and...
Key takeaways
- Risk-off sentiment returns: Trump’s hawkish rhetoric on Iran dashed de-escalation hopes, reigniting stagflation concerns and triggering a broad risk-off move, equities, AUD/USD, and Asian markets fell, while oil surged and the US dollar strengthened.
- Equities and risk assets remain under pressure: S&P 500, Nasdaq 100, and AUD/USD show renewed bearish momentum after failed rebounds, with technical setups pointing to further downside unless key resistance levels are reclaimed.
- Divergence in commodities: WTI crude oil remains supported in a bullish uptrend above key levels, while gold’s recent rally appears corrective, with risks of a bearish breakdown as momentum weakens.
US President Trump’s evening prime-time speech on Wednesday, 1 April at 9.00 p.m. Washington time does not offer any new information to global financial markets. A quick recap: Trump highlighted earlier on Tuesday, March 31, that the US-Iran war will “end soon” within the next two to three weeks.
Interestingly, Trump has indirectly issued a more “hawkish rhetoric” towards the Iranian leadership in his prime-time national address, stating that the US will hit Iran “extremely hard” in the next two to three weeks, and added that the US will also strike Iran’s electric plants if there is no deal.
Overall, there is no clear indication of a forthcoming “de-escalation” from Trump, which in turn brings the stagflation risk narrative back to the forefront again.
How do the markets react? Risk-off mode at this time of writing.
- WTI crude oil +5.8% at around $104 per barrel
- Brent crude oil +6.4% at around $106 per barrel
- US Dollar Index +0.4%
- AUD/USD -0.6%
- Gold (XAU/USD) -1.7%
- S&P 500 & Nasdaq 100 E-mini futures -1.1% & -1.3%
- Japan’s Nikkei 225 -2.2%
- Hong Kong’s Hang Seng Index -1.1%
- China’s CSI 300 -0.7%
- South Korea’s KOSPI 200 -4.7%
- Singapore’s Straits Times Index -0.7%
We have highlighted in our earlier detailed report that the prior three-day rebound seen on the three major benchmark US stock indices, S&P 500, Nasdaq 100, and Dow Jones Industrial Average are likely a mean reversion rebound sequence (dead cat bounces) within their respective medium-term downtrend phases.
Let’s focus now on the short-term trajectory (1 to 3 days) on the S&P 500, Nasdaq 100, AUD/USD, Gold (XAU/USD), and WTI crude oil from a technical analysis perspective.
S&P 500 - Bearish reaction at descending channel resistance with bearish momentum
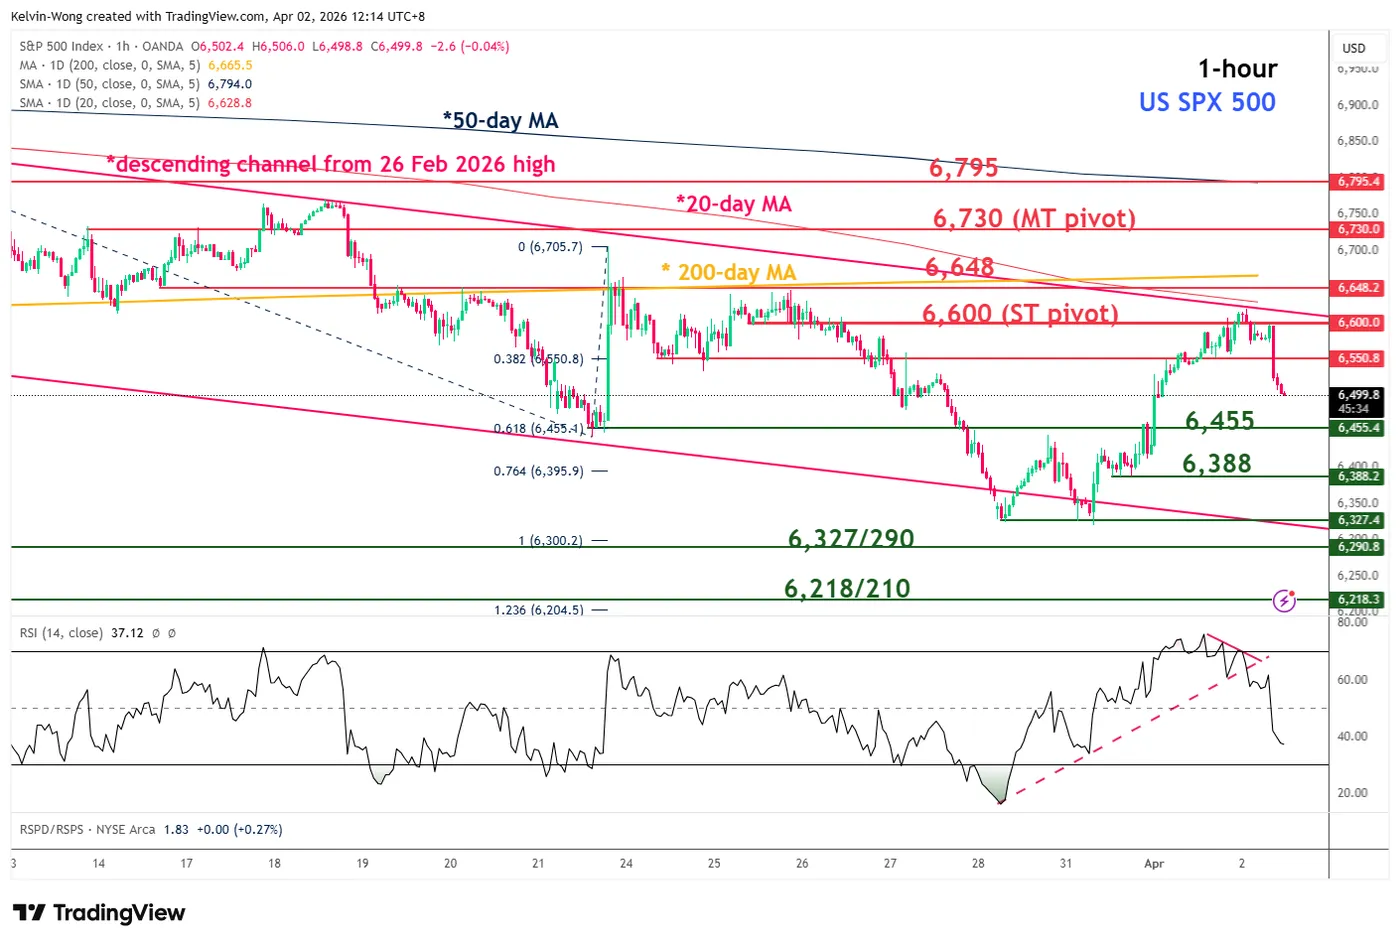
Fig. 1: US S&P 500 CFD index minor trend as of 2 Apr 2026 (Source: TradingView)
The price actions of the US S&P 500 CFD index (a proxy of the S&P 500 E-mini futures) have staged a bearish reaction right after a retest on its 20-day moving average and upper boundary of a descending channel in place since 26 February 2026 high (see Fig. 1).
In addition, the hourly RSI momentum indicator has staged a bearish breakdown below its former ascending trendline support after it flashed a bearish divergence condition at its overbought zone.
Watch the 6,600 key short-term pivotal resistance, and a break below 6,455 near-term support is likely to trigger another potential bearish impulsive down move sequence to expose the next intermediate supports at 6,327/6,290 and 6,218/6,210.
However, a clearance above 6,600 invalidates the near-term bearish scenario for an extension of the mean reversion rebound towards 6,648/6,730 zone.
Nasdaq 100 – Bearish reaction below 20-day moving average with bearish momentum
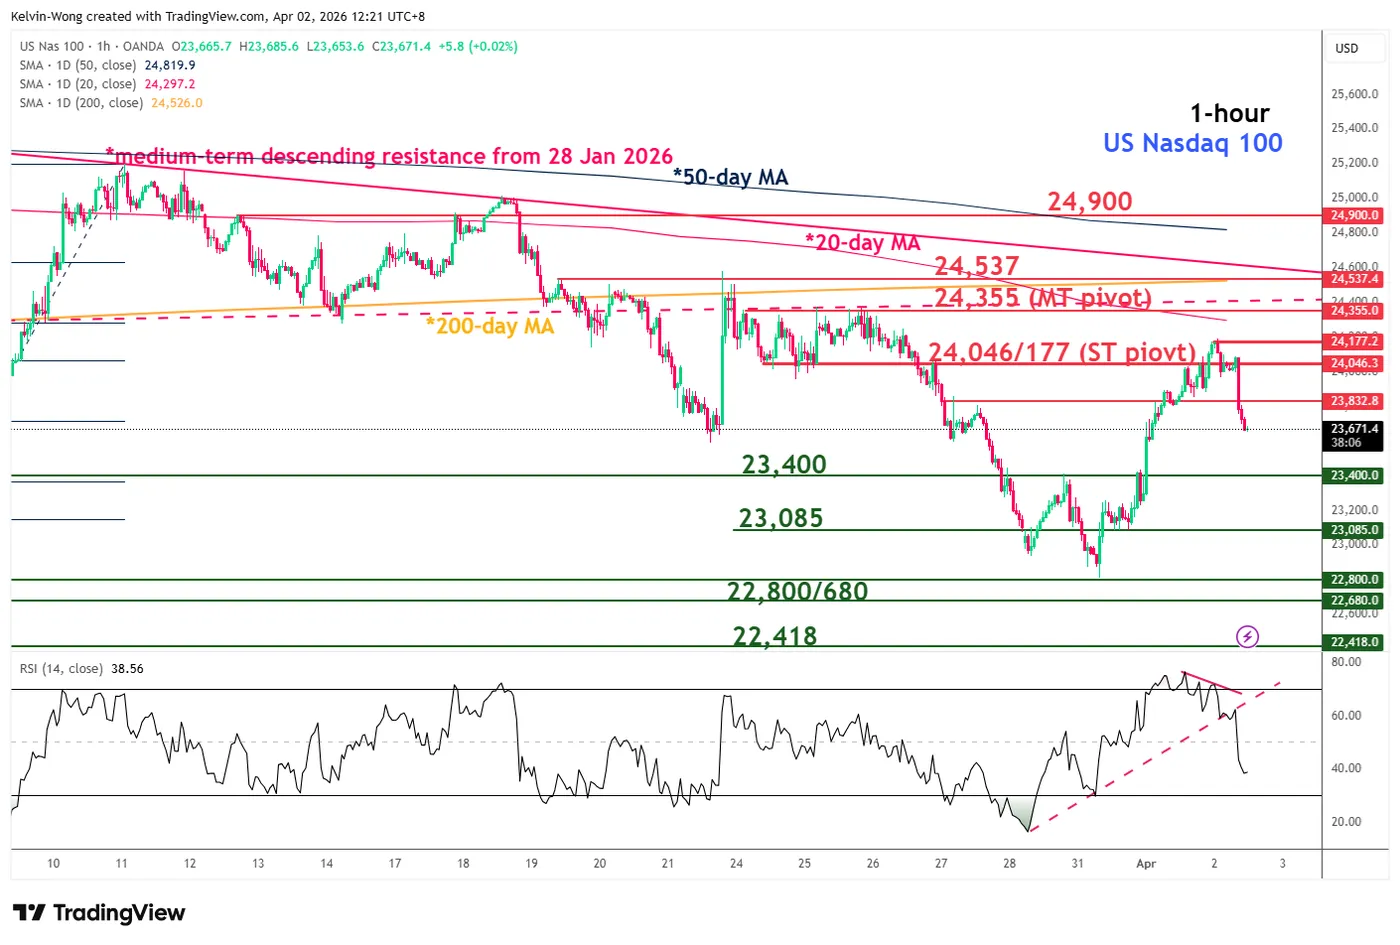
Fig. 2: US Nasdaq 100 CFD index minor trend as of 2 Apr 2026 (Source: TradingView)
The price actions of the US Nasdaq 100 CFD index (a proxy of the Nasdaq 100 E-mini futures) have staged a bearish reaction below its downward-sloping 20-day moving average, coupled with the hourly RSI momentum indicator’s bearish breakdown below its key ascending trendline support (see Fig. 2).
Watch the 24,047/24,177 key short-term pivotal resistance, and a break below 23,400 near-term support is likely to trigger another potential bearish impulsive down move sequence to expose the next intermediate supports at 23,085 and 22,800/22,680.
On the other hand, a clearance above 24,177 invalidates the near-term bearish scenario for an extension of the mean reversion rebound towards the 24,355/24,537 zone.
AUD/USD – En route towards the lower limit of the descending channel
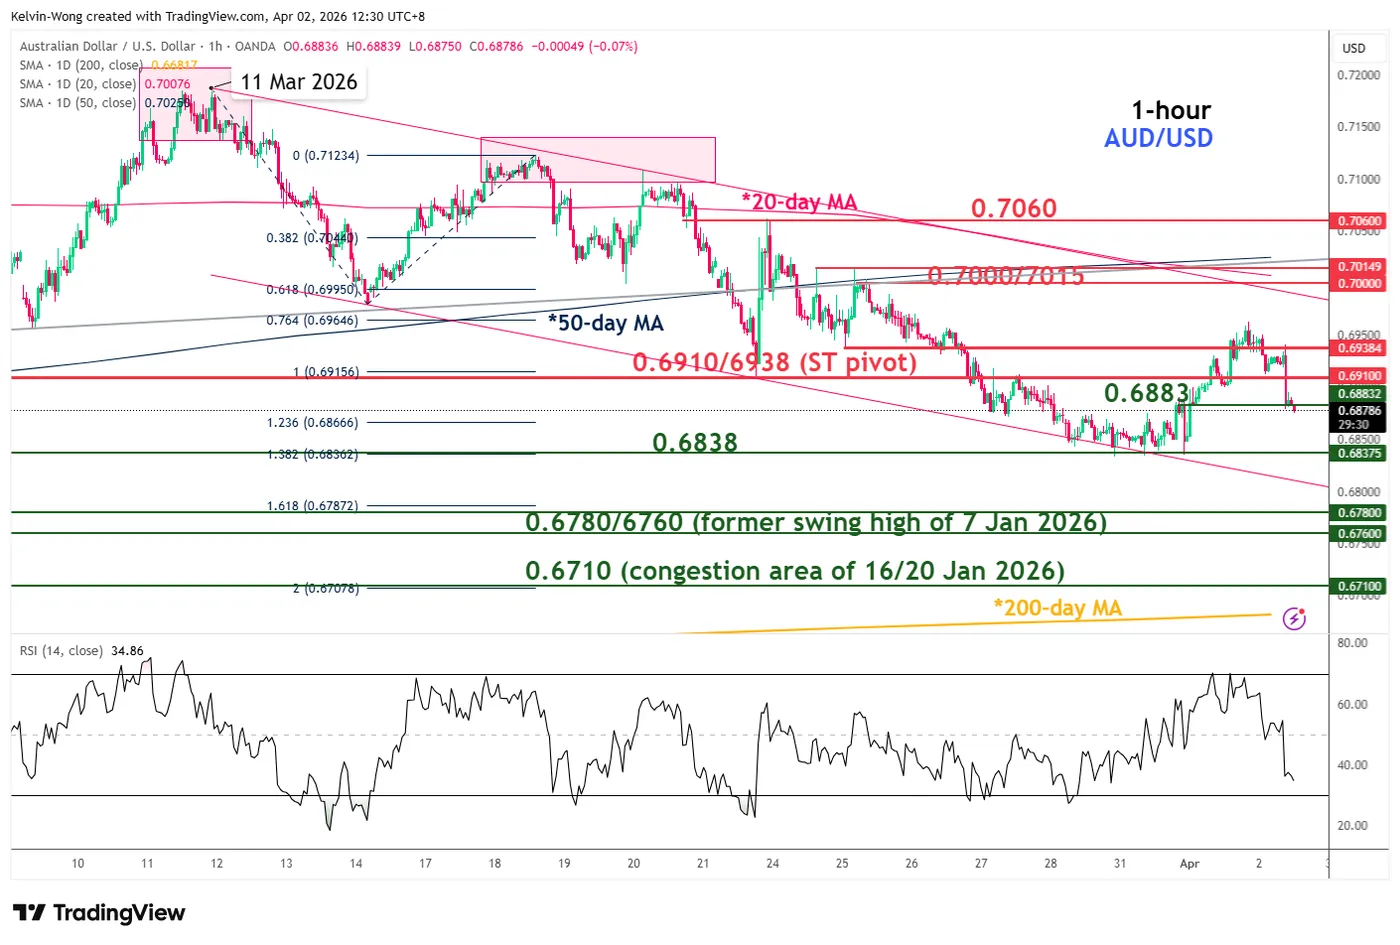
Fig. 3: AUD/USD minor trend as of 2 Apr 2026 (Source: TradingView)
The minor corrective mean reversion rebound seen on the AUD/USD from its swing low of 0.6838 printed on Monday, 30 March 2026, is likely to be over (see Fig. 3).
Watch the 0.6910/0.6938 key short-term pivotal resistance, and a break below 0.6838 is likely to trigger a potential fresh bearish impulsive down move sequence to expose the next intermediate supports at 0.6780/0.6760 and 0.6710 (also close to the key 200-day moving average).
However, a clearance above 0.6938 invalidates the near-term bearish scenario for an extension of the mean reversion rebound towards the next intermediate resistance at 0.7000/0.7015 (also the 50-day moving average).
Gold (XAU/USD) – At risk of a “bearish flag” breakdown below $4,775 key resistance
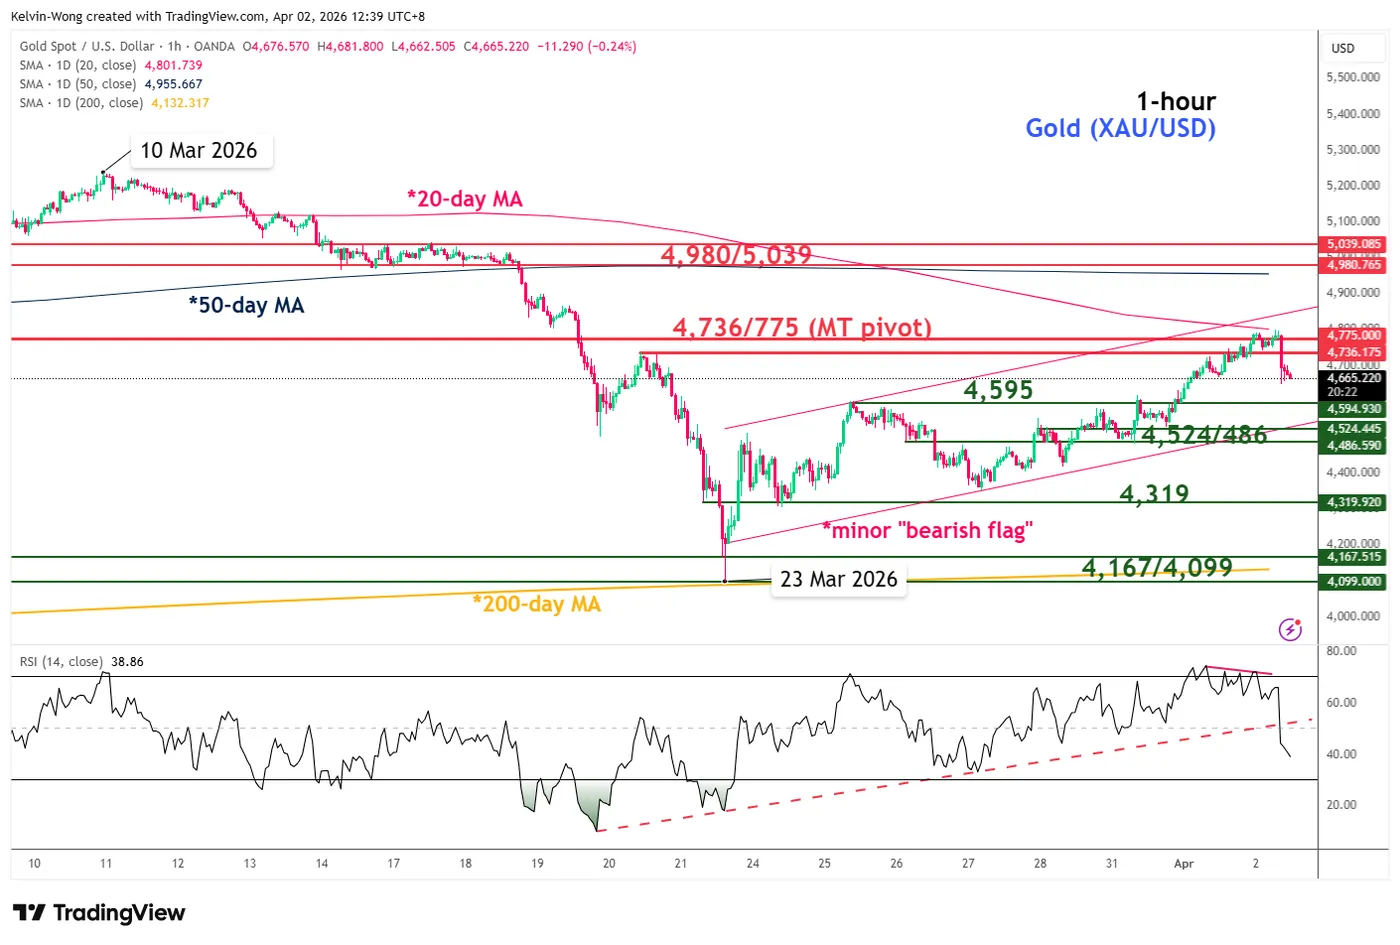
Fig. 4: Gold (XAU/USD) minor trend as of 2 Apr 2026 (Source: TradingView)
The recent seven-day rally (high to low) of 17% from the 23 March 2026 low seen in Gold (XAU/USD) is likely to be a corrective mean reversion rebound in the form of a “bearish flag” within its medium-term downtrend phase (see Fig. 4).
The bullish momentum of the 7-day rally is getting exhausted. The hourly RSI momentum indicator has just staged a bearish breakdown below its key ascending trendline support after a prior bearish divergence condition at its overbought zone
Watch the $4,775 key medium-term pivotal resistance, and a break below $4,524/4,486 support (the lower boundary of the “bearish flag”) is likely to trigger another potential minor bearish impulsive down move sequence in the first step to expose the next intermediate supports at $4,319 and $4,167/4,099 (also the key 200-day moving average).
On the flip side, a clearance above $4,775 invalidates the near-term bearish scenario for an extension of the mean reversion rebound towards the next intermediate resistance at $4,980/5,039 (also the 50-day moving average).
WTI crude oil – Bulls find support above 20-day moving average, traded back above $102.25
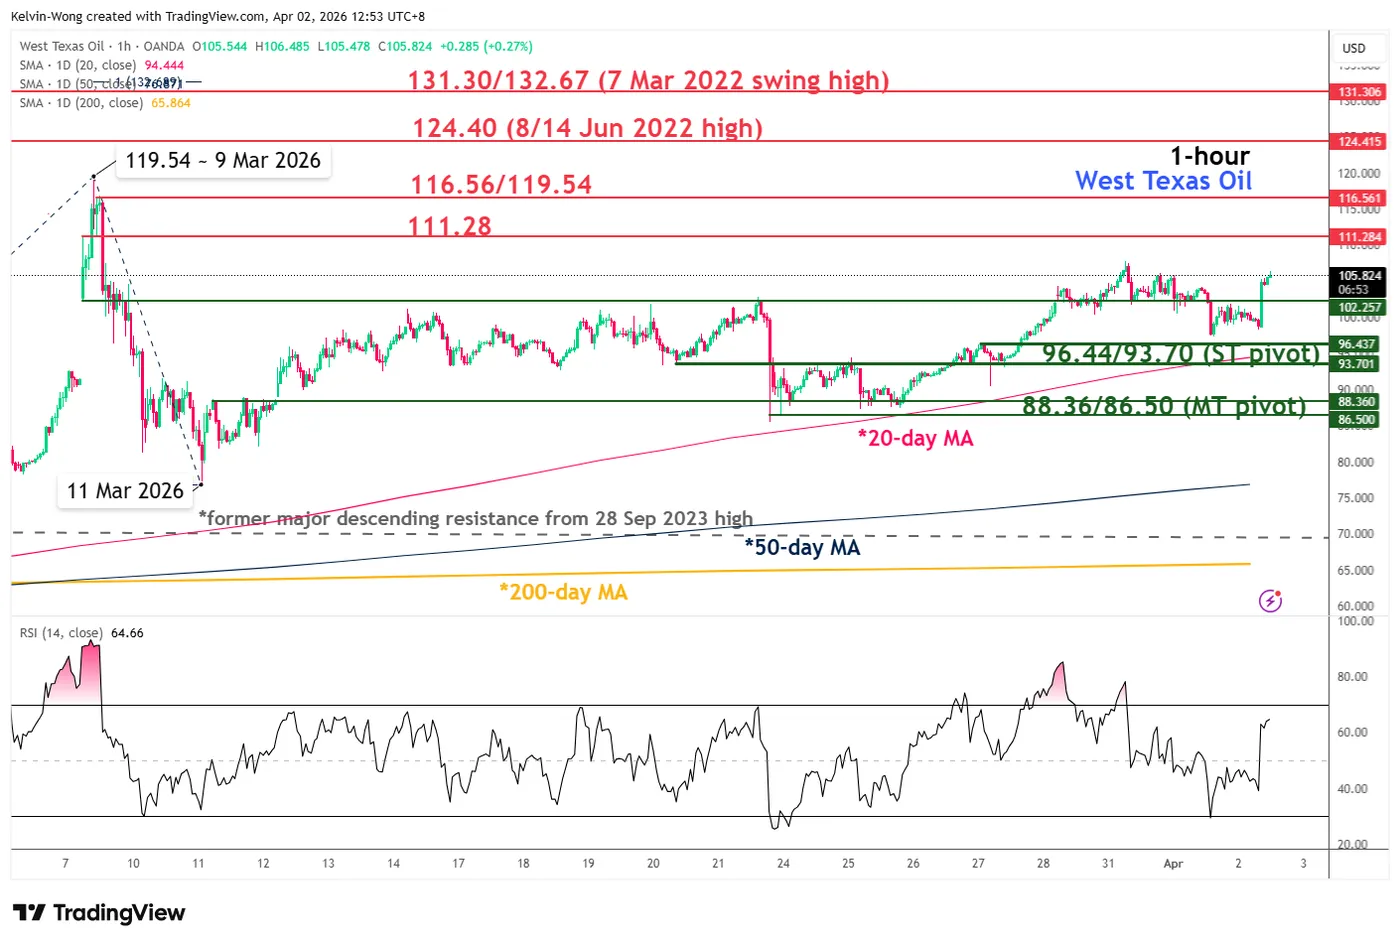
Fig. 5: West Texas oil CFD minor trend as of 2 Apr 2026 (Source: TradingView)
The intraday sell-off seen on Wednesday, 1 April 2026, for West Texas oil CFD (a proxy of the WTI crude oil futures) has been erased as its price actions trade back above $102.25 (see Fig. 5).
Watch the $96.44/93.70 key short-term pivotal support (close to the 20-day moving average) to maintain a potential fresh minor impulsive up move sequence towards $116.56/119.54 in the first step within its medium-term uptrend phase.
A clearance above $116.56/119.54 opens scope for the next intermediate resistance to come in at $124.40 follow by the major resistance of $131.30/132.67, seen during the onset of the Russia-Ukraine war.
On the other hand, a break below $93.70 negates the bullish tone for a slide towards the medium-term pivotal support zone of $88.36/86.50.
From Exit Hopes to Escalation: Trump Address Raises Risk of Brent Break Above $120–125
Instead of confirming a near-term exit from the Iran War, US President Donald Trump’s address has triggered a sharp repricing of war risk, with markets shifting from de-escalation expectations to renewed escalation. Hopes for any diplomatic resolutions were dashed. Brent oil price surged back toward $110, and risks are now skewed toward a further move through $120 to $125.
The key shift lies in Trump’s explicit commitment to further military action. While he noted progress toward US objectives, his statement that forces will “hit them extremely hard over the next two to three weeks” signals a clear intensification phase. This two-to-three-week escalation window effectively delays any prospect of stabilization. The Strait of Hormuz will remain closed for at least that duration.
The most alarming element came from Trump’s “bring them back to the Stone Ages” remark. This "scorched-earth" rhetoric implies a shift from targeted military operations toward broader infrastructure destruction, including strikes on energy facilities, power grids, and logistics networks. Such a strategy significantly raises the risk of collateral damage across the region.
This escalation risk extends beyond Iran itself. If infrastructure is heavily targeted, the probability increases that Iran could retaliate against regional oil assets in Saudi Arabia or the UAE. That scenario would transform the conflict into a wider supply shock, which explains why oil reacted so quickly and aggressively. More importantly, it eliminates the hope of a diplomatic de-escalation in the near term
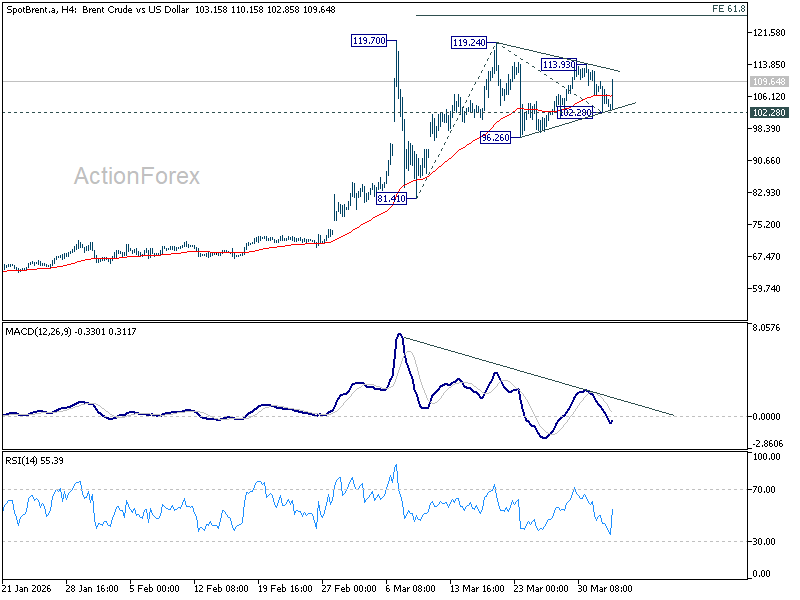
Technically, Brent oil's strong rebound raises the chance that consolidation pattern from 119.24 has completed with three waves to 102.28. Risk will stay on the upside as long as 102.28 holds. Firm break of 113.93 will argue that the whole rise from 81.41 is ready to resume. In this case, 120 psychological level will likely be breached, at least briefly, as Brent targets 61.8% projection of 81.41 to 119.24 from 102.28 at 125.65.
AUD/USD Climbs Toward 0.7000, Hurdles Could Cap Gains
Key Highlights
- AUD/USD started a recovery wave above 0.6880 and 0.6920.
- A major bearish trend line is forming with resistance at 0.6980 on the 4-hour chart.
- Bitcoin recovered above $68,000 but faced sellers near $70,000.
- WTI Crude Oil prices tested $106 before correcting some gains.
AUD/USD Technical Analysis
The Aussie Dollar found support near 0.6835 against the US Dollar. AUD/USD formed a base and started a recovery wave above 0.6880.
Looking at the 4-hour chart, the pair surpassed the 23.6% Fib retracement level of the downward move from the 0.7187 swing high to the 0.6833 low. However, the pair is still well below 0.7000, the 100 simple moving average (red, 4-hour), and the 200 simple moving average (green, 4-hour).
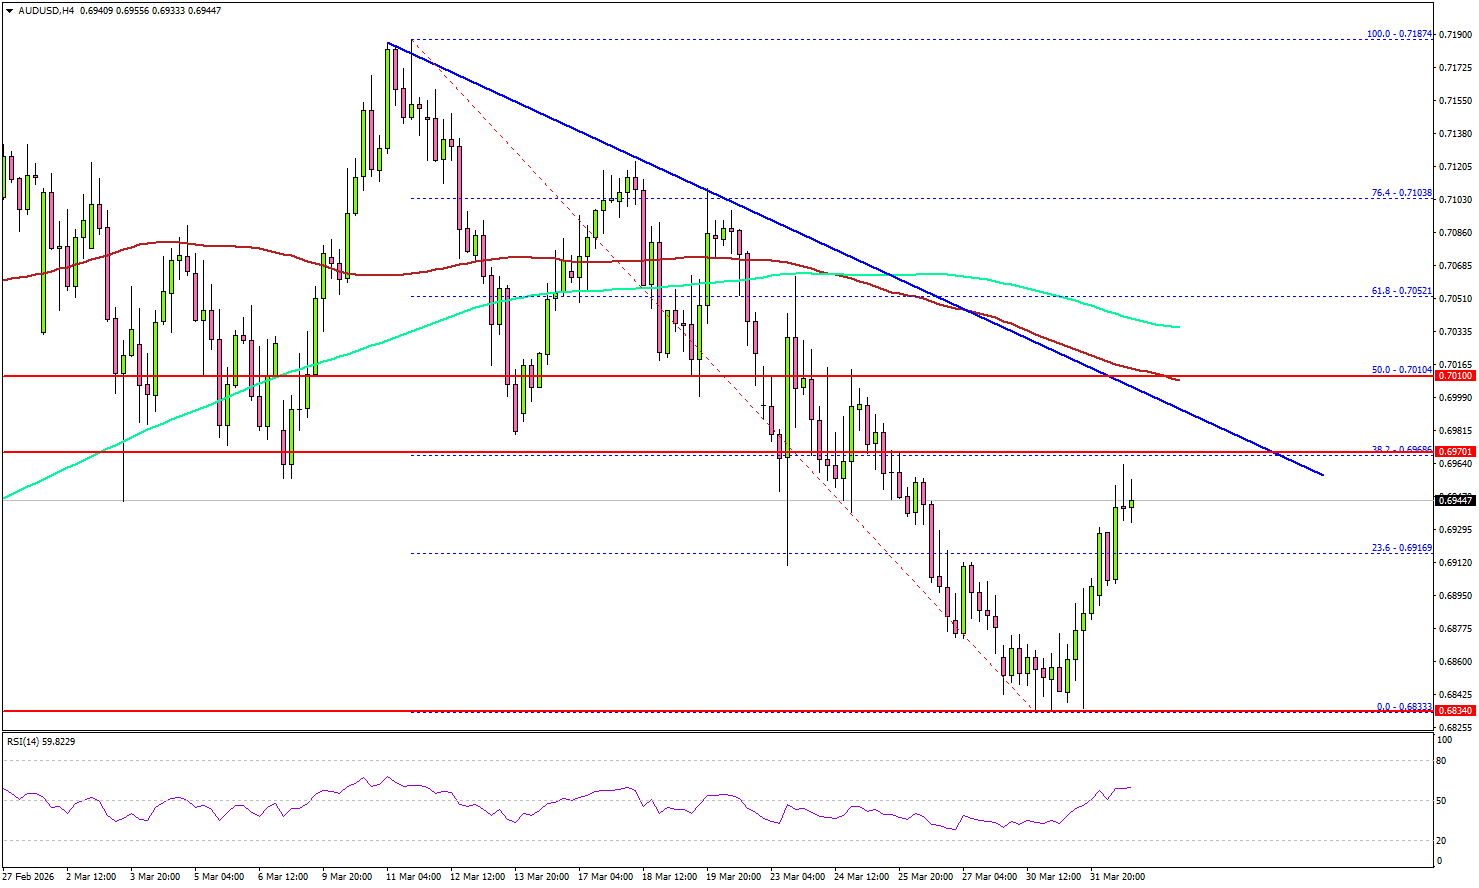
On the upside, the pair is now facing sellers near 0.6965. The first major resistance sits at 0.6980. There is also a major bearish trend line forming with resistance at 0.6980.
The main resistance could be 0.7000 and the 50% Fib retracement level of the downward move from the 0.7187 swing high to the 0.6833 low. A close above 0.7000 could open the doors for gains above 0.7050. In the stated case, the bulls could aim for a move to 0.7120.
Immediate support is seen near 0.6910. The first key support sits at 0.6880. A close below 0.6880 might call for heavy losses. In the stated case, it could even revisit 0.6800 in the coming days.
Looking at Oil, the price failed to stay above $105 and recently started a downside correction toward the $98 support.
Upcoming Key Economic Events:
- US Initial Jobless Claims - Forecast 212K, versus 210K previous.
- US Goods and Services Trade Balance for Feb 2026 - Forecast $-59.2B, versus $-54.5B previous.
Cliff Notes: Mixed Messages
Key insights from the week that was.
At the turn of the week, Chief Economist Luci Ellis and Westpac Economics highlighted how severe the inflationary impact is expected to be for Australia. Recognising the extreme uncertainty surrounding the conflict and the passage of time, we extended our baseline supply assumption from a one to two-month complete shutdown of the Strait of Hormuz followed by a protracted recovery in transit from 20% of pre-conflict supply in May to normal supply at year end. Also, a consequence of elevated refining margins globally, annual Australian consumer inflation is now expected to peak around 6%yr in mid-Q2. While headline inflation will fall back to target over the following year, trimmed mean inflation is forecast to remain above 3.0%yr until end-2027 and only settle in the middle of the target range in late-2028, having peaked at 4.0%yr at end-2026.
With Australia already experiencing tight capacity and elevated domestic inflation pressures, attested to again by the RBA in the March Monetary Policy Board meeting minutes, the Middle East conflict warrants pre-emptive action by the RBA through three 25bp cash rate hikes in May, June and August 2026 to 4.85%. Policy is then seen on hold until 2028, when success with inflation should allow the cash rate to be reduced by 100bps steadily through the year. The consequence for GDP is likely to be a deceleration to just 1.0%yr in 2026, followed by a sub-par 1.6%yr gain in 2027, then an above-trend 2.8%yr recovery in 2028. The unemployment rate is forecast to rise to 5.0% at end-2026, and to take until end-2028 to return to its full employment level, circa 4.5%.
To the above forecasts, time matters a great deal. If, as has been mooted in recent days (and may be confirmed in a Presidential address later today), the Trump administration calls a quick end to the US’ strikes against Iran, Australian GDP and the labour market may receive a reprieve. That said, heightened inflation will remain an acute risk while transit and supply-chain disruptions persist, and businesses may also take the opportunity to re-set margins. The balance between inflation and activity risks will therefore remain in focus for the RBA over the coming year. Ahead of the Federal Budget, the Government’s financial position is also in flux, although current conditions look more likely to prove a positive than negative at this stage.
Local data out this week meanwhile focused on housing. Cotality home values increased a solid 0.6% in March. Although affordability saw a divergence in conditions city by city, with prices down a touch in Sydney and Melbourne as strong growth continued in Brisbane, Adelaide and Perth. Where conditions are weakest, reduced turnover is holding prices up. Dwelling approvals remained volatile in February, a 29.7% monthly gain lifting the annual growth rate to 14%yr. Australia clearly has need for significant, sustained additions to housing supply across our major cities, but affordability and the cost of construction are material risks which are likely to persist into the medium term.
Offshore, the list of data worthy of mention was short this week. University of Michigan consumer sentiment was, unsurprisingly, weak in March, 19% below the 5-year average and 37% under the full-history benchmark. The Conference Board’s measure showed greater resilience but was still weak versus history. That said, ADP private payrolls continued to grow in March, and the retail sales control group recorded a solid gain of 0.5%mth. The ISM manufacturing index for March was also favourable, although the survey only caught the beginning of disruptions related to the Middle East conflict and the detail was also mixed, with production up, new orders down and employment contracting. China’s official PMIs emphasised the nation’s ability to weather uncertainty, with both the manufacturing and services indexes higher in March.
The key international data release for the week is still to come on Friday night. The US March employment report will be closely scrutinised after February’s weak detail reset participants current understanding and expectations for the labour market. US policy makers have been more focused on inflation risks in recent weeks, but another poor employment result could see them reconsider this view. In contrast, a rebound in job creation will likely see market pricing for near-term policy decisions shift materially in favour of a hike, or two, as has been the case elsewhere across the developed world.
USD/JPY Faces Major Technical Pressure from Bearish RSI Divergence – In-Depth FX Analysis
USD/JPY is one of the most reactive pairs to broader geopolitical movements and technical patterns, remaining one of the most favored major currency pairs in FX trading.
But in recent years, it has certainly played tricks on traders. Tending to move lower on rate cuts, the irregular FOMC cycle hasn't seen typical responses in the pair – After all, even the Bank of Japan is going through its own irregular hike cycle to levels not seen in 18 years.
The Yen is also a favored safe-haven currency in periods of turmoil. While the US Dollar also plays a similar role, this time the Japanese currency could not even withstand the pressure: During the US-Iran conflict, Japan spiked to April 2024 highs (~160.47).
Japan is a major importer of energy commodities, with close to 95% of its demand reliant on Middle Eastern exports. Despite having the largest emergency oil reserves among OECD nations, the country still faces immense pressure due to the lack of movement in the infamous Strait of Hormuz.
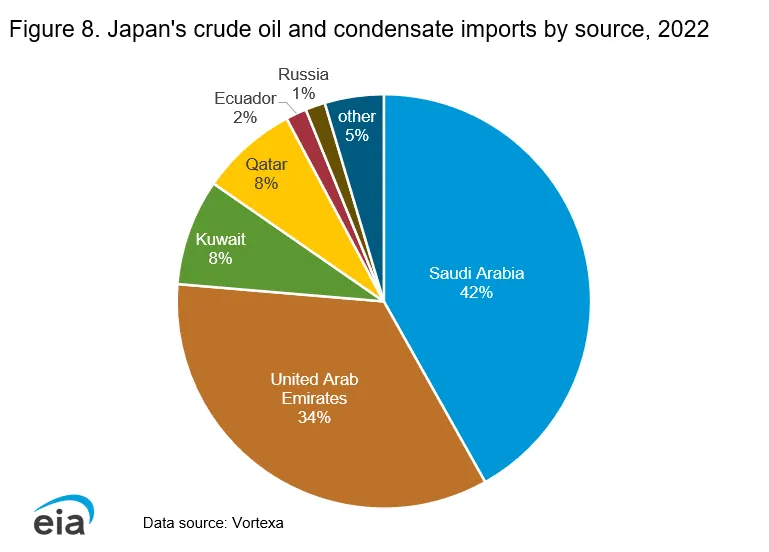
Japan's Major Energy Partners – Source: EIA
Due to this elevated dependency, JPY's pre-existing weakness quickly magnified as Japan's main hedgers and importers faced physical barriers to meeting their high demand – having to convert to the US Dollar to purchase Oil commodities, the rise in USD/JPY was nothing short of a self-fulfilling prophecy.
So what about now? With the war priced to come to an end in the next few weeks, narrative once again confirmed by President Trump in his many addresses, the US Dollar is itself finding heavy selling pressure, with the Dollar Index forming a major double top ; The Japanese Yen could be a major gainer from such a pattern.
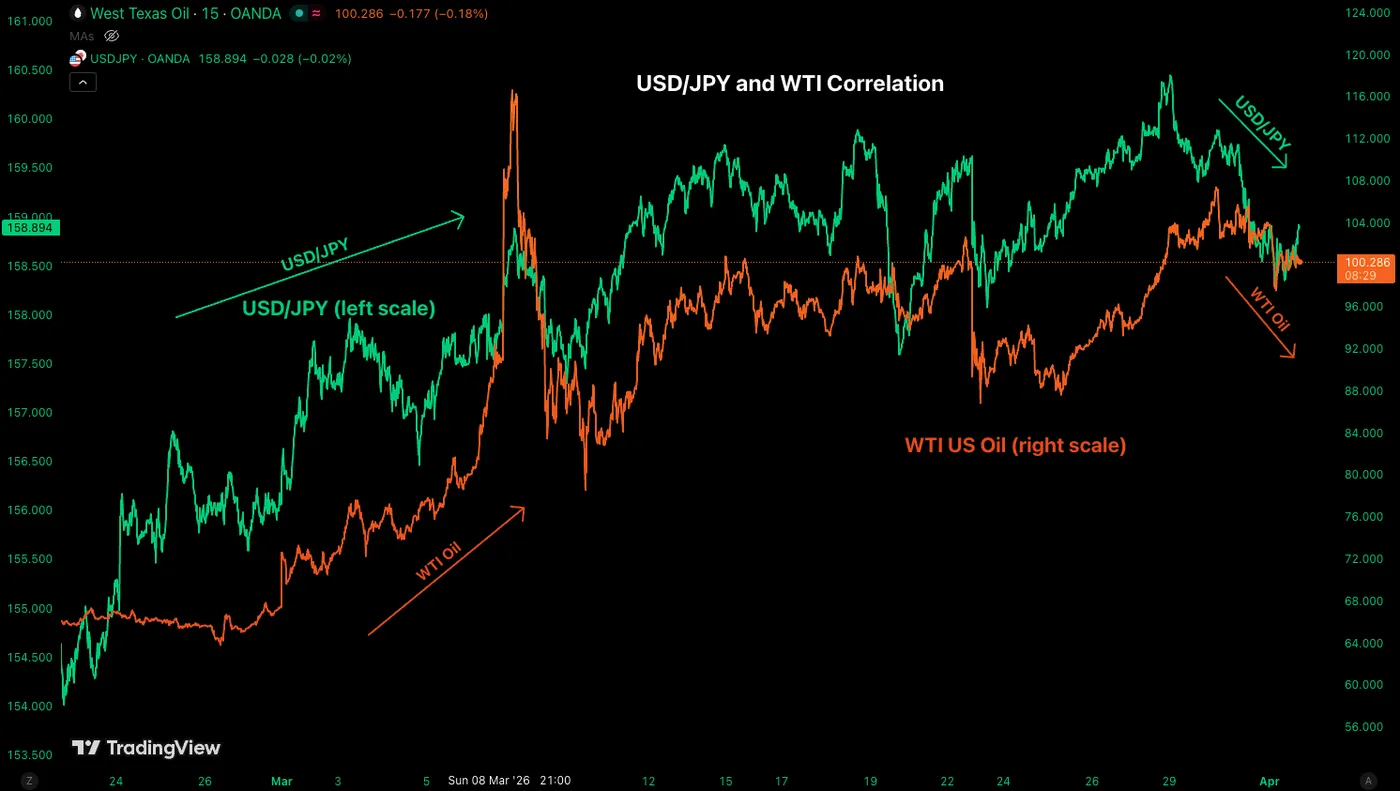
USD/JPY and WTI Correlation. April 1, 2026 – Source: TradingView
Despite Japan’s core inflation slightly easing, price pressures from war put the BoJ on the center stage for an imminent hike. The issue is that things won't be so easy.
With recent Bank of Japan uncertainty, including two key BoJ members concluding their terms in coming months, the Yen's safety could face further volatility amid a lack of further tightening.
Keep a close eye on Bank of Japan communications to spot if a decisive rate hike could occur at the next meeting.
The Rate decision will take place on April 28th and is currently priced for about 60% of a hike to 1%.
Let's dive right into a multi-timeframe analysis for the Gopher – more commonly named, USD/JPY.
USD/JPY Multi-Timeframe Analysis
Daily Chart
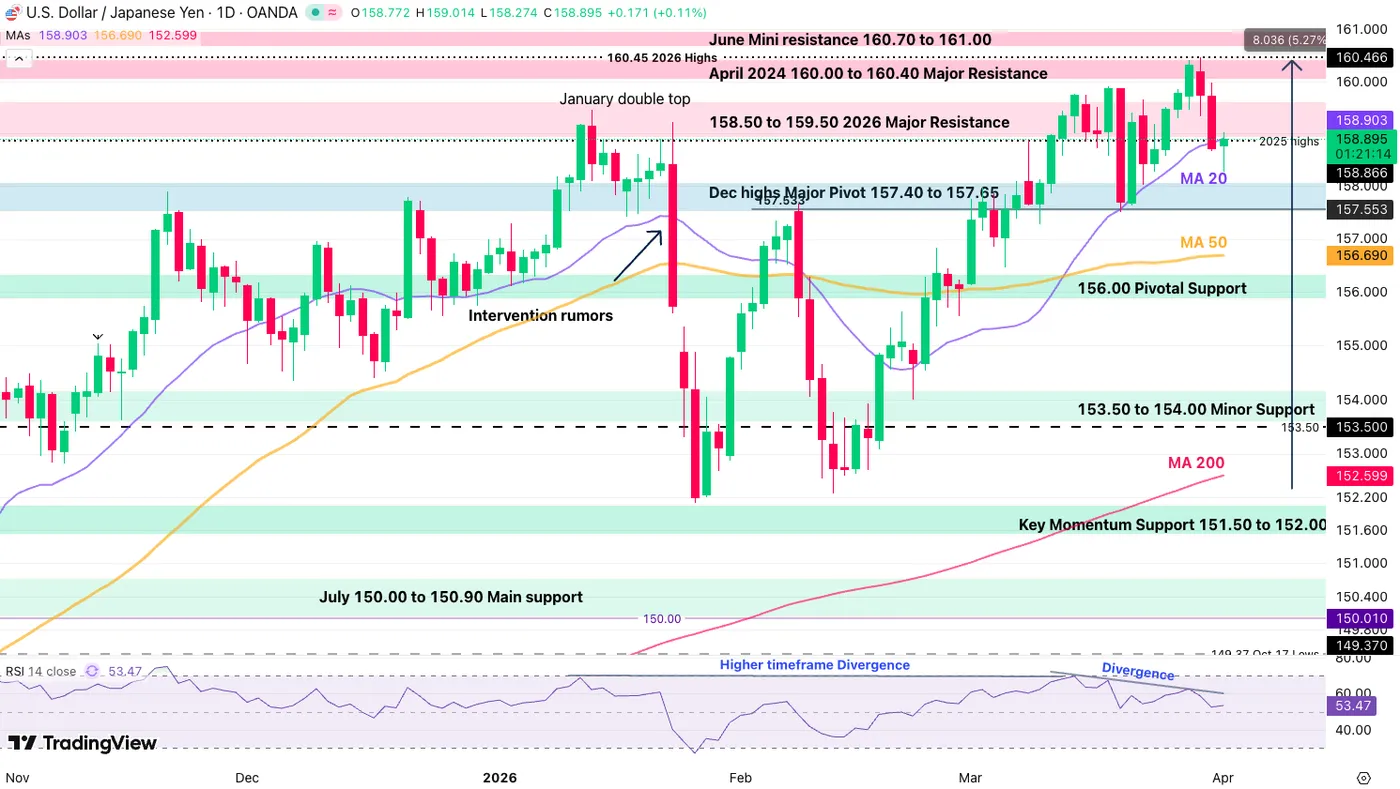
USD/JPY Daily Chart. April 1, 2026 – Source: TradingView
USD/JPY recently bounced to April 2024 highs during a mid-March Crude Oil spike, but has failed to hold its prior highs.
Now tumbling right below its 20-Day Moving Average (158.90), the currency pair has formed a failed-breakout; Accompanied by two daily bearish divergences of different magnitudes, its outlook is not turning bearish on the short-term.
To confirm, bears will want to see a break below 157.553, recent pullback lows.
Let's take a closer look.
4H Chart and Technical Levels
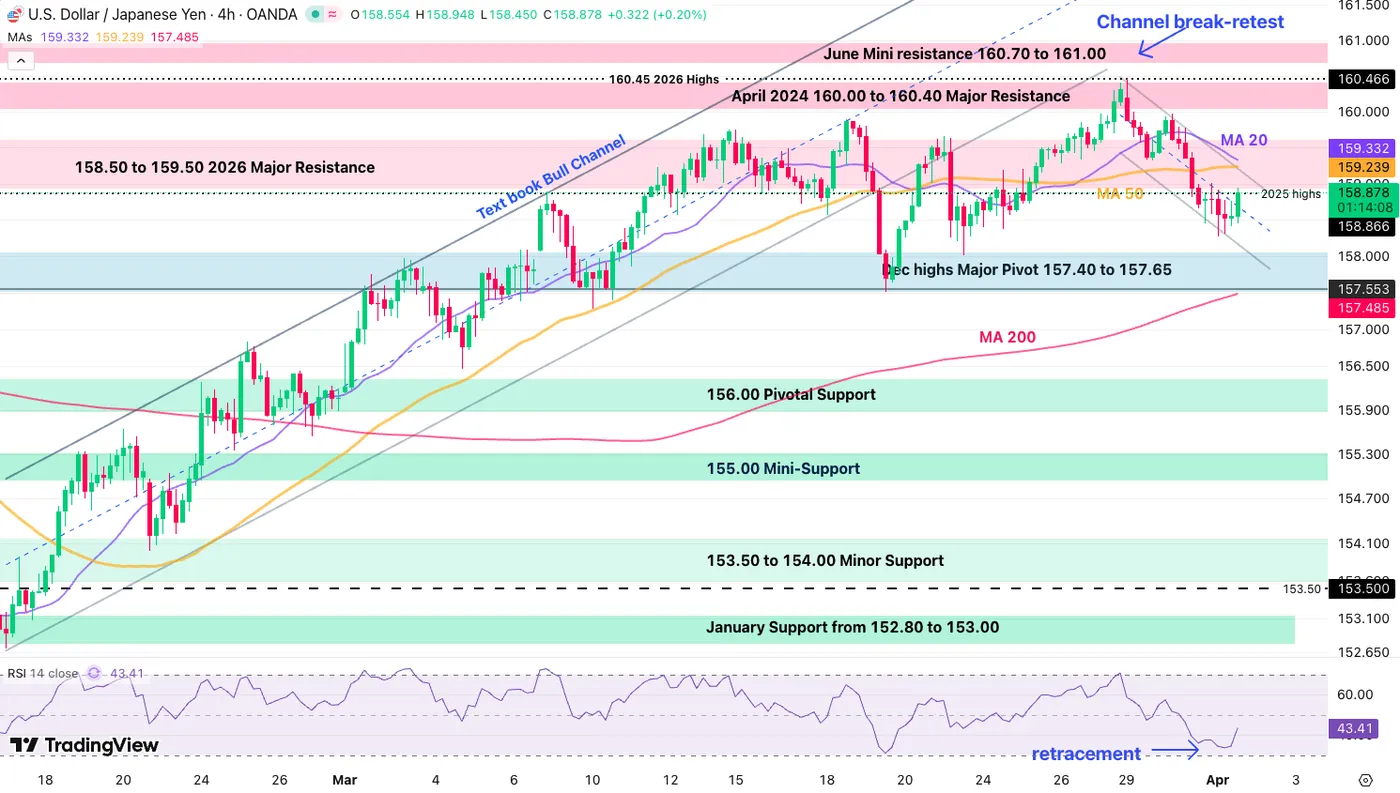
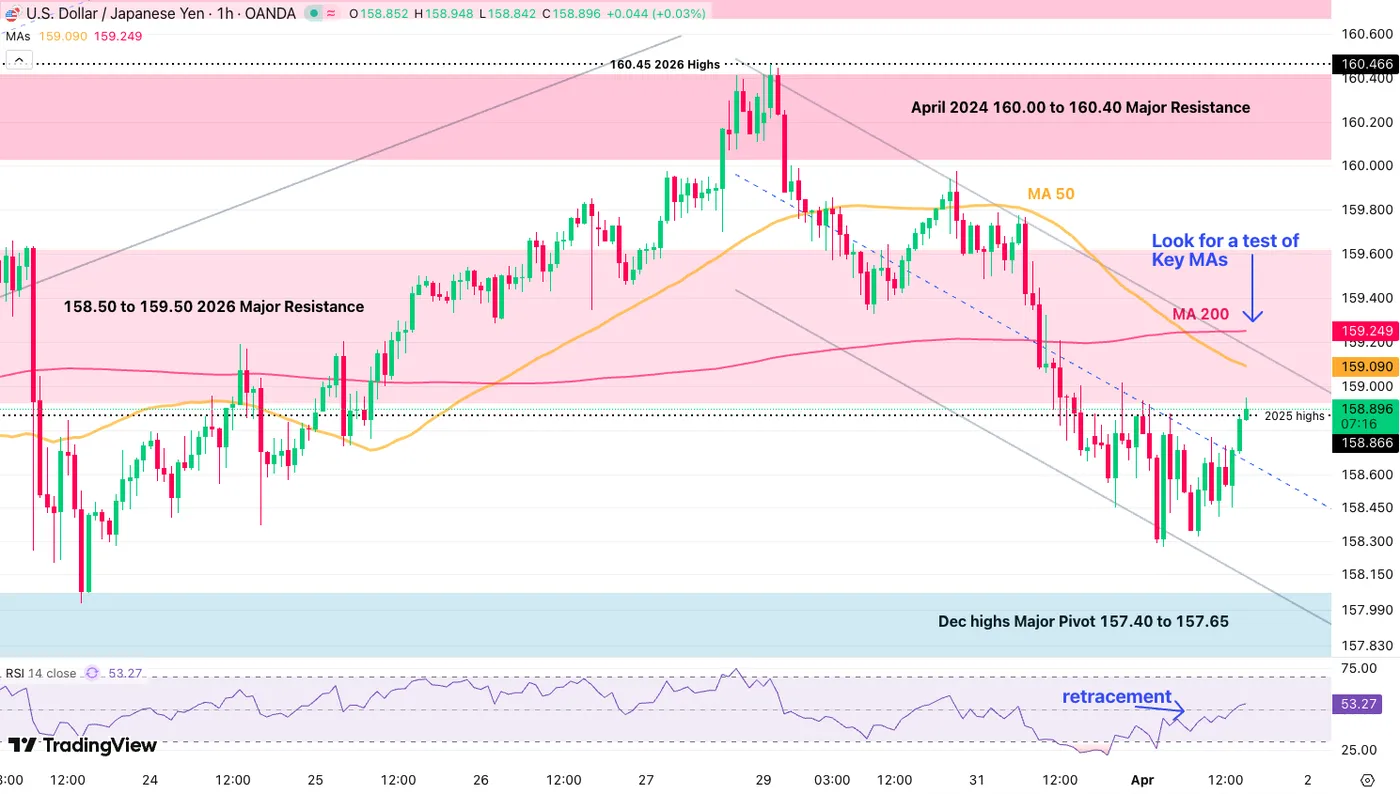
USD/JPY 4H Chart. April 1, 2026 – Source: TradingView
USD/JPY has entered a corrective phase after the initial Monday spike, now evolving in a short-term bear channel after breakout out of its higher timeframe Bull trend.
Any test of its 4H 20 and 50-MA could provide interesting points for entries on pullbacks if prices get there (159.24).
Resistance levels
- 4H 50-period MA 159.240
- 158.50 to 159.50 2026 Major Resistance
- April 2024 160.00 to 160.40 Major Resistance
- June Mini resistance 160.70 to 161.00
Support levels
- December highs Major Pivot 157.40 to 157.85
- 156.485 4H 200-period MA (bearish below)
- 156.00 Pivotal Support
- 155.00 Mini-Support
1H Chart
USD/JPY 1H Chart. April 1, 2026 – Source: TradingView
USD/JPY has attacked its pullback higher, shortly testing the upper bound of its intraday downward channel.
159.00 is a key area of pressure, hence any rejection in the US Dollar could be reflected in an inability to continue higher – In such occasions, two different trades are possible
- Sell on limit at the 200-Hour MA (~159.24)
- Sell stop below 158.60 on small size, with further continuation needed to confirm the trade
- Any break above 159.60 and daily close above would invalidate the reversal patterns.
Safe Trades!
Bitcoin Snaps 5-Month Losing Streak: Institutional Inflows & Trendline Break Fuel $80k Outlook
- Bitcoin (BTC/USD) has started the new quarter with renewed optimism, snapping a five-month losing streak.
- Institutional demand is returning, as Bitcoin spot ETFs recorded over $117 million in inflows on Tuesday, concluding March with $1.32 billion in total inflows and effectively ending a four-month streak of net withdrawals.
- The technical outlook is cautiously optimistic with a sustained daily close above $72,600 being the key confirmation for a fast move toward the $80,000.
Bitcoin (BTC/USD) has kickstarted the new quarter with a renewed sense of optimism, snapping a grueling five-month losing streak, its longest since 2018. After a bearish start to the week, the premier cryptocurrency has caught a bid in early Wednesday trade, reclaiming the $68,500 handle and teasing a breakout toward psychological resistance at $70,000.
The shift in sentiment is palpable as a combination of institutional re-engagement and a sudden de-escalation in Middle East tensions provides the "risk-on" spark that bulls have been waiting for.
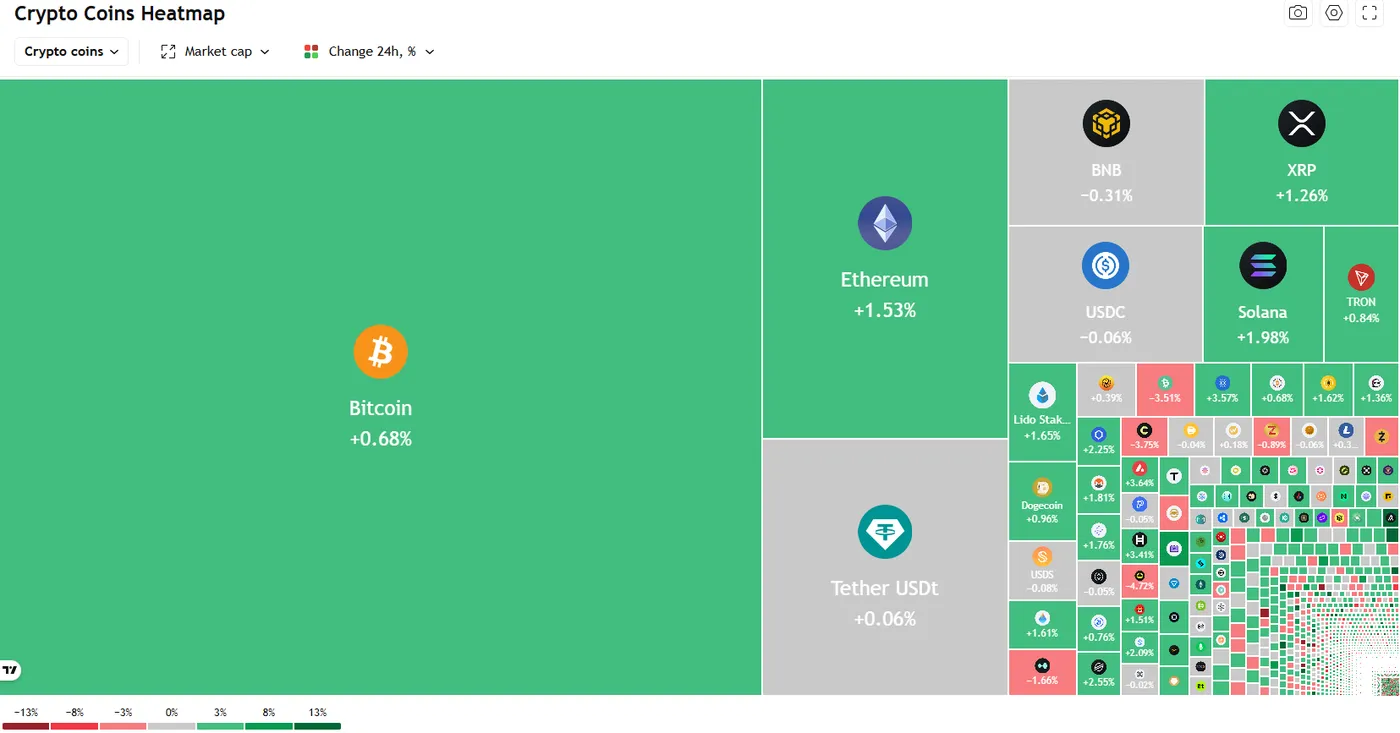
Source: TradingView
Early Trade: Macro Tailwinds and the "Trump Reversal"
The early move today saw Bitcoin briefly touch $69,300, buoyed by headlines suggesting a diplomatic path forward in the US-Iran conflict.
President Trump’s recent signals regarding a limited four-to-six-week military timeline, coupled with conciliatory remarks from Iranian President Masoud Pezeshkian, have allowed markets to price out some of the "war premium" that has weighed on risk assets.
From a fundamental perspective, the "dry spell" in institutional demand appears to be ending. Bitcoin spot ETFs recorded over $117 million in inflows on Tuesday, the second consecutive day of positive growth.
More importantly, March concluded with total ETF inflows of $1.32 billion, effectively ending a four-month streak of net withdrawals. This may be seen as a suggestion that the "smart money" is beginning to view the sub-$70k levels as an attractive entry point for Q2.
The "Strategy" Factor: Saylor’s Accumulation Engine Restarts
A significant driver for this week’s price action is the resurgence of Michael Saylor’s "Strategy" (MSTR) as a primary buyer. With the company's STRC preferred stock trading back above its $100 par value, the window for capital raising has reopened.
Estimates suggest Strategy is positioned to acquire over 1,100 BTC (~$76.25 million) this week alone. Historically, Bitcoin has shown a strong correlation with MSTR’s buying cycles, often rallying significantly when the company’s accumulation engine is in full gear.
The Road Ahead: Momentum vs. History
While the "hopium" is high, we must remain objective. Historical data from CoinGlass shows that while April is typically a "green" month (averaging 12.2% returns), Bitcoin has a habit of reversing its March trend. Since March closed slightly in the green, contrarians might argue for a cautious outlook.
However, if history repeats the 2018/2019 cycle where breaking a multi-month losing streak led to a 300% rally, the current consolidation might just be the launchpad for a historic Q2.
Technical Analysis: A Squeeze Toward $80,000?
Looking at the charts, Bitcoin’s recent bounce from the $60,000 floor, which many now view as a local bottom is technically significant. The pair has successfully retested the lower boundary of a prevailing bear flag pattern and held.
Despite the retreat below $70,000, the technical outlook remains cautiously optimistic rather than bearish. The trendline break on the H4 chart below also reinforces this idea of a move to the upside.
I will be watching the $71,000 level closely; a break here confirms that the bulls are back in the driver's seat with $80,000 firmly in their crosshairs.
Key Levels to Watch:
- Resistance: The immediate hurdle sits in the $69,300 - $71,000 zone. This area is congested with the 50-day EMA and a massive supply zone where roughly 650,000 BTC were previously acquired. A sustained daily close above $72,600 would be the "smoking gun" for bulls, likely triggering a fast move toward $80,000.
- Support: On the downside, the $65,900 level remains pivotal. Should we lose this, the 200-week SMA near $59,400 would be the final line of defense before a deeper correction toward the $50,000 psychological mark.
Bitcoin (BTC/USD) Four-Hour Chart, April 1, 2026
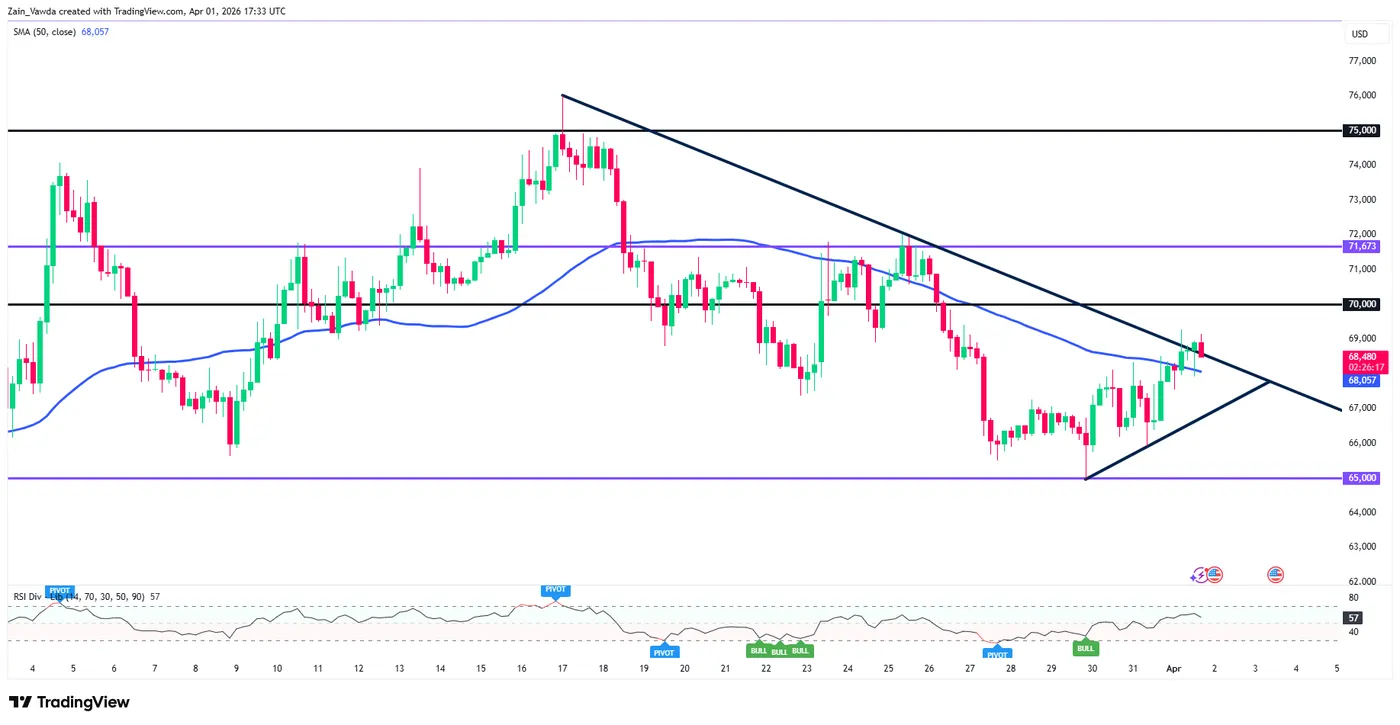
Source: TradingView.com (click to enlarge)