Sample Category Title
S&P 500 Wave Analysis
S&P 500: ⬆️ Buy
- S&P 500 reversed from support zone
- Likely to rise to resistance level 6700.00
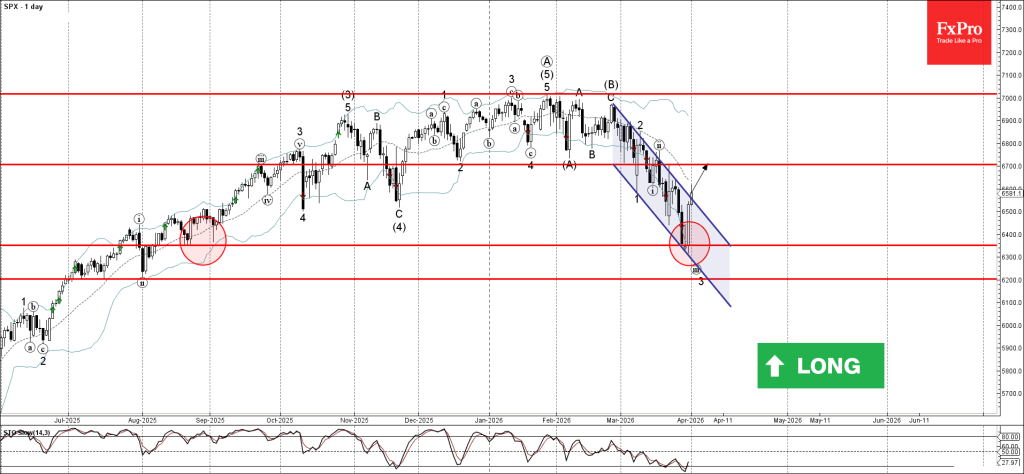
S&P 500 index today broke the resistance trendline of the daily down channel from the end of February – which enclosed the previous impulse waves 1,2, and 3.
The breakout of this down channel follows the earlier sharp upward reversal from the support level 6350.00 (which formed the daily Morning Star).
Given the strength of the support level 6350.00, S&P 500 index can be expected to rise to the next resistance level 6700.00 (former support from December).
Eco Data 4/2/26
| GMT | Ccy | Events | Act | Cons | Prev | Rev |
|---|---|---|---|---|---|---|
| 23:50 | JPY | Monetary Base Y/Y Mar | -11.60% | -10.40% | -10.60% | |
| 00:30 | AUD | Trade Balance (AUD) Feb | 5.69B | 2.55B | 2.63B | 2.26B |
| 06:30 | CHF | CPI M/M Mar | 0.20% | 0.50% | 0.60% | |
| 06:30 | CHF | CPI Y/Y Mar | 0.30% | 0.50% | 0.10% | |
| 12:30 | USD | Initial Jobless Claims (Mar 27) | 202K | 215K | 210K | 211K |
| 12:30 | USD | Trade Balance (USD) Feb | -57.3B | -59.2B | -54.5B | -54.7B |
| 12:30 | CAD | Trade Balance (CAD) Feb | -5.7B | -1.8B | -3.65B | |
| 14:30 | USD | Natural Gas Storage (Mar 27) | 36B | 38B | -54B |
| 23:50 | JPY |
| Monetary Base Y/Y Mar | |
| Actual | -11.60% |
| Consensus | -10.40% |
| Previous | -10.60% |
| 00:30 | AUD |
| Trade Balance (AUD) Feb | |
| Actual | 5.69B |
| Consensus | 2.55B |
| Previous | 2.63B |
| Revised | 2.26B |
| 06:30 | CHF |
| CPI M/M Mar | |
| Actual | 0.20% |
| Consensus | 0.50% |
| Previous | 0.60% |
| 06:30 | CHF |
| CPI Y/Y Mar | |
| Actual | 0.30% |
| Consensus | 0.50% |
| Previous | 0.10% |
| 12:30 | USD |
| Initial Jobless Claims (Mar 27) | |
| Actual | 202K |
| Consensus | 215K |
| Previous | 210K |
| Revised | 211K |
| 12:30 | USD |
| Trade Balance (USD) Feb | |
| Actual | -57.3B |
| Consensus | -59.2B |
| Previous | -54.5B |
| Revised | -54.7B |
| 12:30 | CAD |
| Trade Balance (CAD) Feb | |
| Actual | -5.7B |
| Consensus | -1.8B |
| Previous | -3.65B |
| 14:30 | USD |
| Natural Gas Storage (Mar 27) | |
| Actual | 36B |
| Consensus | 38B |
| Previous | -54B |
XAU/USD outlook: Gold Extends Recovery Rally as Brighter Geopolitical Picture Deflates Dollar
Gold remains in green for the fourth consecutive day and rose to the highest levels since Mar 19 in early Tuesday trading, in extension of Monday’s strong acceleration (gold was up nearly 3.5% for the day, in the biggest daily gain since Feb 6).
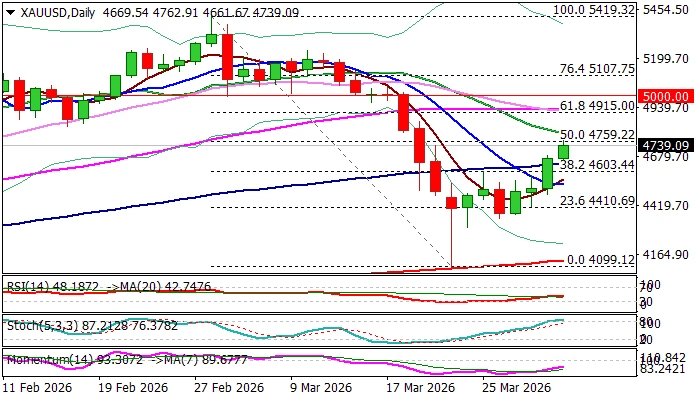
Monday’s break and close well above pivotal $4600 resistance zone (Fibo 38.2% of $5419/$4099 descend / 100DMA) generated strong signal of continuation of recovery leg from Mar 23 $4099 spike low, which paused for one week within $4600/$4305 range trading.
The latest geopolitical developments on President Trump’s signals that the war in the Middle East can end within 2-3 weeks, revived risk appetite that sent the dollar lower and boosted demand for the yellow metal.
Further action will be mainly depending on the length of fresh positive sentiment, as messages from President Trump were often short-lived and usually not allowing for stronger positive market developments.
Assumption that the conflict is heading towards its end would maintain or even boost positive sentiment that would continue to lift the price.
Immediate resistance lays at $4759 (50% retracement / daily Kijun-sen), followed by $4800 (falling 20DMA) and $4915/21/35 (Fibo 61.8% / 55DMA / daily cloud base).
Technical picture on daily chart has improved (break of 100 DMA / 5/10DMA bull-cross) but still requires more evidence as north-heading 14-d momentum is in negative territory, RSI moves into neutrality zone and stochastic is overbought.
This keeps in play scenario of a healthy correction before larger downtrend from $5419 lower top resume, particularly in case of insufficient support from the fundamental side.
Sustained break of $4759 (50% retracement) would provide further boost to developing bulls and brighten near term outlook.
Caution on return below 100DMA ($4642) that would risk test of former pivotal barrier, now acting as solid support at $4600, loss of which would sideline near term bulls.
Res: 4759; 4800; 4841; 4900.
Sup: 4661; 4642; 4600; 4532.
Sunset Market Commentary
Markets
Brent crude (June contract) trades volatile today, falling from $106/b to an intraday low just above $98 to currently $102. The move is testament to the fog of war currently created by often conflicting headlines on the next phase in the third Gulf War. Yesterday’s WSJ article (Trump looking to off-ramp without reopening Strait of Hormuz) and an Iranian news agency reporting that the country’s president signaled readiness to end the war triggered a short squeeze on stock markets. Israeli outlets also quote PM Netanyahu as saying that Iran is no longer an existential threat to his nation. It’s the first time he does so. Yesterday’s 2.5%-4% gains in the US spill into 2%-3% profit for key European gauges today. Hostile talk from the UAE (ready to military engage in efforts to unblock Straight) is met by new missile strikes coming from Iran. In the meantime, US president Trump threatened to pull from NATO in an interview with The Telegraph and suggested that the war could last for another 2-3 weeks. On social media, he sends a different signal than the tone of yesterday’s WSJ article. The US would be ready to consider a cease-fire when the Hormuz Strait is open, free and clear. “Until then, we are blasting Iran into oblivion or, as they say, back to the stone ages”. Tonight at 9 pm (3am CET tomorrow), he addresses the nation with an update on the Middle East conflict.
Core bonds initially joined the risk rally, but gradually gave up gains on the lack of visibility. US Treasuries even flipped to losses as US eco data surprised on the upside of expectation. The US economy added 62k jobs in March according to the private sector ADP employment report which headline retail sales rose by 0.6% M/M, be it in February. Growth in the control group, proxy for consumption in GDP calculation, also beat consensus at 0.5% M/M (vs 0.3%). The dollar cedes slightly more ground at EUR/USD 1.1610. US yields currently add 1 bp across the curve with German yields losing 1 to 2 bps. The latter needs to be compared with opening declines of more than 7 bps. UK Gilts outperform with the curve bull steepening. Yields shed up to 9.4 bps at the front end of the curve (2-yr). BoE governor Bailey pushed back against aggressive rate hike pricing. The central bank needs to act in a way that doesn’t harm the economy. The BoE should focus on jobs and growth too in the next MPC with Bailey also suggesting that businesses have less ability to raise prices.
News & Views
A fresh 21 Kutatokozpont poll less than two weeks before the parliamentary elections showed Hungary’s pro-European opposition party Tisza extending its lead over Orban’s ruling Fidesz party. 56% among the decided voters support the former whereas 37% rallies behind the incumbent government. This compares to the 53%-39% split in a poll from the same bureau around three weeks ago. A closely watched survey by Median last week signalled 23-point lead for Tisza which, if realized, would deliver two-thirds of parliamentary seats. It should be noted, however, that both 21 Kutatokozpont and Median are seen as having (close) ties with the opposition. That said, a recent survey by the independent Zavecz Research gives Tisza a 13-point lead. All CE currencies are having a good day today thanks to the broad risk-on mood but the Hungarian forint, supported by the polls, is taking a clear lead. EUR/HUF slides to 382.2. This compares to the recent HUF lows around 395+ which followed shortly after the Iran-related energy crunch.
Germany’s five most prominent economic institutes (RWI, Ifo, IfW, IWH and DIW) have downgraded their joint growth forecast for this year and the next while simultaneously raising the inflation prognosis. The latter was jacked up to 2.8% from 2% for this year and 2.9% from 2.3% in 2027 amid sharply rising energy prices. The economy is expected to expand by 0.6% in 2026, halve the 1.3% projected in September. The 2027 forecast was slashed to 0.9% from 1.4%. The country’s expansionary fiscal stance is helping to prevent a bigger slide, the head of forecasts at the Ifo institute said. Holtemoeller from IWH, however, was critical in the sense that "Up to now, a coherent reform policy, formulated as one piece and clearly showing the criteria by which all policy areas are being reviewed, is not recognisable". Dany-Knedlik from DIW jumped in by adding that it was important to have the institutional framework creating the conditions under which hundreds of billions of earmarked government funds can actually raise productive potential.
ISM Manufacturing Beats Expectations, Price Index Jumps to 2022 High
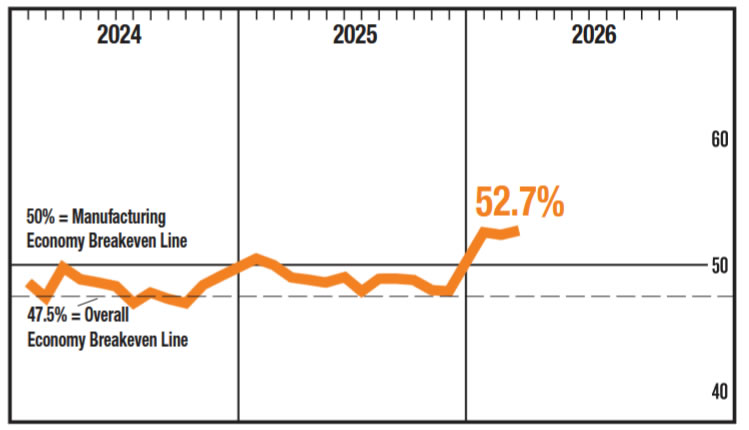
US ISM Manufacturing PMI edged up from 52.4 to 52.7 in March, beating expectations of 52.3 and signaling continued expansion in factory activity. The data suggests the sector remains resilient, with the headline reading consistent with an annualized GDP growth pace of around 1.8%.
However, the details highlight growing imbalances. Production strengthened from 53.5 to 55.1, but new orders slowed from 55.8 to 53.5, pointing to a loss of forward momentum. At the same time, employment remained in contraction territory, slipping slightly from 48.8 to 48.7, suggesting firms are still cautious about hiring despite ongoing output gains.
The most notable shift came from prices, which surged from 70.5 to 78.3, the highest level since June 2022. The sharp rise reflects intensifying cost pressures, with survey respondents citing tariffs and the Middle East war as key drivers. With 64% of comments negative, the data points to a manufacturing sector that is still expanding, but increasingly constrained by rising costs and weakening demand conditions.
Oil in No Hurry to Reverse Course
- March was a record-breaking month for Brent.
- Rumours of peace are easing tensions but have not yet reversed the trend.
The oil market was swept up in euphoria following Donald Trump’s comments that the conflict in the Middle East would end within 2–3 weeks. After a record 63% rally in March, Brent took a step back. Investors are ready to use TACO and sell what they bought earlier. However, complacency is the main risk for black gold.
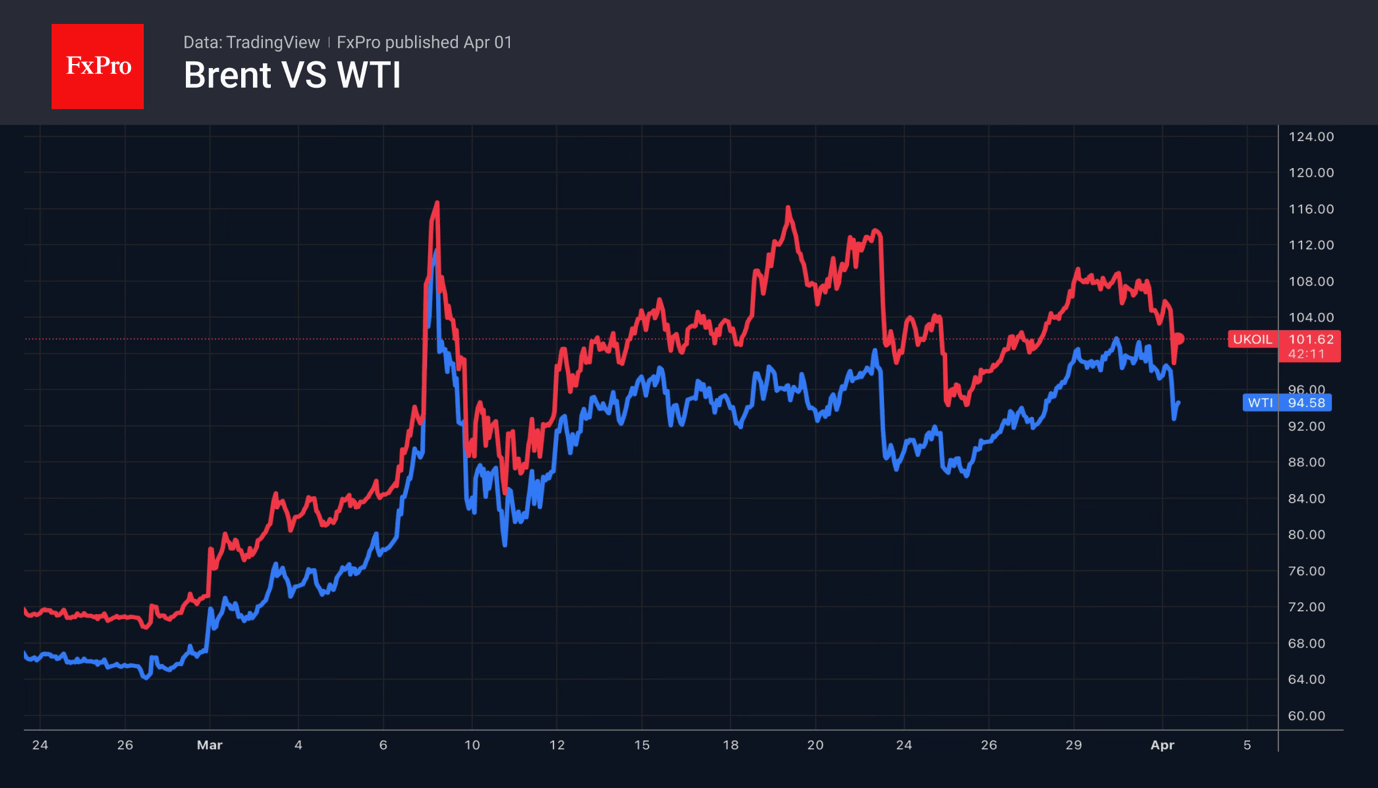
Firstly, the US continues to deploy troops to the region, and the past year has taught investors to watch the actions, rather than the rhetoric, of top American politicians following the dashed hopes surrounding the Iran–US negotiations. But even if this is true, the Americans’ withdrawal from the Middle East does not mean the end of the conflict. The US President is calling on countries in the region to learn to defend themselves and on importers to come and take the oil they need by force. As a result, the UAE is prepared to get drawn into the conflict.
According to estimates by FGE NexantECA, a closure of the Strait of Hormuz would result in losses of 100 million barrels per week and 400 million barrels per month. If it lasts another 6–8 weeks, Brent could reach the $150–200 range. This forecast is in line with Sociénéété Generale’s estimate of $150 per barrel and Macquarie Group’s estimate of $200. The Iranians are also warning the world of a rise to the upper end of this range, while the US presidential administration calls $100 the ‘base’ price and does not rule out $200.
Even if the Strait of Hormuz is reopened, it will take considerable time to restore pre-war infrastructure. The flow of tankers will not return immediately; supply issues will ease but will not disappear. It is unlikely that Brent will return to levels near $60 by the end of the year, as seen at the end of last year.
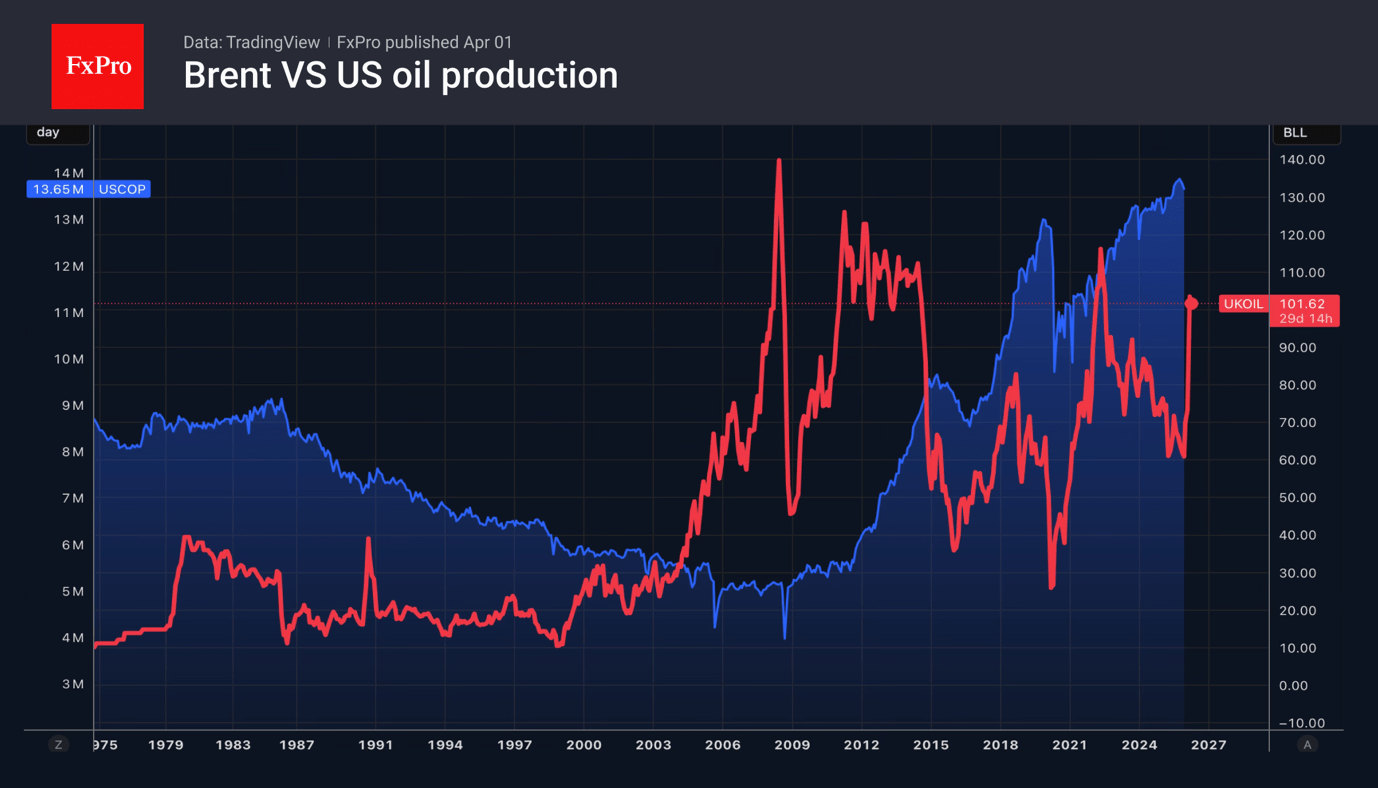
Unlike in 2022, US drillers are in no hurry to come to consumers’ aid, producing an average of 13.2 million bpd in January, down from 13.9 million bpd in October. The decline in production over the last three months is one of the largest in the last ten years.
The US oil industry prefers paying dividends to shareholders rather than developing new fields and increasing production, despite Donald Trump’s “drill, baby, drill” call. Consequently, without an end to the conflict in the Middle East and the reopening of the Strait of Hormuz, it is premature to expect prices to return to February levels.
Euro Comes Out Swinging: Can the “Trump Reversal” Sustain EUR/USD’s Upside Bias?
- The EUR/USD surge toward the 1.1600 handle was driven by a "Trump Reversal" and "war optimism,"
- The pair is being boosted by a yield differential that favors the Euro
- Inflation realities, including a jump in March Eurozone CPI to 2.5%, are keeping the "hawks" firmly in the driver's seat at the ECB.
- However, we are likely looking at a capped range between 1.1490 and 1.1620.
The Euro has come out swinging in early Wednesday trade, capitalizing on a sudden shift in market sentiment that has left the US Dollar nursing its wounds.
After a period of intense geopolitical positioning, EUR/USD has surged back toward the 1.1600 handle, driven by a potent mix of "war optimism" and a hawkish recalibration of the European Central Bank (ECB) path.
Early Trade: The "Trump Reversal" in Action
The primary catalyst for the overnight move was a classic display of the "Trump Always Changes His Mind" (TACO) strategy.
US President Donald Trump’s comments suggesting the Middle East conflict could reach a resolution within two to three weeks, coupled with his call for Gulf states to forcibly reopen the Strait of Hormuz triggered a sharp de-escalation trade.
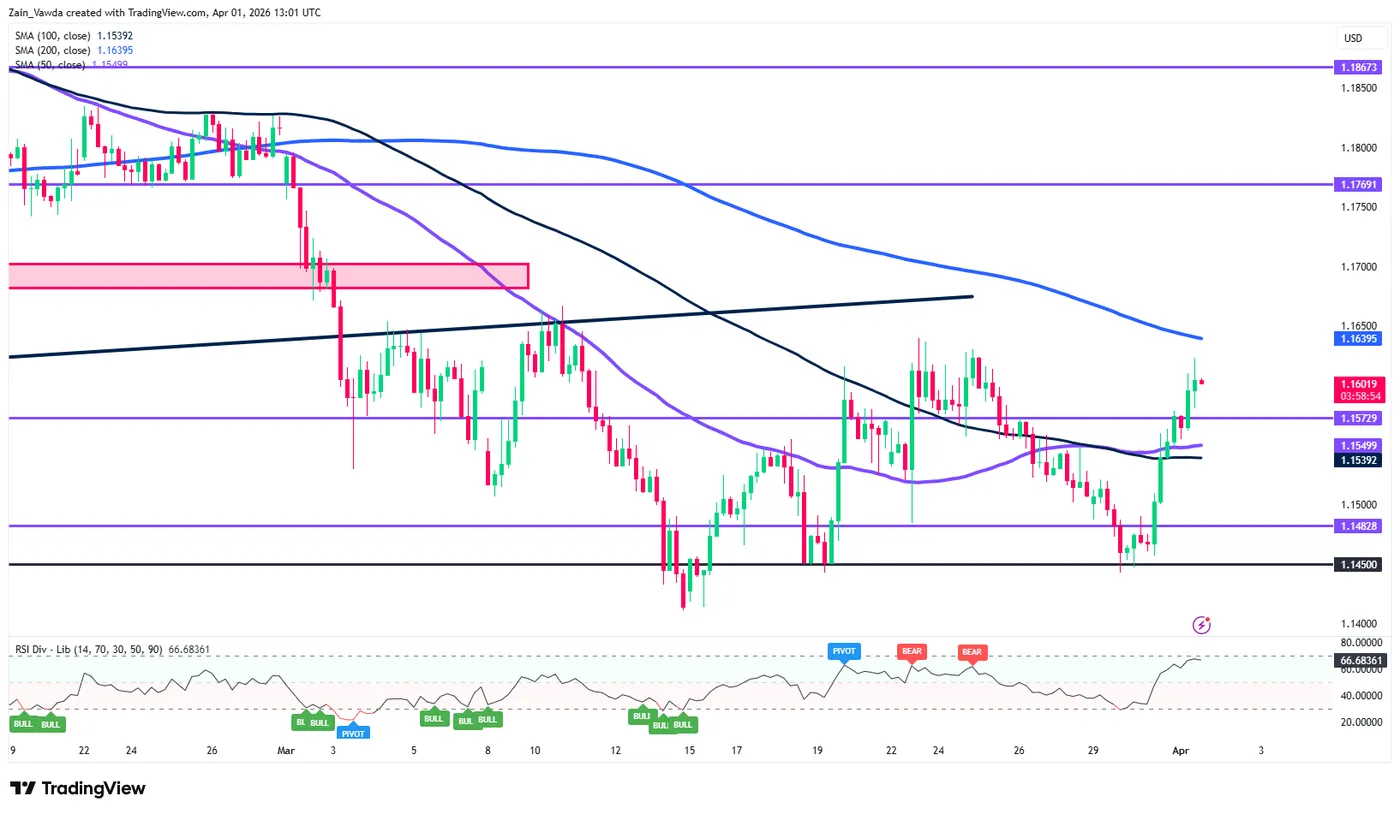
From a technical standpoint, we saw the pair dip as low as 1.1446 before staging a rapid recovery to highs of 1.1563 during the late New York session. As we move through the European morning, the pair remains buoyed, trading with a clear upside bias as investors dump safe-haven Dollars in favor of riskier assets.
What’s Driving the Pair?
Geopolitical De-escalation: The market is betting on a fall in Brent crude and an improvement in global risk appetite. If the war timeline holds, the global economy may dodge the worst-case recessionary scenarios, which is inherently Euro-positive given the Eurozone's sensitivity to energy prices.
ECB Hawk vs. Fed Dove: While the Fed appears content to sit on its hands or even lean toward a dovish repricing (with markets eyeing a potential December cut), the ECB is singing a different tune. Hawkish rhetoric from the likes of Schnabel and even the usually dovish Panetta has kept rate hike bets alive. Markets are currently pricing in approximately 63–71 basis points of tightening by year-end, creating a yield differential that favors the Euro.
Inflation Realities: March Eurozone CPI jumped to 2.5%, and while core inflation softened slightly to 2.3%, the headline pressure from food and energy is keeping the "hawks" at the ECB firmly in the driver's seat for now.
The Road Ahead: Upside Bias or Capped Range?
Looking forward, the immediate focus shifts to the US economic calendar, specifically the ADP Employment Change (expected at a soft 40k) and the ISM Manufacturing PMI. A weak jobs print would further validate the idea that the US economy is losing steam under the weight of the energy shock, likely piling more pressure on the Greenback.
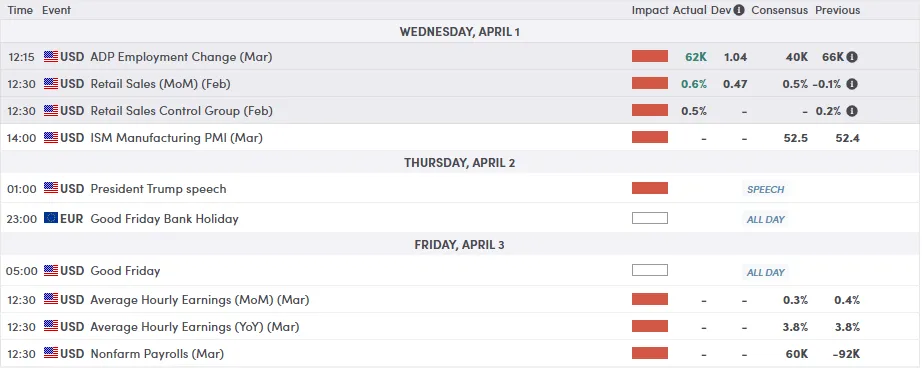
For all market-moving economic releases and events, see the MarketPulse Economic Calendar. (click to enlarge)
While the "Trump Reversal" has provided the Euro with a much-needed lifeline, the sustainability of this move rests on two factors: the actual reopening of the Strait of Hormuz and whether the ECB follows through on its hawkish threats. For now, the path of least resistance for EUR/USD appears to be higher, but in this "sell-everything" environment, volatility remains the only certainty.
Potential Move & Key Levels:
The momentum has clearly shifted, but we must remain cautious. While the upside bias is intact, i think we are likely looking at a capped range between 1.1490 and 1.1620.
- Resistance: The 1.1595 - 1.1620 zone remains the major hurdle for bulls. A break above 1.1620 would signal a more structural shift in the pair's trajectory.
- Support: On the downside, the Euro needs to hold above 1.1520 to keep this intraday momentum alive. Any break back below 1.1450 would suggest that the "war optimism" was premature.
EUR/USD Four-Hour Chart, April 1, 2026
Source: TradingView
GBP/USD Mid-Day Outlook
Daily Pivots: (S1) 1.3169; (P) 1.3217; (R1) 1.3274; More...
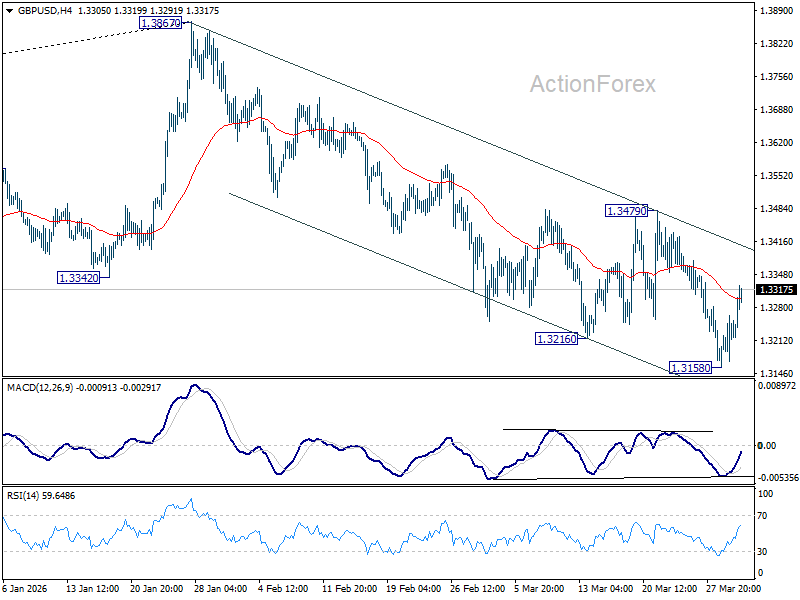
GBP/USD's rebound from 1.3158 extended higher, but upside is still limited well below 1.3479 resistance. Intraday bias stays neutral and outlook remains bearish. Below 1.3158 will resume the fall from 1.3867 to 1.3008 structural support. However, firm break of 1.3479 will indicate that the fall from 1.3867 has completed, and turn bias back to the upside for stronger rally.
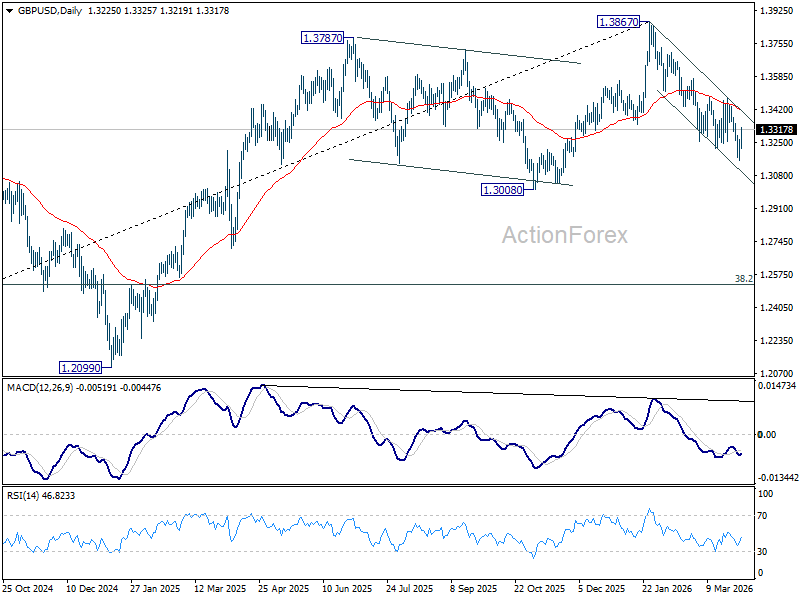
In the bigger picture, considering bearish divergence condition in both D and W MACD, a medium term top should be in place at 1.3867. Firm break of 1.3008 support will argue that fall from 1.3867 is at least correcting the rise from 1.0351 (2022 low) with risk of bearish reversal. That would open up further decline to 38.2% retracement of 1.0351 to 1.3867 at 1.2524. For now, medium term outlook will be neutral at best as long as 1.3867 resistance holds, or until further development.
USD/CHF Mid-Day Outlook
Daily Pivots: (S1) 0.7964; (P) 0.8004; (R1) 0.8033; More….
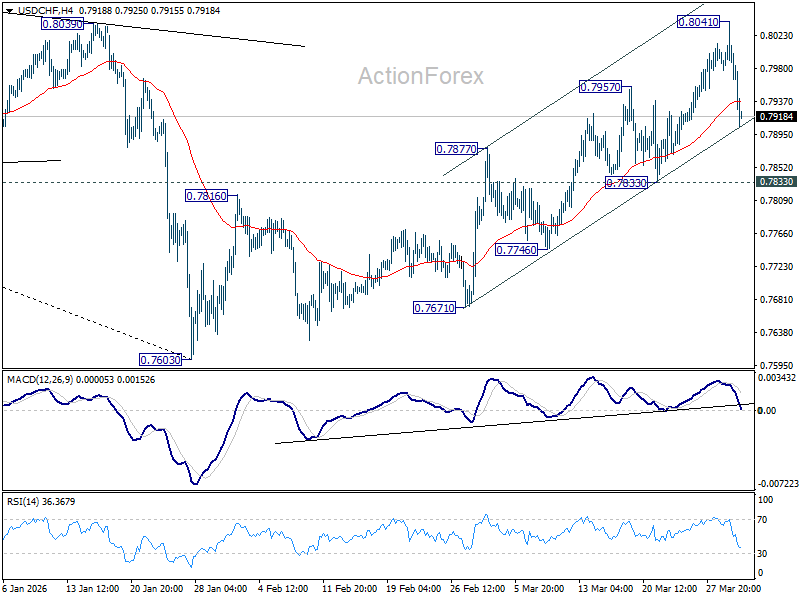
USD/CHF's pullback from 0.8041 extended lower today, but downside is still supported well above 0.7833. Intraday bias remains neutral first. While more consolidations could be seen, further rally would remain in favor. On the upside, break of 0.8041 will resume the whole rally from 0.7603, and target 38.2% retracement of 0.9200 to 0.7603 at 0.8213. However, decisive break of 0.7833 support will argue that the rebound has completed, and turn bias back to the downside for deeper fall.
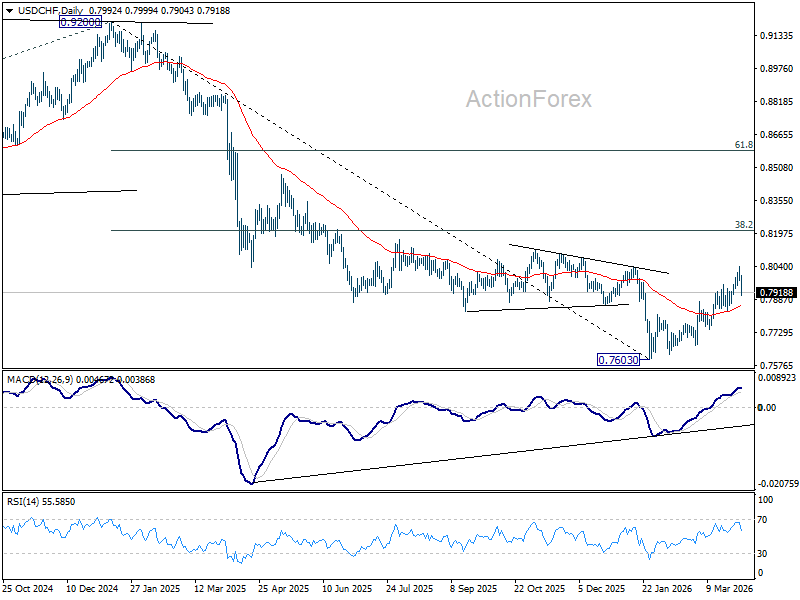
In the bigger picture, a medium term bottom should be in place at 0.7603 on bullish convergence condition in D MACD. Rebound from there is seen as correcting the fall from 0.9200 only. However, decisive break of 55 W EMA (now at 0.8088) will suggest that it's probably correcting the larger scale down trend from 1.0146 (2022 high). On the other hand, rejection by the 55 W EMA will setup down trend resumption to 100% projection of 1.0146 (2022 high) to 0.8332 from 0.9200 at 0.7382 at a later stage.
USD/JPY Mid-Day Outlook
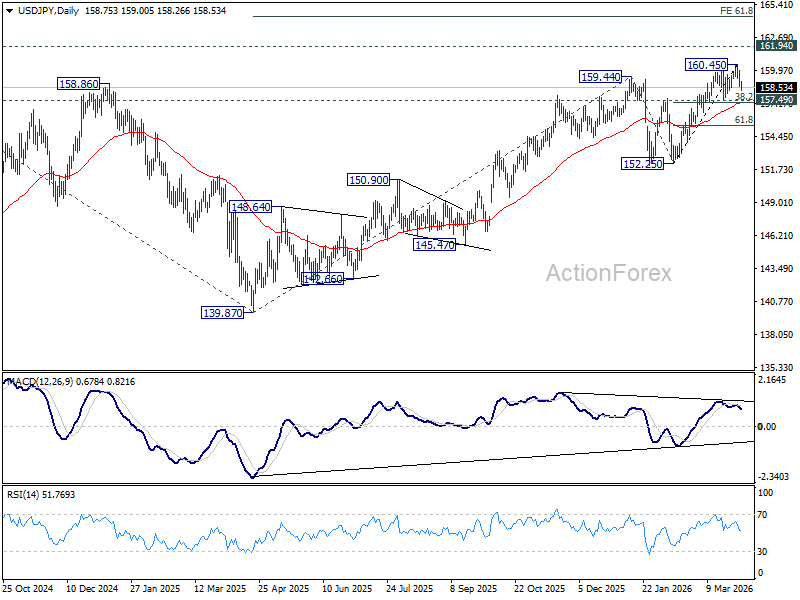
Daily Pivots: (S1) 158.23; (P) 159.11; (R1) 159.62; More...
Intraday bias in USD/JPY stays mildly on the upside for the moment. Fall from 160.45 short term top should extend to 157.49 cluster support (38.2% retracement of 152.25 to 160.45 at 157.31. On the upside, above 159.31 minor resistance will turn intraday bias neutral. But near term outlook will stay neutral as long as 160.45 resistance holds, in case of recovery.
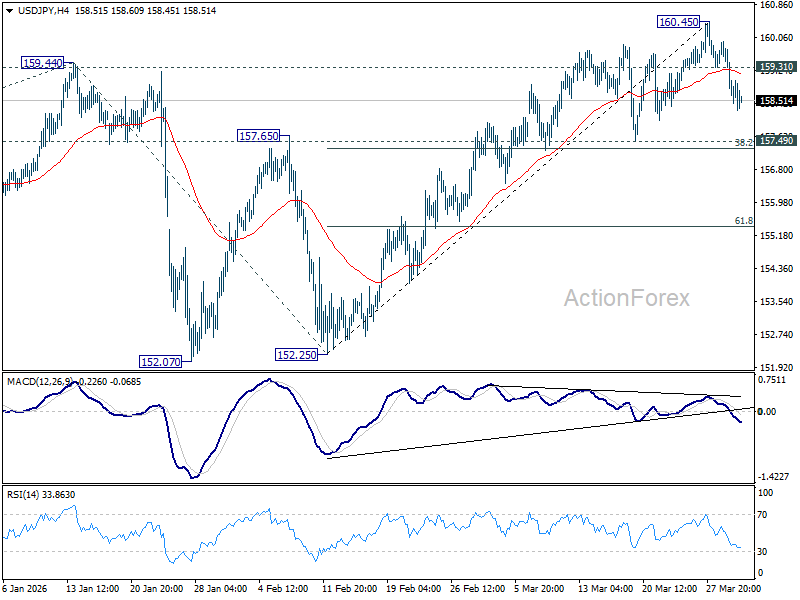
In the bigger picture, outlook is unchanged that corrective pattern from 161.94 (2024 high) should have completed with three waves at 139.87. Larger up trend from 102.58 (2021 low) could be ready to resume through 161.94. This will remain the favored case as long as 55 W EMA (now at 152.97) holds. Firm break of 161.94 will pave the way to 61.8% projection of 102.58 to 161.94 from 139.87 at 176.75.