Sample Category Title
EUR/USD Mid-Day Outlook
Daily Pivots: (S1) 1.1479; (P) 1.1521; (R1) 1.1596; More….
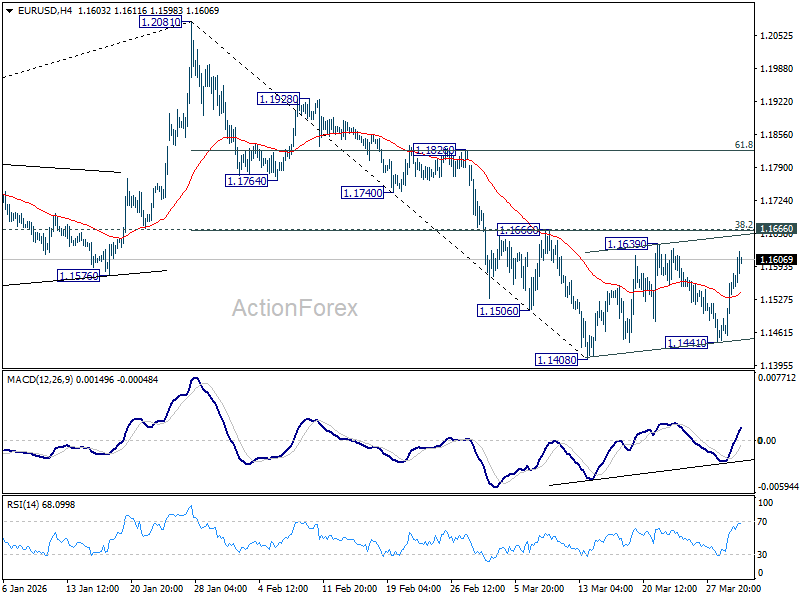
EUR/USD's rebound from 1.1441 extended further, but still it's capped below 1.1666 cluster resistance (38.2% retracement of 1.2081 to 1.1408 at 1.1665). Price actions from 1.1408 are viewed as a consolidations pattern and further decline is expected. On the downside, firm break of 1.1408 will resume the fall from 1.2081 to 38.2% retracement of 1.0176 to 1.2081 at 1.1353. However, decisive break of 1.1666 will argue that the fall from 1.2081 has completed, and turn bias back to the upside for 61.8% retracement of 1.2081 to 1.1408 at 1.1824.
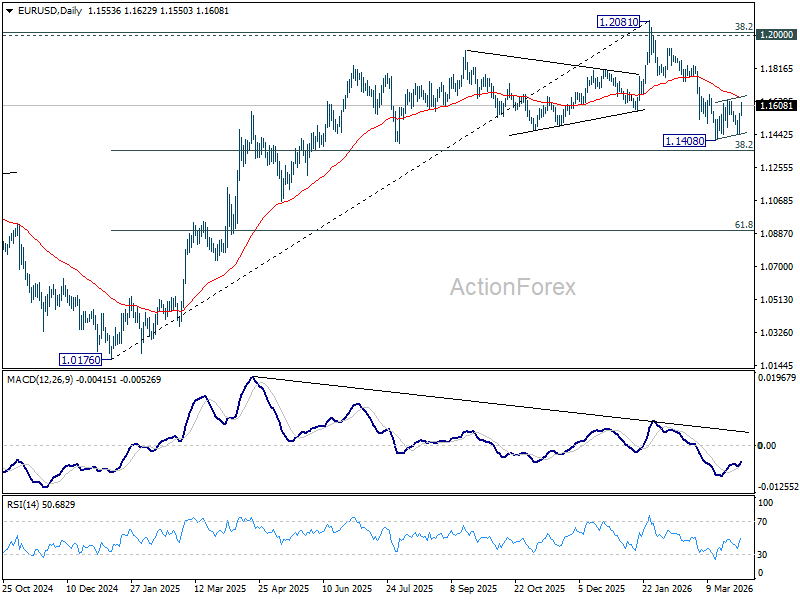
In the bigger picture, prior break of 55 W EMA (now at 1.1497) should confirm rejection by 1.2 key cluster resistance level. The whole up trend from 0.9534 (2022 low) might have completed as a three wave corrective rise too. Deeper fall is expected to long term channel support (now at 1.0535). Meanwhile, risk will stay on the downside as long as 1.2081 holds, even in case of strong rebound.
Dollar Selloff Accelerates on Iran Endgame Hopes; Will Trump’s Address Break the Risk-On Rally?
Global markets are extending a powerful risk-on rally as expectations build that the Iran war may be nearing its end. European equities are posting strong gains, US futures point higher, and Dollar is sharply weaker across the board. The move reflects a clear shift in sentiment, with markets front-running a potential endgame and aggressively repositioning ahead of confirmation from US President Donald Trump's scheduled address at 9 p.m. ET today.
This risk-on rally has been fueled by Trump’s indication that US forces could withdraw within “two to three weeks.” That guidance has been enough to trigger a repricing of geopolitical risk, but the sustainability of the move is far from assured. This is a rally built on anticipation, not confirmation, and markets are now entering a critical phase.
Conviction hinges on Trump’s address, which is widely seen as the decisive catalyst. Investors are not just looking for reassurance—they are looking for specifics. The difference between confirmation and ambiguity will determine whether the current rally extends or fades.
The first key element to watch is confirmation of a "de facto exit". Language such as “mission accomplished” or “there’s nothing more to do” would strongly reinforce the endgame narrative. Trump has already downplayed the need for a formal deal, stating that Iran “doesn’t have to make a deal,” which suggests that a unilateral withdrawal is firmly on the table.
However, the biggest risk lies in the April 6 deadline. Any mention of a “final strike” on Iranian energy infrastructure would immediately flip sentiment. Markets view this as the nuclear option, with potential retaliation threatening regional energy facilities. Such a scenario would likely reverse the risk-on rally instantly.
Timing is the second critical factor. Trump’s previous guidance of “maybe two weeks, maybe three” has been enough to trigger positioning, but markets now need precision. A defined withdrawal schedule or phased exit plan would support the rally, while vague language, like "we'll see what happens", or delays would reinforce the view that the situation remains fluid.
The third and perhaps most important issue is the Strait of Hormuz. Markets are not just watching whether the US exits, but what happens after. If Trump signals that the US will no longer act as the “policeman” of the Strait, leaving allies to secure shipping lanes, then supply risks remain elevated even in a de-escalation scenario.
This is why oil is the ultimate signal. Brent has dipped notably today but remains above $100, indicating that markets are not fully convinced. A sustained break below $100 following Trump’s address would confirm that the oil shock is unwinding. Or even better, a deeper move below $96 structural support would reinforce a transition toward more normalized "Peace" conditions at around $80. Conversely, if oil holds firm or even rebounds above $110, it would signal lingering concerns about supply disruption and security risks. That would suggest that markets are still pricing uncertainty, even if the geopolitical narrative appears to be improving.
In short, markets are pricing the exit, not confirming it. The current rally reflects optimism around a potential endgame, but execution risk remains high. Whether this risk-on move extends or reverses will depend on whether Trump’s address delivers clarity—or reintroduces uncertainty into an already fragile setup.
In Europe, at the time of writing, FTSE is up 1.66%. DAX is up 2.34%. CAC is up 1.80%. UK 10-year yield is down -0.055 at 4.800. Germany 10-year yield is down -0.018 at 2.988. Earlier in Asia, Nikkei rose 5.24%. Hong Kong HSI rose 2.04%. China Shanghai SSE rose 1.46%. Singapore Strait Times rose 1.85%. Japan 10-year JGB yield fell -0.055 to 2.304.
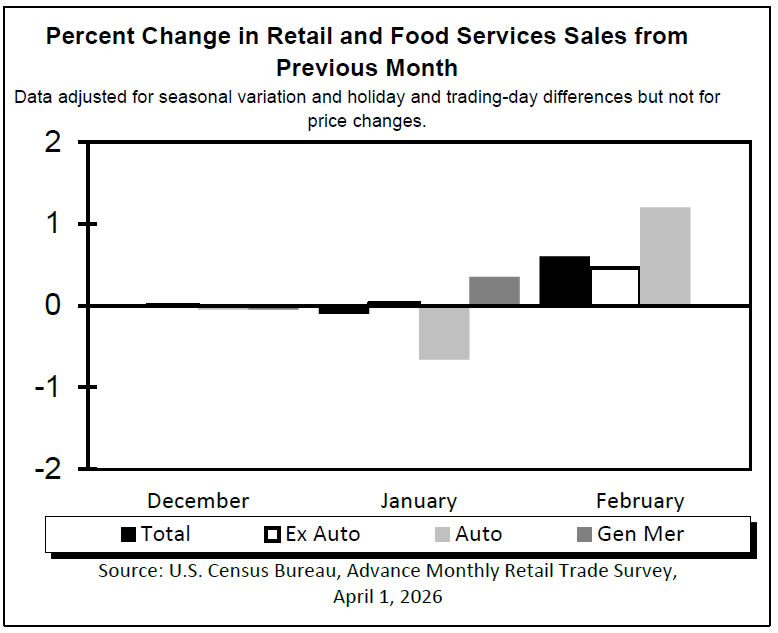
US Retail Sales Strength Continues, Core Measures Show Broad-Based Gains
US retail sales surprised to the upside in February, rising 0.6% as consumer demand stayed resilient. Core measures also showed steady gains, highlighting broad-based spending strength. Read more.
US ADP Jobs Beat at 62k, Wage Growth Picks Up for Job-Changers
US private hiring came in stronger than expected in March, with ADP jobs rising to 62k. While overall hiring remains steady, the real shift is in wages, with job-changers seeing faster pay growth. The data highlights a labor market that is stable but increasingly uneven beneath the surface. Read more.
UK PMI Manufacturing Finalized at 51.0, Input Costs Surge and Confidence Drops
UK manufacturing growth slowed in March, with PMI slipping to 51.0. But the bigger story is surging input costs and worsening supply delays, with price pressures hitting their highest levels since 1992. As confidence drops and job cuts accelerate, production is being squeezed despite stable demand. Read more.
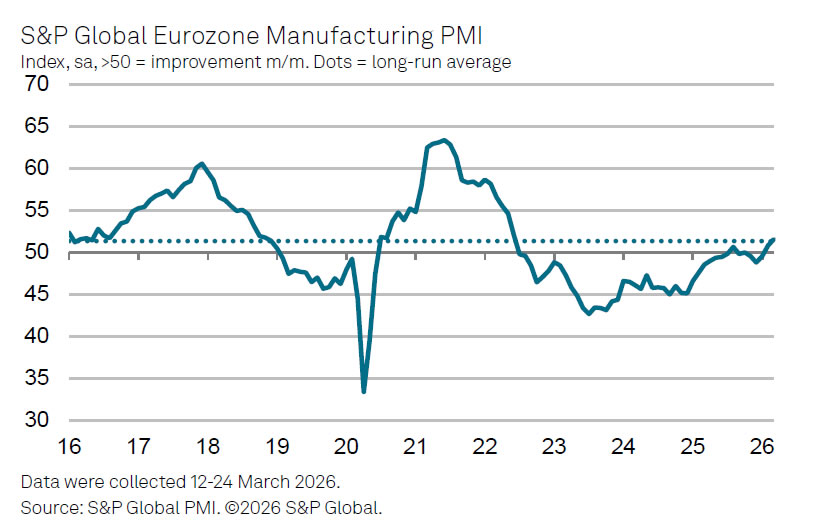
Eurozone PMI Manufacturing Finalized at 45-Month High But War-Fueled Inflation Clouds Outlook
Eurozone manufacturing PMI rose to 51.6 in March, marking its strongest level in nearly four years. But the Middle East war is already pushing up energy costs and disrupting supply chains, with firms passing higher prices to customers. As inflation pressures build, the recovery is becoming more fragile. Read more.
Japan's Strong Tankan Signals Support BoJ Normalization Despite External Risks
Japan’s Tankan survey surprised to the upside, with stronger business sentiment and capex plans signaling resilient corporate activity. More importantly, inflation expectations climbed to record levels, reinforcing the case for further BoJ normalization. However, rising energy costs tied to Middle East tensions continue to cloud the outlook. Read more.
Japan PMI Manufacturing Finalized at 51.6, War-Driven Cost Pressures Build
Japan’s manufacturing PMI eased to 51.6 in March, signaling slower growth after February’s 45-month peak. However, the bigger shift came from surging input costs, with firms facing the sharpest price increases in over 18 months due to Middle East tensions. As companies pass on higher costs and turn more cautious, inflation risks are building even as momentum softens. Read more
EUR/USD Mid-Day Outlook
Daily Pivots: (S1) 1.1479; (P) 1.1521; (R1) 1.1596; More….
EUR/USD's rebound from 1.1441 extended further, but still it's capped below 1.1666 cluster resistance (38.2% retracement of 1.2081 to 1.1408 at 1.1665). Price actions from 1.1408 are viewed as a consolidations pattern and further decline is expected. On the downside, firm break of 1.1408 will resume the fall from 1.2081 to 38.2% retracement of 1.0176 to 1.2081 at 1.1353. However, decisive break of 1.1666 will argue that the fall from 1.2081 has completed, and turn bias back to the upside for 61.8% retracement of 1.2081 to 1.1408 at 1.1824.
In the bigger picture, prior break of 55 W EMA (now at 1.1497) should confirm rejection by 1.2 key cluster resistance level. The whole up trend from 0.9534 (2022 low) might have completed as a three wave corrective rise too. Deeper fall is expected to long term channel support (now at 1.0535). Meanwhile, risk will stay on the downside as long as 1.2081 holds, even in case of strong rebound.
US Retail Sales Strength Continues, Core Measures Show Broad-Based Gains
US retail sales rose 0.6% mom to USD 738.4B in February, beating expectations of 0.4% mom and pointing to resilient consumer demand. The strength was broad-based, with ex-auto sales rising 0.5% mom to USD 599.0B. Ex-gasoline sales also increased 0.6% mom to USD 686.0B. These figures indicate that underlying consumption momentum remains solid beyond volatile components such as autos and fuel.
On a yearly basis, headline sales rose 3.7% yoy, while total sales for the December 2025 through February 2026 period increased 3.1% from a year earlier. Retail trade sales were also up 0.6% mom from January and 3.5% yoy. The data supports the case for a still-resilient US economy, which could keep the Fed cautious on easing as solid demand persists.
US ADP Jobs Beat at 62k, Wage Growth Picks Up for Job-Changers
US ADP private employment rose 62k in March, above expectations of 42k, pointing to steady but moderate labor market expansion. The increase was broadly balanced between goods-producing industries, which added 30k jobs, and service-providing sectors, which gained 32k.
However, the composition of job growth highlights an uneven picture. Small establishments led hiring with an increase of 85k jobs, while medium and large firms shed -20k and -4k respectively.
On the wage front, conditions remain firm but uneven. Pay growth for job-stayers held steady at 4.5% yoy for a third consecutive month. Job-changers saw gains accelerate from 6.3% yoy to 6.6% yoy.
ADP Chief Economist Nela Richardson noted that hiring remains concentrated in certain industries, particularly healthcare, and that stronger pay gains for job-changers reflect continued competition for skilled labor even as overall hiring momentum stays moderate.
Chart Alert: US Stock Indices Rally Smells Like a Dead Cat Bounce – Outlook on S&P 500, Nasdaq 100,...
Key takeaways
- Rally likely a “dead cat bounce”: The sharp surge across US indices appears driven by short-covering and quarter-end positioning amid optimism over a potential US–Iran de-escalation, rather than a sustainable bullish reversal.
- Macro and technical backdrop still bearish: Longer-term charts show bearish reversal patterns across major indices, signalling deterioration in the broader uptrend despite the recent rebound.
- Weak breadth and key resistance levels cap upside: Market breadth remains fragile with limited participation, while indices are still below critical resistance levels (S&P 500 – 6,730), (Nasdaq 100 – 24,355), (DJIA – 47,460), leaving downside risks intact unless these levels are decisively reclaimed.
On Tuesday, 31 March 2026 (the last day of the month and the first quarter), the global markets witnessed a set of magnificent rallies on the four major US benchmark stock indices: S&P 500 (+2.9%), Nasdaq 100 (+3.4%), Dow Jones Industrial Average (+2.5%), and small-cap Russell 2000 (+3.4%), all notched their best daily performance since May 2025.
These explosive V-shaped intraday rallies seen in the US stock market were ignited by optimism of a potential de-escalation of the ongoing five-week US-Iran war.
Iranian President Masoud Pezeshkian told EU Council president António Costa that Iran has "the necessary will to end this war" but expects certain guarantees in exchange, a hint that the Iranian leadership may be open to negotiations.
Thereafter, towards the end of Tuesday’s US session, US President Trump mentioned that the US-Iran war may end within two to three weeks, suggested the US has accomplished its military goals, and the reopening of the Strait of Hormuz may not be necessary to end the war.
On Wednesday, 1 April at 9 p.m. Washington time, US President Trump will deliver an official speech to address the current situation in Iran, according to the White House’s press office.
Interestingly, the rallies seen on the major US stock indices can be due to short-covering and potential window-dressing for month-end and quarter-end.
Technical analysis suggests a potential mean reversion rebound (a dead cat bounce) rather than the start of a medium-term bullish reversal inflection point. Let’s break it down.
Longer-term price actions are bearish
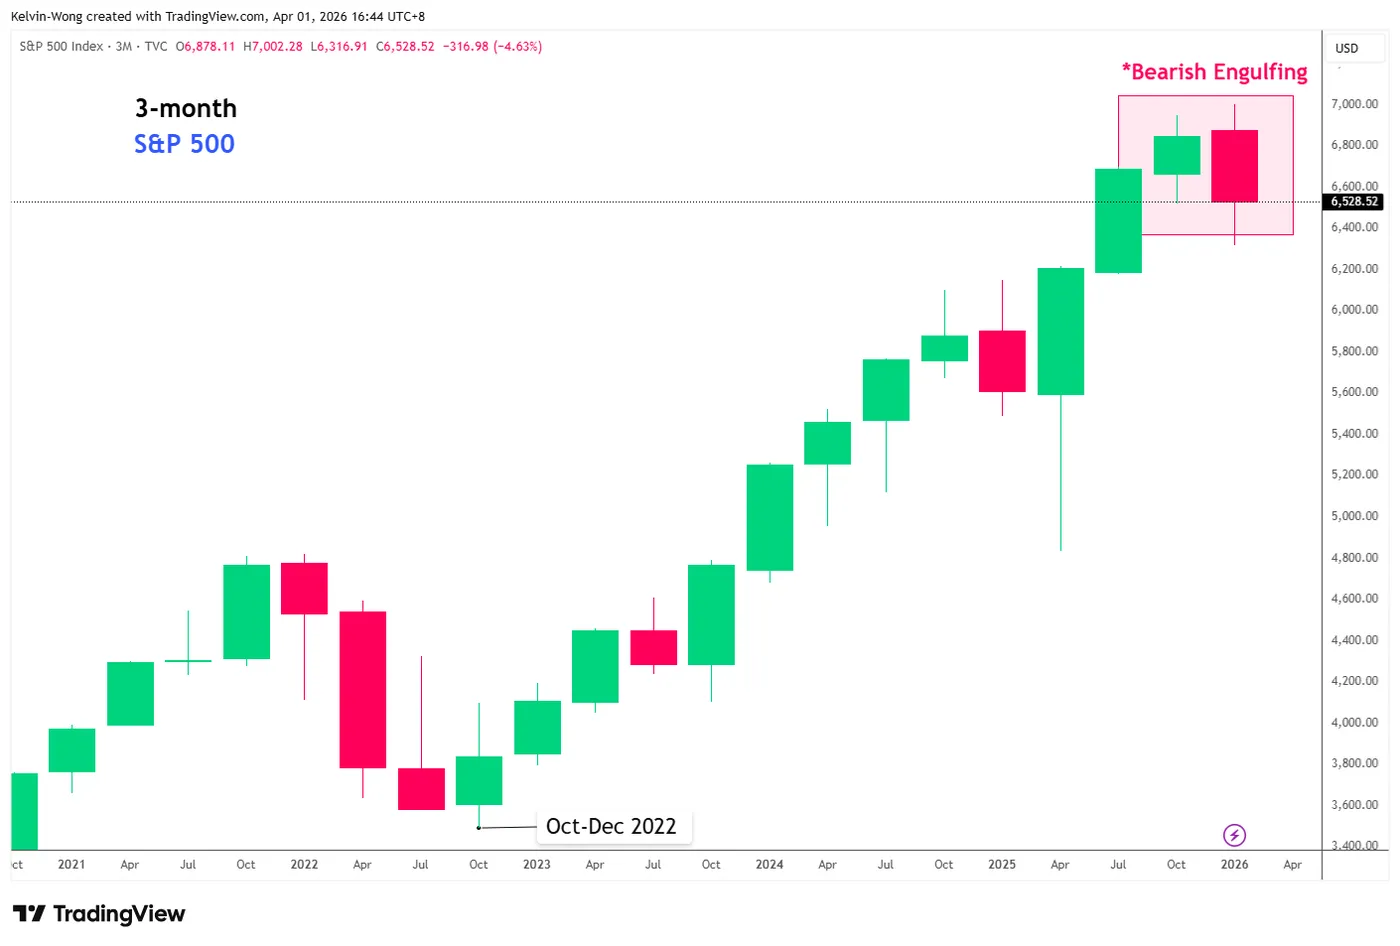
Fig. 1: S&P 500 long-term secular trend as of 31 Mar 2026 (Source: TradingView)
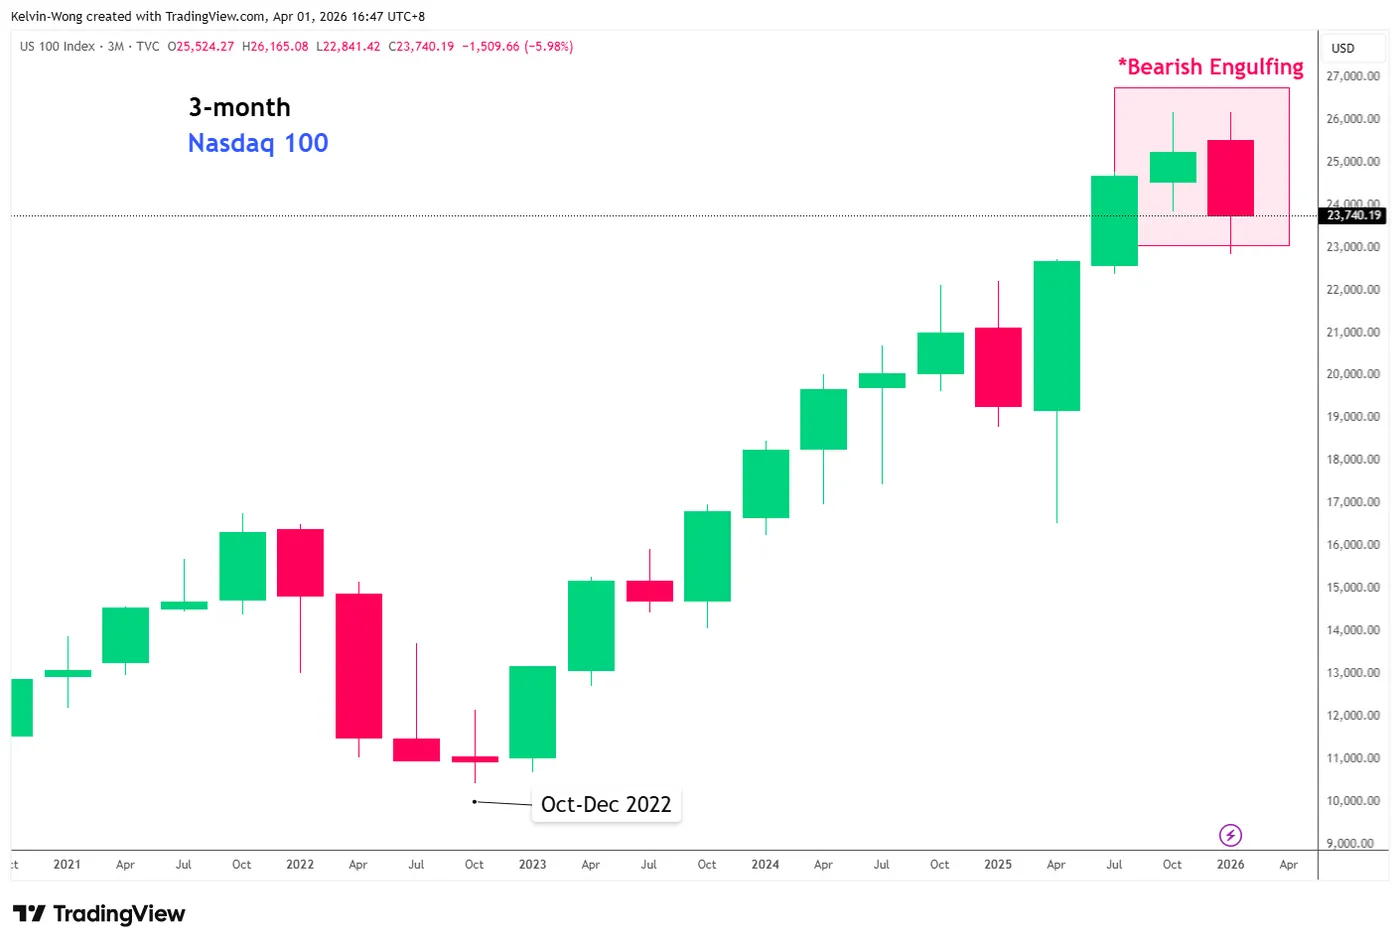
Fig. 2: Nasdaq 100 long-term secular trend as of 31 Mar 2026 (Source: TradingView)
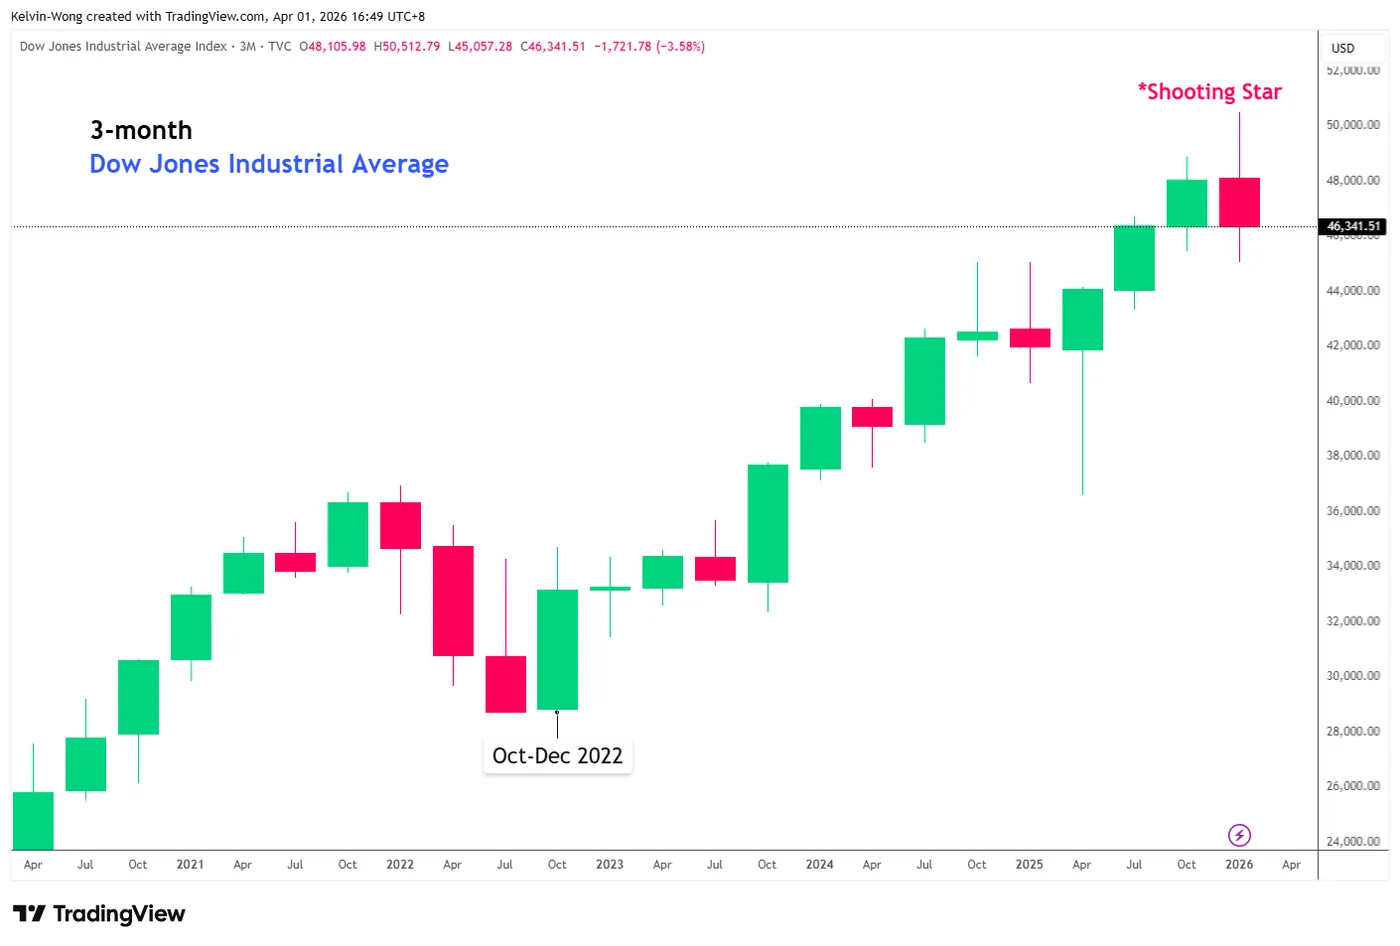
Fig. 3: Dow Jones Industrial Average long-term secular trend as of 31 Mar 2026 (Source: TradingView)
The 3-month charts of the cash stock indices have formed bearish reversal candlestick patterns at the end of Q1 2026.
Both the mega-cap tech-heavy S&P 500 and Nasdaq 100 have flashed “Bearish Engulfing” candlesticks (see Fig. 1 & Fig. 2), while a 3-month bearish “Shooting Star” candlestick was seen on the Dow Jones Industrial Average (DJIA) (see Fig. 3).
Hence, the appearance of such bearish reversal candlestick patterns on the longer-term charts suggests that the bigger macro picture points to a potential deterioration in the longer-term secular bullish trends of the S&P 500, Nasdaq 100, and DJIA rather than the start of a medium-term bullish reversal phase (e.g ex-post US Liberation Day tariffs in early April 2025).
Market breadth remains weak and has not reached capitulation levels
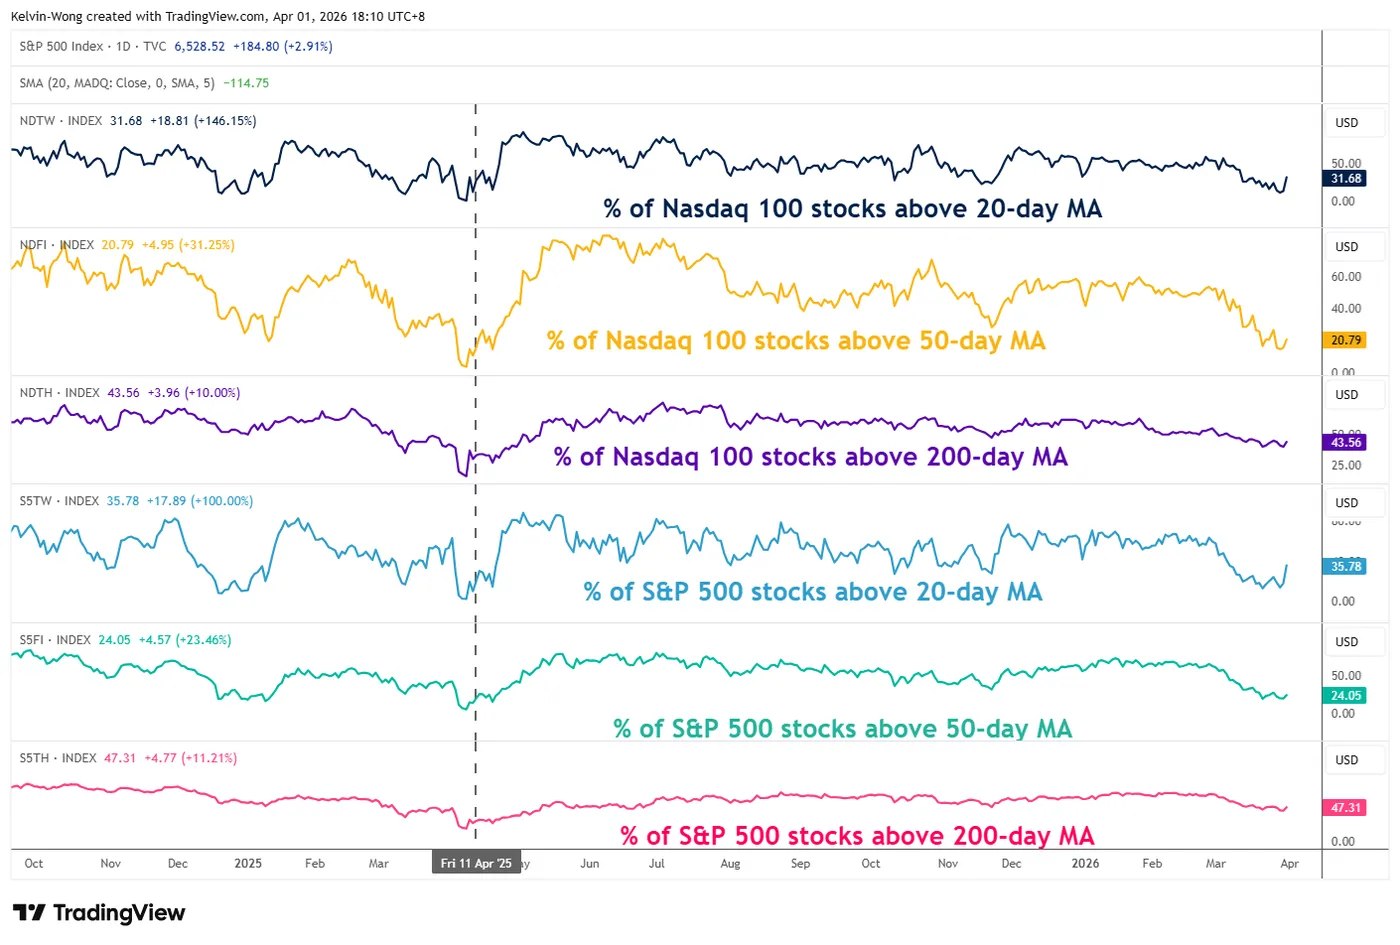
Fig. 4: Percentages of S&P 500 & Nasdaq 100 stocks above 20-day, 50-day & 200-day MAs as of 31 Mar 2026 (Source: TradingView)
The percentage of component stocks for both the S&P 500 and Nasdaq 100 that are trading above their respective 50-day and 200-day moving averages after Tuesday’s rally is still below 50% (see Fig. 4).
The percentage of S&P 500 stocks above 50-day and 200-day moving averages stands at 24% and 47%, respectively. The prior capitulation levels were at 5.2% (above 50-day MA) and 17.7% (above 50-day MA) on 8 April 2025, which led to the ex-post US Liberation Day tariffs’ bullish reversal.
The percentage of Nasdaq 100 stocks above 50-day and 200-day moving averages stands at 21% and 44%, respectively. The prior capitulation levels were at 4% (above 50-day MA) and 16% (above 200-day MA) on 8 April 2025, which led to the ex-post US Liberation Day tariffs’ bullish reversal.
Let’s now decipher the medium-term trends of the S&P 500, Nasdaq 100, and Dow Jones Industrial Average.
S&P 500 – Still below 200-day MA with RSI capped by resistance
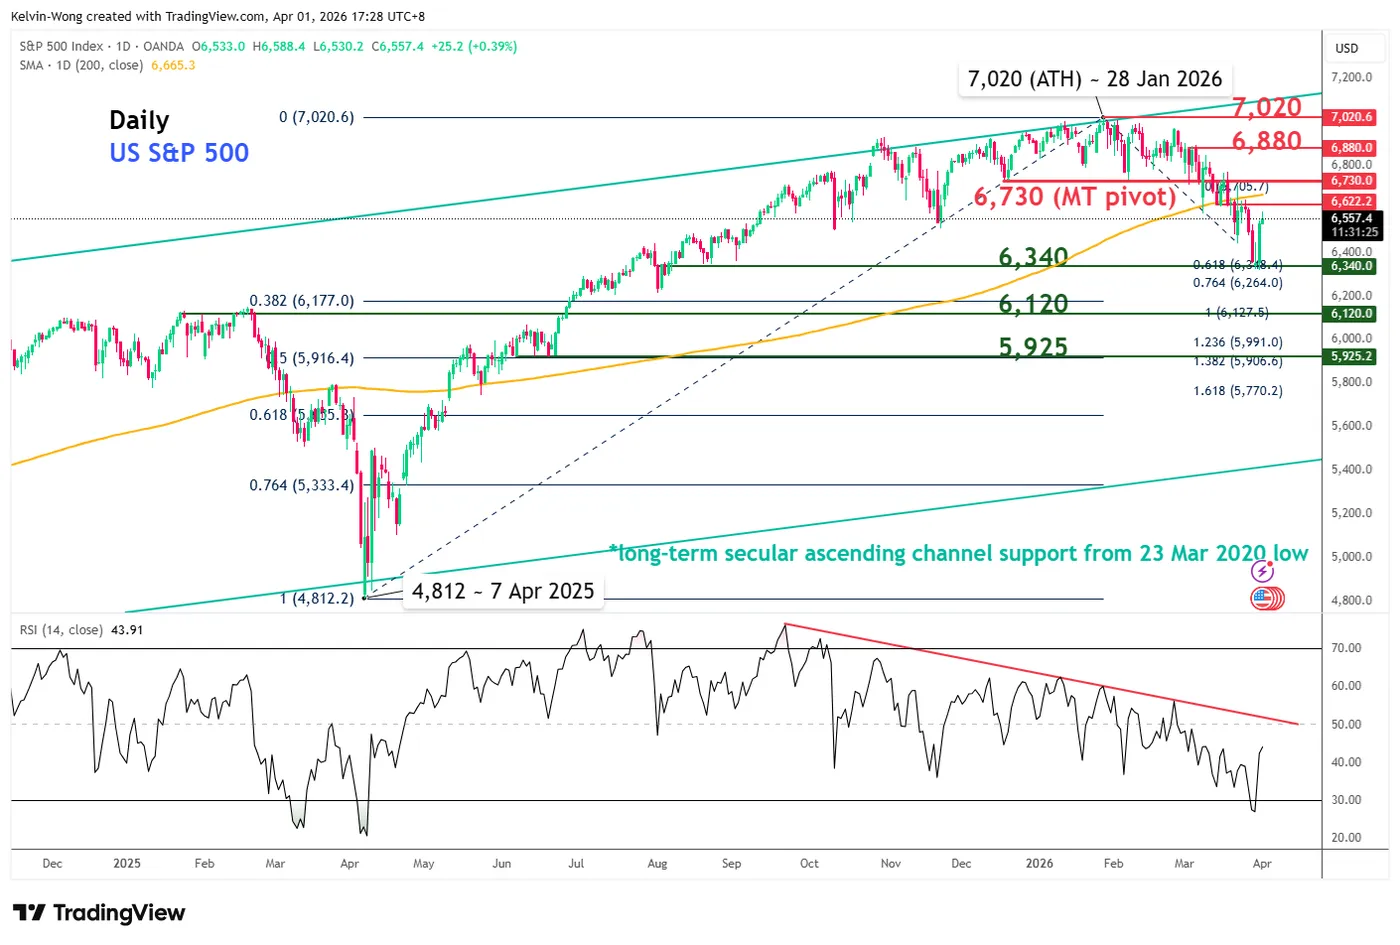
Fig. 5: US S&P 500 CFD index medium-term trend as of 1 Apr 2026 (Source: TradingView)
The medium-term downtrend phase of the US S&P 500 CFD index (a proxy of the S&P 500 E-mini futures) remains intact since its current all-time high of 7,020 printed on 28 January 2026.
Watch the 6,730 key medium-term pivotal resistance, and a break below 6,340 increases the odds of another potential bearish impulsive down move sequence to expose the next medium-term supports at 6,120 and 5,925 (see Fig. 5).
On the other hand, a clearance above 6,730 invalidates the bearish scenario for a squeeze up towards 6,880 and even 7,020.
Nasdaq 100 – Double Top bearish breakdown neckline acting as key resistance
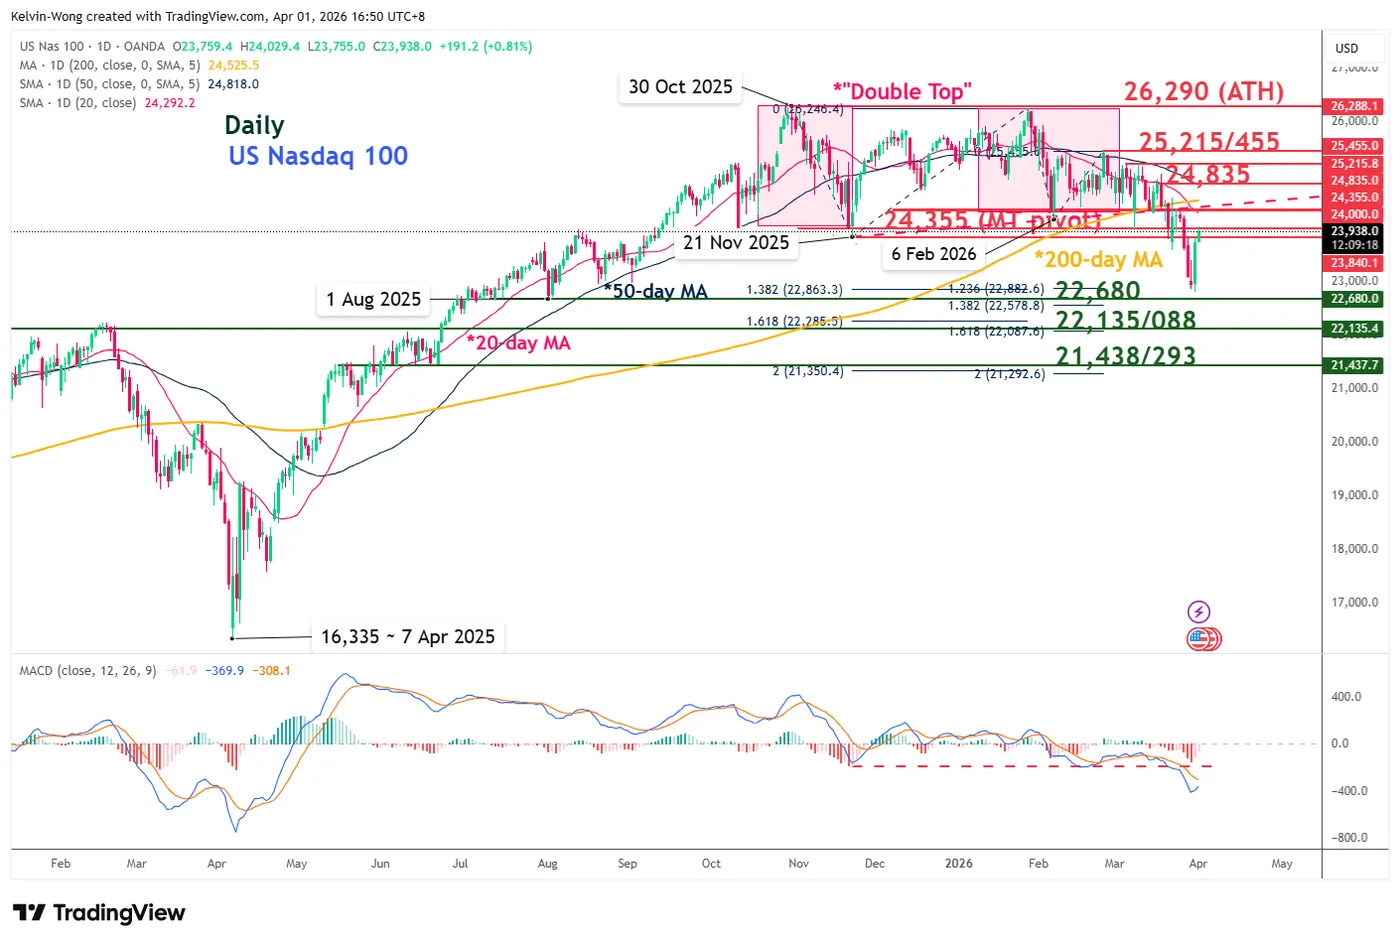
Fig. 6: US Nasdaq 100 CFD index medium-term trend as of 1 Apr 2026 (Source: TradingView)
The current price actions of the US Nasdaq 100 CFD index (a proxy of the Nasdaq 100 E-mini futures) are still trading below the “Double Top” bearish breakdown neckline and 200-day moving average.
The daily MACD trend indicator is still showing no clear signs of a trend change as it continues to hover below the centreline.
Watch the 24,355 key medium-term pivotal resistance, and a break below 22,680 increases the odds of another potential bearish impulsive down move sequence to expose the next medium-term supports at 22,135/22,088 and 21,438/21,293 (see Fig. 6).
On the flip side, a clearance above 24,355 invalidates the bearish scenario for a squeeze up towards 24,835 and 25,215/25,455.
Dow Jones (DJIA) – Resting below the intersection point of the 20-day MA bearish crossover below the 200-day MA
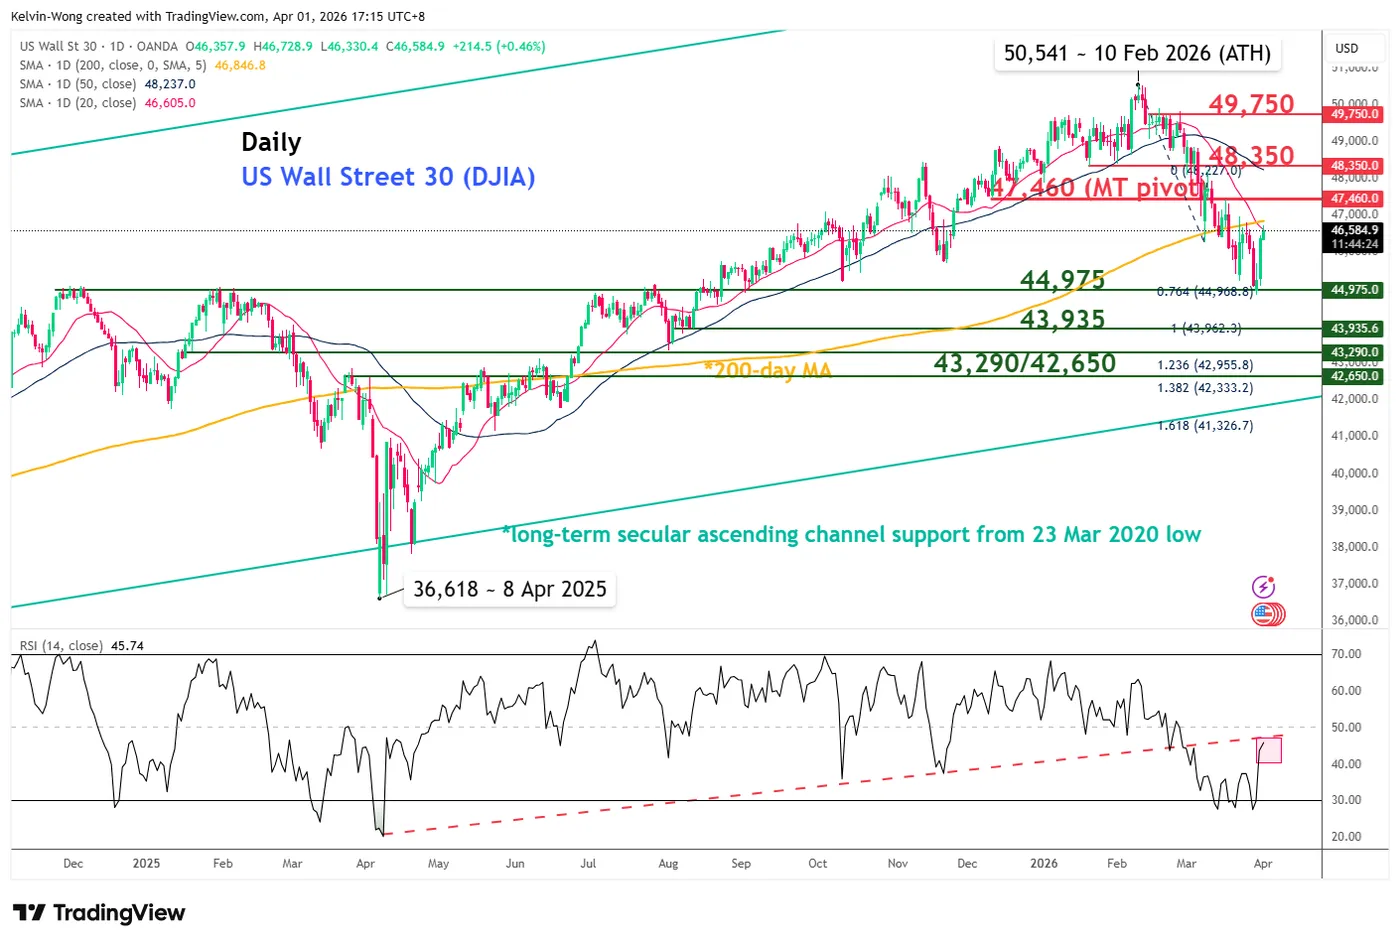
Fig. 7: US Wall Street 30 CFD index medium-term trend as of 1 Apr 2026 (Source: TradingView)
The rallies seen in the US Wall Street 30 CFD index (a proxy of the Dow Jones Industrial Average E-mini futures in the past three sessions have led its price actions to rest just below its 20-day and 200-day moving averages (see Fig. 7).
In addition, the 20-day moving average has flashed out a bearish crossover condition below the key 200-day moving average.
Watch the 47,460 key medium-term pivotal resistance, and a break below 44,975 increases the odds of another potential bearish impulsive down move sequence to expose the next medium-term supports at 43,935 and 43,290/42,935 (see Fig. 6).
On the flip side, a clearance above 47,460 invalidates the bearish scenario for a squeeze up towards 48,350 and 49,750.
Trump’s Comments Have Triggered a Market Reversal
- Expectations of peace in the Middle East are leading to a sell-off in the US dollar.
- Gold is the main beneficiary of the conflict’s resolution.
And the last shall be first. EURUSD bulls have launched a counterattack following Donald Trump’s announcement that the conflict in the Middle East would be resolved within 2–3 weeks. The US President called on the Gulf states to take back their oil, forcibly opening the Strait of Hormuz.
The White House’s willingness to withdraw from the region fits well with the TACO strategy — Trump Always Changes His Mind — which investors have adopted since April 2025, when tough initial tariffs were followed by reductions and delays, triggering a rally in stock indices and weakening the dollar.
History is repeating itself, so a rally of more than 1.3% in EURUSD looks logical, as investors are betting on a fall in Brent and an improvement in global risk appetite. In this scenario, the global economy will suffer less than if the conflict were to drag on, and signs of a slowdown in US GDP should soften the Fed’s stance in the coming months.
The outlook for Europe is also changing. In March, the eurozone CPI jumped from 1.9% to 2.5% due to food and energy prices, but hopes have risen in the last day that the acceleration in consumer prices may be temporary. Without a tightening of monetary policy, the currency bloc’s economy will manage to avoid a recession and begin to recover gradually, whilst falling oil and gas prices will improve expectations for the trade balance. This is good news for the euro.
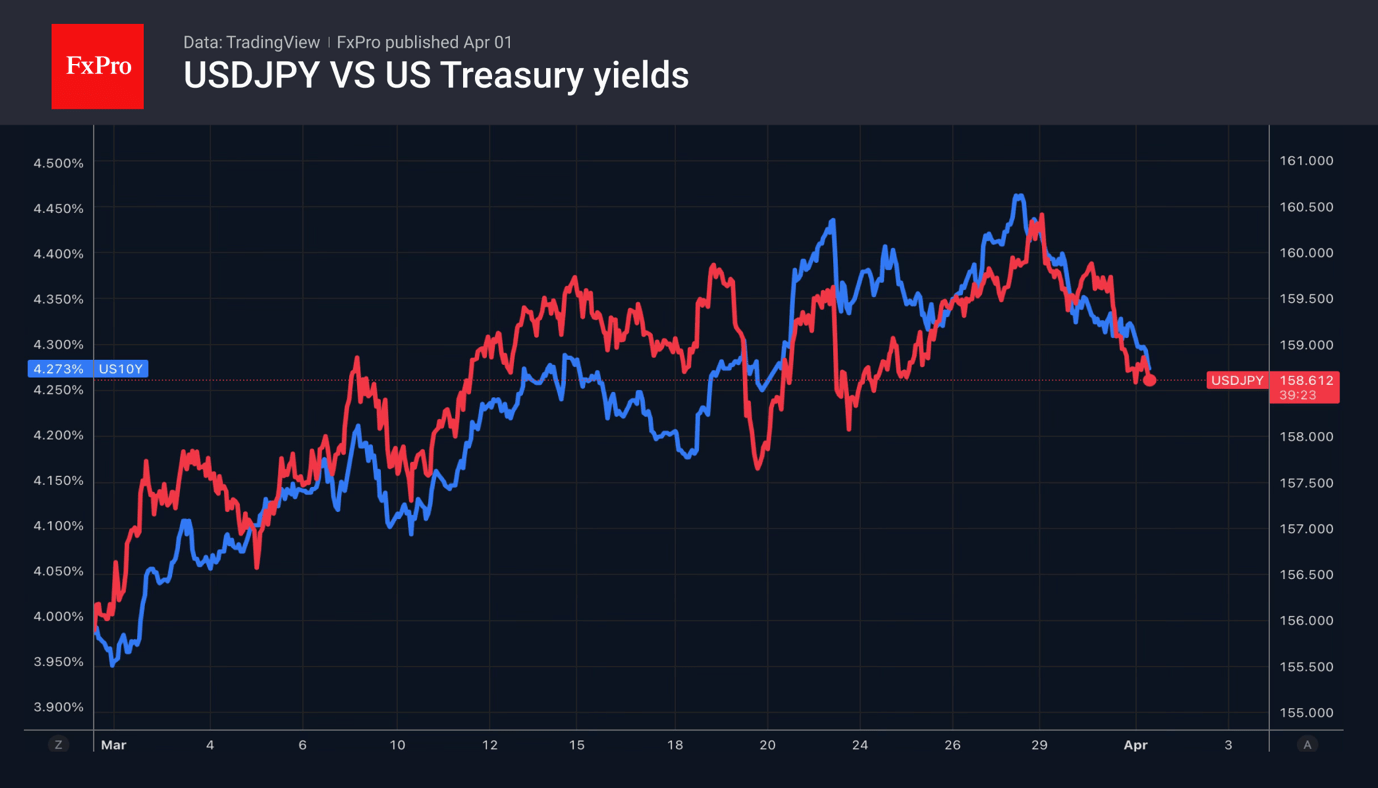
The fall in the dollar and US Treasury yields allowed USDJPY bears to mount a counterattack. The Japanese Ministry of Finance was ready to act on all fronts, including the currency and commodity markets. Verbal interventions have cooled speculators who had built up net short positions on the yen to a two-month high.
Gold could be the main beneficiary of the imminent end to the armed conflict in the Middle East. The precious metal is poised to rise above $4,700 per ounce amid speculative reaction to Donald Trump’s comments. Previously, it was actively sold off by both central banks to secure the liquidity needed to support their economies and by investors to meet margin calls on shares and bonds.
Nevertheless, investors and traders should remain cautious, as the US administration has on more than one occasion played the role of the ‘good cop’ in falling markets and the ‘bad cop’ when markets are closed.
Gold Rises as Geopolitical Risk Premium Fades
Gold prices rose more than 4% on Wednesday, approaching 4,690 USD per ounce amid signs of easing tensions in the Middle East. Expectations of de-escalation could lead to lower oil prices and reduced concerns about further tightening of central bank policy.
Donald Trump stated he was ready to end the conflict with Iran even with the Strait of Hormuz partially closed. Separately, reports emerged that Iranian President Masoud Pezeshkian may consider ending the conflict under certain conditions.
However, the rise in gold remains constrained. Reducing geopolitical risks diminishes demand for safe-haven assets, while a strong dollar and elevated government bond yields continue to pressure the metal.
In March, gold lost more than 13%-its steepest monthly decline since October 2008. The precious metal now remains approximately 19% below its January highs. Going forward, its dynamics will depend on US macroeconomic data and Federal Reserve signals on interest rates.
Technical Analysis
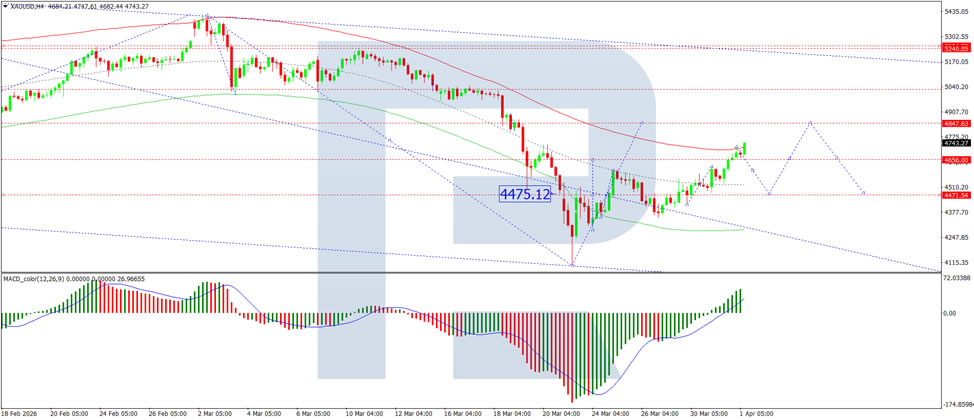
On the H4 XAU/USD chart, the market is forming a consolidation range around the 4,656 USD level. An upside breakout would open potential for a correction to 4,848 USD. A downside breakout could see the beginning of a downward wave to 4,750 USD. The MACD indicator confirms the current momentum, with its signal line above the centre line and pointing strictly upwards.
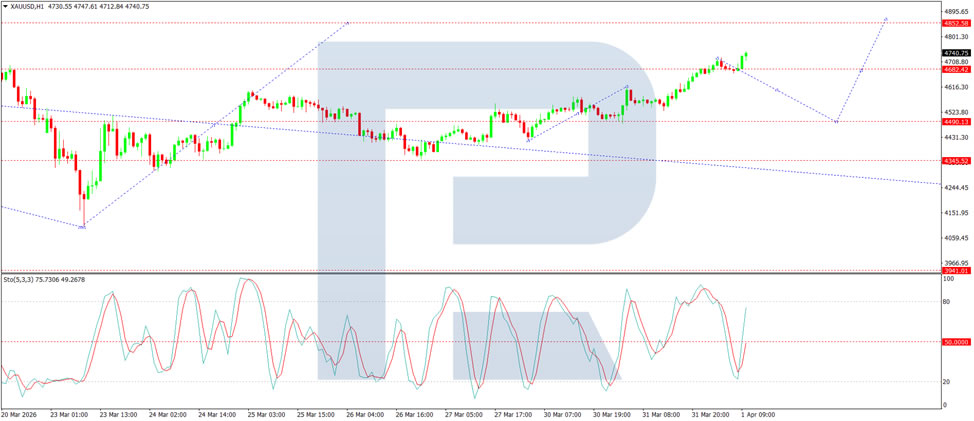
On the H1 chart, the market has broken above the 4,682 USD level and is forming a wave towards 4,855 USD. Looking ahead, a corrective move back to 4,490 USD will be considered, followed by an expected rise to 4,900 USD. The Stochastic oscillator supports this scenario, with its signal line remaining above the 20 level and showing upward pressure towards 80.
Conclusion
Gold's sharp rally reflects growing market optimism over a potential de-escalation in the Middle East, with signals from both US and Iranian leadership suggesting a possible path toward ending the conflict. However, the metal's upside remains capped by the corresponding decline in safe-haven demand, alongside persistent headwinds from a strong dollar and high bond yields. Having suffered its worst monthly loss since 2008 in March, gold now faces a pivotal moment where further gains will likely depend on whether easing geopolitical tensions translate into a sustained shift in central bank policy expectations. Technical indicators point to near-term upside, though the broader trend remains fragile.
Crypto: A Rebound Amid Extreme Fear
Market Overview
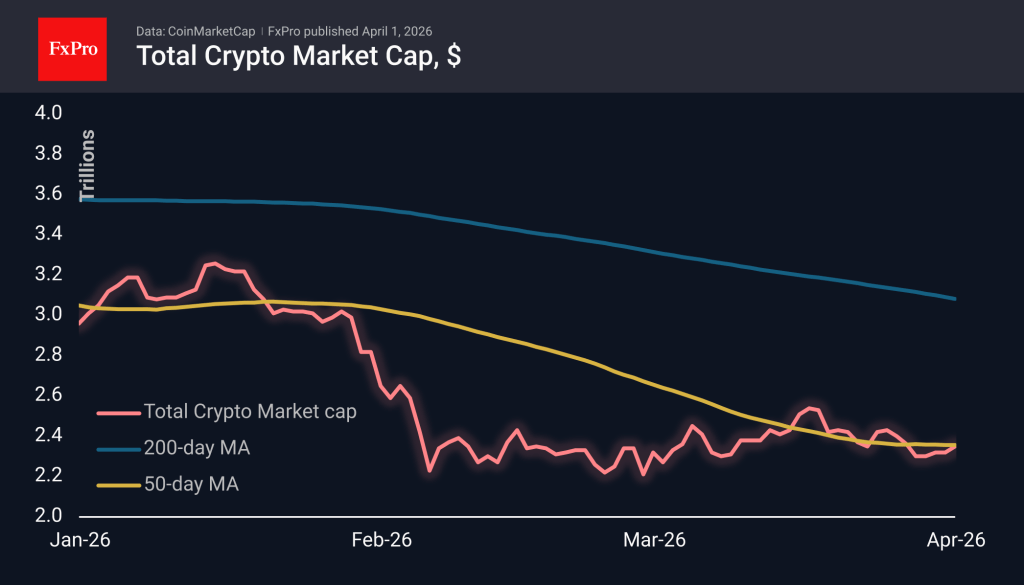
The crypto market capitalisation has increased by 1.3% to $2.35T over the past 24 hours, recovering to last Friday’s levels. This time, cryptocurrencies struggled to keep pace with equities, where technical oversold conditions, quarterly rebalancing, and positive signals regarding the US-Iran conflict coincided.
Algorand stands out as the day’s leader, gaining over 22% amidst general market stagnation, whilst Zcash and Neo showed more modest but noticeable growth of between 4% and 7%. TRON, Bitcoin Cash, and Toncoin, which lost less than 1.5%, stand out against the predominantly green market with this moderate decline.
In contrast to market dynamics, the Fear and Greed Index had fallen by 3 points to 8, remaining deep in the extreme fear zone. Over the past month, the index has barely left this zone, fluctuating between 8 and 14, but this time external factors are well-positioned to fuel demand for cryptocurrencies and support a rebound.
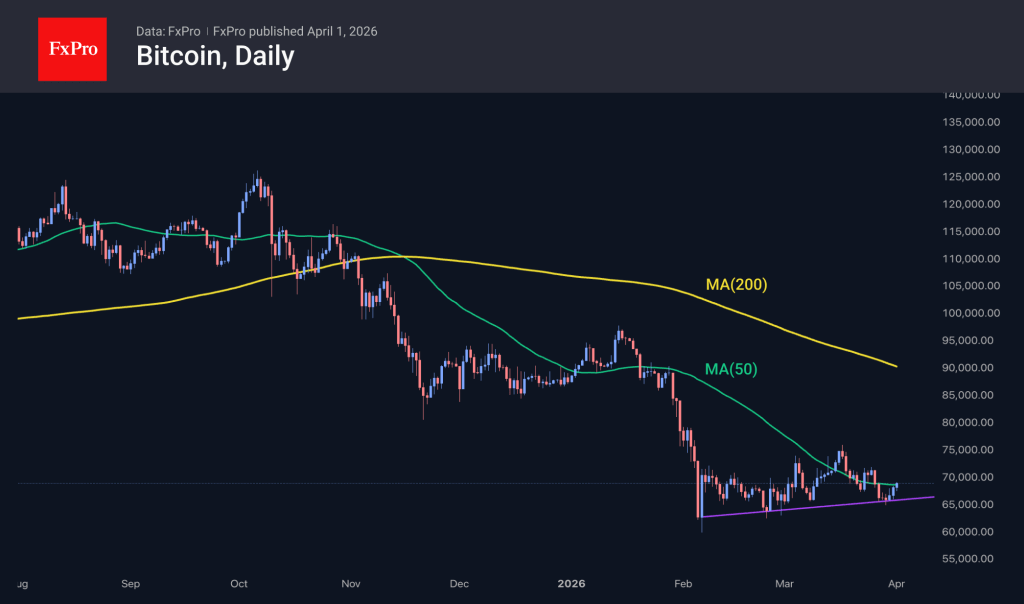
Bitcoin is trading at $68.4K, up around 1.5% over the past 24 hours, building on a rebound from recent lows around $60K, which held the support line of the uptrend over the last two months, and making a fresh attempt to break above the 50-day MA.
The start of April ranks among the top three months for BTC. Over the past 15 years, Bitcoin has ended this month with gains on ten occasions and declined only five. The average gain was 20.9%, while the average decline was 8.8%.
News Background
Investors are increasingly questioning Bitcoin’s value amid a lack of clear short-term growth drivers, said Ran Neuner, founder of the media platform Crypto Banter. He noted that defining the role of the first cryptocurrency in the market is becoming increasingly challenging.
According to Google analysts, quantum computers may be able to hack Bitcoin sooner than expected. A successful attack on the BTC network might require significantly less computing power than previously believed. Nearly a third of all existing Bitcoins could potentially become vulnerable.
Nakamoto, a company led by David Bailey, Donald Trump’s former cryptocurrency adviser, has sold part of its Bitcoin reserves (284 BTC) at a 40% loss. Nakamoto’s shares have fallen by 99% over the past year.
The US Department of Labour has suggested new rules for 401(k) pension plans. The department intends to allow the inclusion of alternative assets, including cryptocurrencies, thereby lifting the restrictions introduced in 2022.
Standard Chartered has seen stablecoin trading double over the past two years, mainly driven by Circle’s USDC. This growth could lessen the need for new stablecoin issuance, provided transaction volumes continue to increase.
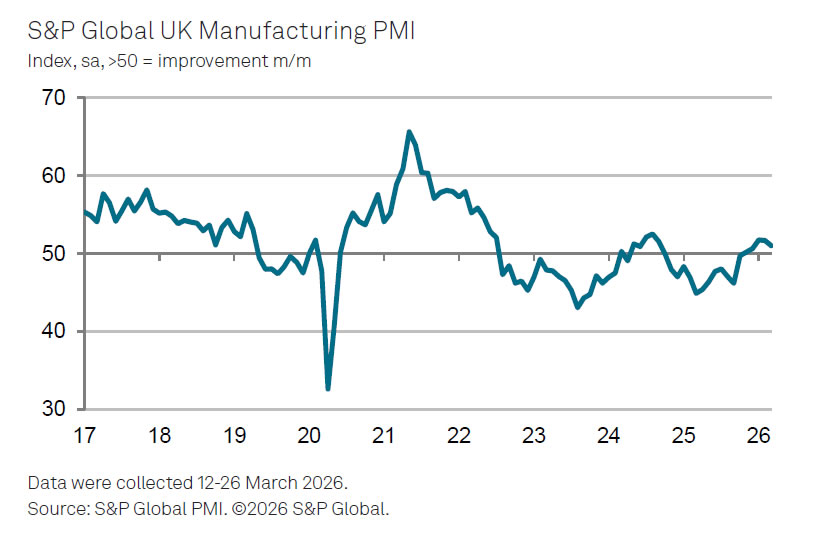
UK PMI Manufacturing Finalized at 51.0, Input Costs Surge and Confidence Drops
UK PMI Manufacturing was finalized at 51.0 in March, down from February's 51.4, signaling a modest slowdown in factory activity. The data suggests that while demand conditions are holding up, momentum in production is beginning to soften amid a more challenging operating environment.
According to Rob Dobson, Director at S&P Global Market Intelligence, the Middle East war is reshaping cost and supply dynamics. He noted that delivery times lengthened to the greatest extent since mid-2022, while input price inflation surged at the fastest pace since the aftermath of the UK’s ERM exit in 1992. The resulting high-cost environment, combined with input shortages, has started to weigh directly on production volumes.
Dobson also highlighted that the broader economic and geopolitical backdrop is denting confidence, with business optimism falling to a six-month low and job cuts accelerating to their fastest pace since last September. However, he pointed out that new orders have held up better than output, suggesting that the weakness in production is currently driven more by supply constraints than a collapse in demand, leaving the outlook sensitive to how long cost pressures persist.
Eurozone PMI Manufacturing Finalized at 45-Month High But War-Fueled Inflation Clouds Outlook
Eurozone PMI Manufacturing was finalized at 51.6 in March, up from 50.8, marking a 45-month high and signaling continued, albeit modest, expansion in the sector.
However, according to Joe Hayes, Principal Economist at S&P Global Market Intelligence, the Middle East war has already begun to leave a clear imprint on the sector. He noted that suppliers’ delivery times have risen sharply as logistics adjust to maritime disruption, while surging oil prices have pushed input cost inflation to its highest level since late 2022.
Hayes also highlighted that firms have started passing these higher costs through to customers, "reducing the Eurozone's competitiveness and this will likely put demand under renewed pressure."
Despite steady output and order growth, Hayes emphasized that expansions remain "tepid" and vulnerable. He warned that it may not take much for output and sales to turn lower, particularly if the conflict persists and cost pressures intensify.