Sample Category Title
Crypto Market Has Lost 3% But Has Not Broken Through Support
Market Overview
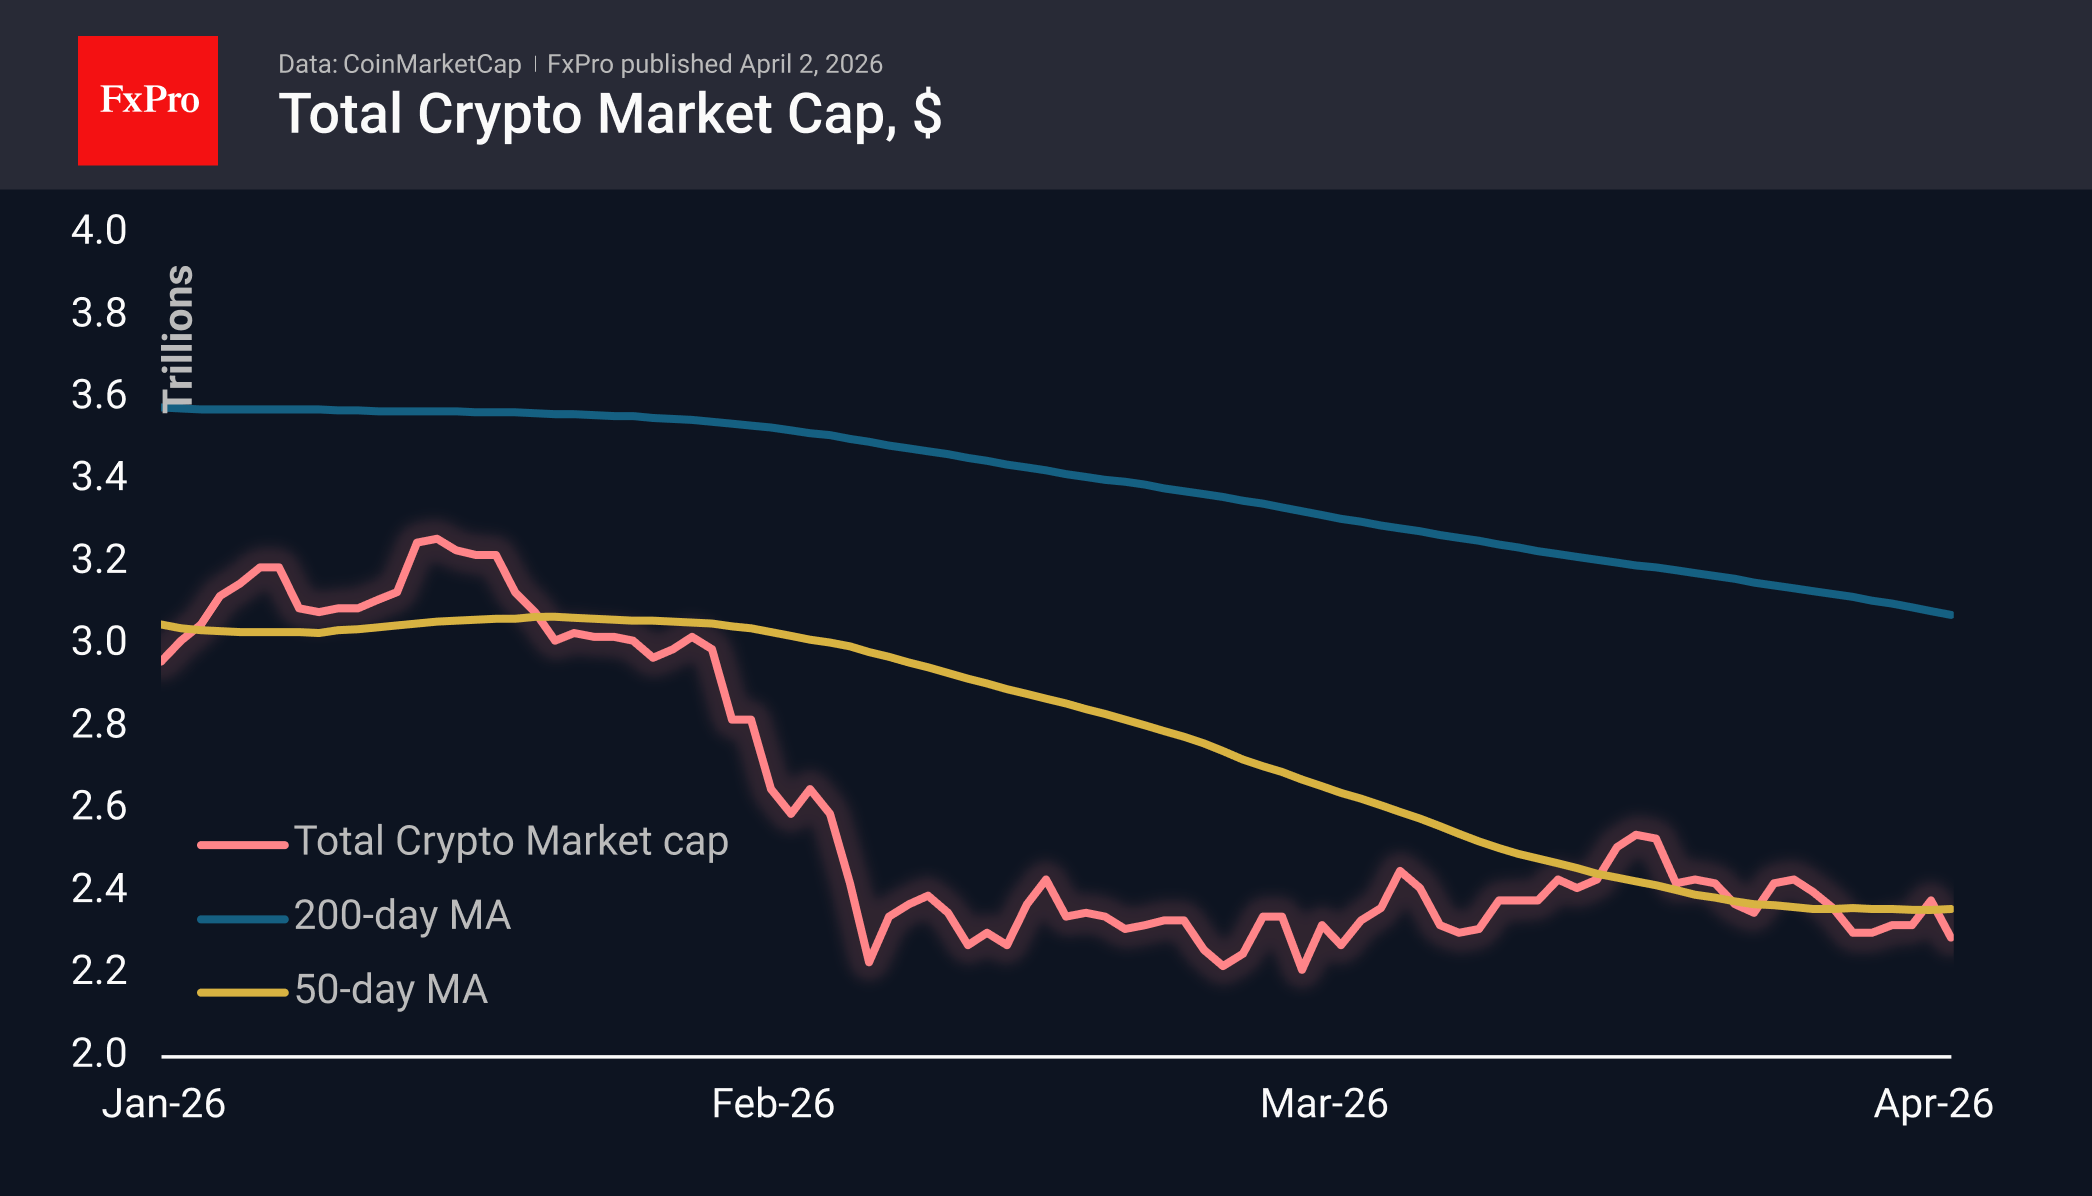
The crypto market has lost approximately 3% of its market capitalisation, falling back to $2.29T and returning to the lower boundary of the trading range seen over the last seven days. Trump’s latest comments on the war with Iran triggered a sharp sell-off amid a lack of de-escalation signs. TRON (−0.2%), Toncoin (−0.9%) and Neo (−1.3%) appear relatively stable. Dash (−8.6%), Uniswap (−8.0%) and Solana (−5.9%) have been hit hardest.
The Fear and Greed Index rose by 4 points today to 12, partially recovering from yesterday’s drop to 8 — the lowest level in recent weeks. Nevertheless, the index remains deep in the extreme fear zone, where it has been virtually uninterrupted for the past month.
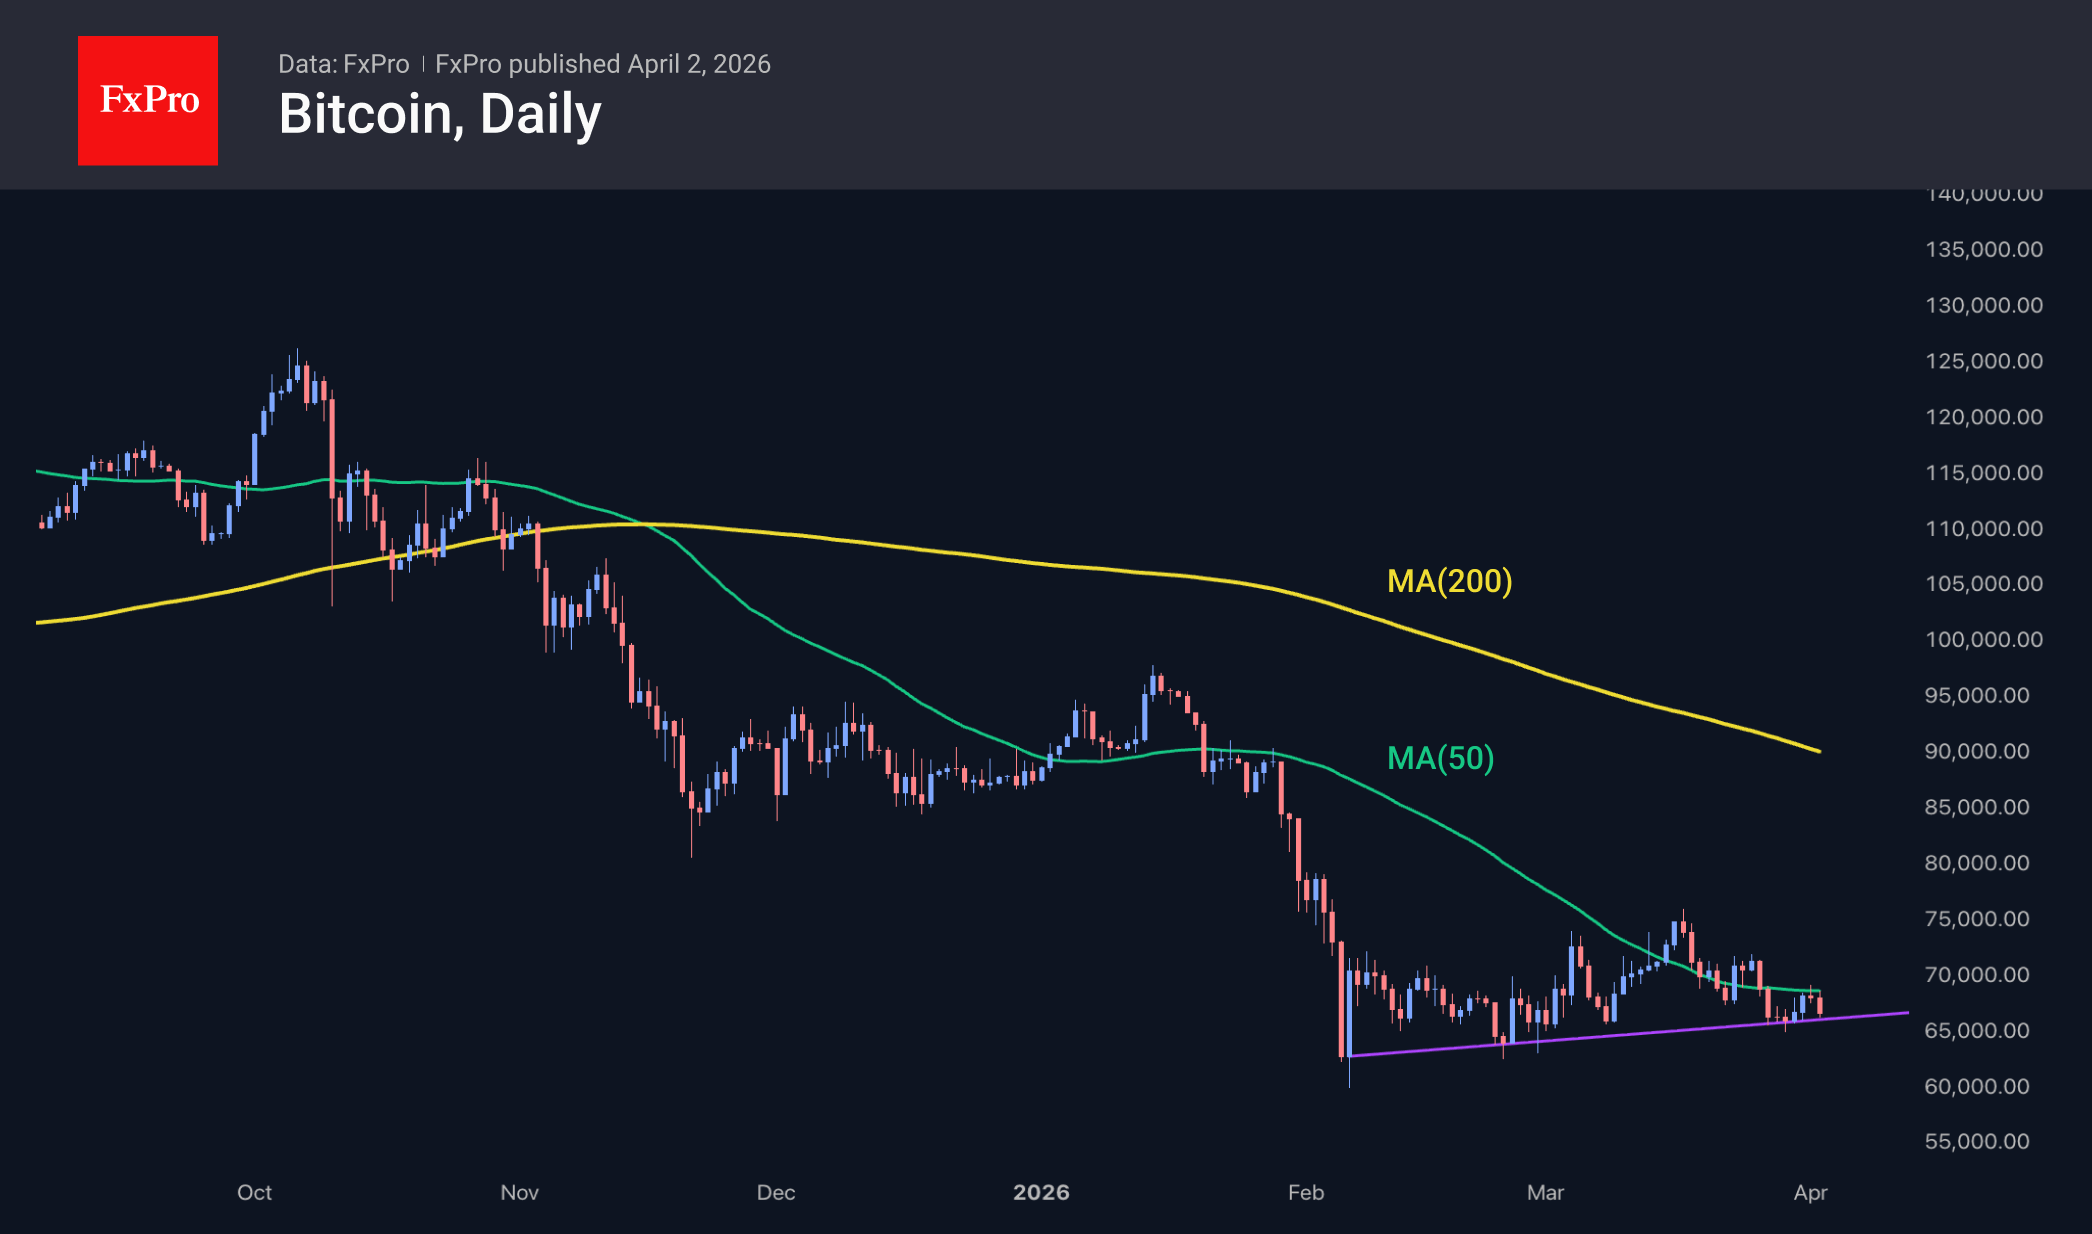
Bitcoin lost 2.8% over the day, returning to levels near $66.2K. Once again, the 50-day moving average acted as resistance, preventing the price from consolidating above it. The leading cryptocurrency quickly swung to the other extreme and is now testing the support of the uptrend. Key support ($66K) and resistance ($69K) levels are converging, bringing the moment of a definitive trend decision closer.
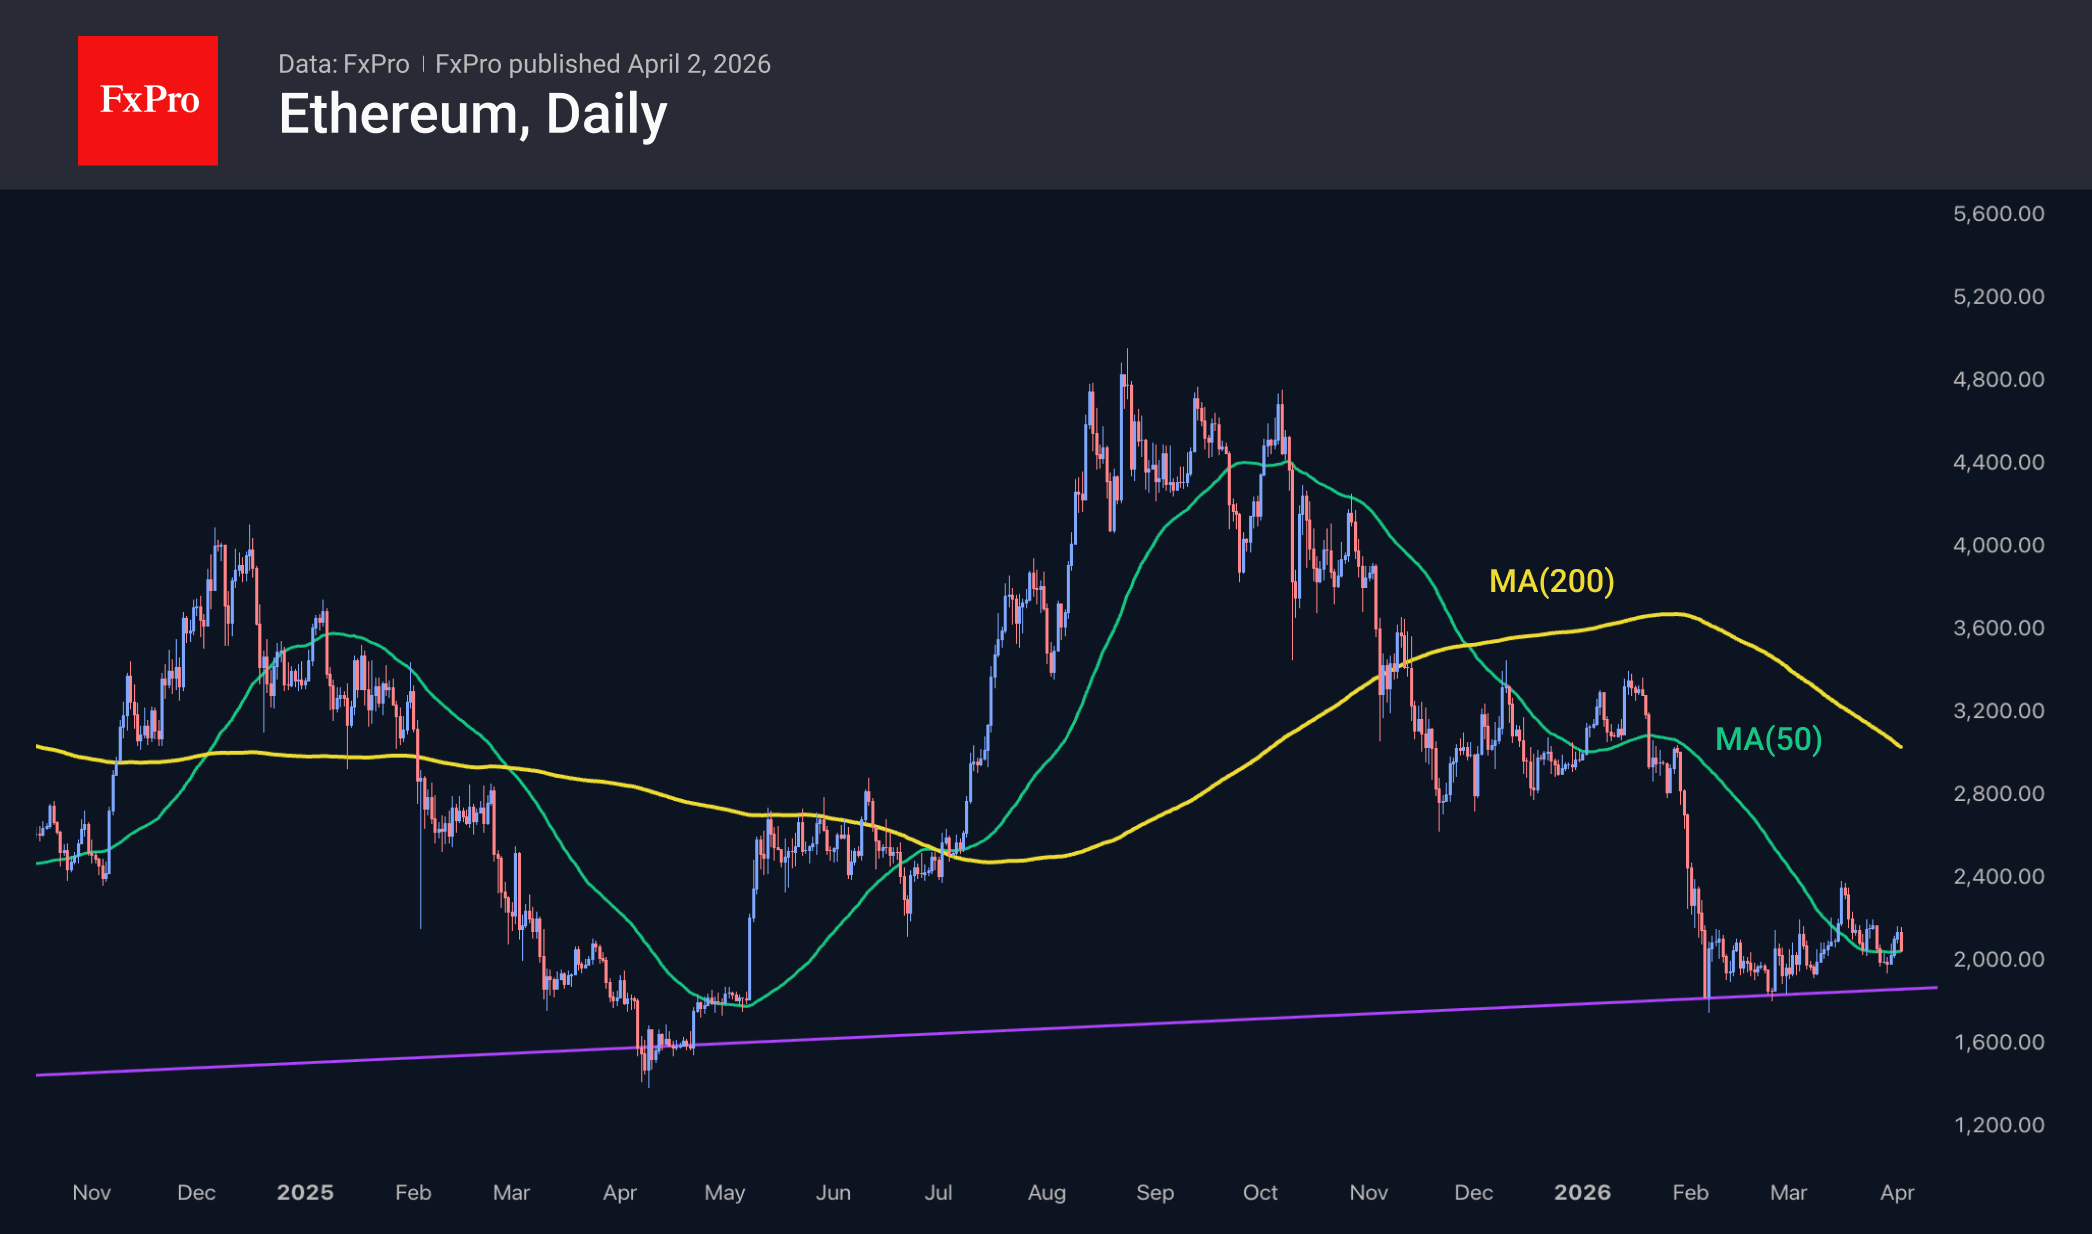
Ethereum looks slightly more confident, remaining above the $2K round figure, above the 50-day MA and the support line of the multi-year trend. Should pressure on the crypto market intensify, it will be worth monitoring whether the second-largest cryptocurrency can hold above $1.8K. A break below this level would be a significant bearish signal, potentially triggering sell-offs across a wider range of coins and bringing an end to the crypto market’s recent resilience to external threats.
News Background
The fall in Bitcoin during the current market cycle has been significantly less severe than in previous periods, notes Fidelity Digital Assets. While February saw a potential bottom for the current cycle around $60K, this represents a decline of just 52% from the peak, rather than 80–90% as previously seen.
The gap between BTC’s spot and realised prices has narrowed from 120% at the end of 2024 to the current 21%, CryptoQuant points out. However, the asset needs to fall a further 20% to reach the accumulation zone where bottoms have historically formed. Other on-chain signals also indicate that the decline is not yet over.
Canadian mining company Bitfarms has announced a change in strategy and a rebrand under the new name Keel Infrastructure. The company plans to relocate its headquarters to the US and focus on developing infrastructure for artificial intelligence.
The CLARITY Act, a bill on the structure of the crypto market, is unlikely to be passed, as the US Senate will fail to secure the necessary number of votes, said Anthony Scaramucci, managing partner at SkyBridge Capital. According to him, the key obstacle remains the requirement to secure the support of at least 60 senators.
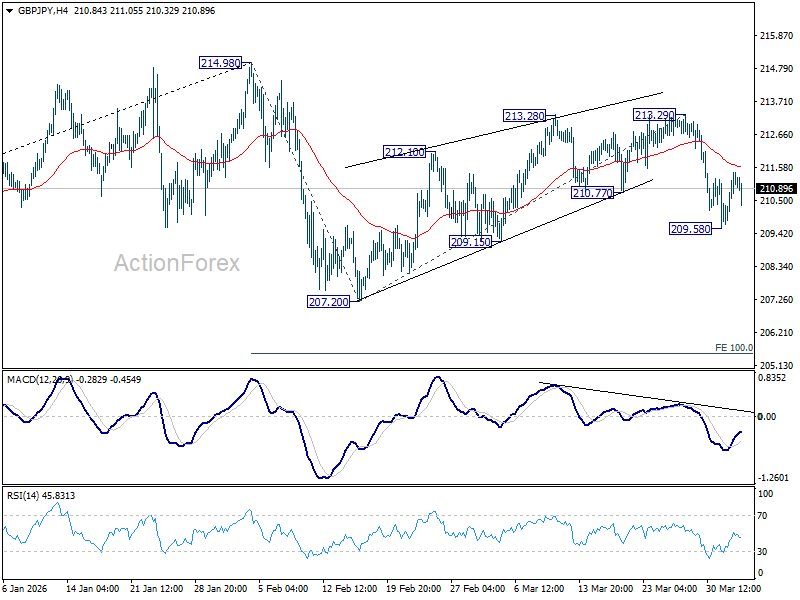
GBP/JPY Daily Outlook
Daily Pivots: (S1)210.26; (P) 210.88; (R1) 211.92; More...
Intraday bias in GBP/JPY is turned neutral with current recovery, and some consolidations could be seen. Risk will stay on the downside as long as 213.29 resistance holds. Corrective pattern from 214.98 should be in the third leg. Brea of 209.15 will target 207.20 and below.
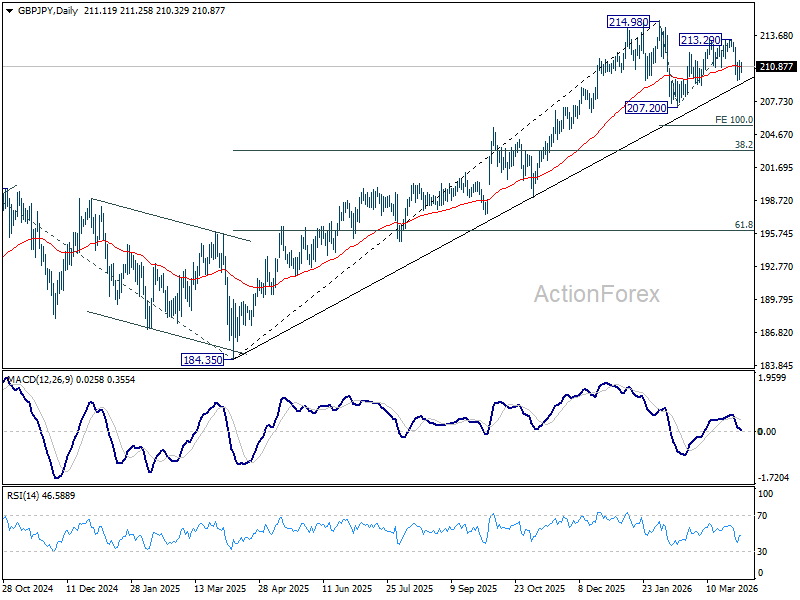
In the bigger picture, up trend from 123.94 (2020 low) is still in progress. Firm break of 214.98 will target 61.8% projection of 148.93 (2022 low) to 208.09 (2024 high) from 184.35 at 220.90. This will remain the favored case as long as 55 W EMA (now at 203.13) holds, even in case of another deep pullback.
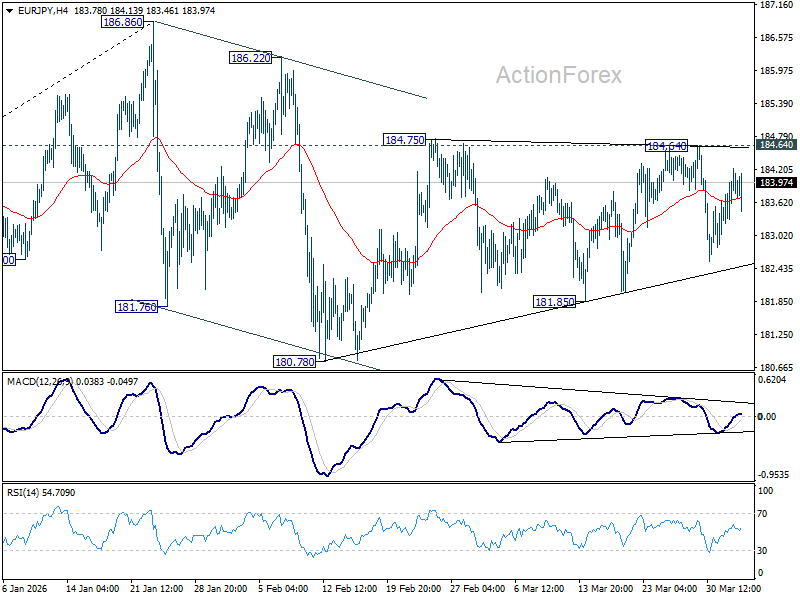
EUR/JPY Daily Outlook
Daily Pivots: (S1) 183.48; (P) 183.89; (R1) 184.48; More...
Intraday bias in EUR/JPY stays neutral as sideway trading continues. On the downside, firm break of 181.85 support should confirm that the correction from 186.86 is already in the third leg. Deeper fall should be seen to 180.78 and below. For now, risk will stay on the downside as long as 184.86 resistance holds.
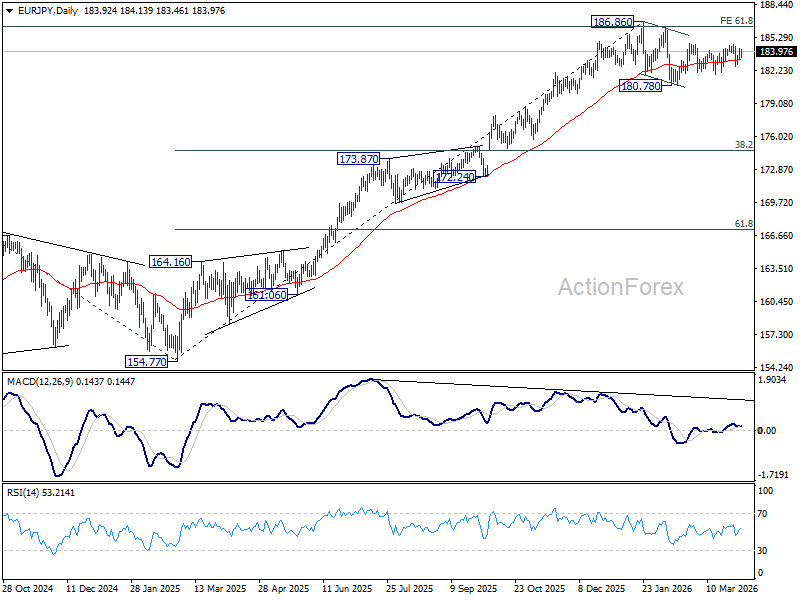
In the bigger picture, a medium term top could be in place at 186.86 and some more consolidations would be seen. Nevertheless, as long as 55 W EMA (now at 175.93) holds, the larger up trend from 114.42 (2020 low) remains intact. Firm break of 186.86 will pave the way to 78.6% projection of 124.37 (2022 low) to 175.41 (2025 high) from 154.77 at 194.88 next.
EUR/GBP Daily Outlook
Daily Pivots: (S1) 0.8696; (P) 0.8720; (R1) 0.8737; More…
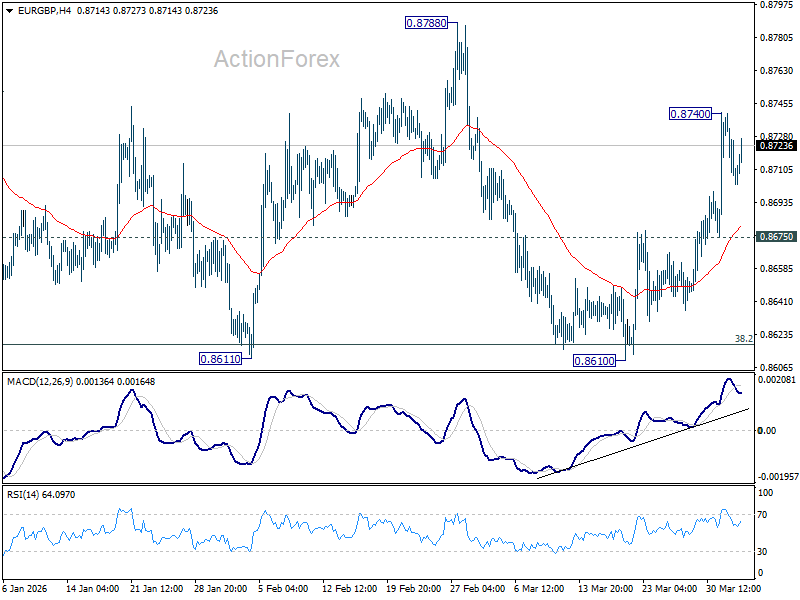
Intraday bias in EUR/GBP is turned neutral first with current retreat, and further rally remains in favor. On the upside, above 0.8740 will resume the rebound from 0.8610 short term bottom to 0.8788 resistance next. However, break of 0.8675 will bring retest of 0.8610 low instead.
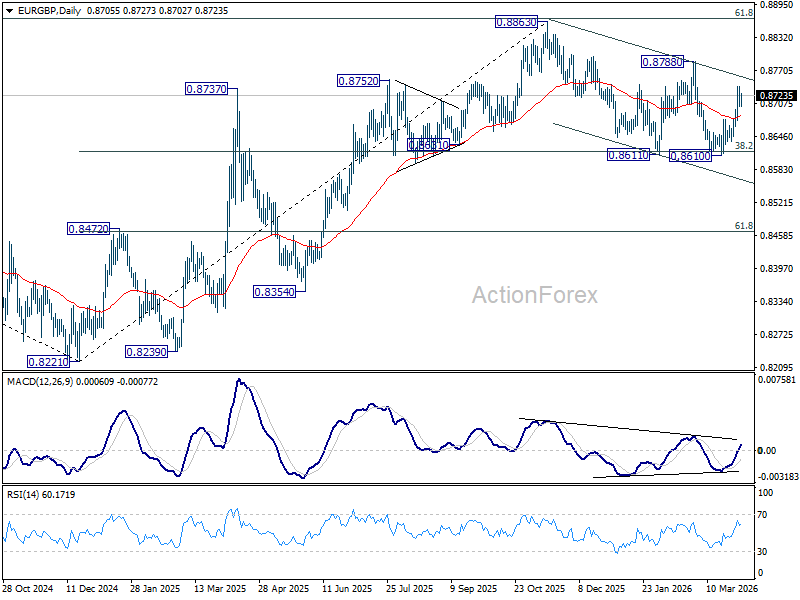
In the bigger picture, strong support was seen again from 38.2% retracement of 0.8821 to 0.8863 at 0.8618. Break of 0.8788 resistance will argue that larger rise from 0.8221 might be resume to resume through 0.8863. Nevertheless, sustained trading below 0.8618 should confirm reversal, and bring deeper fall to 61.8% retracement at 0.8466 at least.
EUR/AUD Daily Outlook
Daily Pivots: (S1) 1.6668; (P) 1.6757; (R1) 1.6833; More...
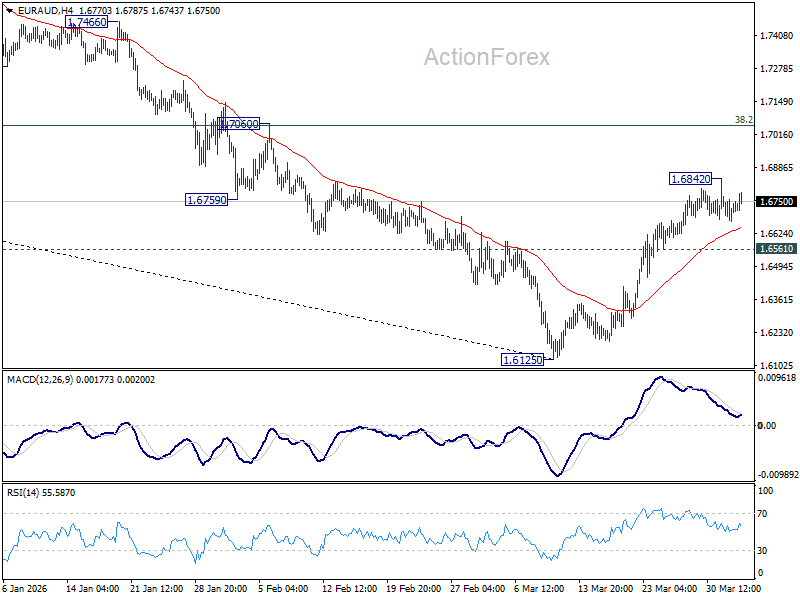
Intraday bias in EUR/AUD remains neutral for the moment and more consolidations could be seen first. On the upside, above 1.6842 will extend the rebound from 1.6125 to 38.2% retracement of 1.8554 to 1.6125 at 1.7053. However, break of 1.6561 minor support will argue that the rebound fro 1.6125 has completed, after rejection by 55 D EMA (now at 1.6752). Retest of 1.6125 low should be seen next.
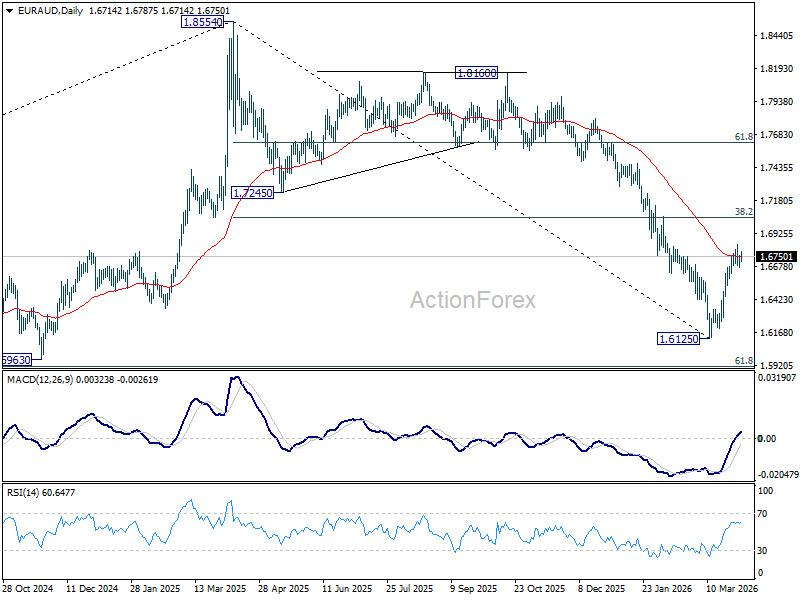
In the bigger picture, fall from 1.8554 medium term top is seen as reversing the whole up trend from 1.4281 (2022 low). Deeper decline should be seen to 61.8% retracement of 1.4281 to 1.8554 at 1.5913, which is slightly below 1.5963 structural support. Decisive break there will pave the way back to 1.4281. For now, risk will stay on the downside as long as 55 W EMA (now at 1.7226) holds, even in case of strong rebound.
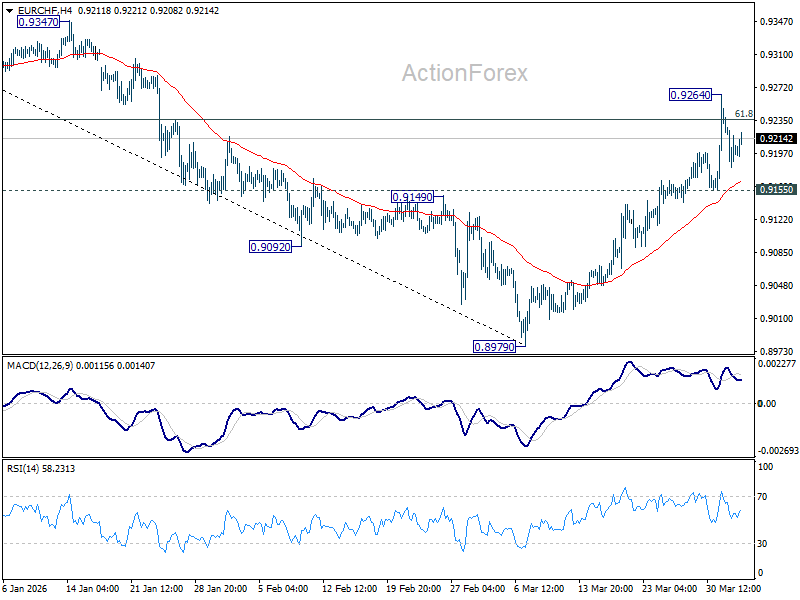
EUR/CHF Daily Outlook
Daily Pivots: (S1) 0.9173; (P) 0.9216; (R1) 0.9249; More....
Intraday bias in EUR/CHF is turned neutral first with current retreat. On the upside, sustained trading above 61.8% retracement of 0.9394 to 0.8979 at 0.9235 will pave the way to 0.9394 key resistance next. However, break of 0.9155 support will turn bias back to the downside for 0.8979 low.
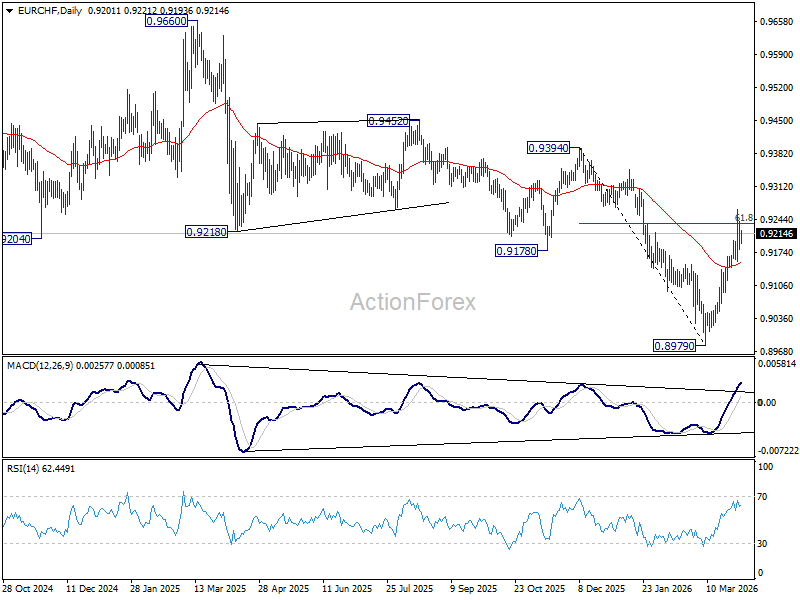
In the bigger picture, as long as 55 W EMA (now at 0.9286) holds, the larger down trend from 0.9928 (2024 high) is still expected to continue through 0.8979 at a later stage. However, sustained break of 55 W EMA should confirm medium term bottoming, and bring stronger rise through 0.9394 resistance, even as a corrective move.
Risks of Escalation are High
Markets
It was April fool’s day after all. US President Trump pulled a Trump. Talking the (stock) market up from the sell-off lows only to make space for another blow. Rumours and suggestions of ending the war against Iran while leaving the Strait of Hormuz blocked triggered a short squeeze in riskier assets earlier this week even as those messages still conflicted with what is happening on the ground. Markets found their Easter egg when the US President addressed the nation during a speech last night. Again, the writing was on the wall in a series of social media posts shortly after US trading got started. It didn’t prevent key US equity indices from another 0.5%-1.15% gains yesterday. Gains which have been blasted away in futures trading by now (-2%). The core of the matter: Trump tried to sell to the American people why they went to war in the first place and made the case for more and stronger action against Iran in the next 2-3 weeks. He threatened to destroy all of the country’s infrastructure, including its oil facilities and electric power production, unless Iran agrees to a deal. He showed no intention whatsoever for leaving the Middle-East without control over the Strait of Hormuz. Brent crude (June contract) spiked from around $100/b to $107 and sets its eye on the contract high at $110. The fog of war is thick and erring on the side of caution going into the long Easter weekend remains our preferred scenario. Risks of escalation are high. US Treasuries drop back to Monday’s levels this morning. At the front end because of central bank reaction functions, at the long end because of rising risk premia. US T’s already underperformed yesterday as amongst others due to a batch of consensus-beating US eco data. The US economy added 62k jobs in March according to the private sector ADP employment report. Headline retail sales rose by 0.6% M/M, be it in February. Growth in the control group, proxy for consumption in GDP calculation, also beat consensus at 0.5% M/M (vs 0.3%). The March manufacturing ISM rose from 52.4 to 52.7, the best level since August 2022. Details were less encouraging though. The pace of new order growth slowed with the order backlog declining as well. Both continue to point to expanding activity though, but new uncertainty over the Iran war in combination with very large price increases over the last few months don’t bode well for coming months. The survey’s price index jumped from a lofty 70.5 in February to 78.3, also the highest since 2022. All commodity prices in the survey (24) were reported up with 25% of them reported in short supply. The head of the ISM survey said that the impact of the Iran war is more pronounced because it’s on top of other stuff (chaotic tariff environment). On FX markets, the dollar rebounded together with the oil price. EUR/USD’s attempt to regain the 1.16 figure failed (currently 1.1535).
News & Views
The Trump administration is changing its steel and aluminum tariff regime in response to domestic companies calling it too complex to calculate the appropriate charges. The current 50% duty will remain in place for so called commodity-grade steel and aluminum products – goods that are made almost entirely made of the metals. A 25% levy would be applied to the entire value of a finished product (called derivative products) containing one or both of the commodities and would replace the earlier 50% that only applies to the steel or aluminum used. While the rate in the new system will be lower in many cases, the net effect is that actual tariffs will end up higher than before the adjustment because of the larger calculation base. In other tariff news, the administration may announce today tariffs of as much as 100% on select pharmaceutical companies’ products that haven’t struck a deal with the White House to lower their prices.
The US Treasury yesterday said it would meet domestic and international insurance regulators to discuss the risks in private credit. The department said the objective is to “allow participants to survey recent market events, emerging risks, risk management practices and outlooks for the sector”. It highlights growing concern about the sector’s health after recent upheaval and the increasing intertwinement with the insurance sector. US life insurers for example have been investing in what are known as opaque, illiquid and often complex private credit products in search for higher returns while large private capital managers have been partnering up with insurers amongst others to manage their investment portfolios.
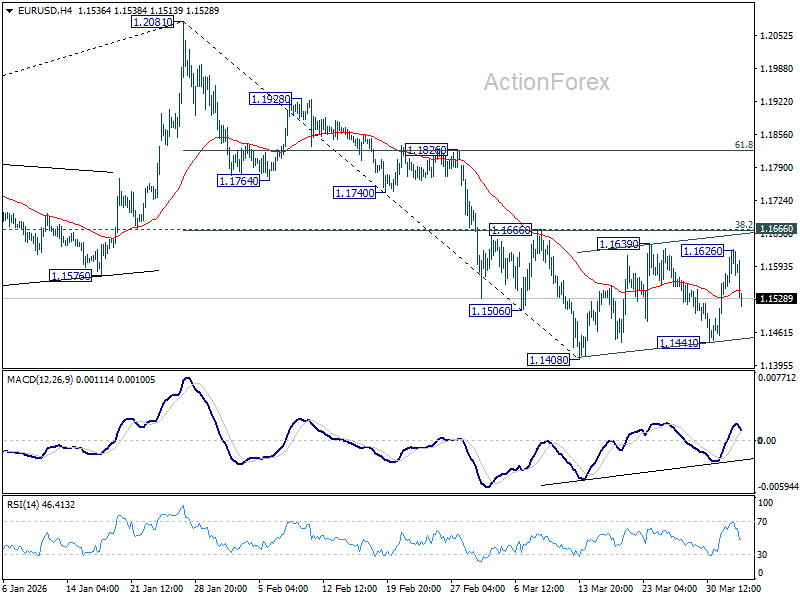
EUR/USD Daily Outlook
Daily Pivots: (S1) 1.1479; (P) 1.1521; (R1) 1.1596; More….
EUR/USD's rebound stalled at 1.1626 and reversed, but it's still bounded in established range. Intraday bias stays neutral first. With 1.1666 cluster resistance (38.2% retracement of 1.2081 to 1.1408 at 1.1665) intact, further decline is expected. On the downside, firm break of 1.1408 will resume the fall from 1.2081 to 38.2% retracement of 1.0176 to 1.2081 at 1.1353. However, decisive break of 1.1666 will argue that the fall from 1.2081 has completed, and turn bias back to the upside for 61.8% retracement of 1.2081 to 1.1408 at 1.1824.
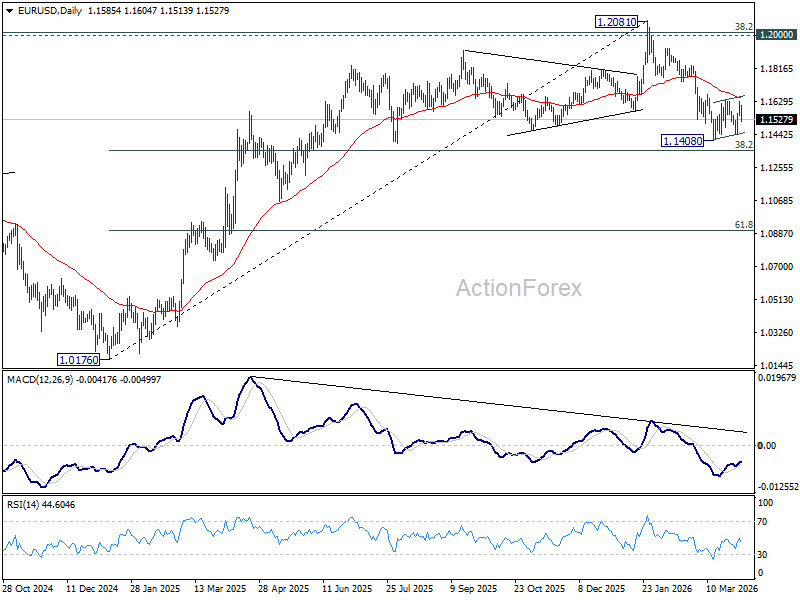
In the bigger picture, prior break of 55 W EMA (now at 1.1497) should confirm rejection by 1.2 key cluster resistance level. The whole up trend from 0.9534 (2022 low) might have completed as a three wave corrective rise too. Deeper fall is expected to long term channel support (now at 1.0535). Meanwhile, risk will stay on the downside as long as 1.2081 holds, even in case of strong rebound.
USD/JPY Daily Outlook
Daily Pivots: (S1) 158.33; (P) 158.67; (R1) 159.12; More...
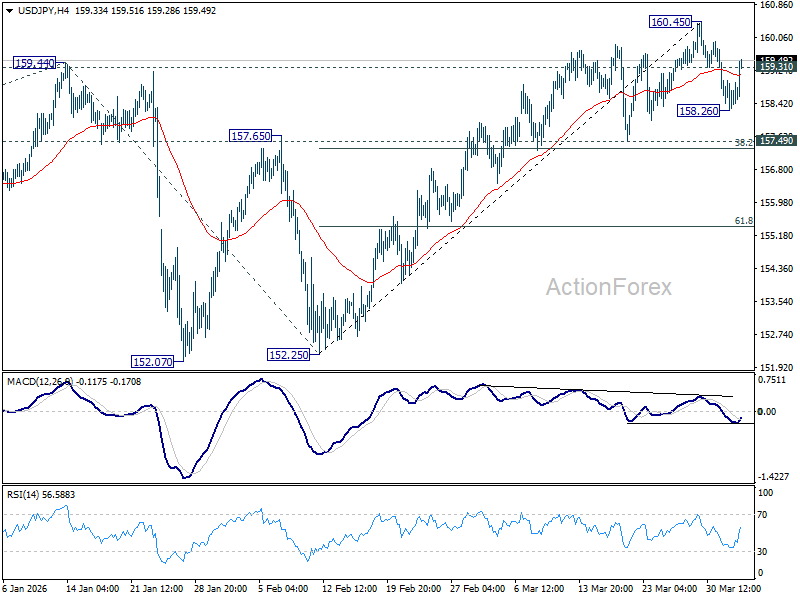
Intraday bias in USD/JPY is turned neutral first with break of 159.31 minor resistance. Consolidations from 160.45 could extend further with another falling leg. But overall outlook will remain bullish as long as 157.49 cluster support (38.2% retracement of 152.25 to 160.45 at 157.31) holds. Firm break of 160.45 will resume the rise from 152.25 to retest 161.94 high.
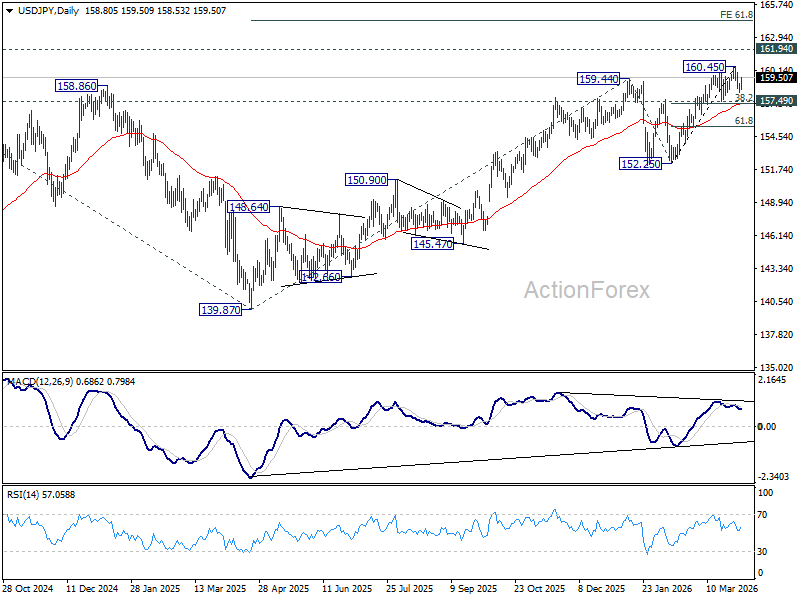
In the bigger picture, outlook is unchanged that corrective pattern from 161.94 (2024 high) should have completed with three waves at 139.87. Larger up trend from 102.58 (2021 low) could be ready to resume through 161.94. This will remain the favored case as long as 55 W EMA (now at 152.97) holds. Firm break of 161.94 will pave the way to 61.8% projection of 102.58 to 161.94 from 139.87 at 176.75.
GBP/USD Daily Outlook
Daily Pivots: (S1) 1.3235; (P) 1.3290; (R1) 1.3362; More...
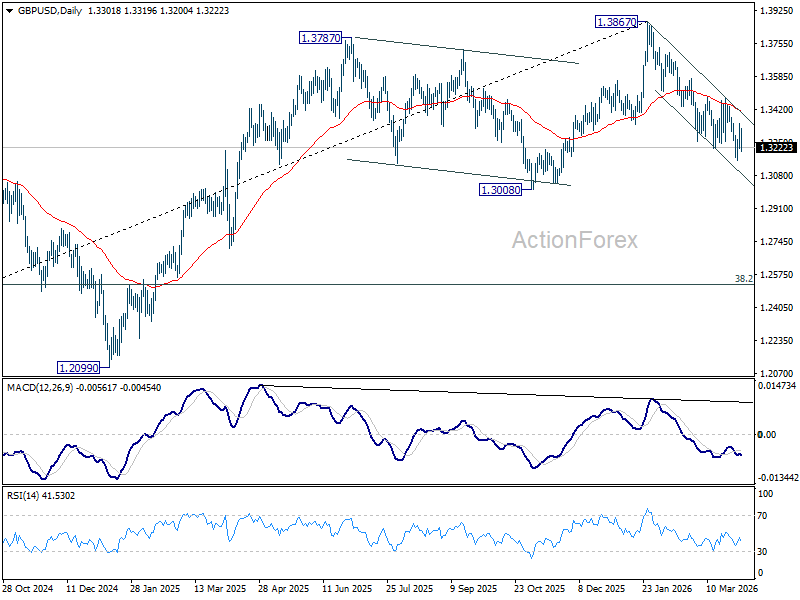
GBP/USD's rebound stalled at 1.3345 and reversed, but downside is contained above 1.3158 temporary low. Intraday bias remains neutral and further decline is in favor. Below 1.3158 will resume the fall from 1.3867 to 1.3008 structural support. However, firm break of 1.3479 will indicate that the fall from 1.3867 has completed, and turn bias back to the upside for stronger rally.
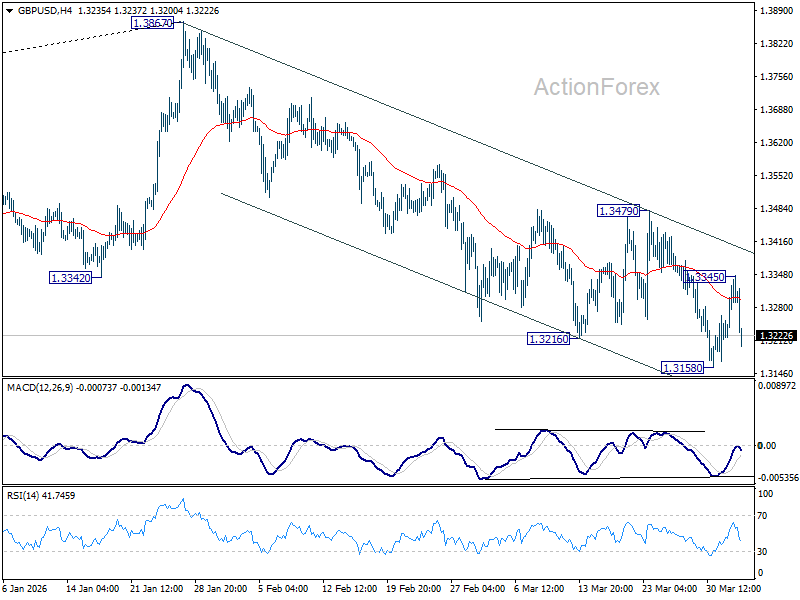
In the bigger picture, considering bearish divergence condition in both D and W MACD, a medium term top should be in place at 1.3867. Firm break of 1.3008 support will argue that fall from 1.3867 is at least correcting the rise from 1.0351 (2022 low) with risk of bearish reversal. That would open up further decline to 38.2% retracement of 1.0351 to 1.3867 at 1.2524. For now, medium term outlook will be neutral at best as long as 1.3867 resistance holds, or until further development.