Sample Category Title
Bank of England Initiates Stress Test In Aftermath of Liz Truss Budget Disaster
In a groundbreaking move, the Bank of England has called upon more than 50 financial institutions in the City to conduct a comprehensive stress test, simulating the repercussions of a sudden and drastic movement in bond prices. This initiative marks the first financial system-wide stress test of its kind, reflecting the central bank's proactive stance in assessing and fortifying the resilience of the financial sector.
The call for stress testing follows the turmoil experienced in bond markets and the sterling aftermath triggered by Liz Truss's mini-budget in September 2022. During this period, pension funds faced significant pressure, and some teetered on the brink of collapse. The pronounced shift in bond prices and corresponding interest rates underscored the inherent risks associated with specific forms of liability-driven investing (LDI), particularly concerning retirement savings.
This pivotal stress test, involving major players such as big banks, asset managers, hedge funds, pension funds, and major insurers, aims to evaluate how these entities would fare in the face of an unforeseen swing in bond prices. The participants are required to model and analyse the potential impacts on their operations, with results due to be shared with the central bank by January.
The stress test encompasses abrupt and sustained fluctuations in the value of both corporate bonds and sovereign debt, encompassing renowned government bonds like UK gilts. The Bank of England's scenario involves a 10-day-long "shock to rates and risky asset prices," combining multiple elements to simulate a comprehensive market disruption.
The scenario includes a notable shift in UK government borrowing costs akin to the LDI crisis, a corresponding alteration in other governments' debt prices matching the most significant rise witnessed this century, and an increase in corporate borrowing costs mirroring the "dash for cash" observed in March 2020.
While the specific triggers for such a severe shock remain unspecified by the Bank of England, the described scenario is comparable to the outbreak of a major war. The hypothetical situation involves a "sudden crystallisation of geopolitical tensions," disrupting global economic expectations, dominating headlines, and sparking widespread speculation about a potential financial sector meltdown on social media platforms.
Indicative pricing only
The Euro is up on the Pound this morning, after a momentary drop during the latter part of last week.
The central bank has meticulously outlined the cascading effects of this imagined scenario on the financial landscape. Key milestones include a potential sovereign credit rating downgrade for the UK by day 2, a mid-sized hedge fund collapse by day 4, and, by day 10, expectations of a recession surpassing the severity of the 2008 financial crisis.
This stress test underscores the Bank of England's commitment to assessing systemic risks and fortifying the financial sector against unforeseen challenges. In an era where non-bank institutions like asset managers and hedge funds play an increasingly influential role, the central bank's move signifies a broadened focus beyond traditional banks, aligning with the evolving dynamics of the financial landscape.
Importantly, the stress test results will not be used to single out vulnerable firms. Instead, the central bank aims to share systemic findings that apply across institutions, fostering a collaborative approach to enhancing the overall resilience of the financial system.
This article represents the opinion of the Companies operating under the FXOpen brand only. It is not to be construed as an offer, solicitation, or recommendation with respect to products and services provided by the Companies operating under the FXOpen brand, nor is it to be considered financial advice.
ECB’s de Guindos foresees temporary inflation rebound, December forecasts crucial for policy assessment
In a speech today, ECB Vice President Luis de Guindos said the central bank expects "a temporary rebound" in inflation in the coming months as base-effect drops out of calculations. However, he emphasized that ECB foresees the overall disinflationary process to continue over the medium term.
De Guindos highlighted the unpredictability surrounding energy prices due to geopolitical tensions and fiscal policy impacts, along with the potential upward pressure on food prices resulting from adverse weather events and the broader climate crisis.
Despite a marked decrease in inflation, de Guindos warned that it is expected to remain high for an extended period, with persistent domestic price pressures. "We will therefore ensure that our policy rates will be set at sufficiently restrictive levels for as long as necessary," he affirmed.
Emphasizing the ECB's data-dependent approach, de Guindos stated, "Our future decisions on policy rates will continue to be taken on a meeting-by-meeting basis." He added that the ECB's December meeting, armed with fresh macroeconomic projections and additional data, will be crucial for reassessing the inflation outlook and necessary policy actions.
Could Japanese GDP Print Reignite Tightening Expectations?
- GDP report for Q3 will be released on Wednesday 01.50 GMT
- Market feeling disappointed after recent BoJ gathering
- Yen crosses record new highs, ignore intervention threat
Market did not enjoy the last BoJ meeting
The recent Bank of Japan meeting failed to live up to its expectations despite the fact that Governor Ueda made another small step towards the targeted normalization. The famous yield curve control mechanism was updated with the 1% hard cap being transformed into a reference cap where the BoJ aims to conduct nimble operations. In essence, the 10-year Japanese yield is now allowed to trade above this level, with the BoJ looking ready to intervene forcefully when the pace of adjustment looks too aggressive for its liking.
Interestingly, the Policy Board’s median forecasts for core CPI were also upgraded. The projection for the fiscal year of 2024 increased to 2.8% from 1.9% at the July projections, with the core CPI print for the fiscal year of 2025 seen at a modest 1.7%. The 2025 figure is the reason why the BoJ has not moved more aggressively in its normalization process. Governor Ueda and his crew are looking for stronger signs that domestic demand could support the recent elevated inflation rates. And they assume that this could only happen if monetary policy remains extra supportive and wages continue to rise significantly.
In this context, Japan's UA Zensen Union, representing mostly manufacturing sector workers, has lodged a claim for a 6% wage hike for a second consecutive year, and one of Japan's biggest banks has increased its deposit rates for the first time in 12 years. This is probably music to the ears of the BoJ but not yet enough for the central bank to announce its first rate hike since 2007. Governor Ueda is looking for concrete signs that higher wages and rising prices are becoming embedded in the public’s mindset, and not seen as a one-off event driven by external factors.
Importantly, recent economic data has been on the positive side with the PMI surveys surprising on the upside and labor cash earnings showing a yearly increase of 1.2% in September. This might not look like much when compared to other developed nations’ figures, but these data prints are close to what the BoJ has been hoping for.
Key data releases this week
This week the market will be updated on the preliminary GDP print for the third quarter of 2023, following a very strong second quarter. The initial GDP figures from both the US and the UK managed to surprise on the upside, thus raising the possibility for a stronger print than the -0.1% QoQ penciled in now by market analysts. Similarly, lots of focus will be on the GDP price index, which in the previous quarter surpassed the 2015 high of 3.4%.
Equally important will be Thursday’s trade balance data for the month of October. The BoJ would be interested in any signs of a pick-up in imports that have been crashing from the 2022 highs, partly due to the drop in oil and gas prices.
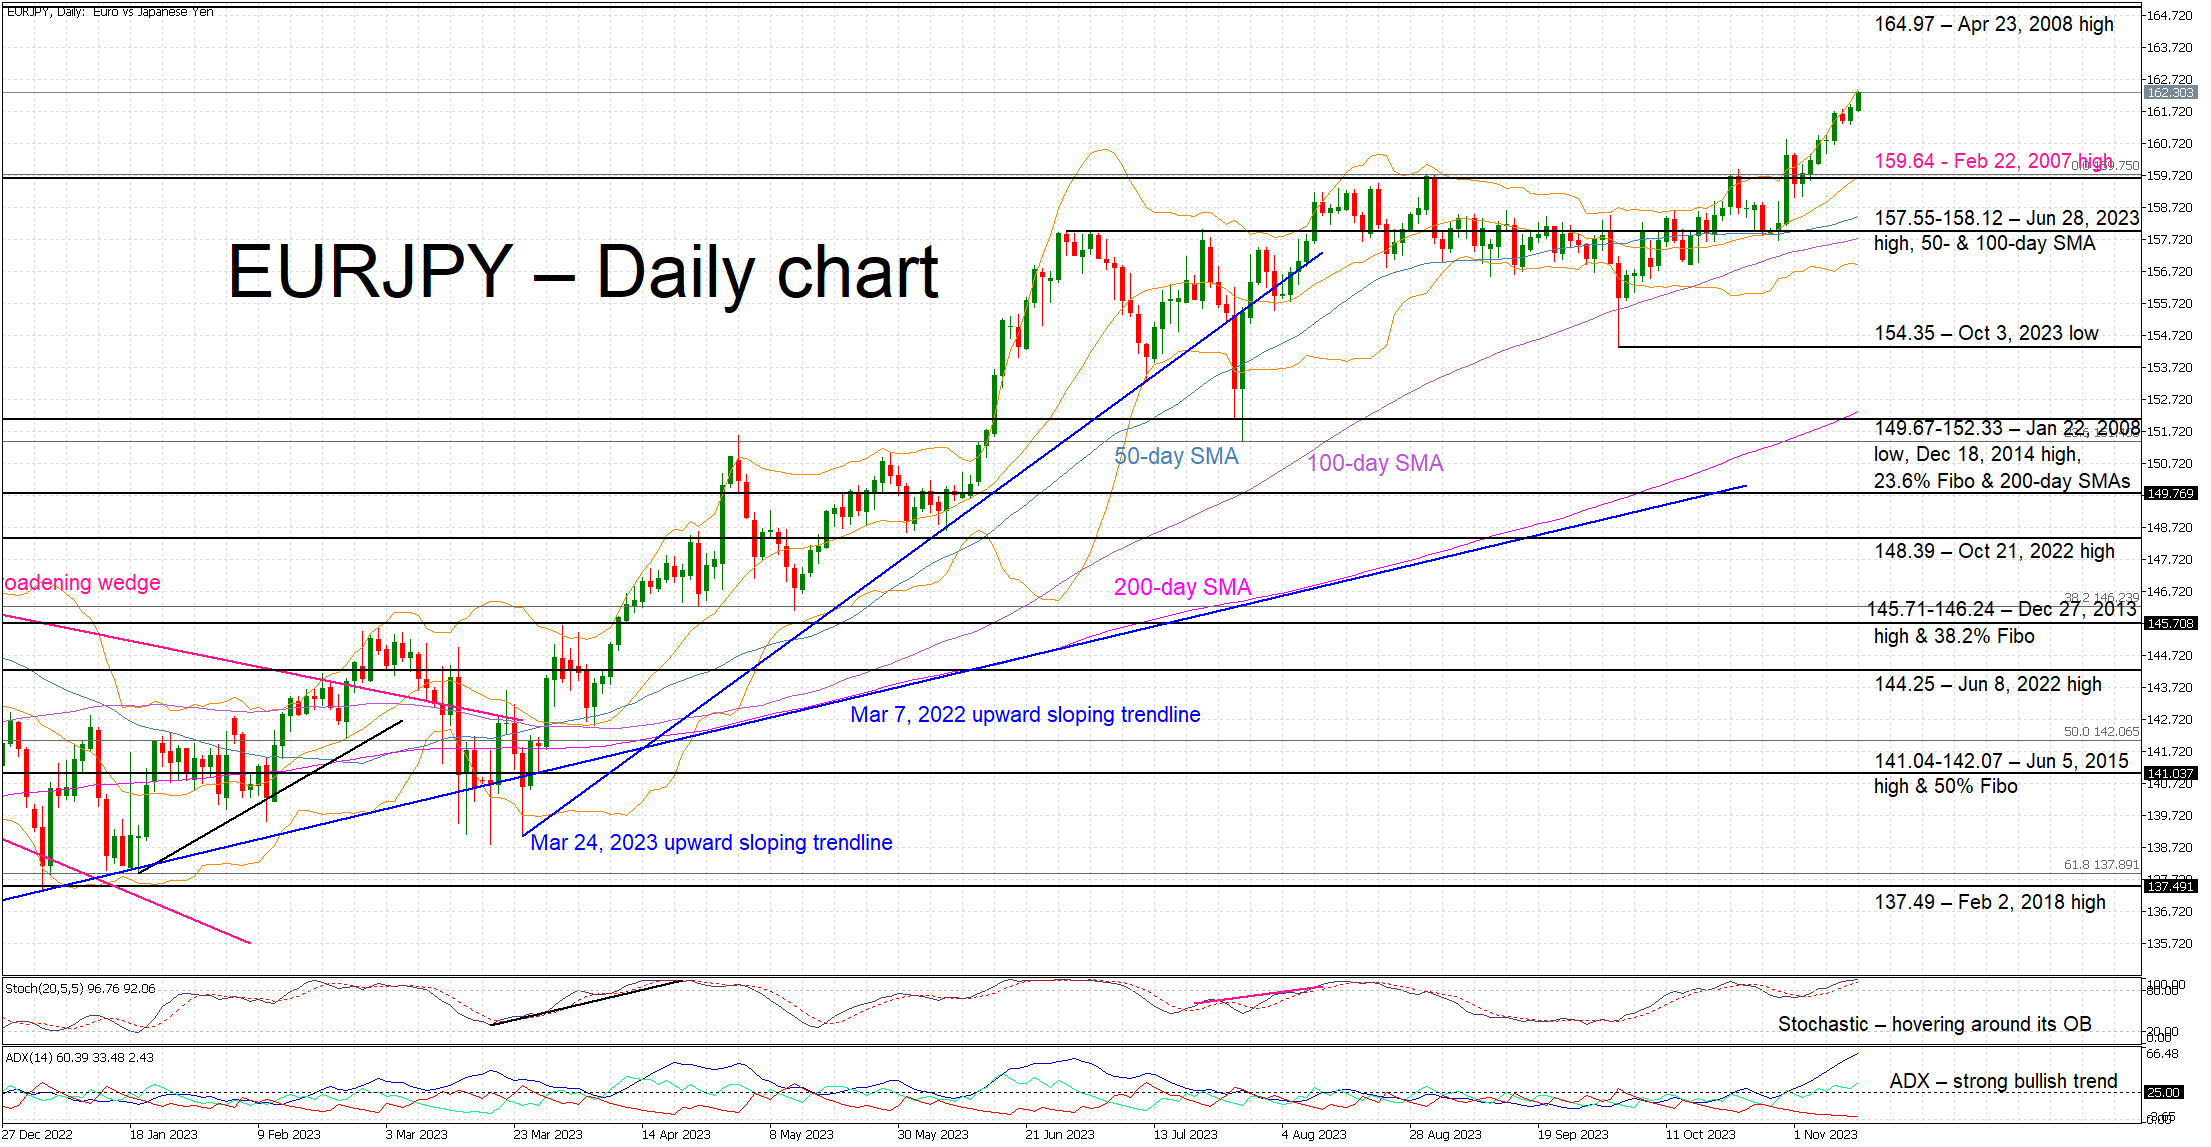
Euro-yen continues higher undaunted
The sky appears to be the limit for yen crosses. The recent disappointing BoJ meeting allowed the euro-yen bulls to stage another rally with the pair recording a new 2023 high and apparently setting course for the April 23, 2008 high at 164.97. The threat of intervention does not seem to trouble the euro bulls since Japanese authorities have up to now limited their reaction to just verbal intervention, possibly at the request of the BoJ.
Having said that, a positive set of figures, especially a stronger GDP print, could result in a bearish reaction with the bears potentially trying to reclaim the 159.64 level. However, this move will most likely prove short-lived. On the flip side, a plethora of weak data releases would satisfy the euro-yen bulls as they potentially continue to test the Japanese authorities’ patience.
Gold Tumbles But 200-day SMA Curbs Decline
- Gold extends its fall from the 5-month peak of 2,009
- Hits the crucial 200-day SMA, which holds strong for now
- Momentum indicators slowly tilt to the bearish side
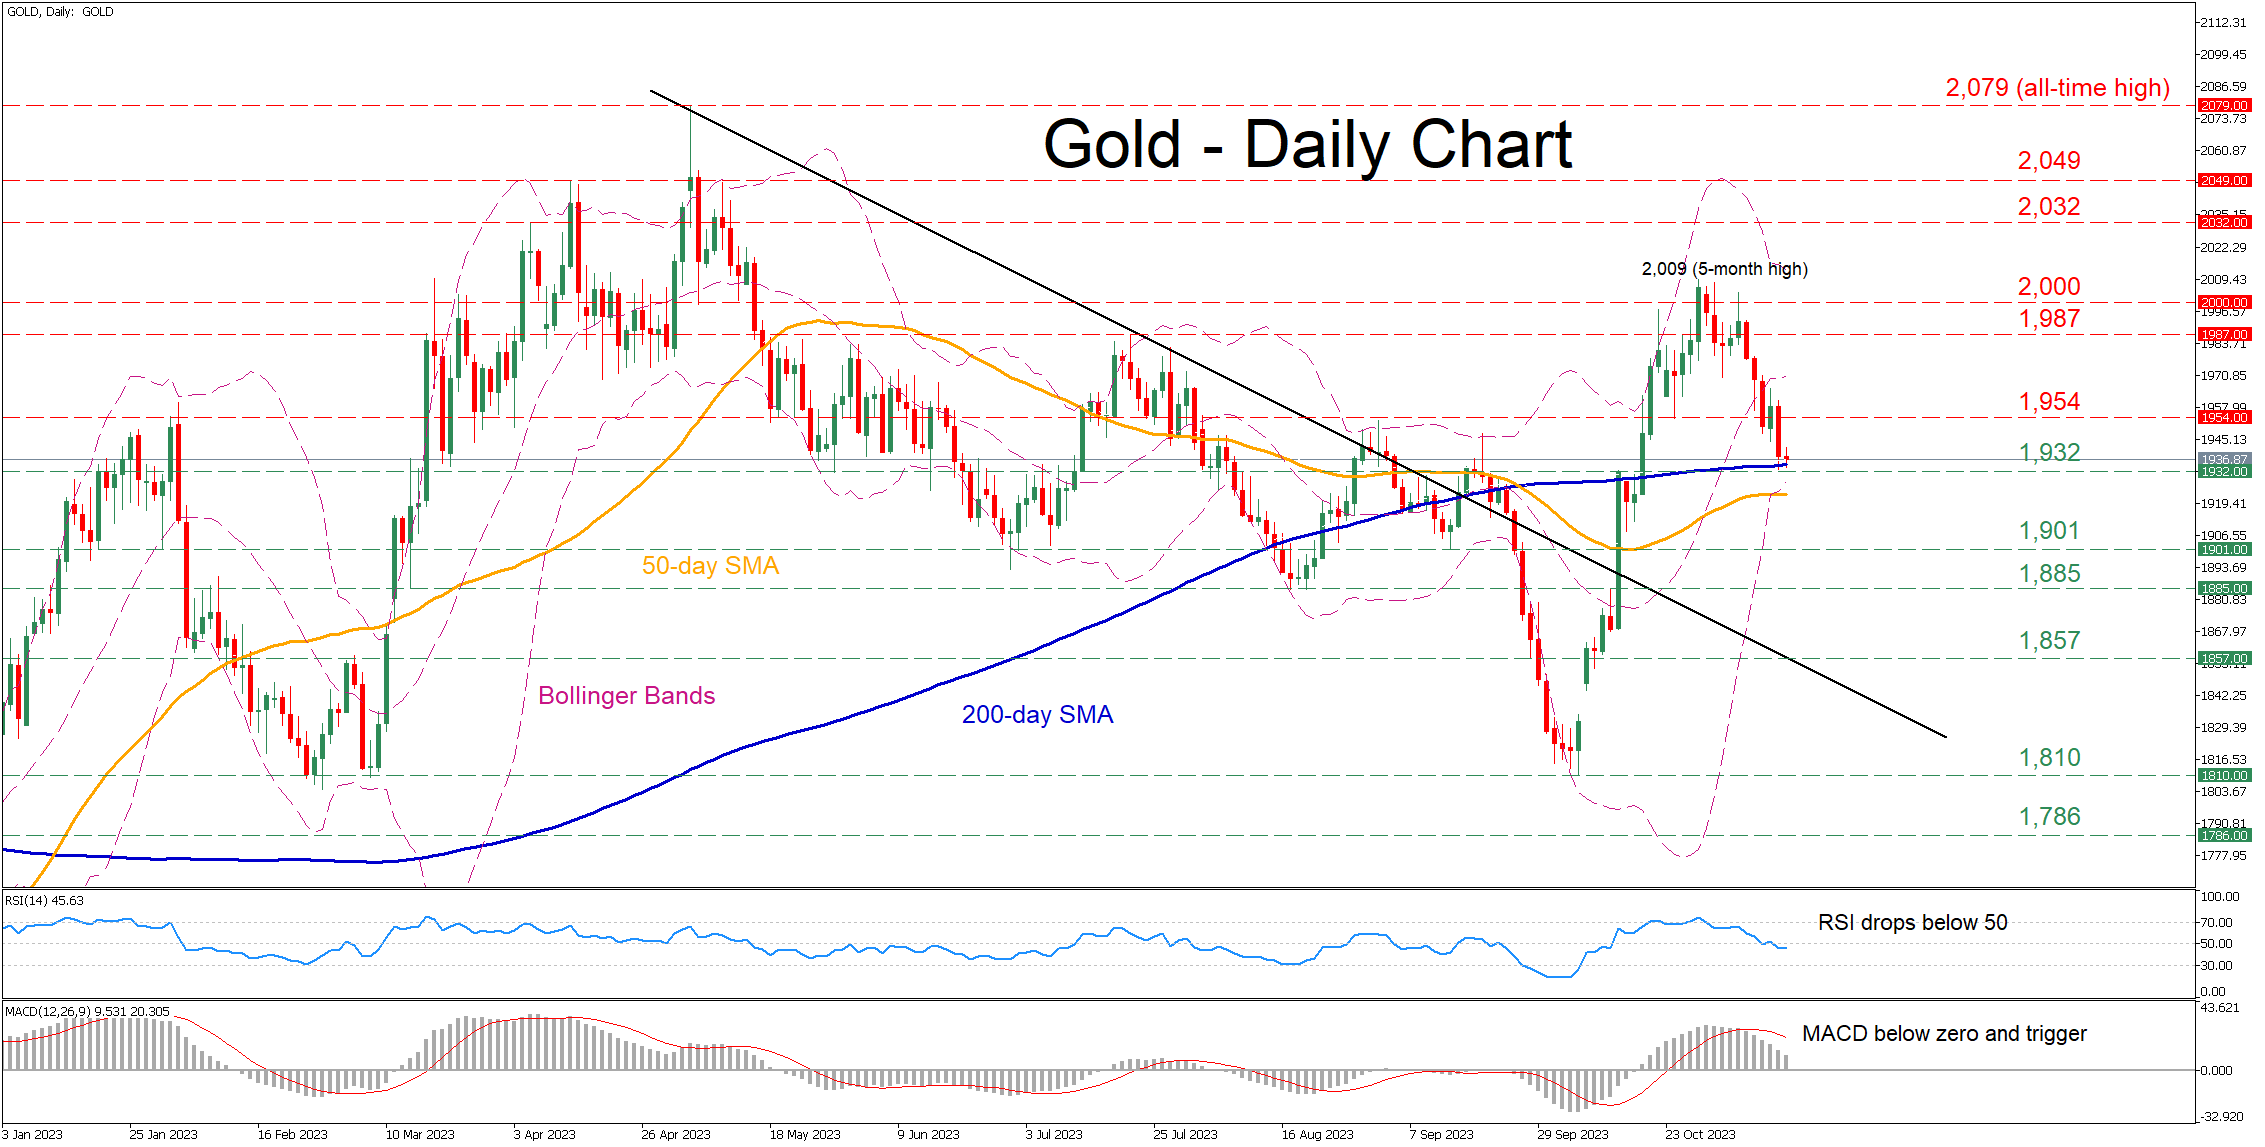
Gold had been in a steep uptrend since October 10 mainly on the back of geopolitical tensions, reclaiming crucial technical regions and posting a fresh five-month peak of 2,009. However, bullion has been experiencing a solid downside correction since then, with short-term oscillators pointing at more pain ahead.
Should gold resume its freefall, the bears could initially attack the 1,932 region, which has acted both as support and resistance throughout 2023 and coincides with the 200-day simple moving average (SMA). Failing to halt there, the price may descend towards the September support of 1,901. Even lower, the August bottom of 1,885 might provide downside protection.
On the flipside, if bullion bounces off the 200-day SMA and storms back higher, immediate resistance could be found at the October support of 1,954, which also acted as resistance in early September. Piercing through that region, the price could face the July resistance of 1,987. Further advances could then cease at the crucial 2,000 psychological mark.
In brief gold seems to be under relentless downside pressure, but the 200-day SMA has temporarily paused the steep retreat. Hence, it is clear that a break below the crucial obstacle could easily trigger an acceleration of the decline.
XAU/USD: Bears Pausing Ahead of US Inflation Report
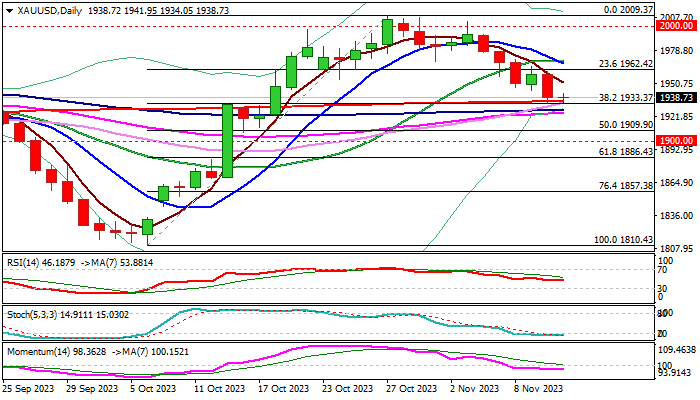
Gold is consolidating above key supports in early Monday as bears take a breather after last week’s 2.7% fall and markets await fresh signals from US inflation report, due on Tuesday.
The metal’s price was sharply down last week on hawkish remarks from Fed Chair Powell, which faded expectations for an end of hiking cycle and possible rate cuts in the near future and lifted dollar, although geopolitical risks and persisting economic growth concerns continue to fuel demand for safe-haven gold.
Technical picture on daily chart weakened as 14-d momentum entered negative territory and 10/20DMA’a turned to bearish setup, but fresh bears faced strong headwinds from key supports at $1935/33 (200DMA / Fibo 38.2% of $1810/$2009 upleg) and so far holding above these supports.
Clear break here is needed to signal bearish continuation after another failure at psychological $2000 barrier and expose targets at $1909/00 (50% retracement / round-figure).
Focus turns on US Oct CPI data which are expected to provide more clues about Fed’s next steps, whether the central bank will stay on hold in December or opt for another rate hike.
Core inflation is expected to remain unchanged in both, monthly and year on year readings, which will present neutral to negative view, as it will signal a pause in CPI’s larger downward trajectory.
On the other hand, any stronger divergence from consensus (in both directions) would generate fresh signal, with higher than expected readings in October to offer fresh support to dollar and further weaken yellow metal’s price, while lower inflation would add to expectations of an end of tightening cycle and deflate dollar.
Res: 1942; 1950; 1962; 1967.
Sup: 1933; 1924; 1909; 1900.
GBP/USD Dips Again While EUR/GBP Gains Strength
GBP/USD started a fresh decline from the 1.2430 resistance zone. EUR/GBP is rising and might climb above the 0.8755 resistance.
Important Takeaways for GBP/USD and EUR/GBP Analysis Today
- The British Pound is showing bearish signs below the 1.2310 support.
- There is a key bearish trend line forming with resistance near 1.2245 on the hourly chart of GBP/USD at FXOpen.
- EUR/GBP is gaining pace and trading above the 0.8720 zone.
- There is a major rising channel forming with support near 0.8735 on the hourly chart at FXOpen.
GBP/USD Technical Analysis
On the hourly chart of GBP/USD at FXOpen, the pair attempted a fresh increase above 1.2370, as discussed in the previous analysis. However, the British Pound failed above 1.2430 and started a fresh decline against the US Dollar.
There was a clear move below 1.2310 and the 50-hour simple moving average. The bears pushed the pair below 1.2250. Finally, there was a spike below the 1.2200 support zone. A low was formed near 1.2187 and the pair is now consolidating losses.
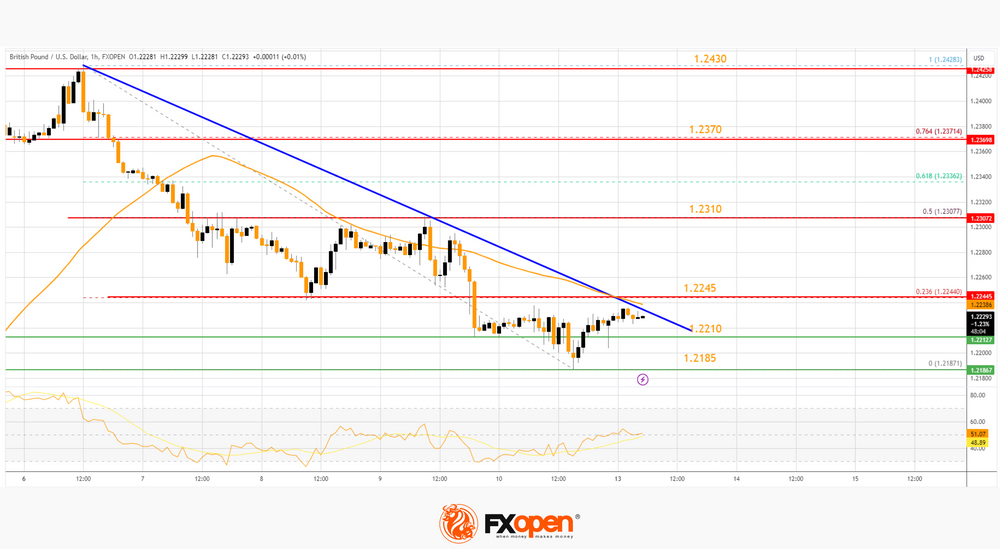
There was a minor move above toward the 23.6% Fib retracement level of the downward move from the 1.2428 swing high to the 1.2187 low.
On the upside, the GBP/USD chart indicates that the pair is facing resistance near the 50-hour simple moving average and a bearish trend line at 1.2245. The next major resistance is near the 50% Fib retracement level of the downward move from the 1.2428 swing high to the 1.2187 low at 1.2310.
A close above the 1.2310 resistance zone could open the doors for a move toward 1.2370. Any more gains might send GBP/USD toward 1.2430.
On the downside, there is a key support forming near 1.2210. If there is a downside break below the 1.2210 support, the pair could accelerate lower. The next major support is near the 1.2185 zone, below which the pair could test 1.2120. Any more losses could lead the pair toward the 1.2040 support.
EUR/GBP Technical Analysis
On the hourly chart of EUR/GBP at FXOpen, the pair started a decent increase from the 0.8650 zone. The Euro traded above the 0.8690 resistance level to enter a positive zone against the British Pound.
The pair settled above the 50-hour simple moving average and 0.8720. The pair traded as high as 0.8755 before there was a downside correction. There was a move below the 23.6% Fib retracement level of the upward move from the 0.8692 swing low to the 0.8755 high.
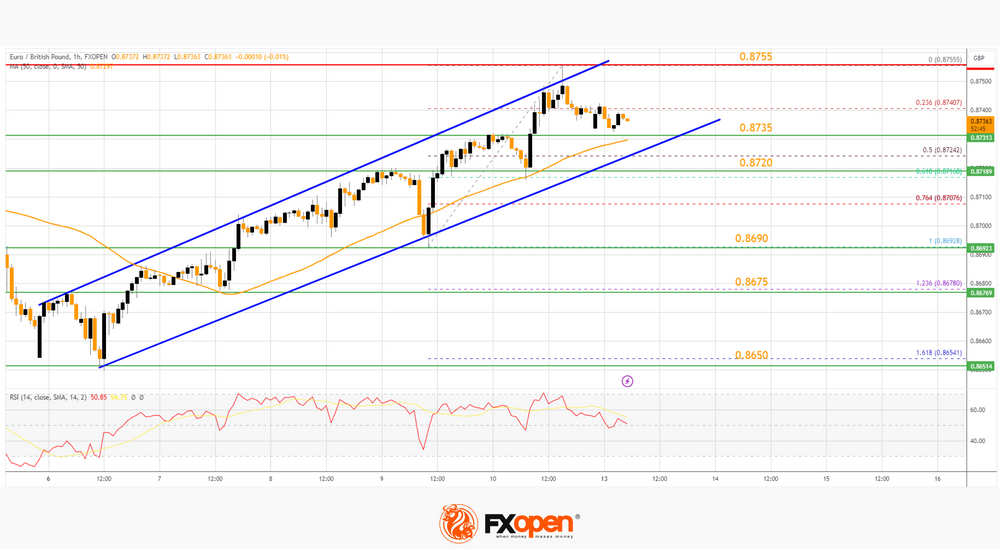
There is also a major rising channel forming with support near 0.8735 and the 50-hour simple moving average. The next major support is near the 61.8% Fib retracement level of the upward move from the 0.8692 swing low to the 0.8755 high at 0.8720.
A downside break below the 0.8720 support might call for more downsides. In the stated case, the pair could drop toward the 0.8690 support level. Any more losses might call for an extended drop toward the 0.8650 pivot zone.
The EUR/GBP chart suggests that the pair is facing resistance near the 0.8755 zone. A close above the 0.8755 level might accelerate gains. In the stated case, the bulls may perhaps aim for a test of 0.8800. Any more gains might send the pair toward the 0.8850 level.
This article represents the opinion of the Companies operating under the FXOpen brand only. It is not to be construed as an offer, solicitation, or recommendation with respect to products and services provided by the Companies operating under the FXOpen brand, nor is it to be considered financial advice.
Moody’s Downgrades US Outlook from Stable to Negative
Markets
Core bond yields rallied in the run-up to the weekend. In doing so they even eked out a net weekly gain. Friday’s move higher was inspired by central bank members, not least Fed’s Powell and ECB’s Lagarde, leaning against the dovish market pivot. Another unexpected rise in consumer inflation expectations weighed additionally on the front end of the US curve. The one-year ahead gauge rose from 4.2% to 4.4% while the long-term indicator (5-10 yr at 3.2%) over the past 26 years was never higher but for two months in 2008 (3.4%). Yields in the country added 4.2-5.1 bps at the front and rose up to 2.7 bps at longer maturities. The 10-y yield moved further north of the 4.5% support level. Yields in German gained between 4.6-7.8 bps with some belly underperformance. Wall Street extended opening gains to 1.15-2.05% with bullish breaks in all three major indices. Risk-on supported the likes of oil (Brent bounced off the $80/b support) as well as the euro. EUR/USD strengthened from 1.067 towards but below 1.07. Poor UK GDP details caused EUR/GBP to test the October high but sterling prevented a break lower. The pair did close above the 50% EUR/GBP recovery of the 2023 decline around 0.8735. EUR/JPY hit a new 15-year high just shy of 162. USD/JPY was still an inch away from its previous YtD high (151.72) but powers through this morning. At 151.79 it is closing in on the 2022 intraday high of 151.95. If smashed, it brings about a technical graveyard for JPY with the next support only emerging at around 160. Asian news flow is thin but Moody’s downgrading the US outlook from stable to negative (with unchanged AAA rating) grabs some attention. Moody’s said risks to fiscal strength have increased and might no longer be offset by the countries credit strengths. Fiscal deficits are expected to remain very large while continued political polarization in Congress raised the risk that governments won’t be able to reach consensus on plans to slow the decline in debt affordability. Absent of significant measures, Moody’s expects the US government to run wide fiscal deficits of around 6% of GDP near term and around 8% by 2033, due to higher interest rate payments and aging related spending. Deficits averaged around 3.5% over the 2015-2019 period. They will raise the debt burden to around 120% of GDP by 2033 from 96% in 2022.
The new week kicks off very quietly, paving the way for some technically inspired trading without a clear direction. A few central bank speeches are worth following up, but fade to nothing compared to the avalanche that is due all week. Economic data include US CPI tomorrow and retail sales on Wednesday. The UK continues last week’s economic update with the labour market report tomorrow, inflation numbers on Wednesday and retail sales to end the week. We hold on to our expectations for a topside break in EUR/GBP.
News & Views
According the people familiar with the matter mentioned by Bloomberg, UK Chancellor of the Exchequer is set to extend major tax breaks for UK businesses in its upcoming fiscal plan as he aims to support investment and revive the UK economic growth. In concreto, Hunt is said to consider prolonging the ‘full expensing policy’ which gives UK companies 100% tax relief for capital spending beyond current expiration of the measure in the fiscal year 2025/26. According to people with knowledge of the measure, the measure would cost the Treasury about £10 bln per each year it is extended.
Rating agency Fitch on Friday affirmed Italy’s BBB rating with a stable outlook. In its assessment, Fitch expects the country’s public debt-to-GDP ratio to stabilize over its forecast horizon near the levels of 2022. It also expects the country’s growth to receive moderate support from the pick-up in the execution of EU-funded projects. Ongoing broad stability in the government coalition is seen limiting more marked policy risk. Even so, a significant loosing of the fiscal targets has weakened the deficit path. The rating agency also sees associated risks of higher yields on new debt issuance and non-compliance with EU fiscal rules. Later this week, rating agency Moody’s is expected to update its assessment of the Italian credit rating. Moody’s has a Baa3 rating for the country with a negative outlook.
All Eyes on US Inflation and the Government’s Funding Deadline
What everyone – most investors, every household and every politician want to see and to sense right now is the end of the global monetary policy tightening cycle, and the beginning of the end starts mostly with the Federal Reserve (Fed).
Until the beginning of this month, we have seen a pricing that reflected the market’s belief that the Fed is going to keep the rates high for long because the world is now braced for an extended period of high inflation. And the rapid rise in the US long term yields because of this very belief that the Fed will keep rates high for long helped the Fed keep its rates steady, at least at the latest meetings. The US 10-year yields spiked above the 5% mark in the second half of October, stagnated close to this peak for a week.
Then, a sufficiently soft set of jobs data from the US at the start of the month, combined with a record but lower-than-expected Treasury borrowing plans slowed down the sharp selloff in US Treasuries and reversed market sentiment. Investors, since the beginning of this month, began flocking back into the US long-term papers. The US 10-year yield tipped a toe below the 4.50% level, this time. We are talking about a plunge of more than 50bp for the 10-year paper in about two weeks.
And finally, last week, two bad 10- and 30-year bond auctions in the US, and Fed Chair Powell’s warning that the Fed could opt for more rate hikes if needed, brought bond investors back to earth. And the 10-year yield rebounded from a dip. This is where we are right now – a period of heavy treasury selloff, followed by significant inflows, and uncertainty.
The uncertainty regarding when the Fed will be done hiking the rates is killing everyone, but even the Fed itself doesn’t know when tightening will/should end. It will depend on crucial economic data, like inflation, jobs, and growth figures. The US jobs data is giving signs that the US labour market has started loosening. The US growth numbers are off the chart, but spending isn’t necessarily sitting on solid ground, as the US credit card loans go from peak to peak and the credit card delinquencies have taken a lift. The delinquency rate is above the pre-pandemic levels, and just around the post-GFC levels – this means that the Americans spend on debt that they can’t pay back anymore. And the US government debt is – as you know - growing exponentially, and Americans pay significantly higher interest on their debt because the rates went from near zero to above 5% in less than two years.
But uncertainty regarding the US debt does not mean that the US Treasuries will fall off grace, because there is nothing comparable to the US Treasuries that could replace US treasuries in a portfolio for low-risk allocations.
Volatility in this space is however unavoidable. This week, we will plunge back into the US political saga, as the government short-term funding deadline is due 17th of November and not much progress has been made to seal a fresh deal. And remember this, the last time the US politicians agreed on a short-term relief package, Joe Biden was forced to leave the funding for Ukraine outside of it. Since then, a new war in Gaza popped up, and the US is now expected to bring financial contribution there, as well.
We could see the US long-term yields recover from the past weeks’ decline. Depending on the new funding resolution – or the lack thereof – we could see the US 10-year yield return above 4.80%.
Happily, slower inflows into US treasuries will be a relief for the Fed, which needs the yields to remain high enough to restrict the financial conditions without the need for more action. But the US political shenanigans are only one part of the equation. The other part is…economic data.
The all-important inflation data due Tuesday is going to impact the inflow/outflow dynamics in US Treasuries before the worries grow into the Friday funding deadline. A sufficiently soft inflation read should keep bond traders in appetite for further purchases and mask a part of the political worries, while disappointment could keep buyers on the sidelines and amplify a potential political-led selloff. The good news is that the US headline inflation is expected to have eased to 3.3% in October, from 3.7% printed a month earlier. Core inflation is seen steady around the 4.1% level. The bad news is, the expectation is soft and could be hard to beat.
The US dollar sees resistance at around the 50-DMA, the US stocks continue to cheer the latest pullback in the US yields. The S&P500 closed last week with a beautiful rally, that led the index to above its 100-DMA for the weekly close. The big tech remains the driver of the S&P500 gains as Microsoft hit a fresh high on Friday and Nvidia remained bid a few points below its ATH on news that Chinese AI startup bought enough Nvidia chips before the US exports curbs kicked in. This week, US big retailers will announce their Q3 results and will give a hint on the US consumer trends, health and expectations. Earnings could be mixed but the overall outlook will likely be morose.
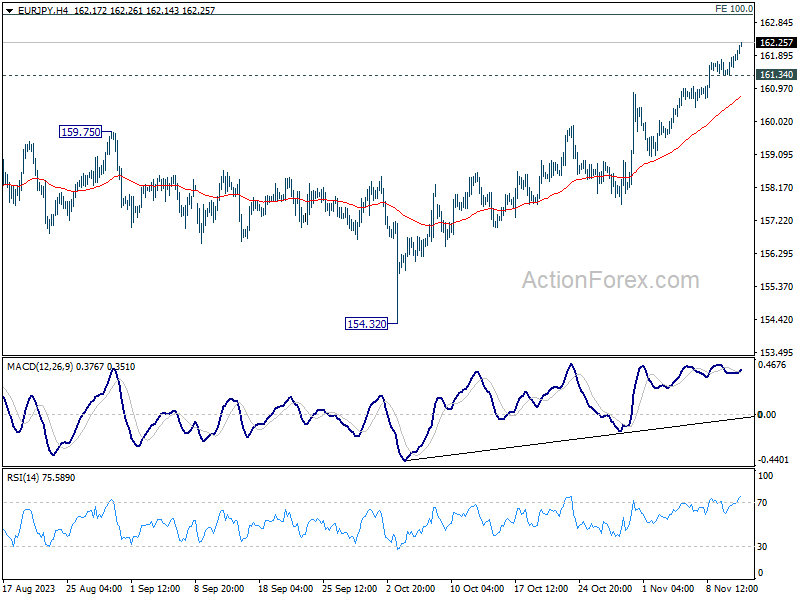
EUR/JPY Daily Outlook
Daily Pivots: (S1) 161.52; (P) 161.74; (R1) 162.11; More....
EUR/JPY's rally continues today and hits as high as 162.25 so far. Intraday bias remains on the upside for 163.06 projection level next. Strong resistance could be seen there to limit upside on first attempt. On the downside, below 161.34 minor support will turn intraday bias neutral and bring consolidations first, before staging another rise.
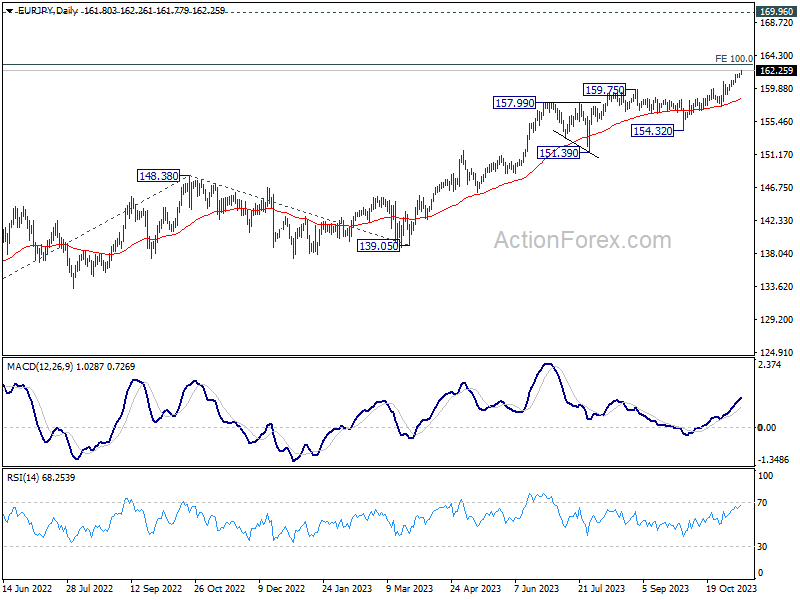
In the bigger picture, rise from 114.42 (2020 low) is in progress. Next target is 100% projection of 124.37 to 148.38 from 139.05 at 163.06. Sustained break there will target 169.96 (2008 high). On the downside, break of 154.32 support is needed to be the first sign of medium term topping. Otherwise, outlook will remain bullish even in case of deep pullback.
GBP/JPY Daily Outlook
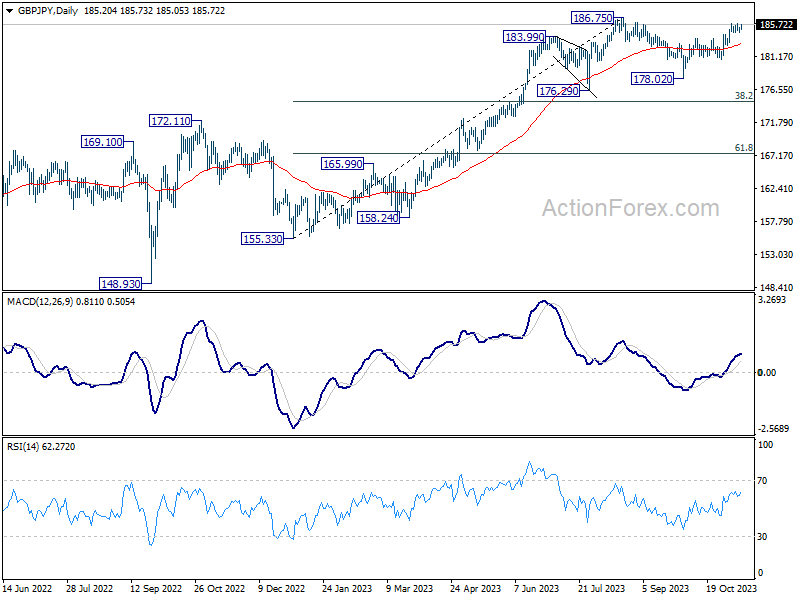
Daily Pivots: (S1) 184.82; (P) 185.08; (R1) 185.53; More...
Intraday bias in GBP/JPY remains neutral as it's still bounded in range below 185.94. In case of another dip, downside should be contained above 182.71 support to bring another rally. Break of 185.94 will resume the rally from 178.02 to retest 186.75 high next.
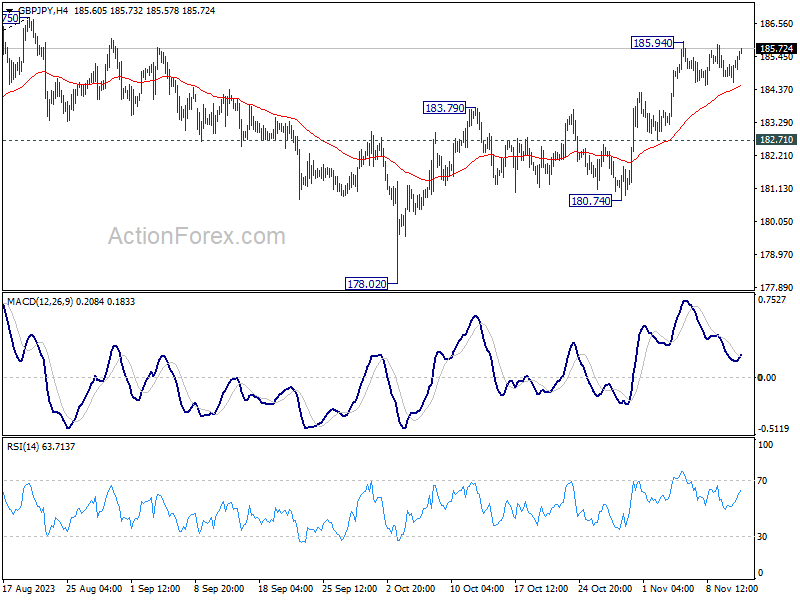
In the bigger picture, as long as 176.29 support holds, larger up trend from 123.94 (202 low) should still be in progress. Break of 186.75 will target 195.86 (2015 high). Nevertheless, firm break of 176.29 will confirm medium term topping, and bring lengthier and deeper consolidations.