
Sample Category Title
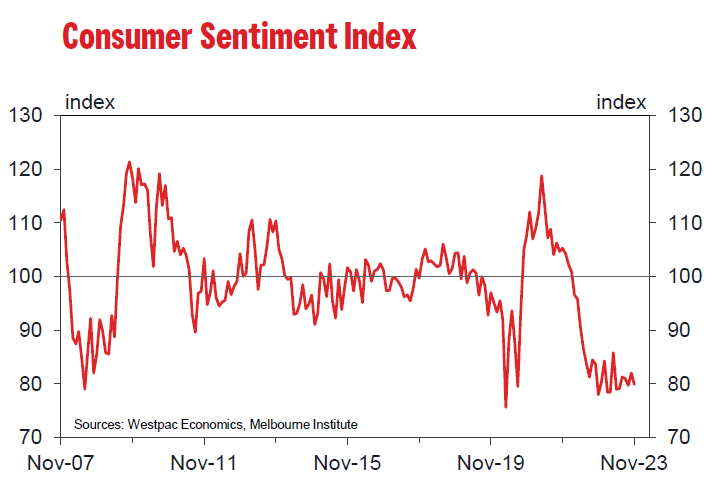
Australia’s consumer sentiment plummets post RBA rate hike
Australia's Westpac Consumer Sentiment Index saw a significant decline in November, dropping by -2.6% mom to 79.9, reflecting a deepening pessimism among consumers.
Westpac attributed this drop to the recent RBA rate hike, noting a -6% decrease in confidence during the survey period. Despite the overarching pessimism, labor market confidence and housing-related sentiment remained relatively stable.
Westpac further commented, "The Reserve Bank Board next meets on December 5. The November Consumer Sentiment survey highlights the weak and uneven conditions across Australia's consumer sector.
"How this plays out for wider domestic demand in the context of strong population growth is something the Board will need to consider as it acts to ensure inflation returns to target."
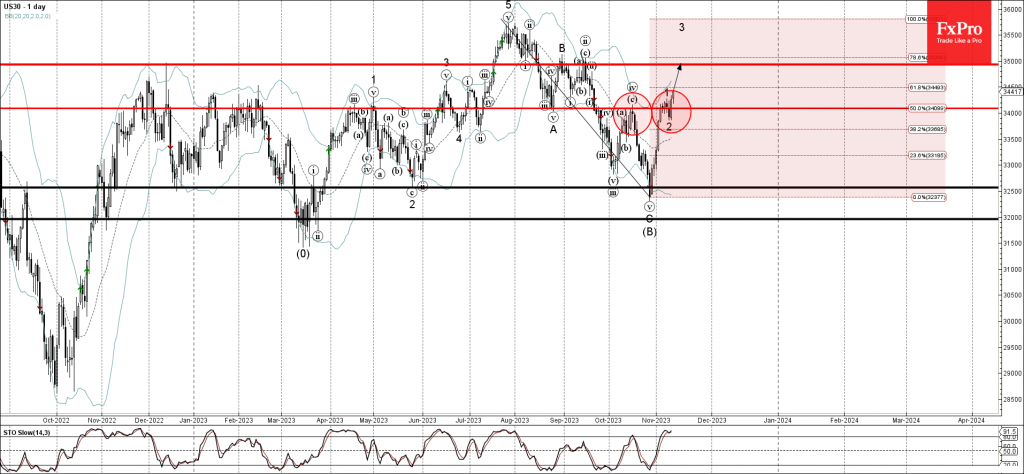
Dow Jones index Wave Analysis
- Dow Jones index broke resistance level 34085.00
- Likely to rise to resistance level 35000.00.
Dow Jones index recently broke the key resistance level 34085.00 (top of the previous minor correction iv from the middle of October).
The breakout of the resistance level 4385.00 accelerated the active short-term impulse wave 3.
Given the clear daily uptrend, Dow Jones index can be expected to rise further toward the next resistance level 35000.00, former monthly high from September.
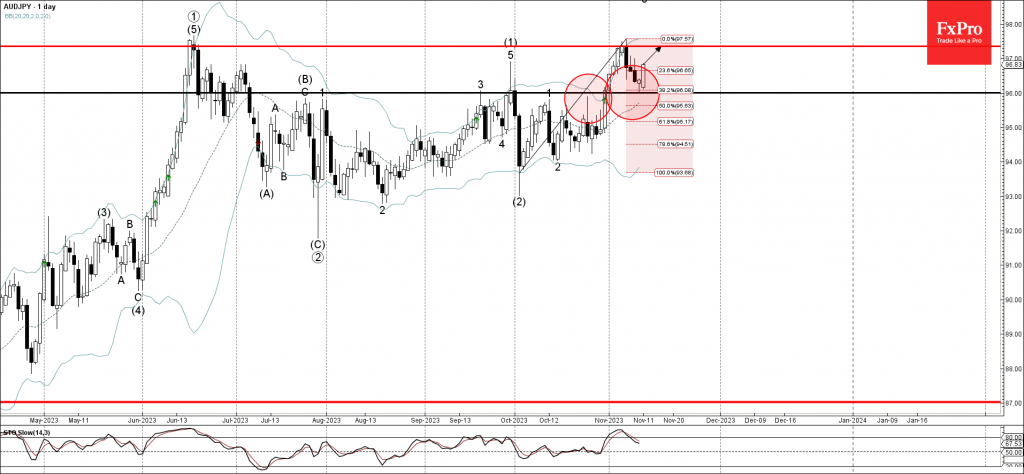
AUDJPY Wave Analysis
- AUDJPY reversed up from key support level 96.00
- Likely to rise to resistance level 35000.00
AUDJPY currency pair recently reversed up from key support level 96.00 (former strong resistance from September) coinciding with the 38.2% Fibonacci correction of the upward impulse from October.
The upward reversal from the support level 96.00 continues the active impulse wave 3 of the intermediate impulse wave (3) from the start of October.
Given the predominant daily uptrend, AUDJPY currency pair can be expected to rise further toward the next resistance level 35000.00, former multi-month high from June.
Sunset Market Commentary
Markets
Markets started the week with mostly, technical, order driven trade. Friday’s higher than expected US inflation expectations (U. Michigan survey) and Moody’s downgrading the outlook on the US AAA credit rating (negative from stable) sparked some debate this morning, but in the end were no game-changers. Last week’s rebound in yields slowed, as investors await for additional guidance, especially from tomorrow’s US October CPI report. Headline inflation is expected to ease to 0.1% M/M and 3.3% Y/Y on still favourable base effects. The expected picture for core inflation is more balanced (expected unchanged at 0.3% M/M and 4.1% Y/Y). Markets are more neutrally positioned after the rebound in yields end last week. Interesting to see the market reaction after last week’s ‘guidance of Chair Powell that Fed won’t give too much weight to a few months of good months on inflation. US yields today moved from red to green and vice-versa intraday and currently add up to 3.5 bps (30-y) in a steepening move. The US 2-y yields is holding north of the 5.0%. The 10-y continues testing 4.68%. The German curve is inverting a tad trading between 2.5 bps (5-y) and 1. bp (30-y) higher. ECB’ de Guindos joined recent balanced communication. He sees further disinflationary progress medium term and signs the labour market is cooling. Still inflation remains too high. He even warned on a temporary inflation rebound in coming months. He also advocates that fiscal policy should aim to increase productivity. US equities are ceding most ground after Friday’s break higher, but try to sustain above the technical barriers that were regained (S&P 4400 area, Nasdaq 13715). Eurostoxx50 adds 0.4% on Friday US gains, but the 4200/34 area remains a hard nut to crack. Oil stabilizes near $81.5 p/b.
Technical trading is also witnessed among major FX cross rates. DXY gains marginally, but at 105.90 perfectly holds in the middle of the 104.85/107.11 short-term consolidation pattern. EUR/USD tested the 1.07 area intraday, but was pushed back to the 1.067 area. Softer than expected Japan PPI data helped to support the feeling that further yen losses are the path of the least resistance. USD/JPY (151.85) already set a new 2023 top and is nearing last year’s multi-year top (151.94). A break will bring to pair to levels not seen since 1990 (April 1990 top 160.2). Japan’s Finance minister reiterated that currency moves should be determined by fundaments and that sudden moves are undesirable. However, do recent moves deserve the label ‘sudden’? The UK news flow was dominated by former PM David Cameron returning to the government as Foreign Secretary. However, the impact on markets was limited. UK yields show similar minor changes as in the US and EMU. Sterling is gaining modest ground both against the dollar (Cable 1.224) and the euro (EUR/GBP 0.8725). Tomorrow’s UK labour data and even more Wednesday’s expected sharply decline in October inflation will decide whether EUR/GBP will finally clear the 0.8750 area.News & Views
The Italian government may face complications in securing about half of the European Next Gen recovery funds, Bloomberg reported, citing people familiar with the matter. The country will probably obtain the next, fourth installment of $16.5bn but it may become increasingly difficult to meet investment targets and implement the needed reforms quickly enough beyond that. After the fourth tranche, total cash disbursed (grants and loans) totals almost $102bn or 52% of what is made available. There’s a payment deadline for the EU funds in 2026. Missing out on (some of the) remaining resources would be costly. Italy’s huge debt pile and the sharp increase in borrowing costs combined with anemic growth limit its ability to turn to capital markets to fund necessary investments in infrastructure, digitalization, education and green energy.
Brazil has filed a preliminary prospectus for an offering of sustainable bonds for the first time ever. The bonds would mature in 2031 but there’s no info available yet on the size of the issuance. Brazil’s debut in ESG debt markets has been widely anticipated for several years now, ever since the then-Treasury Secretary Funchal announced Brazil’s debt strategy in 2021. The inaugural sale was originally planned for October 2 this year but got postponed after a sharp rise in bond yields. Officials have had a series of meetings with bond investors to gauge their appetite over the recent years. Finance Minister as soon as last week said that the reception of their plans had been “extraordinary”. Proceeds of the bond will be used to fund several green and social initiatives linked to the United Nations 2030 sustainable agenda.
Renminbi (USDCNH) Pullback Is Coming Before More Upside
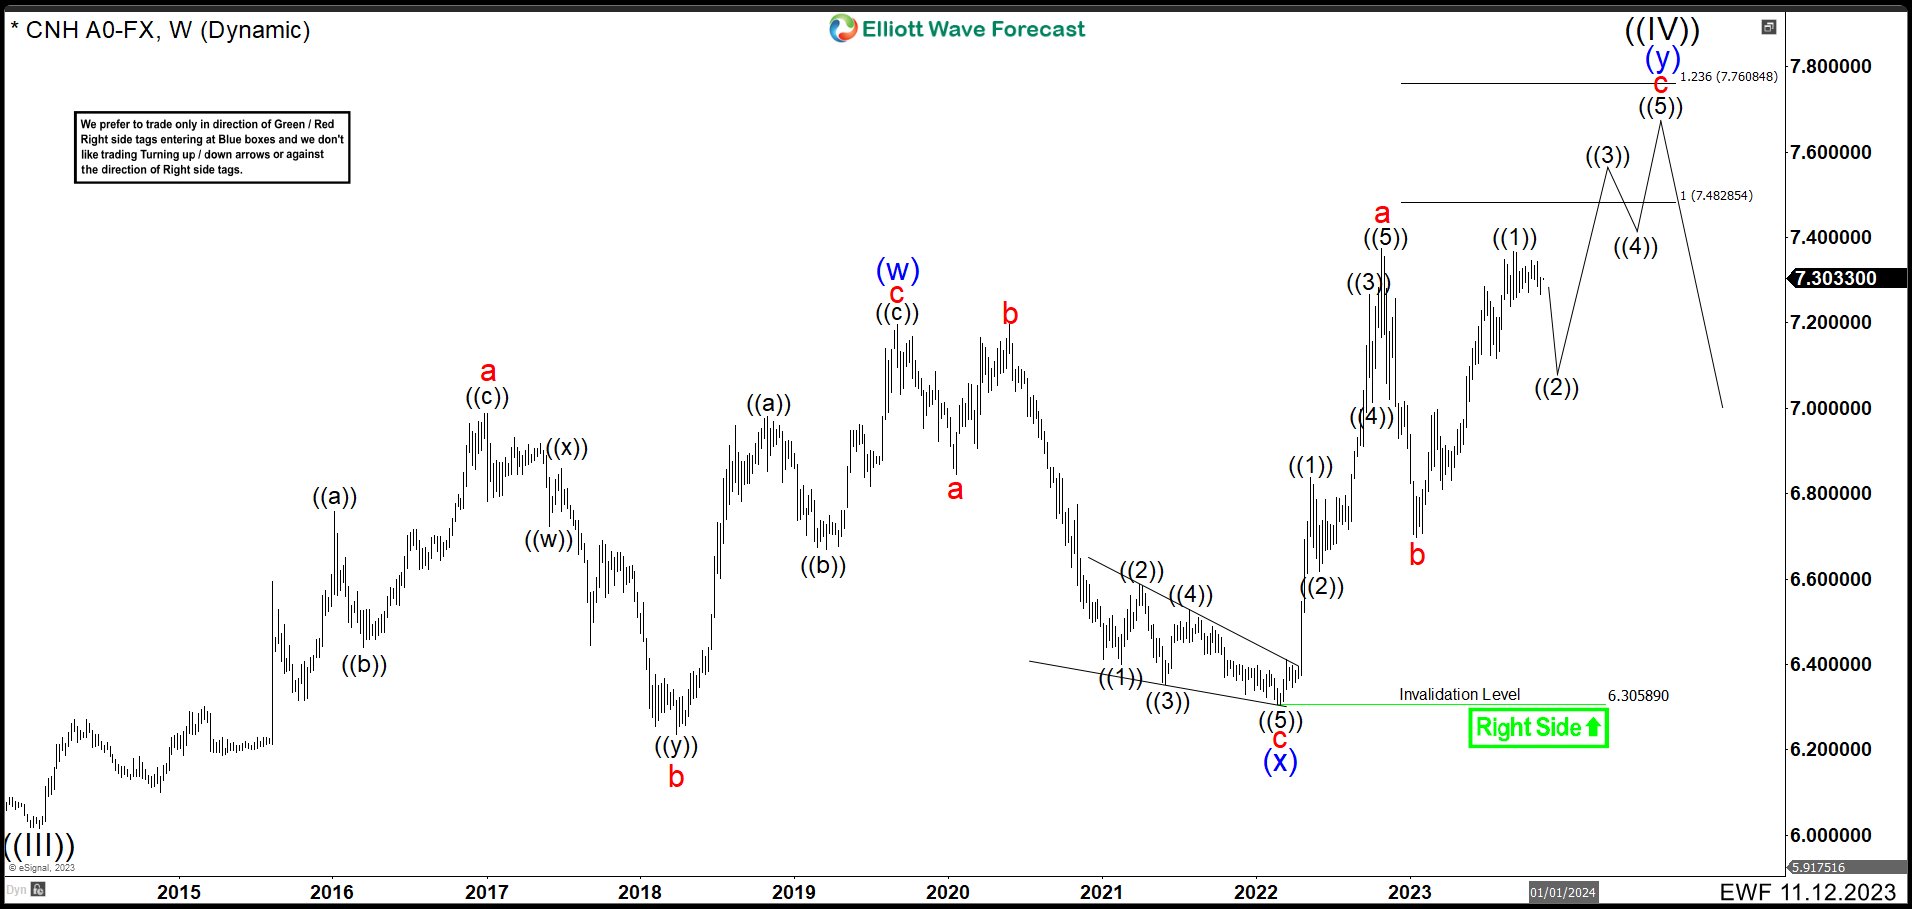
In the last years, the renminbi made a pause in his attempt to get stronger against USD dollar. In February 2014, renminbi found support at 6.0153 as wave ((III)) and from there it made a perfect zig – zag correction structure to equal legs at 7.1964 in June 2020. After these 3 swings, USDCNH should have continued with the downtrend. However, the pair turning up again breaking 7.1964 high suggesting that market is developing a double correction structure. (If you want to learn more about Elliott Wave Theory, please follow these links: Elliott Wave Education and Elliott Wave Theory)
USDCNH July 2023 Weekly Chart
The wave “a” began at 6.0153 (2014 low) and moved high in 3 waves structure almost hit 7.00 dollars ending at 6.9854. After this zig zag correction, we have a huge drop to 6.2359 developing a double correction structure to end wave “b”. The volatility did not leave things like that an enormous rally took place in the beginning of wave “c”. This movement built again 3 waves higher completing wave “c” at 7.1974 and also wave (w) reaching the 100% Fibonacci extension.
Down from (w), we could see that an expanded flat correction took place as wave (x) finishing as an ending diagonal at 6.3058 low. Then again a strong rally took a part. This move higher looks like an impulse and we labeled as wave “a” ended at 7.3748 above wave (w) confirming a corre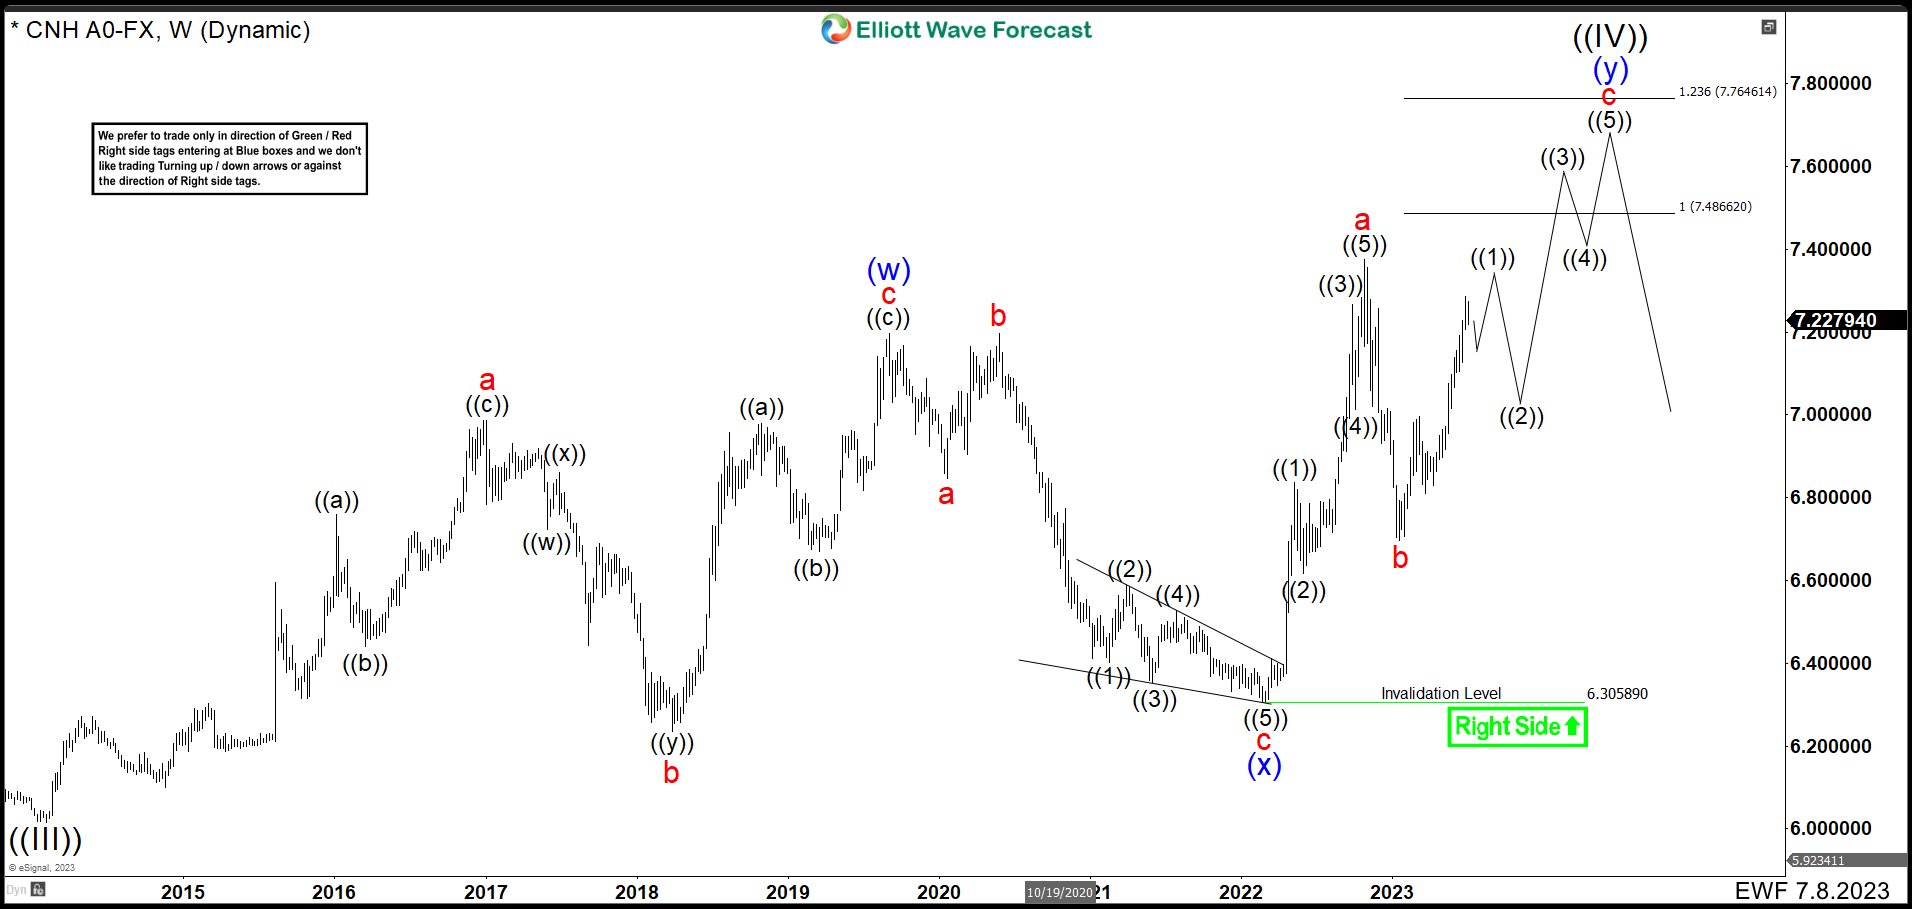 ctive bullish sequence. Then USDCNH made a wave “b” ended at 6.6883 and bounced in the last leg higher.
USDCNH November 2023 Weekly Chart
In the chart above, looks like the first leg of the wave “c” ended as wave ((1)). Up from 6.6883 low, we can see 5 swings higher creating an impulse. First wave ended at 6.9967. Wave (2) pullback at 6.8107 low. Then USDCNH rally finishing wave (3) at 7.2855. Wave (4) correction completed at 7.1162 low. Last push to 7.3679 ended wave (5) and wave ((1)). Currently, we are expecting a correction as wave ((2)) of “c”. This movement should drop to 7.12 – 6.95 area correlating with USDX weakness that we are looking for. After finishing wave ((2)), pair should rally in 3 swings to build an impulse as wave “c” to 7.4866 – 7.7646 area. This also will finish the double correction wave (y), and the wave ((IV)) before renminbi continues with the downtrend.
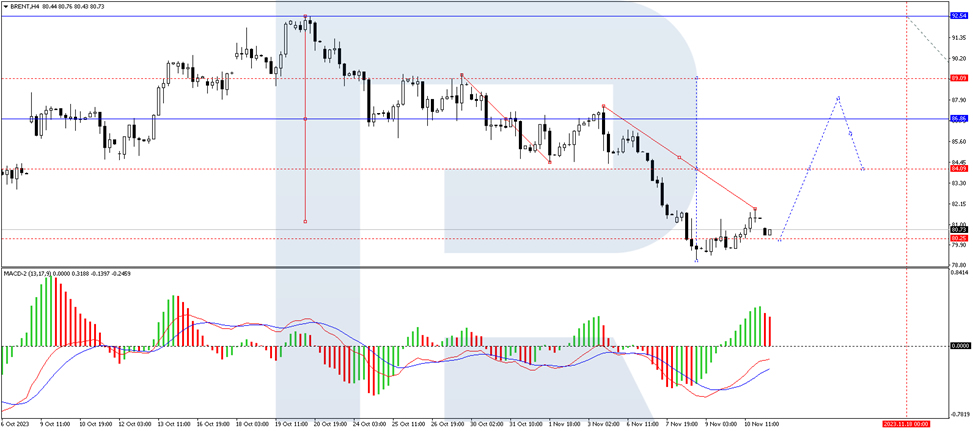
Brent Oil Price is Declining Again
The commodity market started the week with a new wave of selloffs. The price of a barrel of Brent crude decreased to 80.65 USD.
Investors began reducing long positions on Friday amid uncertainty in the Middle East.
This week, the monthly reports from the International Energy Agency and OPEC are expected to be released. These documents will hold fresh assessments of the situation in the oil sector and, possibly, forecasted supply and demand parameters.
Also, the market eagerly awaits the latest inflation statistics from the US. This is one of the key indicators in shaping the Fed's monetary policy, which is also significant for the oil market.
Brent technical analysis
On the H4 chart, Brent has completed an upward impulse reaching the level of 81.89. Today, the quotes might correct to 80.37. After the correction is completed, a new wave of growth to 84.00 could begin, from where the trend could continue to 87.87. Technically, this scenario is confirmed by the MACD indicator. Its signal line is below zero and strictly directed upwards.
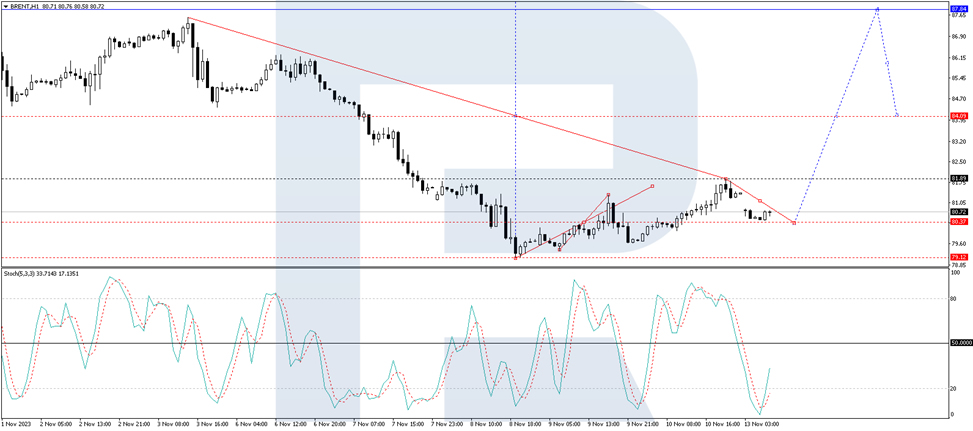
On the H1 chart, Brent has completed an upward wave to 81.89. Today, a correction to 80.37 is forming. After the price reaches this level, a wave of growth to 81.89 could follow. A breakout of this level could open the potential for a rise to 84.09. This is a local target. Technically, this scenario is confirmed by the Stochastic oscillator: its signal line is below 20 and strictly directed upwards. The indicator is expected to renew the highs.
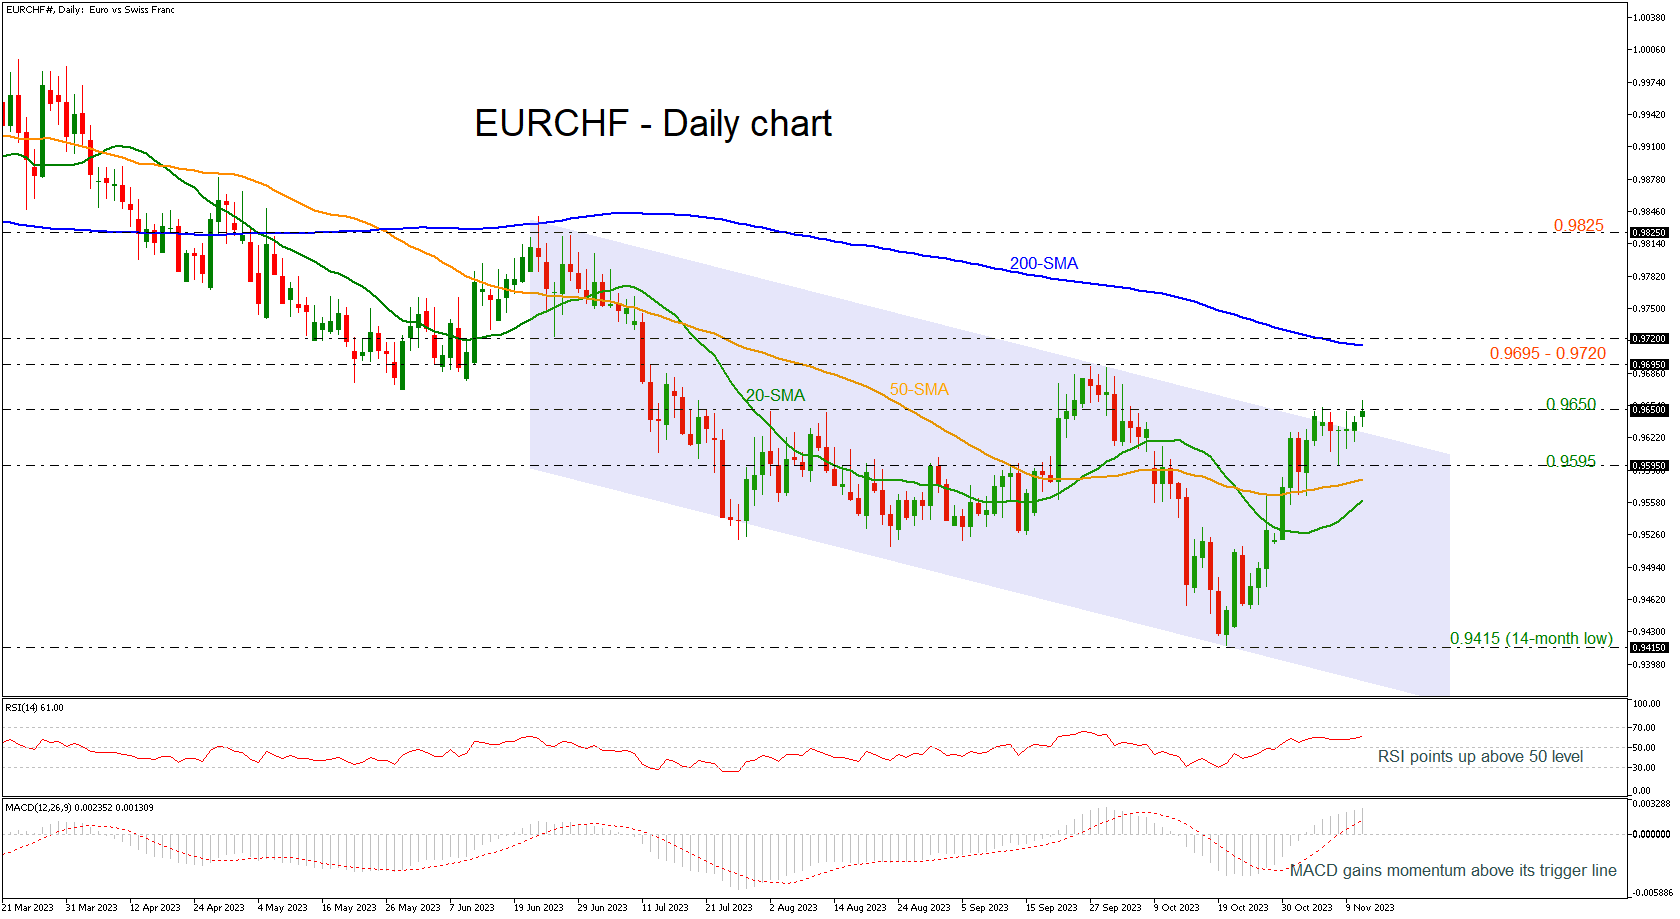
EURCHF Keeps Rising Above Negative Channel
- EURCHF surges to a 1-month high
- Momentum indicators suggest more bullish movement
EURCHF is probably set for another bullish wave as the price is jumping above the 0.9650 significant resistance and the five-month bearish channel. The pair recorded a new one-month high of 0.9660 earlier today.
The 20- and the 50-day simple moving averages (SMAs) are ready for a positive crossover in the next few sessions with the technical oscillators showing some encouraging signs too. The RSI is still developing above the neutral threshold of 50 and is pointing upwards, while the MACD is rising above its trigger and zero lines, indicating that buyers still have momentum.
Should upside pressures persist, the area within 0.9695-0.9720 could initially attract traders' attention as it also encapsulates the 200-day SMA around 0.9712, in the short-term timeframe. Conquering this barricade, the bulls might aim at the 0.9825 peak, taken from the highs on June 28.
On the flipside, bearish actions could send the price lower to test the previous bottom at 0.9595 and the 50- and the 20-day SMAs at 0.9580 and 0.9560, respectively. Sliding beneath these support lines, the spotlight would turn to the 14-month low of 0.9415.
All in all, EURCHF seems to be experiencing upside pressure after the bounce off the 0.9415 bottom, raising the odds of a fresh bullish rally.
USDX Elliott Wave: Forecasting The Bounce After Flat Pattern
In this technical article we’re going to take a look at the Elliott Wave charts charts of Dollar Index published in members area of the website. As our members know USDX has ended cycle from the 99.5 low as 5 waves structure. We were calling cycle completed at the 107.34 peak. Recently Dollar has reached extreme zone, equal legs area from the 107.34 peak and completed the short term cycle as Elliott Wave Flat.
Before we take a look at the real market example of Expanded Flat, let’s explain the pattern in a few words.
Elliott Wave Expanded Flat Theory
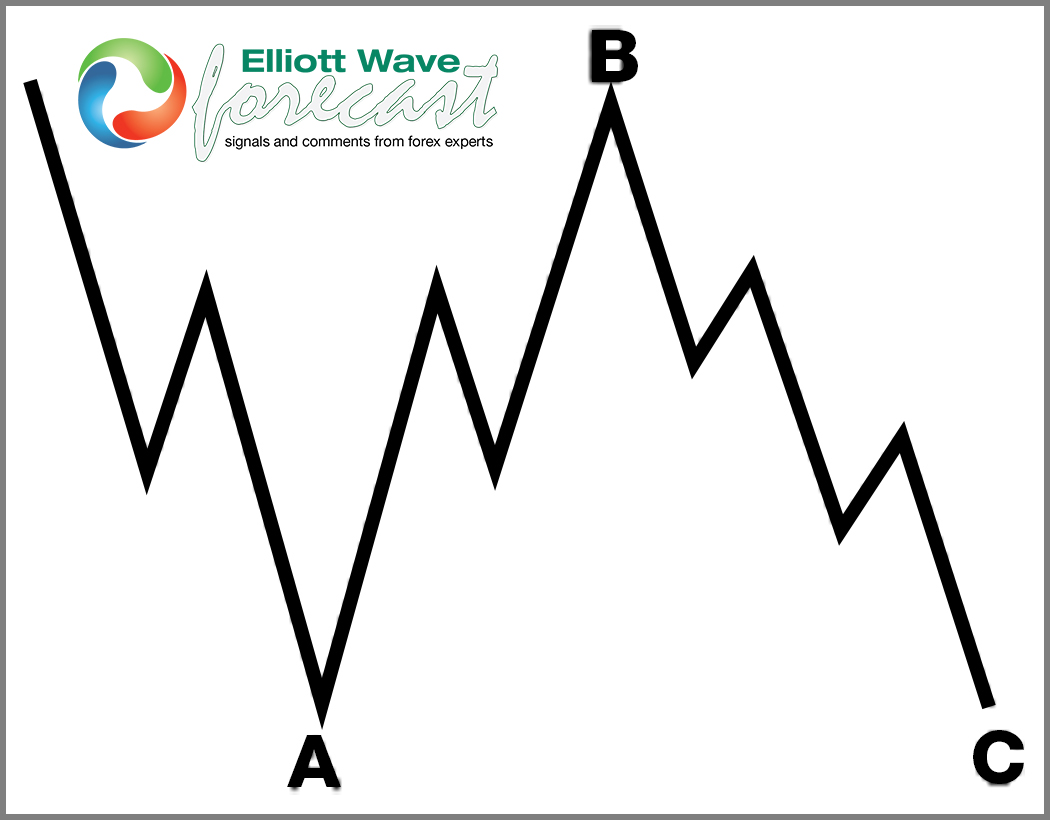
Elliott Wave Flat is a 3 wave corrective pattern. Inner subdivision is labeled as A,B,C , with inner 3,3,5 structure. Waves A and B have forms of corrective structures like zigzag, flat, double three or triple three. Third wave C is always 5 waves structure, either motive impulse or ending diagonal pattern. It’s important to notice that in Irregular Flat Pattern wave B completes below the starting point of wave A. Wave C ends above the ending point of wave A . Wave C of Flat completes usually between 1.00 to 1.236 Fibonacci extension of A related to B, but sometimes it could go up to 1.618 fibs ext.
At the graphic below, we can see what Expanded Flat structure looks like
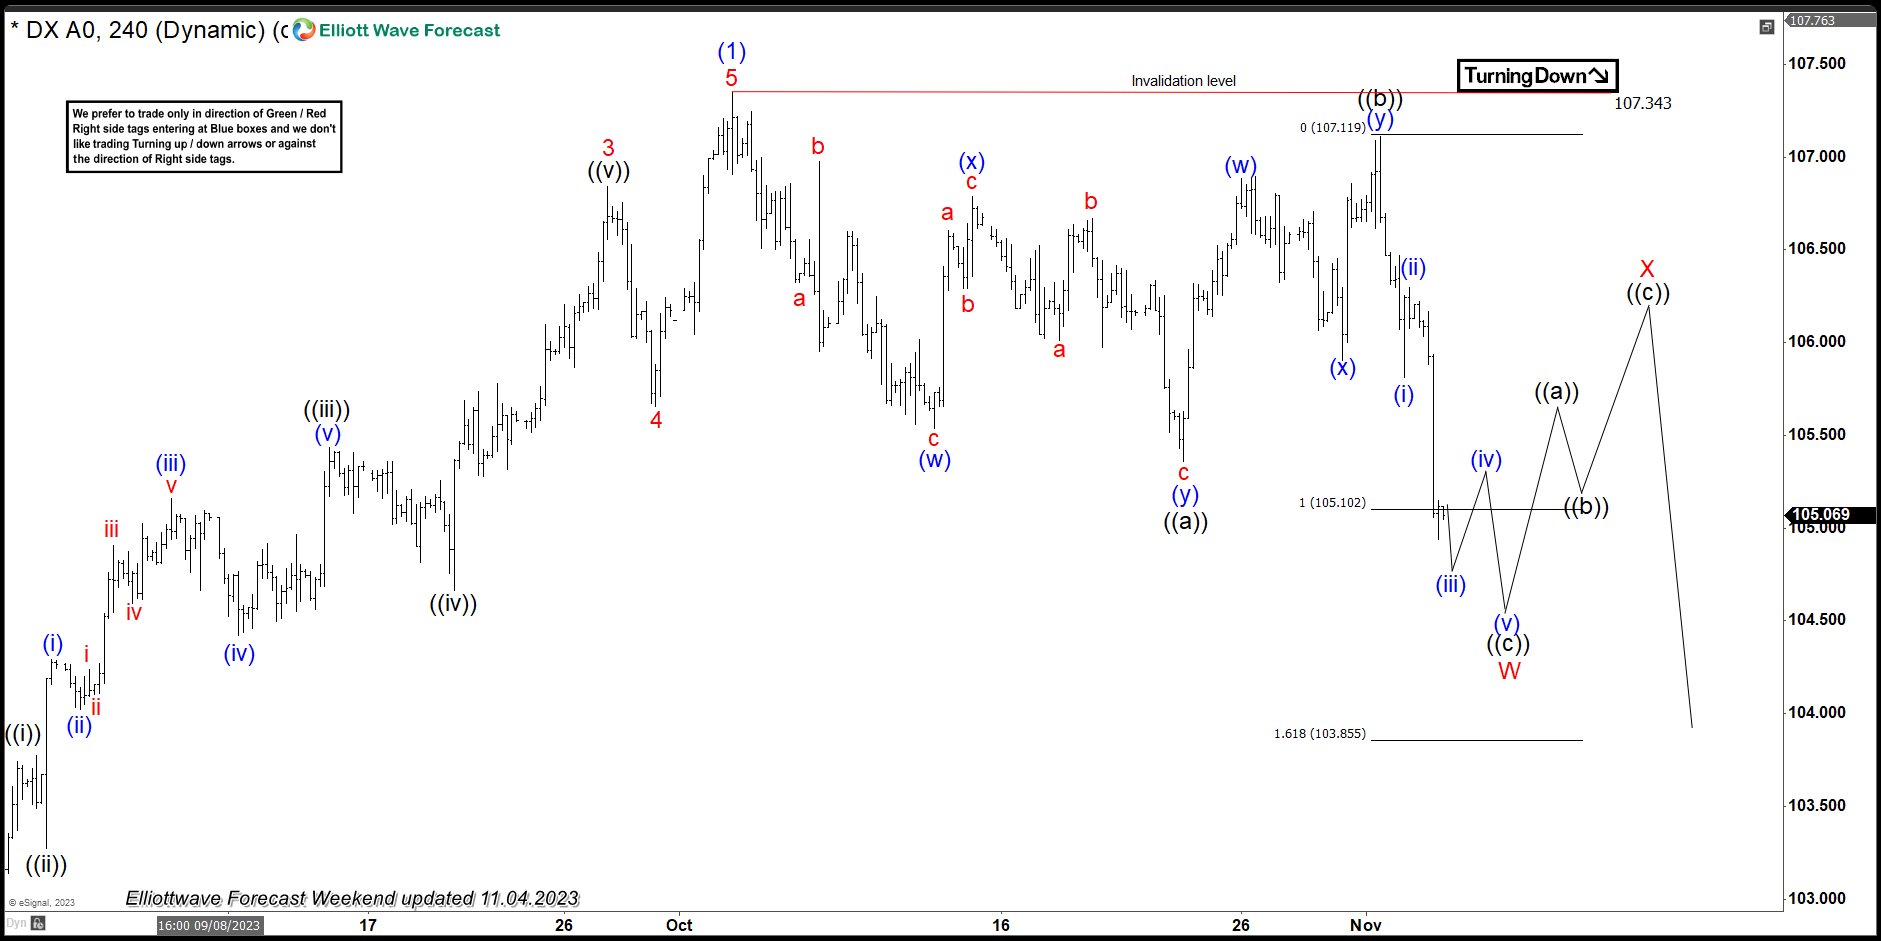
USDX Elliott Wave h4 Chart 11.04.2023
Elliott wave view suggests cycle from the 107.34 peak is unfolding as Flat Pattern. We can notice that inner subdivisions of ((a)) and ((b)) black are having corrective sequences. . Wave ((c)) leg should ideally complete as 5 waves soon. Extreme zone, equal legs is already reached at 105.1 area. We expect to see short term bounce in (iv) and another leg down to complete 5 waves in ((c)) wave. We expect Dollar to complete cycle from the peak at 105.1-103.85 area as Flat Pattern. That zone should find buyers for a 3 waves bounce X red.
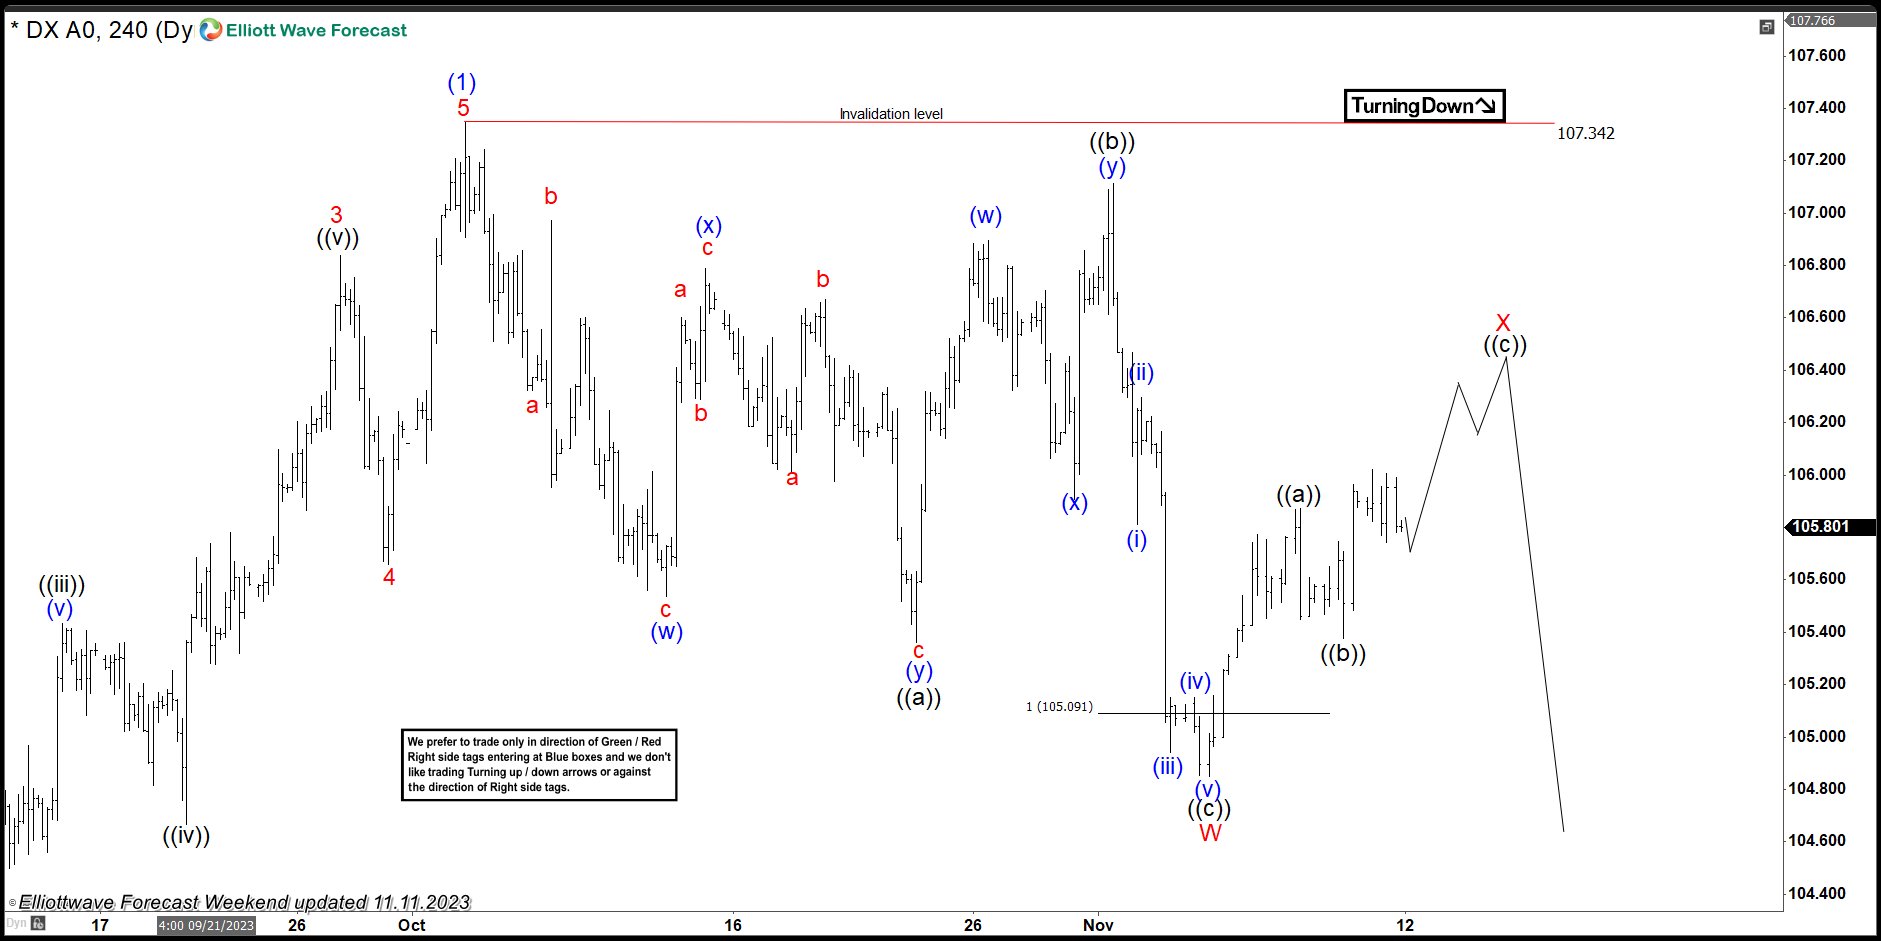
USDX Elliott Wave h4 Chart 11.11.2023
Dollar index made 5 waves down in ((c)) leg and completed Flat Pattern at 104.85 low. Current view suggests we are in X red connector. The price structure shows higher high sequences from the 104.85 low, suggesting we are potentially still in ((c)) of X that can see approximately 106.4-106.6 area.
Traders Eye Inflation Reports, OPEC Pushes Back
It's been a relatively uneventful start to the week but the next couple of days could be hugely important as the US and UK release inflation figures for October.
The two countries' central banks have, alongside others, been grappling with very high inflation for the last couple of years, and efforts to bring it down are finally bearing fruit.
Inflation in the US is expected to have fallen to 3.3% last month which is within touching distance of the Fed's 2% target. While the final push is expected to be the hardest, it will give the central bank some comfort that, despite the economy and labor market displaying remarkable resilience, a soft landing may still be possible.
Base effects are expected to turn much more favorable for the UK, where inflation is expected to have fallen from 6.7% in September to 4.7% in October. While that still leaves the BoE with a big job on its hands to more than half that again, it's a huge step in the right direction.
Wage growth remains a major headwind for both but particularly the UK, which will also get the latest labor market statistics on Tuesday. Lower than-forecast readings on inflation and wages could put an end to rate hike talk and see traders bring forward expectations on when the first cut will come.
Oil further pares losses as OPEC pushes back against pessimistic demand views
Oil prices are a little higher at the start of the week after bouncing off their recent lows over the last couple of sessions. Brent and WTI fell to their lowest levels since July last week in a sign that traders are becoming increasingly concerned about the global economy next year and the risk-premium in the Middle East has subsided.
The OPEC monthly oil market report appeared to push back against demand concerns, referencing overblown negative sentiment around Chinese demand while raising demand growth forecasts for this year and leaving them unchanged for next. The question now is whether OPEC+ members Russia and Saudi Arabia will push back with cuts beyond December.
Gold steady ahead of US CPI data
Gold prices are pretty flat today, as are Treasuries and the dollar, with traders clearly having an eye on the US inflation report tomorrow. The yellow metal has fallen more than 3% over the last week or so after repeatedly failing to significantly break above $2,000 and whether we see another run at that may depend on the October CPI report.