Sample Category Title
USD/JPY Analysis: New High of the Year
Yesterday, for the first time in 2023, the yen weakened to 150.7 per US dollar.
Thus, since the beginning of autumn, the yen has weakened by 3.5%, continuing the trend of 2023, which is due to the difference in the monetary policies of the two countries.
The Fed is pursuing a high rate policy. Yesterday's news testified to the stability of the economy, as US GDP is growing: fact = 4.9% in annual terms; expected = 4.5%; quarter ago = 2.4%. This provides a cushion for the Fed to continue keeping rates high to combat inflation.
At the same time, the Bank of Japan continues its ultra-loose policy, keeping the rate below zero. Today's news showed that Japan's CPI was: actual = 2.7%, expected = 2.5%, a month ago = 2.5%. That is, inflation in Tokyo is raising its head, which increases pressure on the Bank of Japan.
The Bank of Japan meeting will be held next week; on Tuesday, market participants may receive important news about the authorities' response to the weak yen and rising inflation. The chart shows that traders are afraid that the USD/JPY rate could drop sharply because progress in the development of the current trend is slowing down.
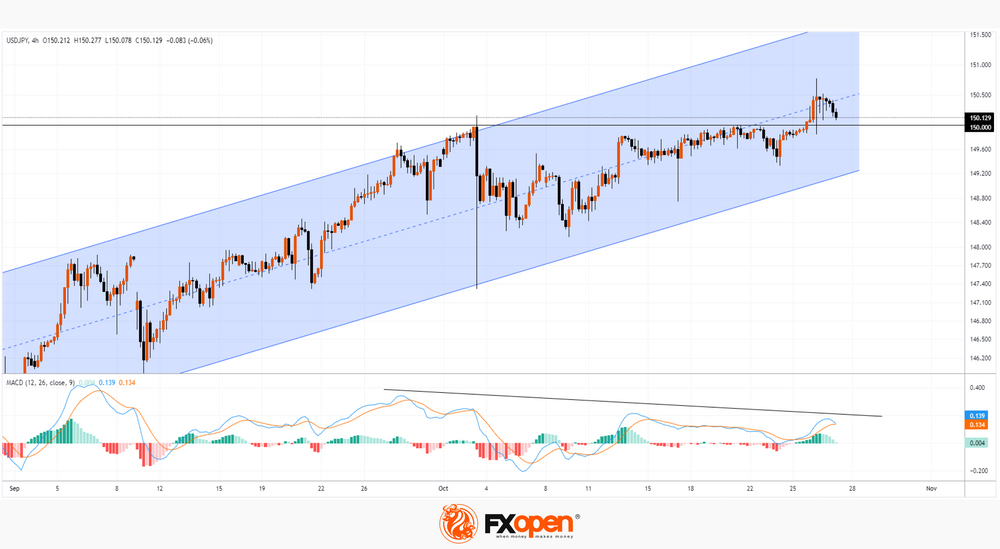
Note:
→ the divergence on the MACD indicator. The pressure of the bulls weakens;
→ having reached the high of the year, the price shows bearish dynamics today, showing the market’s unwillingness to gain a foothold at the top;
→ the upper boundary of the channel already seems unattainable;
→ the bullish momentum on October 25-26 may turn out to be a trap if the October 3 high is broken.
If the Bank of Japan takes real measures to support the yen, the USD/JPY rate may break down the current channel shown in blue.
This article represents the opinion of the Companies operating under the FXOpen brand only. It is not to be construed as an offer, solicitation, or recommendation with respect to products and services provided by the Companies operating under the FXOpen brand, nor is it to be considered financial advice.
Price of Gold Stabilises Near Its 5-month Highs
The XAU/USD rate fluctuates around $1,987 – the July high was formed around this price. And having overcome it, the market stabilized, as evidenced by the ADX indicator, which dropped to its minimum for the month.
Gold is up about 9% in three weeks on war fears. Moreover, if we take the year 2023, then gold has become a more profitable investment than the stock market, since according to Dow Jones Market Data, as of Thursday's close, the S&P 500 SPX index has gained 7.8% since January 1, at that time as front-month gold futures gained 9.2% over the same period.
On Friday, gold traders are focused on the release of US Core PCE Price Index values at 15:30 GMT+3. News about inflation could cause significant turbulence in the gold market.
The chart shows that the upside momentum within the ascending channel is fading around the USD 1,978 level as the price moves away from the upper boundary and the median line shows signs of resistance. Although the long lower shadows at the lows of October 24-26 indicate that gold is being actively bought up on declines.
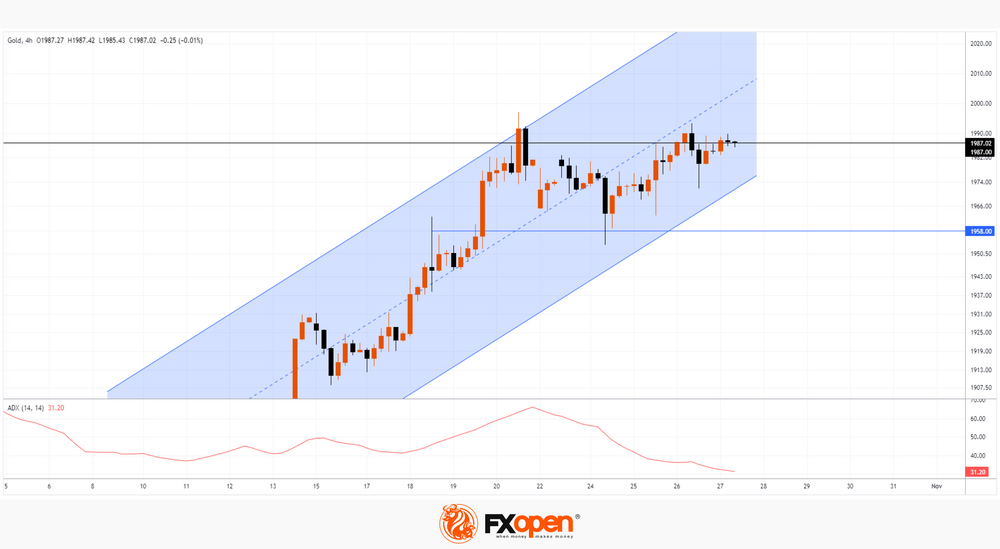
Technical support for the market can be provided by:
→ lower border of the channel;
→ level 1,958, which previously served as resistance, but has now changed its role.
The current stabilization of prices can be explained by the proximity of the psychological level of USD 2,000. News of the escalation from the Middle East could push the price beyond a round figure.
This article represents the opinion of the Companies operating under the FXOpen brand only. It is not to be construed as an offer, solicitation, or recommendation with respect to products and services provided by the Companies operating under the FXOpen brand, nor is it to be considered financial advice.
Dollar Index Holds in Extended Consolidation But Larger Bulls Remain Intact
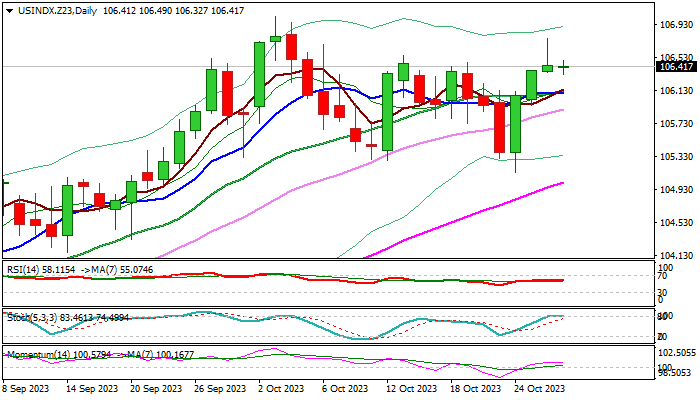
The dollar index remains constructive and holding near three-week high in early Friday, despite that the rally in past three days was rejected on Thursday (inverted hammer).
Short-term action holds in extended consolidation, entrenched within 105.14/107.03 range, under new 2023 high (peak of an uptrend from 99.20, July 18 low).
Larger bulls remain intact and keep in play expectations for continuation of larger uptrend after consolidative phase ends, with violation of pivotal 107 resistance zone (50% retracement of 114.72/99.20 downtrend of Sep 22/July 23/new 2023 high) to expose targets at 107.88 (22 Nov 2022 high) and 108.79 (Fibo 61.8% of 114.72/99.20).
Technical studies are bullish on both daily and weekly chart, though overbought daily conditions suggest that the action may hold within current range for some time.
Only firm break of range floor (105.27/14 higher base, also Fibo 23.6% of 99.20/107.03 uptrend) would weaken the structure and risk deeper pullback.
Fundamentals also work in favor of dollar, as US economy remains resilient and outperforms other major economies (EU, China, Japan), which will help Fed to keep high interest rates for longer period than other major central banks, while growing geopolitical tensions fuel risk aversion and also underpin safe-haven dollar.
Res: 106.76; 107.03; 107.88; 108.79.
Sup: 106.32; 106.00; 105.28; 105.14.
GBPJPY Extends Sideways Pattern Below 50-day SMA
- GBPJPY rebounded strongly from a 3-month low
- Gets stuck in a range after the 50-day SMA curbs advance
- RSI and MACD are hovering around their neutral regions
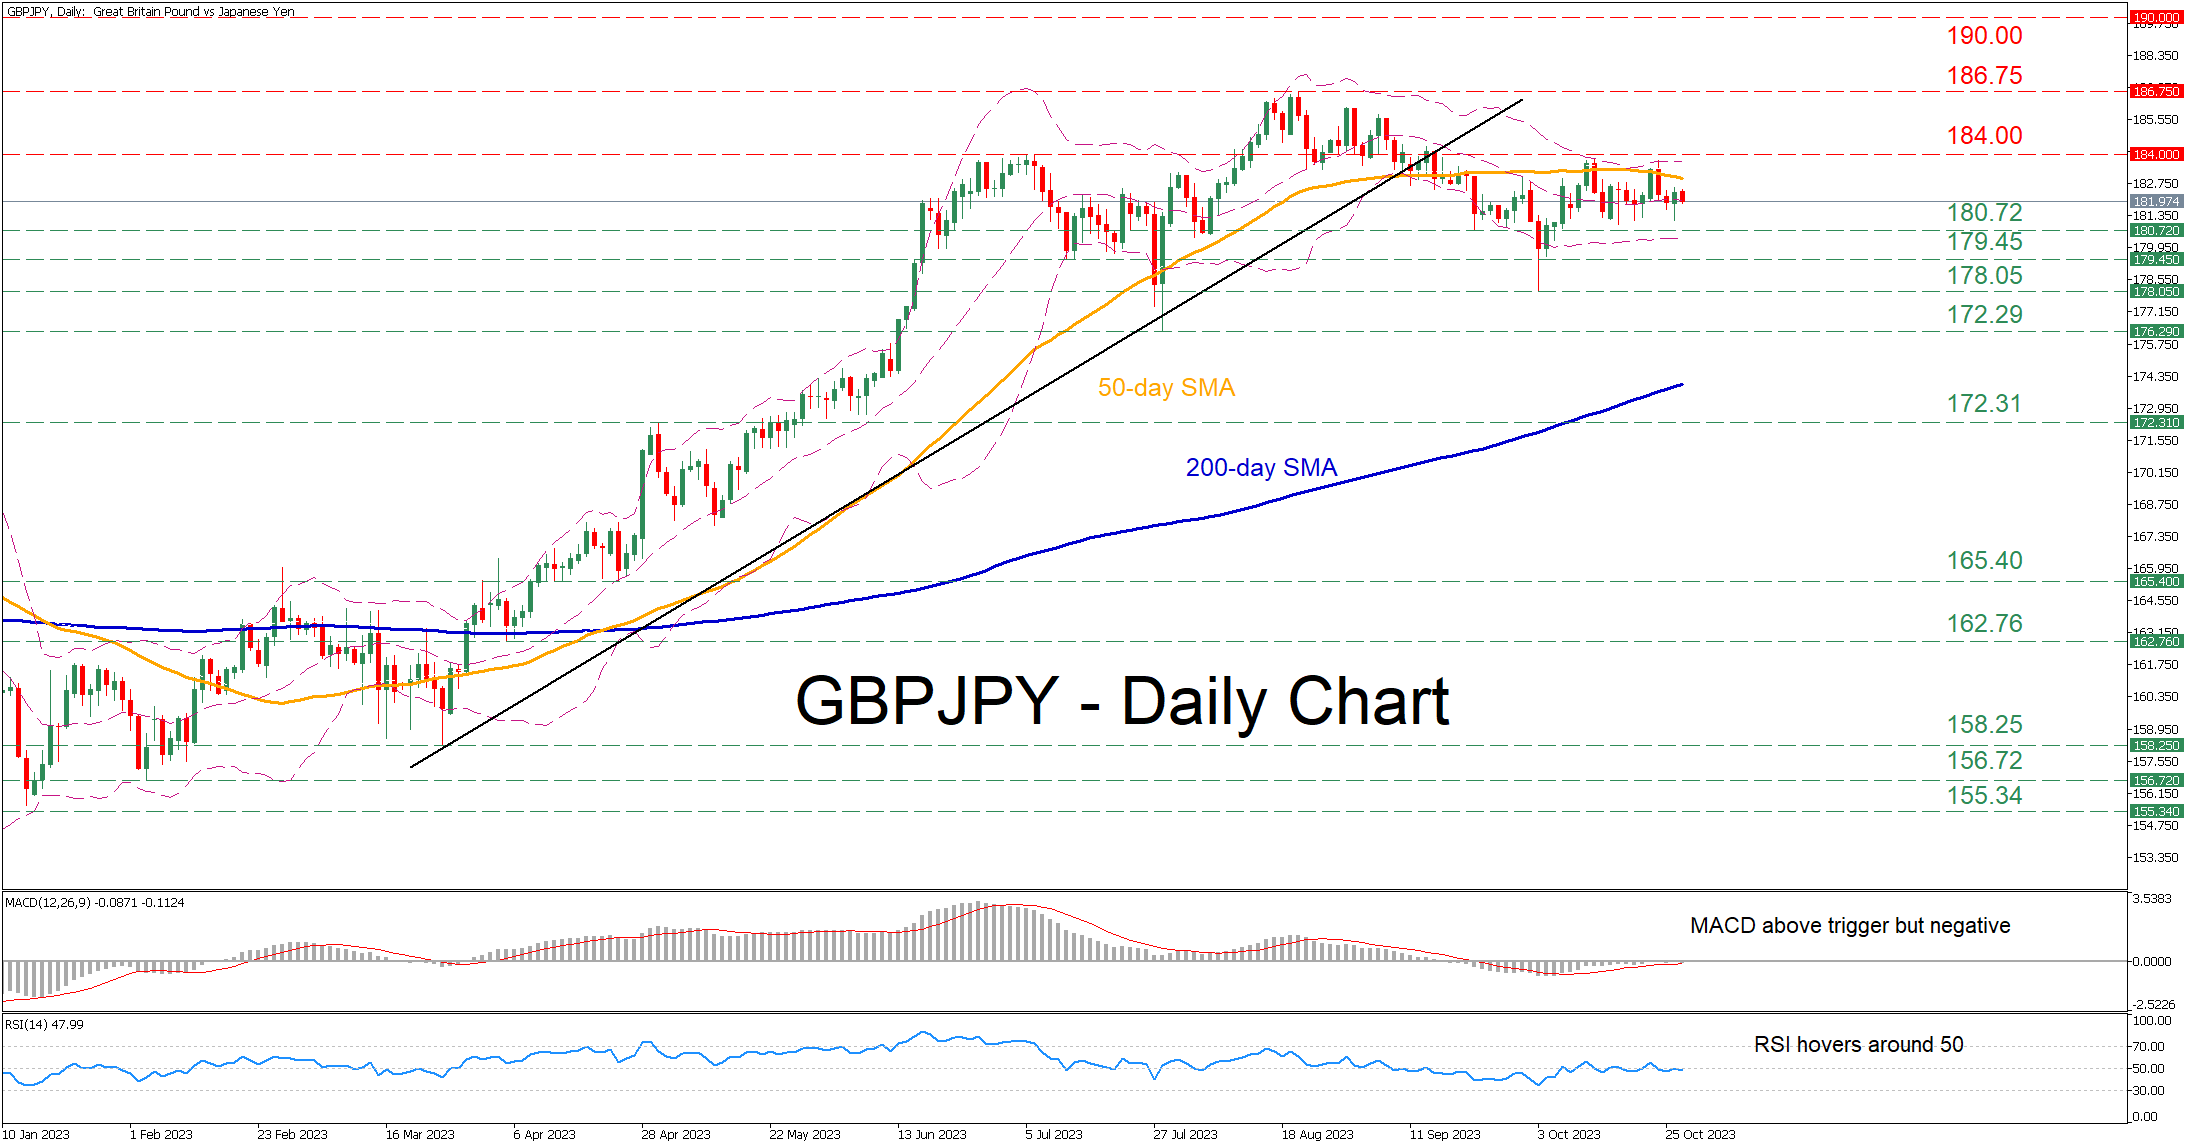
GBPJPY had been in a prolonged uptrend since January, posting an eight-year high of 186.75 on August 22 before experiencing a pullback. Even though the pair staged a solid recovery, it has been rangebound for the past two weeks, with the narrowing Bollinger Bands hinting at low volatility ahead.
Should the price march higher and reclaim its 50-day simple moving average (SMA), immediate resistance could be met at the July high of 184.00, which also acted as a strong ceiling in October. Piercing through that wall, the pair could revisit its eight-year high of 186.75. If that hurdle also fails, the price could post fresh multi-year highs, where the 190.00 psychological mark might curb further advances.
On the flipside, should selling interest intensify, the bears could initially attack the 180.72 support zone. Even lower, the pair might challenge the 179.45 hurdle, which held strong both in July and October. Breaking below that level, the price could descend towards the October bottom of 178.05.
In brief, GBPJPY has been directionless for the past two weeks as the short-term oscillators continue to reflect a neutral tone. Hence, a break above the 50-day SMA is needed to shift the outlook back to positive.
USDJPY Holds Above 150 But With Caution
- USDJPY unlocks new high above 150 but with weak momentum
- Technical signals mixed; support at 149.43
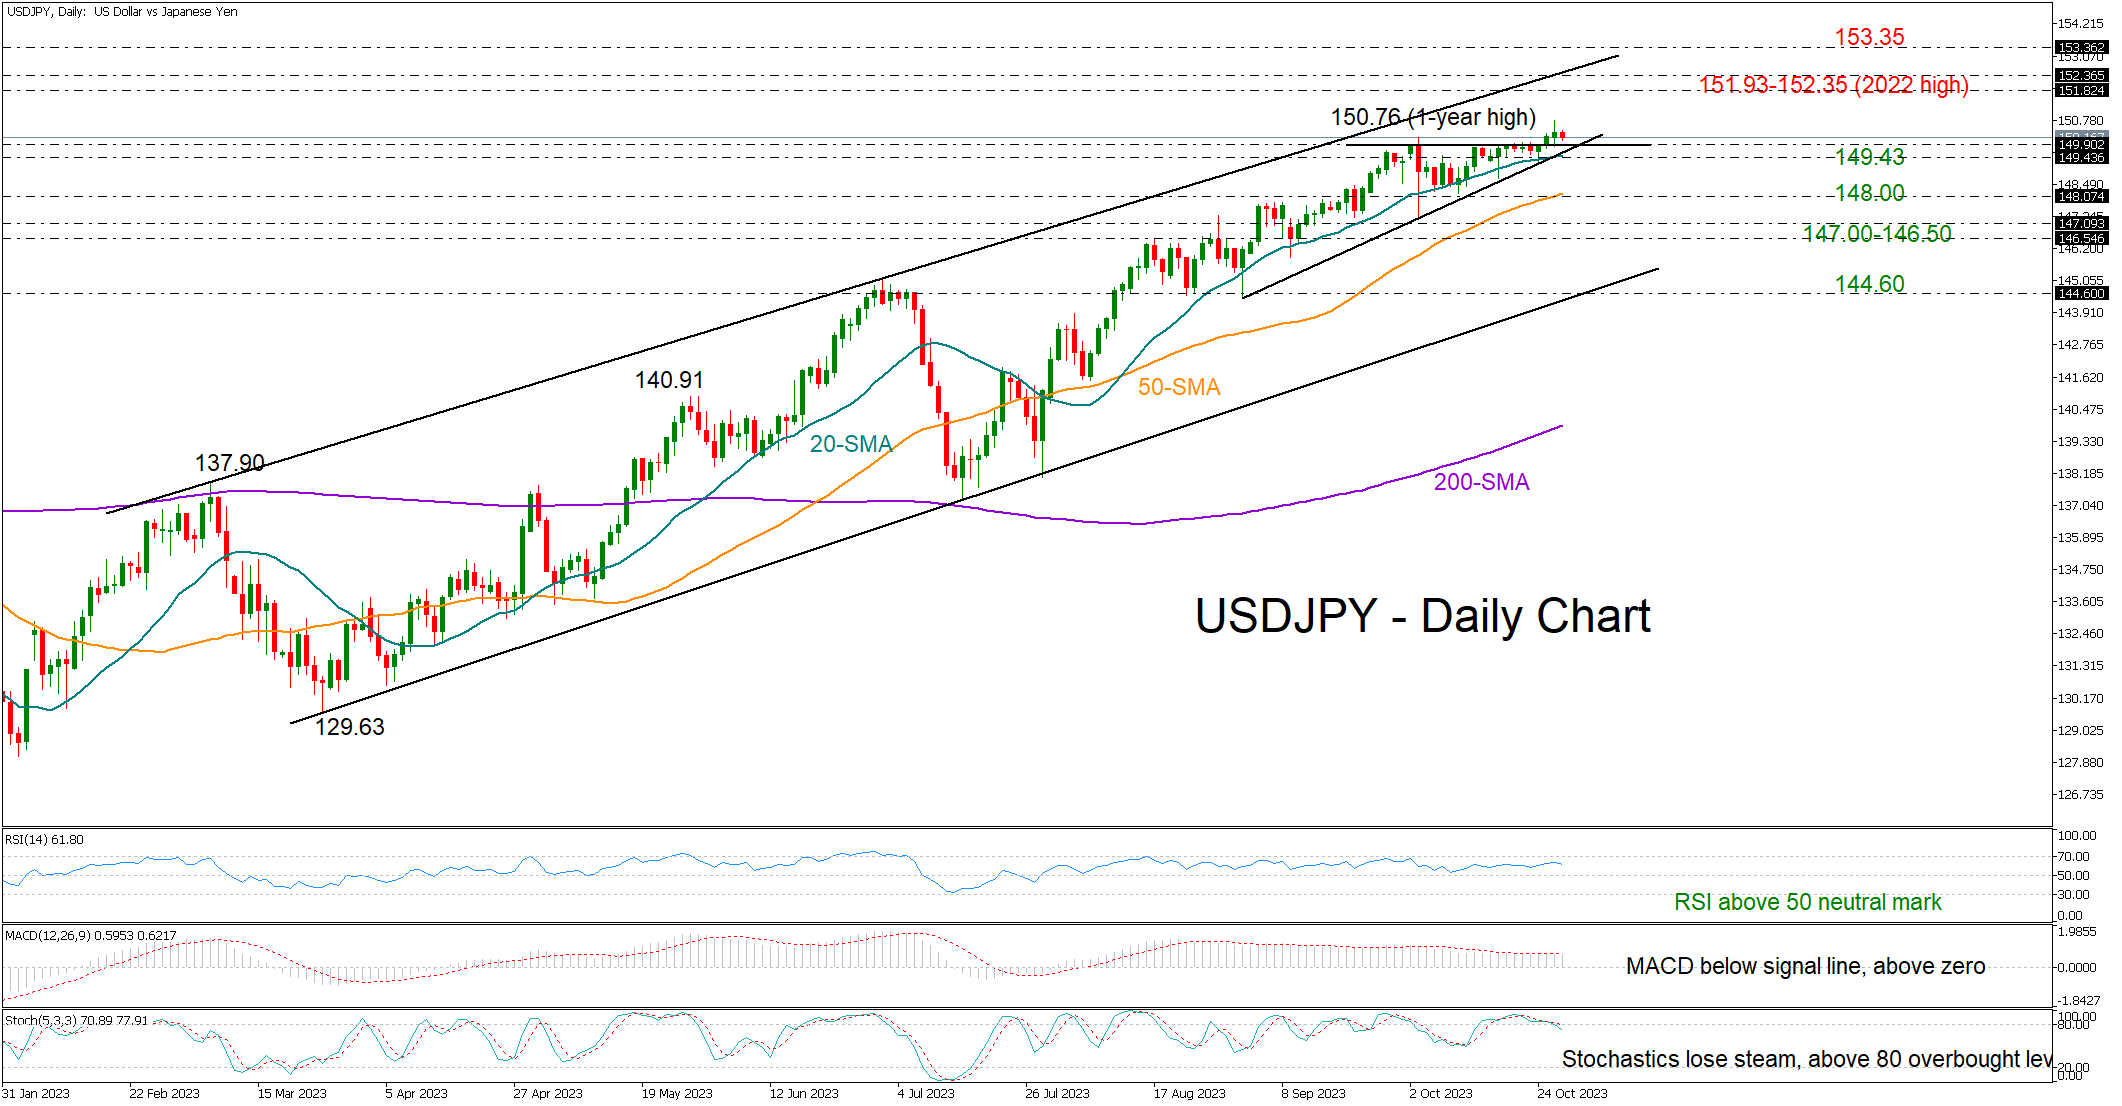
USDJPY escaped the FX intervention risk on Thursday despite closing marginally above the 150 round level for the second consecutive day and charting a new one-year high of 150.76.
The pair seems to have pierced an ascending triangle on the upside, increasing optimism for a bullish continuation ahead of the US core PCE inflation release. Yet, Thursday’s tiny candlestick at the top of the uptrend and the mixed technical signals are currently reflecting some skepticism in the market.
Should the bulls resume their positive momentum, they may immediately hit the 151.93-152.35 area formed by the 2022 top and the upper band of the broad bullish channel. Beyond that, the 153.35 area had been somewhat restrictive during 1990, while the 155.35-156.60 had been another key obstacle in the same year and therefore could be the next target.
In the event the price tumbles below the triangle and the 20-day simple moving average (SMA) at 149.43, the 50-day SMA could come first to the rescue at 148.00. A break below the latter could take a breather within the 146.50-147.00 territory. If not, the sell-off could intensify towards the channel’s lower band at 144.60.
Summing up, USDJPY has stretched its 2023 uptrend to new highs this week, but with a lack of strong momentum, there are concerns that buying appetite is fading. Still, the focus is expected to remain on the upside unless the price slides below 149.43.
GBP/JPY Daily Outlook
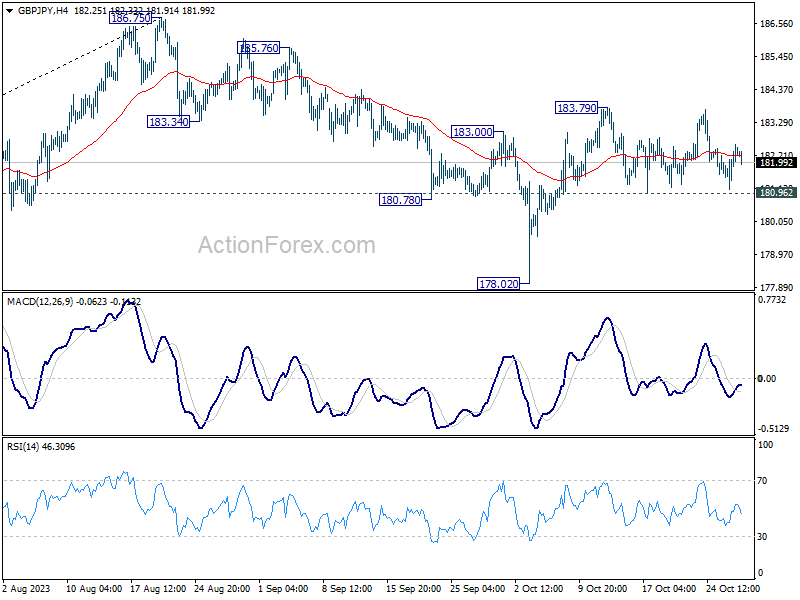
Daily Pivots: (S1) 181.49; (P) 182.04; (R1) 182.96; More...
Intraday bias in GBP/JPY remains neutral and outlook is unchanged. With 181.00 support intact, further rise is in favor. The favored case is still that correction from 186.75 has completed at 178.02. Above 183.79 will resume the rise from 178.02 to retest 186.75 high. However, break of 181.00 will dampen this view, and turn bias back to the downside for 178.02 instead.
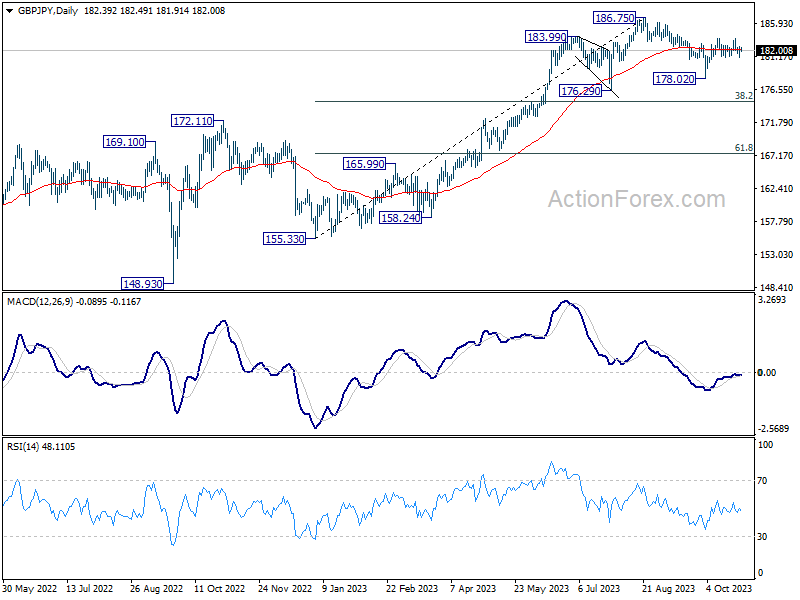
In the bigger picture, fall from 186.75 is seen as a corrective move only. As long as 176.29 support holds, larger up trend from 123.94 (202 low) should still be in progress. Break of 186.75 will target 195.86 (2015 high). Nevertheless, firm break of 176.29 will confirm medium term topping, and bring lengthier and deeper consolidations.
EUR/JPY Daily Outlook
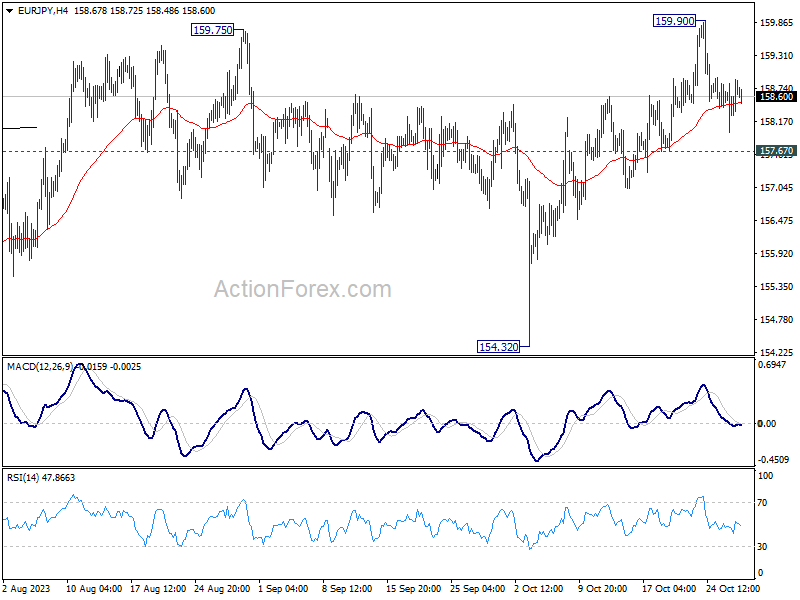
Daily Pivots: (S1) 158.28; (P) 158.59; (R1) 159.19; More....
Intraday bias in EUR/JPY stays neutral at this point. Further rise is in favor as long as 157.67 support holds. Above 159.90 will resume larger up trend to 163.06 projection level. However, firm break of 157.67 will turn bias back to the downside 154.32 support instead.
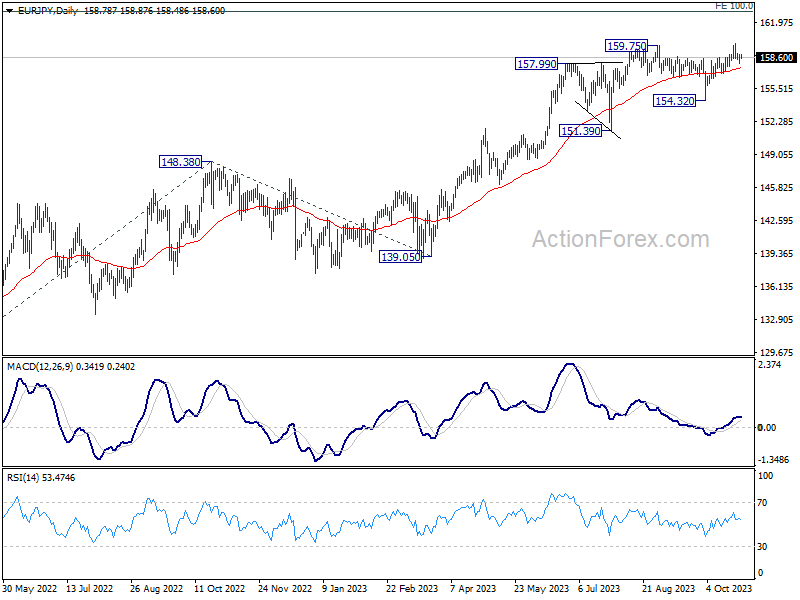
In the bigger picture, rise from 114.42 (2020 low) is in progress. next target is 100% projection of 124.37 to 148.38 from 139.05 at 163.06. On the downside, break of 154.32 support is needed to be the first sign of medium term topping. Otherwise, outlook will remain bullish even in case of deep pullback.
EUR/GBP Daily Outlook
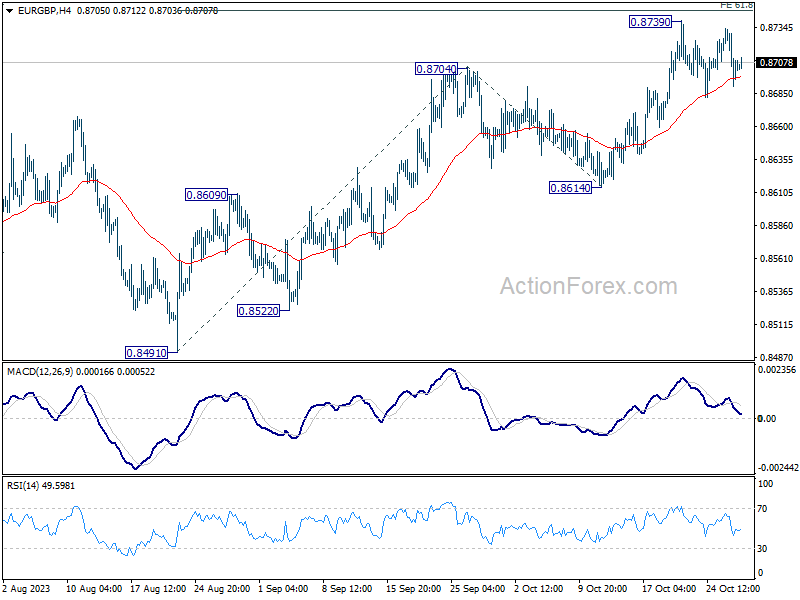
Daily Pivots: (S1) 0.8690; (P) 0.8712; (R1) 0.8732; More....
Outlook in EUR/GBP is unchanged and intraday bias remains neutral. Consolidation from 0.8739 might still extend. But downside of retreat should be contained well above 0.8614 support to bring another rally. Firm break of 0.8739 will target 100% projection of 0.8491 to 0.8704 from 0.8614 at 0.8827 next.
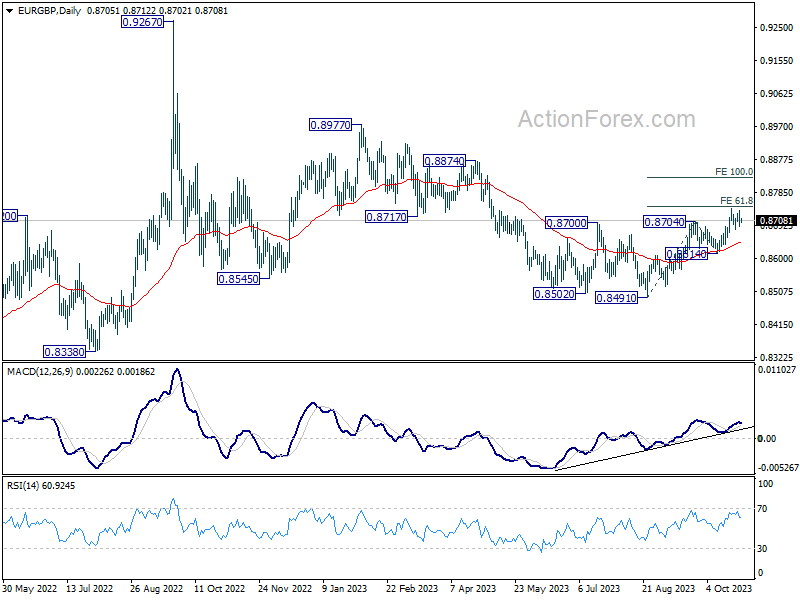
In the bigger picture, current development suggests that whole down trend from 0.9267 (2022 high) has completed with three down to to 0.8491. Rise from 0.8491 is seen as another leg inside that pattern from 0.9499 (2020 high). Further rally should be seen to 0.8977 resistance and above. This will now remain the favored case as long as 0.8614 support holds.
EUR/AUD Daily Outlook
Daily Pivots: (S1) 1.6645; (P) 1.6735; (R1) 1.6799; More...
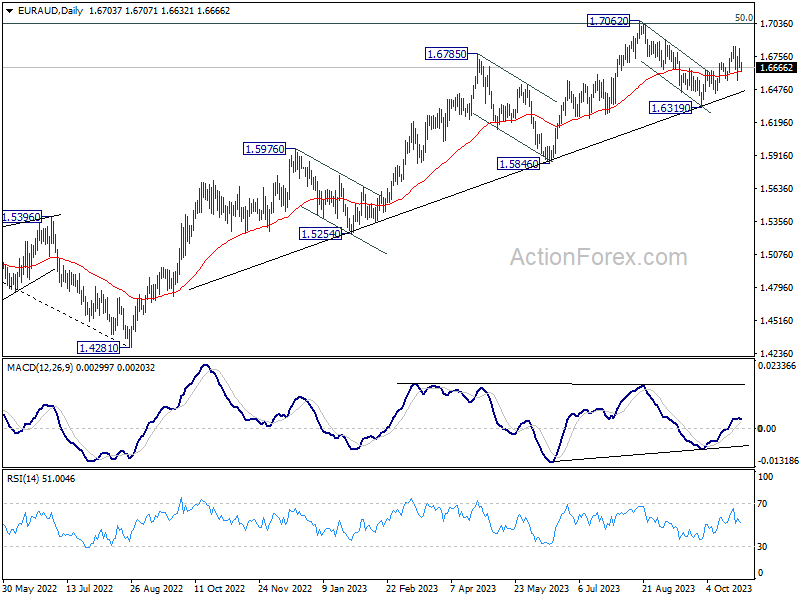
Range trading continues in EUR/AUD and intraday bias stays neutral. On the upside, above 1.6843 will resume the rebound from 1.6319. Firm break there will resume larger up trend. However, break of 1.6550 support will bring deeper fall back to 1.6319 support instead.
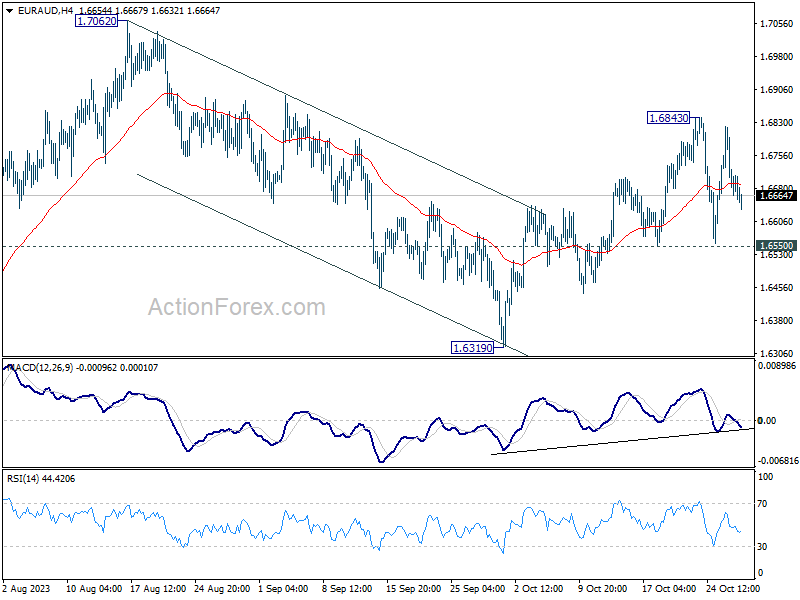
In the bigger picture, the strong support from medium term rising trend line indicates that rise from 1.4281 (2022 low) is still in progress. Sustained break of 1.7062 will pave the way to 61.8% retracement of 1.9799 (2020 high) to 1.4281 at 1.7691. In any case, outlook will stay bullish as long as 1.6319 support holds.
EUR/CHF Daily Outlook
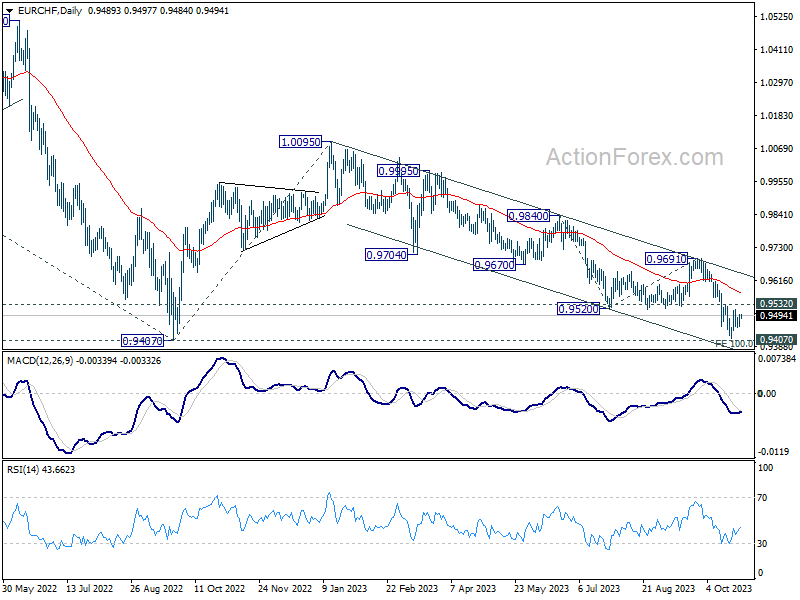
Daily Pivots: (S1) 0.9471; (P) 0.9485; (R1) 0.9511; More...
Intraday bias in EUR/CHF remains neutral as range trading continues. Outlook remains bearish with 0.9532 resistance intact. On the downside, decisive break of 0.9407 medium term bottom will confirm resumption of larger down trend. Next near term target will be 100% projection of 0.9840 to 0.9520 from 0.9691 at 0.9499, and then 161.8% projection at 0.9179. However, firm break of 0.9532 will confirm short term bottoming, and turn bias to the upside for 0.9691 resistance instead.
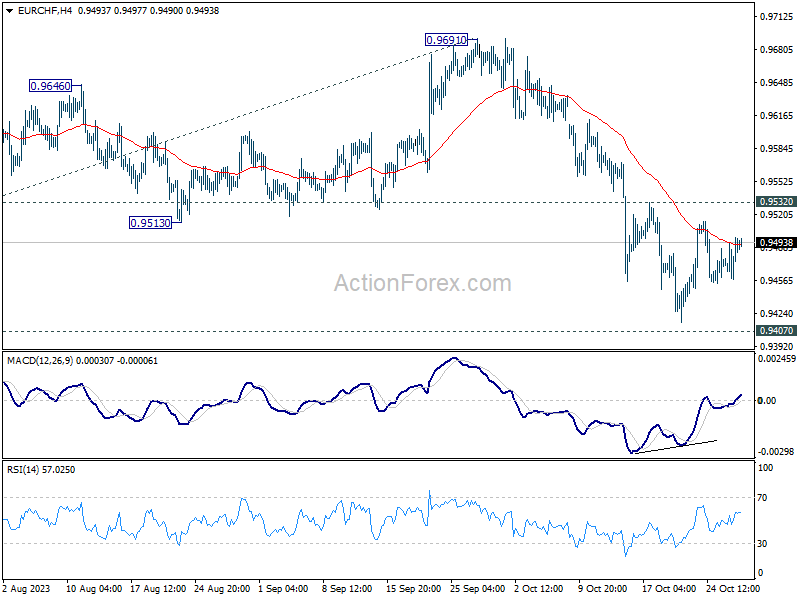
In the bigger picture, down trend from 1.2004 (2018 high) is still in progress. Decisive break of 0.9407 will confirm resumption, and target 61.8% projection of 1.1149 to 0.9407 from 1.0095 at 0.9018. On the upside, break of 0.9691 resistance is needed to be the first sign of medium term bottoming. Otherwise, outlook will stay bearish.