Sample Category Title
USD/CAD Daily Outlook
Daily Pivots: (S1) 1.3800; (P) 1.3822; (R1) 1.3854; More...
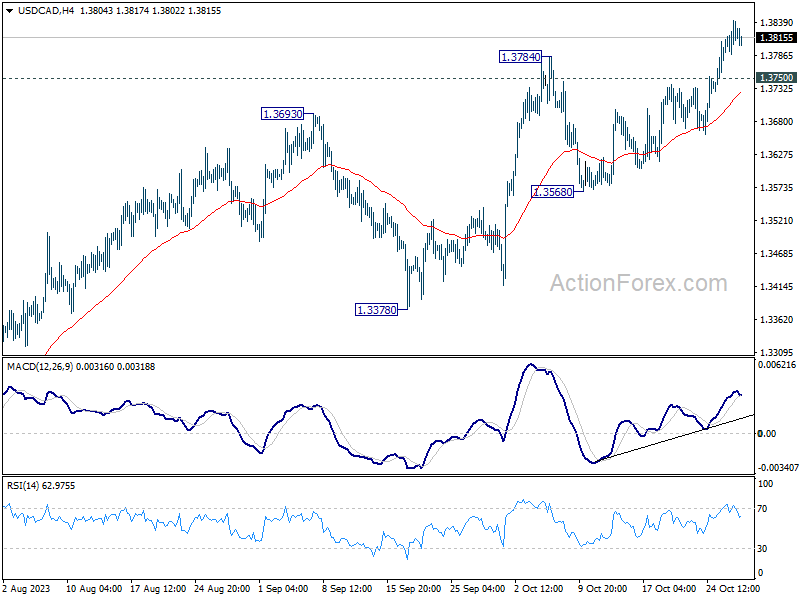
Intraday bias in USD/CAD stays on the upside for further rally to retest 1.3976 high. Decisive break there will resume larger up trend. On the downside, below 1.3750 minor support will turn intraday bias neutral and bring consolidations. But near term outlook will remain bullish as long as 1.3568 support holds.
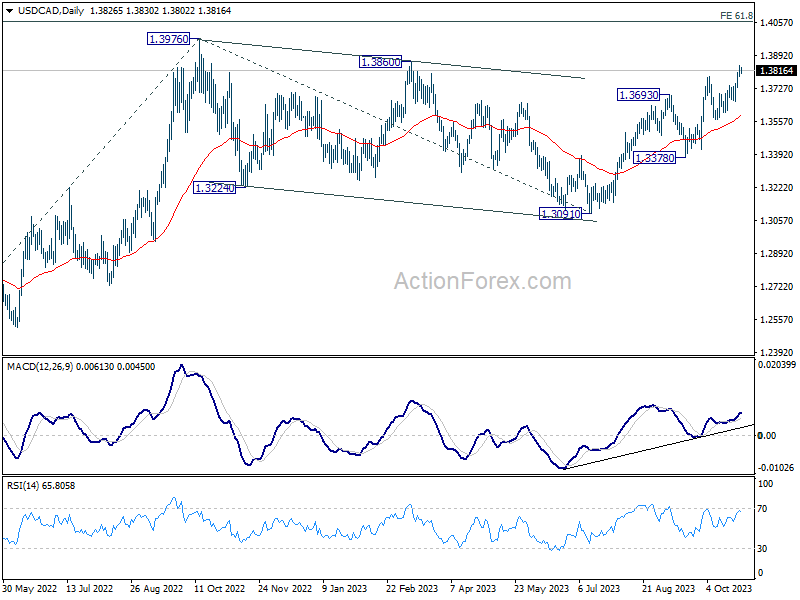
In the bigger picture, current development revives the case that corrective pattern from 1.3976 (2022 high) has completed with three waves down to 1.3091. Decisive break of 1.3976 high will confirm resumption of up trend from 1.2005 (2021 low). Next target will be 61.8% projection of 1.2401 to 1.3976 from 1.3091 at 1.4064. This will now remain the favored case as long as 1.3378 support holds.
AUD/USD Daily Report
Daily Pivots: (S1) 0.6284; (P) 0.6308; (R1) 0.6345; More...
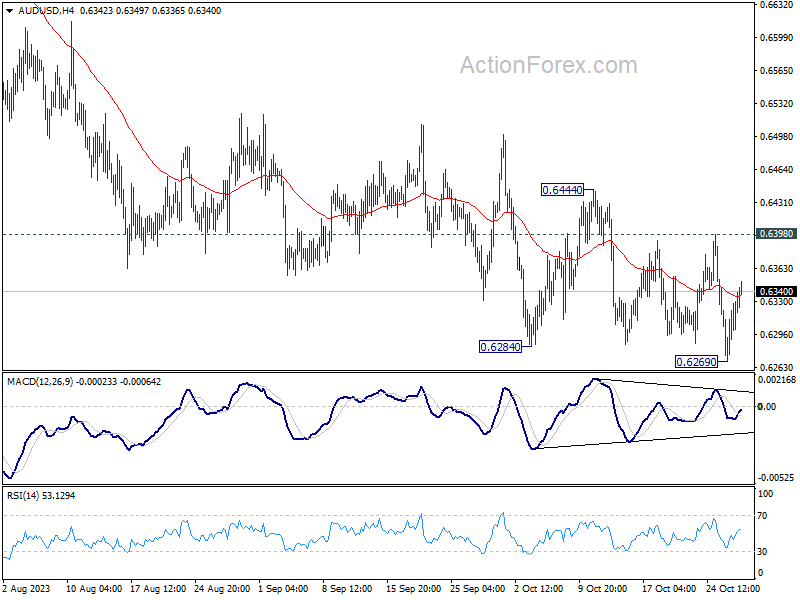
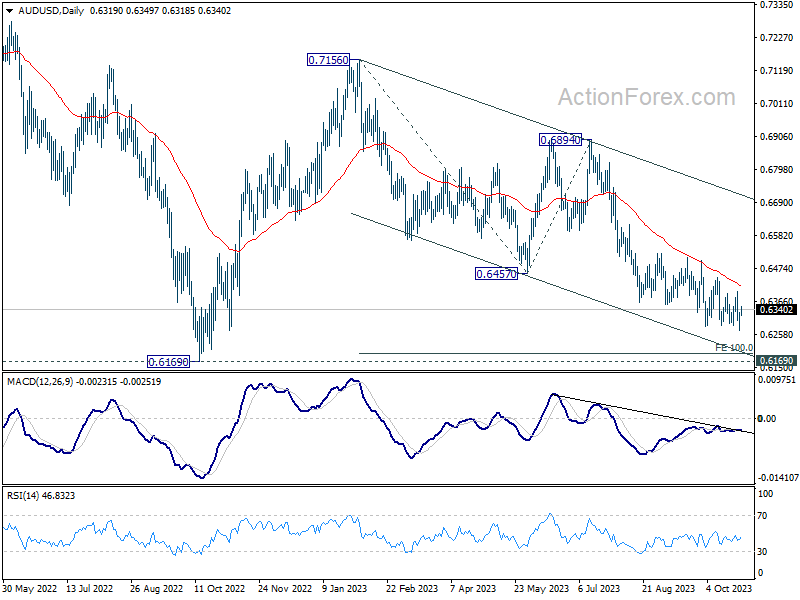
AUD/USD recovered quickly after dipping to 0.6269 and intraday bias is turned neutral first. Outlook stays bearish with 0.6398 resistance intact. below 0.6269 will resume larger fall from 0.7156. Next target is 100% projection of 0.7156 to 0.6457 from 0.6894 at 0.6195, which is close to 0.6169 medium term support.
In the bigger picture, down trend from 0.8006 (2021 high) is possibly still in progress. Decisive break of 0.6169 will target 61.8% projection of 0.8006 to 0.6169 to 0.7156 at 0.6021. This will now remain the favored case as long as 0.6894, in case of strong rebound.
EUR/USD Daily Outlook
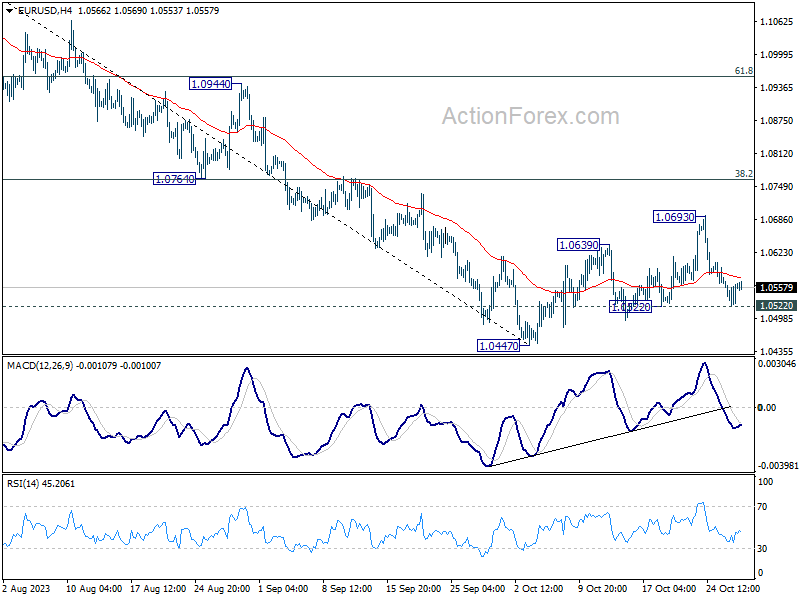
Daily Pivots: (S1) 1.0534; (P) 1.0554; (R1) 1.0584; More...
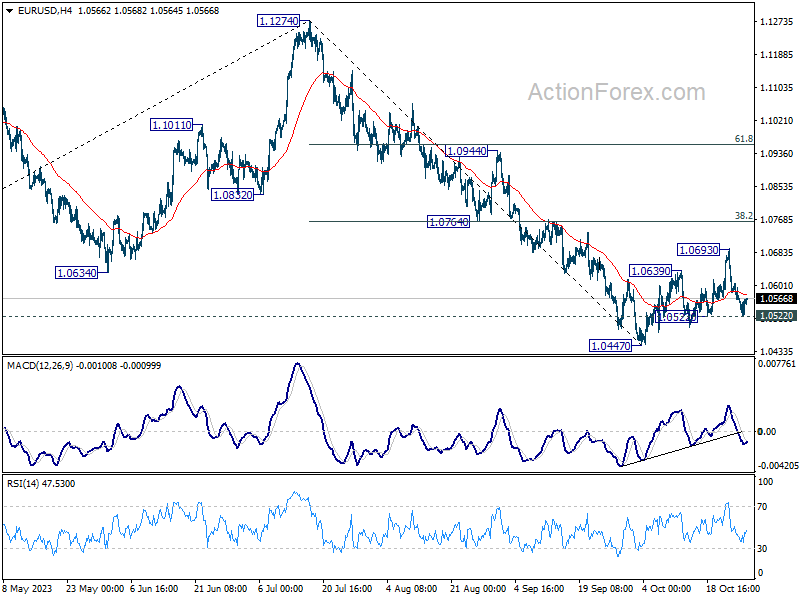
Intraday bias in EUR/USD stays neutral at this point. On the downside, break of 1.0522 support will confirm rejection by 55 D EMA, and retain near term bearishness. Intraday bias will be back on the downside for 1.0447. Break there will resume larger fall from 1.1274. On the other, strong bounce from current level, followed by break above 1.0693, rebound from 1.0447 to 1.0764 cluster resistance (38.2% retracement of 1.1274 to 1.0447 at 1.0763).
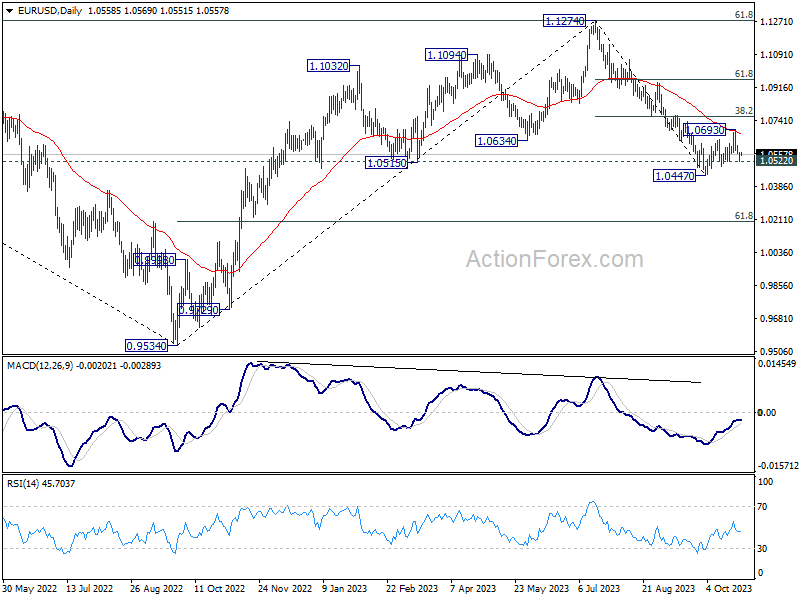
In the bigger picture, fall from 1.1274 medium term top could still be a correction to rise from 0.9534 (2022 low). But chance of a complete trend reversal is rising. In either case, current fall should target 61.8% retracement of 0.9534 to 1.1274 at 1.0199 next. For now, risk will stay on the downside as long as 55 D EMA (now at 1.0668) holds, in case of rebound.
GBP/USD Daily Outlook
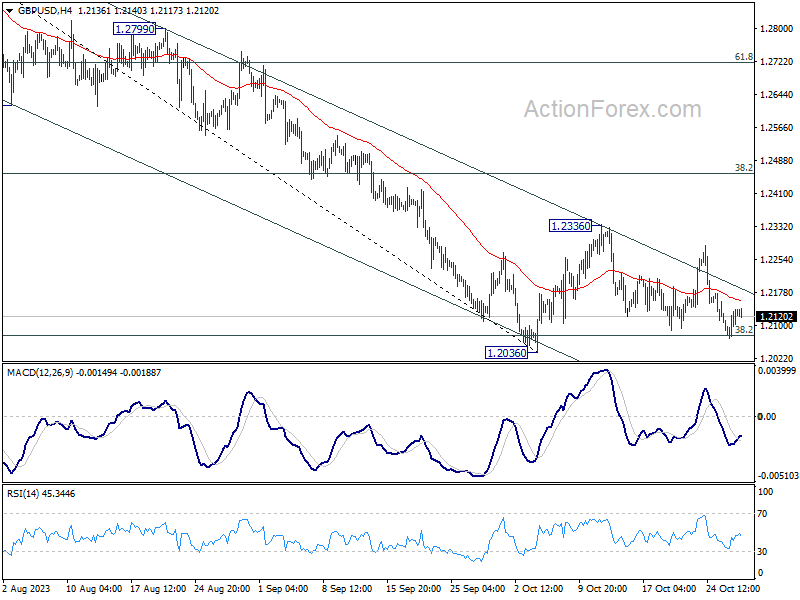
Daily Pivots: (S1) 1.2085; (P) 1.2112; (R1) 1.2155; More
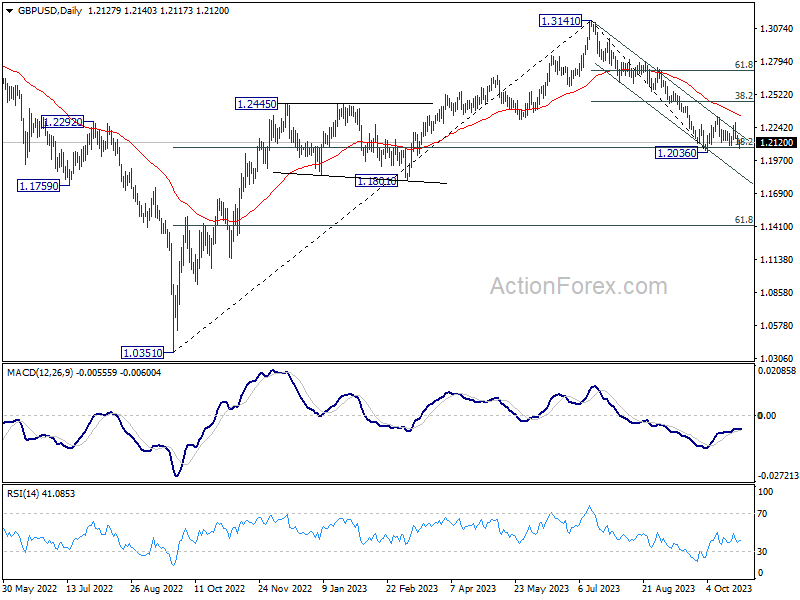
GBP/USD is still extending the consolidation from 1.2036 and intraday bias remains neutral. Downside breakout is in favor with 1.2336 resistance intact. On the downside, decisive break of 1.2036 will resume whole decline from 1.3141 for 1.1801 support next. However, break of 1.2336 will turn bias back to the upside for 38.2% retracement of 1.3141 to 1.2036 at 1.2458.
In the bigger picture, fall from 1.3141 medium term top could still be a correction to up trend from 1.0351 (2022 low) only. But risk of complete trend reversal is rising. Sustained break of 38.2% retracement of 1.0351 to 1.3141 at 1.2075 will pave the way to 61.8% retracement at 1.1417. For now, risk will stay on the downside as long as 55 D EMA (now at 1.2346) holds, in case of rebound.
USD/JPY Daily Outlook
Daily Pivots: (S1) 149.91; (P) 150.34; (R1) 150.85; More...
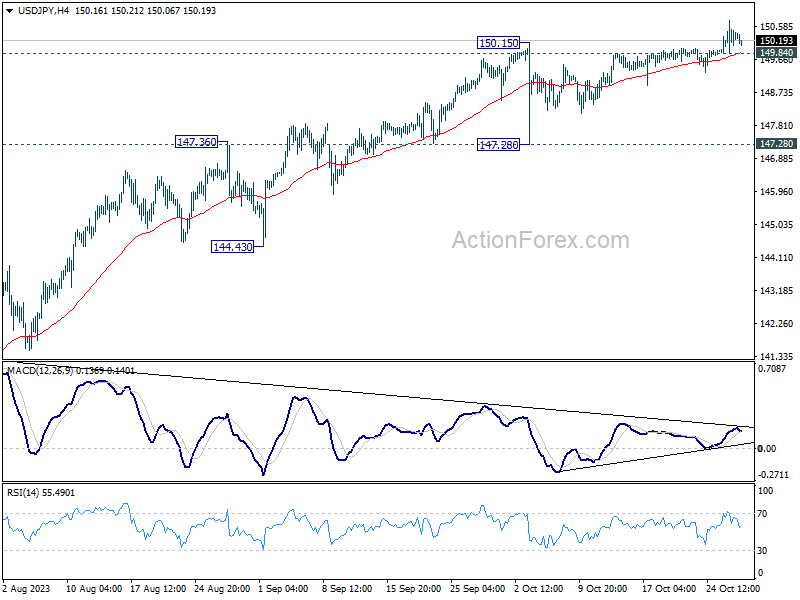
Intraday bias in USD/JPY remains on the upside for the moment, with 149.85 minor support intact. Current rally, as part of the whole rise from 127.20, should target 151.93 medium term resistance next. On the downside, below 149.84 minor support will turn intraday bias neutral first, and bring consolidations. But near term outlook will now stay bullish as long as 147.28 support holds, even in case of deep retreat.
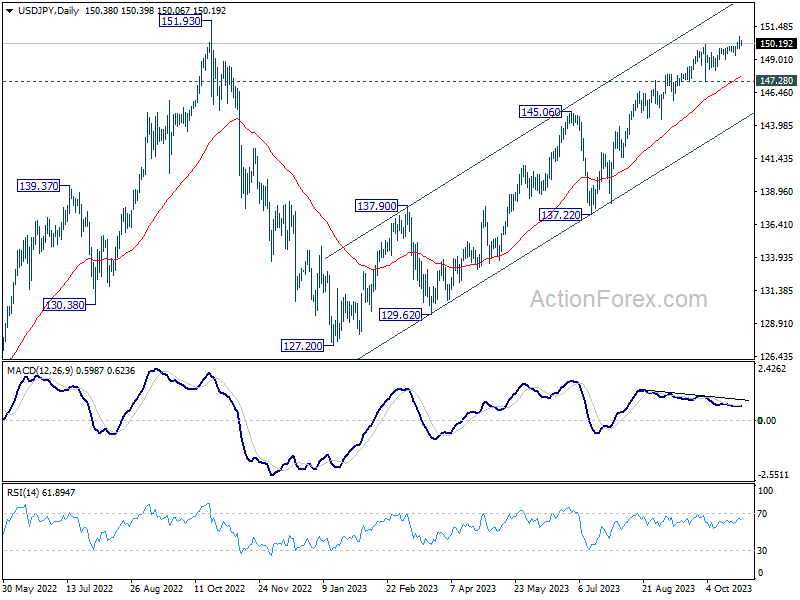
In the bigger picture, while rise from 127.20 is strong, it could still be seen as the second leg of the corrective pattern from 151.93 (2022 high). Rejection by 151.93, followed by sustained break of 145.06 resistance turned support will be the first sign that the third leg of the pattern has started. However, sustained break of 151.93 will confirm resumption of long term up trend.
Dollar Might Cede Some Ground If Equities Would Enter Calmer Waters
Markets
Bonds yesterday showed volatile swings after the release of a series of US data and the ECB policy decision. However, as was often the case of late, moves mostly mirrored internal market dynamics rather than the news. The first estimate of the Q3 US GDP at 4.9% QoQa beat expectations, with strong private consumption, gross private investment, government consumption and even inventory building all supporting the strong growth performance. Price indicators were mixed. The core PCE deflator eased slightly more that expected to 2.4% (from 3.7%). September durable goods orders (4.7%) also were strong. Jobless claims rose slightly more than expected, but at 210k still suggest a solid labour market. In globo, the data confirmed the picture of a resilient US economy. US yields trended cautiously higher going into the data releases, but were captured by some kind of buy-the-rumour sell the fact dynamics afterward. The bond rebound was supported by a solid $38 bln 7-y US Treasury auction. In the end US yields eased between 12.3 bps (5-y) and 8.1 bps (2-y). At least for now, near 5%-yields apparently still attracts some buying interest, whatever the economic news.
The ECB as expected paused the hiking cycle that started in July last year, which lifted the depo rate from -0.5% to 4.0%. Inflation remains too high but declined markedly of late. The bank assesses that interest rates have reached a level that, if maintained sufficiently long, will make a substantial contribution to bring inflation back to target. Lagarde didn’t formally call an end to the hiking cycle and advocates a data dependent approach. However, given recent poor data, the bar for additional hikes is high. The bank didn’t change its guidance to continue reinvesting the proceeds from maturing PEPP bonds at least until the end of 2024. This can be considered as a soft touch. German yields changed between minus 5.0 bps (2-y) and unchanged (30-y).
On other markets, the combination of solid US data and softer yields didn’t really help equities (Nasdaq -1.76%, Eurostoxx -0.59%) ). The dollar again didn’t find a clear trend. DXY closed little changed at 106.6 as did EUR/USD (close 1.056). USD/JPY held north of the 150 barrier (150.40).
This morning, risk sentiment in Asian improves supported by solid results of the likes of Amazon after the WS close yesterday evening. Treasuries are losing marginal ground. The dollar trades little changed. Higher than expected Tokyo CPI data puts additional pressure on the BOJ to tweak its policy. Even so, the direct impact on USD/JPY is limited (150.2). Later today, the eco calendar is thin, except for the US September spending and income data and PCE price deflators (core expected at 3.7% from 3.9%). For bond markets, we expect more technical trading in the run-up to next week’s FOMC meeting. The dollar might cede some ground if equities would enter calmer waters after recent sell-off. EUR/USD tries to regain the October uptrend line (currently 1.057 area). If it succeeds it could create some short-term relief for the pair.
News and views
October inflation in Tokyo, a directional guide for the national figure, came in surprisingly hot. The headline number was seen coming in at the same 2.8% pace of September but instead accelerated to 3.3%. A core gauge excluding fresh food ticked up from 2.5% to 2.7%. The same measure which also strips energy eased marginally to 3.8% but from an upwardly revised September figure (3.9%). It puts the Bank of Japan ever more in a corner. The BOJ sticks to the view that much of the price surge, is just temporary. The BoJ meets next week. Earlier this week, rumours circulated it may lift the current 1% 10-y yield cap at that meeting. Yields are on the rise due to inflation and the global environment, potentially forcing the BoJ to defend the cap through bond buying in an increasingly thin (and distorted) market. The yen pays a heavy price for the central bank’s stubbornness. USD/JPY in the last two days pushed through the symbolical (& intervention) level of 150.
China’s Securities Journal reported that there’s a “high possibility” the central bank will lower the reserve requirement ratio for banks in the current quarter. Such a move would free up liquidity needed to absorb the CNY 1tn in additional spending the country earlier this week announced in a bid to shore up the economy.
ECB Firmly on Hold
Market movers today
In Sweden, retail sales data for September will be released at 8.00 CET and it is possible that we will see a small decline m/m after five months of consecutive increases. This as consumer confidence declined slightly in September (but recovered during October) and the e-commerce indicator from the Swedish Trade Federation also showed weakness in September. Otherwise focus will be on the Riksbank's business survey published at 9.30 CET. The report was highlighted in the minutes from September as an important input ahead of the Riksbank's November meeting, where especially Aino Bunge stressed that she will look for comments on price setting behaviours.
Following yesterday's ECB meeting, the ECB's survey of professional forecasters is due today, read more about our take on ECB here: Flash ECB Review: Not rocking the boat, 26 October.
In the US, the University of Michigan survey will be released.
After Israeli army raid into Gaza, we will continue to monitor any developments in the conflict over the weekend.
The 60 second overview
ECB. As expected, ECB kept policy rates unchanged at yesterday's meeting and guided that they are done with additional rate hikes. Lagarde seemed to be on a mission not to rock the boat in terms of market pricing, she succeeded well and gave indications that this was a stock taking meeting only. Lagarde highlighted uncertainty about the economic outlook and remained confident that inflation would return to the target if rates were maintained for a sufficiently long duration at the current level, based on today's inflation. Surprisingly, no discussion took place on advancing the full end to PEPP reinvestments. The outcome was marginally to the dovish side of expectations and led to a minor dovish market reaction to the ECB decision and the press conference, which was supported by US data release along the way. Markets are pricing the first full rate cut in June next year. For more details, see Flash ECB Review: Not rocking the boat , 26 October.
Japan. Overnight, October inflation in Japan surprised to the upside when looking at both the headline and core inflation. Headline increased from 2.8% y/y to 3.3% y/y, while core (which excludes fresh food) rose to 2.7% (up from 2.5%). When excluding for both fresh food and energy inflation slowed to 3.8% from a revised 3.9% in September. The Bank of Japan meets on Tuesday, where we believe that further tweaks to the YCC may occur, but we anticipate that the negative short-term policy rate will not be abandoned until Q2 next year. We maintain a bearish view on USD/JPY, primarily due to our belief that there are limited upward risks to US yields from this point.
US. US Q3 GDP data surprised to the topside yesterday with Flash GDP at 4.9% Q/Q AR (Consensus 4.3%, Q2 2.1%). Inflation development was positive though, with core PCE inflation slightly below expectations at 2.4% on Q3 as a whole (consensus 2.5%). Private consumption remained strong, real consumption volume grew 0.98% q/q, driven especially by services, and accounting for the majority of the growth. Public investments also continued to grow strongly, supported by past infrastructure stimulus measures. Private sector structures investment boom cools clearly after a strong H1. Although inventories contributed by +1.3 percentage points to the GDP figure, the US economy and especially the American consumer remains on a solid footing.
Equities: The combination of solid earnings, strong macro numbers and a slightly dovish ECB was not enough to lift equities. That being said, most of yesterday's drop was already in the future and hence it is fair to say that what we learned yesterday was not really negative for equities. We saw a slightly defensive rotation but it was very much linked to earnings reporting and to a lesser extent to macro and monetary policy. In US Dow -0.8%, S&P 500 -1.2%, Nasdaq -1.8% and Russell 2000 +0.3%. After hour earnings came out strong and we see Asian markets higher this morning together with both US and European futures.
FI: Yesterday's slightly dovish market reaction was in line with the average market reaction on an ECB meeting day this year. 10y German Bund yields ended 3bp lower, supported by Lagarde saying that PEPP reinvestments were not discussed as well as below consensus US PCE. Lagarde conveyed that the meeting was mainly a stock taking meeting with no new policy signals for imminent changes, but sent a message that current rate level will contribute to inflation getting back to target. In this light, today's SPF release is unlikely to be a market mover.
FX: EUR/USD was largely unaffected by the ECB decision and the stronger-than-expected US Q3 GDP growth, trading in the mid 1.0500-1.0600 range. USD/JPY remains slightly above potential intervention levels, comfortably above 150. EUR/GBP slightly declined towards the 0.87 mark. Scandies have somewhat stabilised, with EUR/NOK above 11.80 and EUR/SEK slightly below 11.80.
Credit: In spite of the dovish tilt in communication from the ECB yesterday which only left the long rates marginally lower, the credit markets remained negative with iTraxx main being wider by 2.1bp and Xover wider by 8.5bp. Both indices widening to 89.4bp and 470.7bp, respectively.
USD/CHF Daily Outlook
Daily Pivots: (S1) 0.8960; (P) 0.8983; (R1) 0.9011; More....
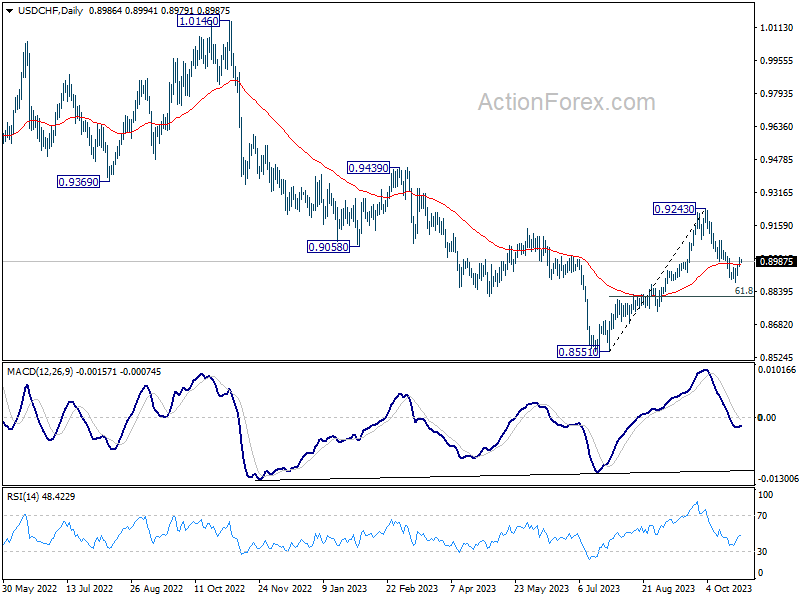
Intraday bias in USD/CHF remains neutral at this point. On the upside, firm break of 0.9000 resistance will confirm short term bottoming at 0.8886. Intraday bias will be turned back to the upside for stronger rebound, back towards 0.9243. On the downside, break of 0.8886 will resume the fall from 0.9243 to 61.8% retracement of 0.8551 to 0.9243 at 0.8815 next.
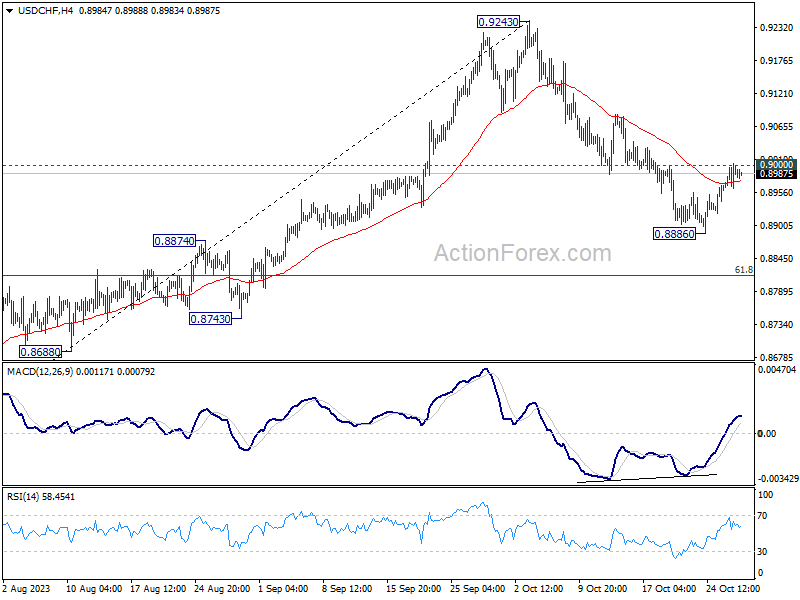
In the bigger picture, rebound from 0.8551 might be completed as a correction at 0.9243. In other words, larger fall from 1.0146 (2022 high) is possibly not over yet. Risk will now stay on the downside as long as 0.9243 resistance holds. Firm break of 0.8551 will confirm down trend resumption.
Quiet Asian Markets Brush Off US Stock Decline; All Eyes on US PCE Data
Markets remained relatively subdued in today's Asian trading session with Australian Dollar and Canadian Dollar showing modest strength. The pervasive risk-off sentiment that characterized the overnight U.S. stock market selloff did not extend into Asia, as evidenced by recoveries in both Japan's Nikkei and Hong Kong's HSI. Japanese Yen, buoyed slightly by robust Tokyo inflation figures, lacked the momentum for a significant resurgence. Concurrently, Dollar, Euro, and Swiss Franc softened, while British Pound presented a mixed picture.
The market's attention is now pivoting to the impending release of PCE data. Both headline and core annual readings for September are anticipated to exhibit deceleration, partly attributable to base effects. However, the monthly data could assume greater significance for Fed officials and the broader market. Although these figures are not expected to alter the consensus for another Fed hold on November 1, they remain crucial in evaluating the likelihood of further tightening in December.
On the technical front, Dollar would be a focus before the weekends, considering that risk aversion in the US could intensify. In particular, break 1.0522 minor support in EUR/USD should confirm that near term corrective recovery from 1.0447 has completed. Larger fall from 1.1274 should then be ready to resume. At the same time, break of 0.9000 minor resistance in USD/CHF would at least set the stage for stronger rebound.
In Asia, at the time of writing, Nikkei is up 1.34%. Hong Kong HSI is up 1.17%. China Shanghai SSE is up 0.50%. Singapore Strait Times is down -0.14%. Japan 10-year JGB yield is down -0.0101 at 0.875. Overnight, DOW dropped -0.76%. S&P 500 dropped -1.18%. NASDAQ dropped -1.76%. 10-year yield dropped -0.108 to 4.845.
NASDAQ set for deeper selloff as key support shattered
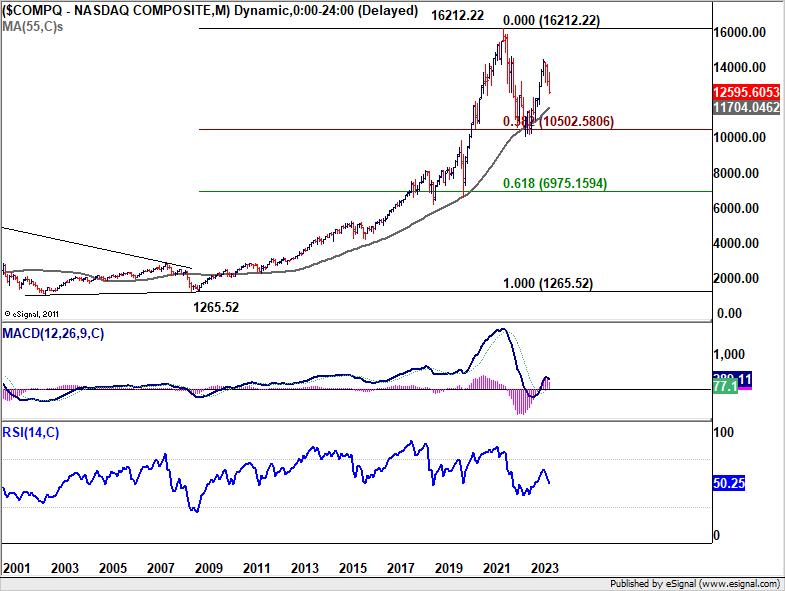
US stocks underwent a marked decline overnight, with NASDAQ at the forefront, shedding -1.76% of its value. This follows closely on the heels of Wednesday's downturn, where the tech-driven index recorded its most significant single-day loss in eight months, plummeting by -2.5%. Notably, several pivotal technical support have been violated, hinting that we might be witnessing the onset of a medium-term downtrend in NASDAQ.
Interestingly, the strong US Q3 GDP figures released overnight did little to lift investor spirits. Paradoxically, these robust economic indicators are fueling concerns about Fed maintaining higher interest rates for an extended period, rather than providing reassurance to the markets.
On the technical front, NASDAQ has taken out both 38.2% retracement of 10088.82 to 14446.55 at 12781.89 and 55 W EMA (now at 12826.98). These developments lend notion to the hypothesis that the entire rally from 10088.82 has concluded. Additionally, the break of channel support suggests that the index may be entering a phase of downside acceleration. For the near term, outlook will stay bearish as long as 13170.39 resistance holds. Next target is 61.8% retracement at 11753.47.
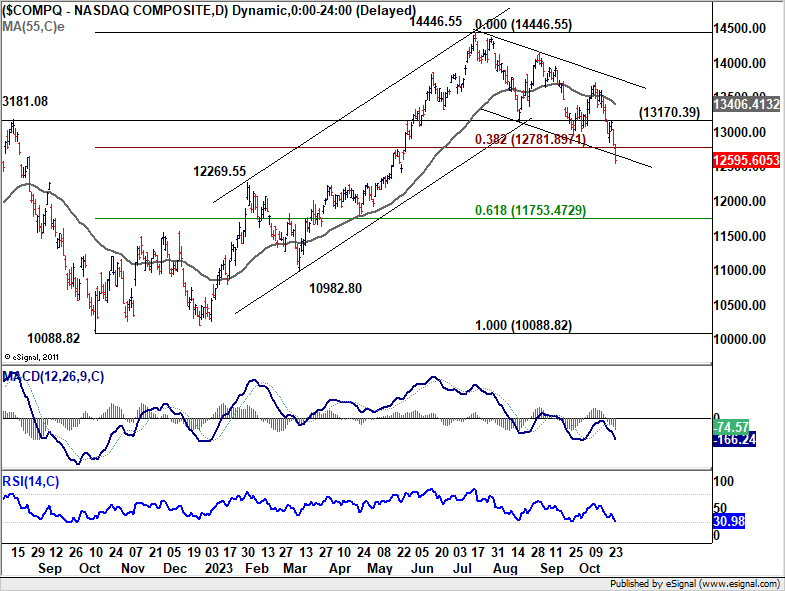
In a broader context, rise from 10088.82 (2022 low) is seen as the second leg of the corrective pattern from 16212.22 (2021 high). In a less bearish scenario, the fall from 14446.55 could merely be a correction to rise from 10088.82. In this case, significant support might emerge around the 55 M EMA (now at 11704.04), close to the aforementioned fibonacci level, triggering a substantial bounce.
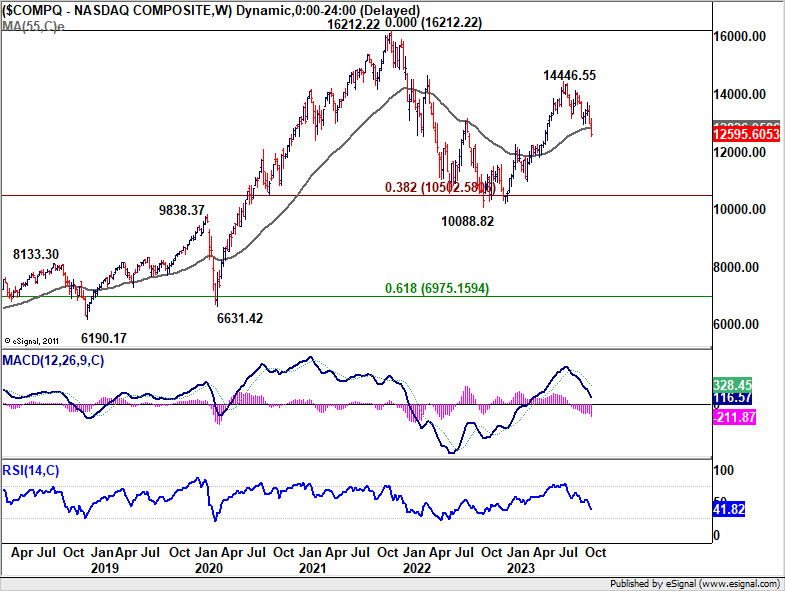
However, in a gloomier perspective, the decline from 14446.55 might represent the third leg of the corrective pattern from 16212.22. This would suggest a more significant and persistent decline, plummeting below 10088.82. While it's premature to definitively conclude, market's reaction around 11700 level should provide valuable insights into future trends.
Tokyo CPI signals rising inflation; BoJ likely to upgrade forecasts
In Japan, Tokyo's headline CPI unexpectedly accelerated from 2.8% yoy to 3.3% yoy in October. CPI core, which excludes the volatile prices of fresh food, also witnessed an acceleration, moving from 2.5% yoy to 2.7% yoy. On the other hand, CPI core-core, which strips out impact of both food and energy prices, marginally slowed from 3.9% yoy to 3.8% yoy, but remained elevated.
An important metric to note is acceleration in services prices, which went from 1.9% yoy 2.1% yoy. The continued uptick in services inflation indicates a more entrenched and broad-based price pressure scenario, suggesting that it could be a prolonged period before inflation retraces its steps back below BoJ's 2% target.
Considering that consumer inflation in Tokyo often sets the tone for national trends, the data bolsters the anticipation that BoJ might have to upgrade its inflation forecasts. Market participants are now keenly awaiting the fresh quarterly projections that are expected to be unveiled at BoJ's policy meeting next week.
Looking ahead
US personal income and spending, as well as PCE price index will be the main focus of the day.
USD/CHF Daily Outlook
Daily Pivots: (S1) 0.8960; (P) 0.8983; (R1) 0.9011; More....
Intraday bias in USD/CHF remains neutral at this point. On the upside, firm break of 0.9000 resistance will confirm short term bottoming at 0.8886. Intraday bias will be turned back to the upside for stronger rebound, back towards 0.9243. On the downside, break of 0.8886 will resume the fall from 0.9243 to 61.8% retracement of 0.8551 to 0.9243 at 0.8815 next.
In the bigger picture, rebound from 0.8551 might be completed as a correction at 0.9243. In other words, larger fall from 1.0146 (2022 high) is possibly not over yet. Risk will now stay on the downside as long as 0.9243 resistance holds. Firm break of 0.8551 will confirm down trend resumption.
Economic Indicators Update
| GMT | Ccy | Events | Actual | Forecast | Previous | Revised |
|---|---|---|---|---|---|---|
| 23:30 | JPY | Tokyo CPI Y/Y Oct | 3.30% | 2.80% | ||
| 23:30 | JPY | Tokyo CPI ex Fresh Food Y/Y Oct | 2.70% | 2.50% | 2.50% | |
| 23:30 | JPY | Tokyo CPI ex Food & Energy Y/Y Oct | 3.80% | 3.80% | 3.90% | |
| 00:30 | AUD | PPI Q/Q Q3 | 1.80% | 0.70% | 0.50% | |
| 00:30 | AUD | PPI Y/Y Q3 | 3.80% | 3.90% | ||
| 12:30 | USD | Personal Income M/M Sep | 0.40% | 0.40% | ||
| 12:30 | USD | Personal Spending Sep | 0.40% | 0.40% | ||
| 12:30 | USD | PCE Price Index M/M Sep | 0.30% | 0.40% | ||
| 12:30 | USD | PCE Price Index Y/Y Sep | 3.40% | 3.50% | ||
| 12:30 | USD | Core PCE Price Index M/M Sep | 0.30% | 0.10% | ||
| 12:30 | USD | Core PCE Price Index Y/Y Sep | 3.70% | 3.90% | ||
| 14:00 | USD | Michigan Consumer Sentiment Index Oct F | 63 | 63 |
Technical Outlook and Review
DXY:
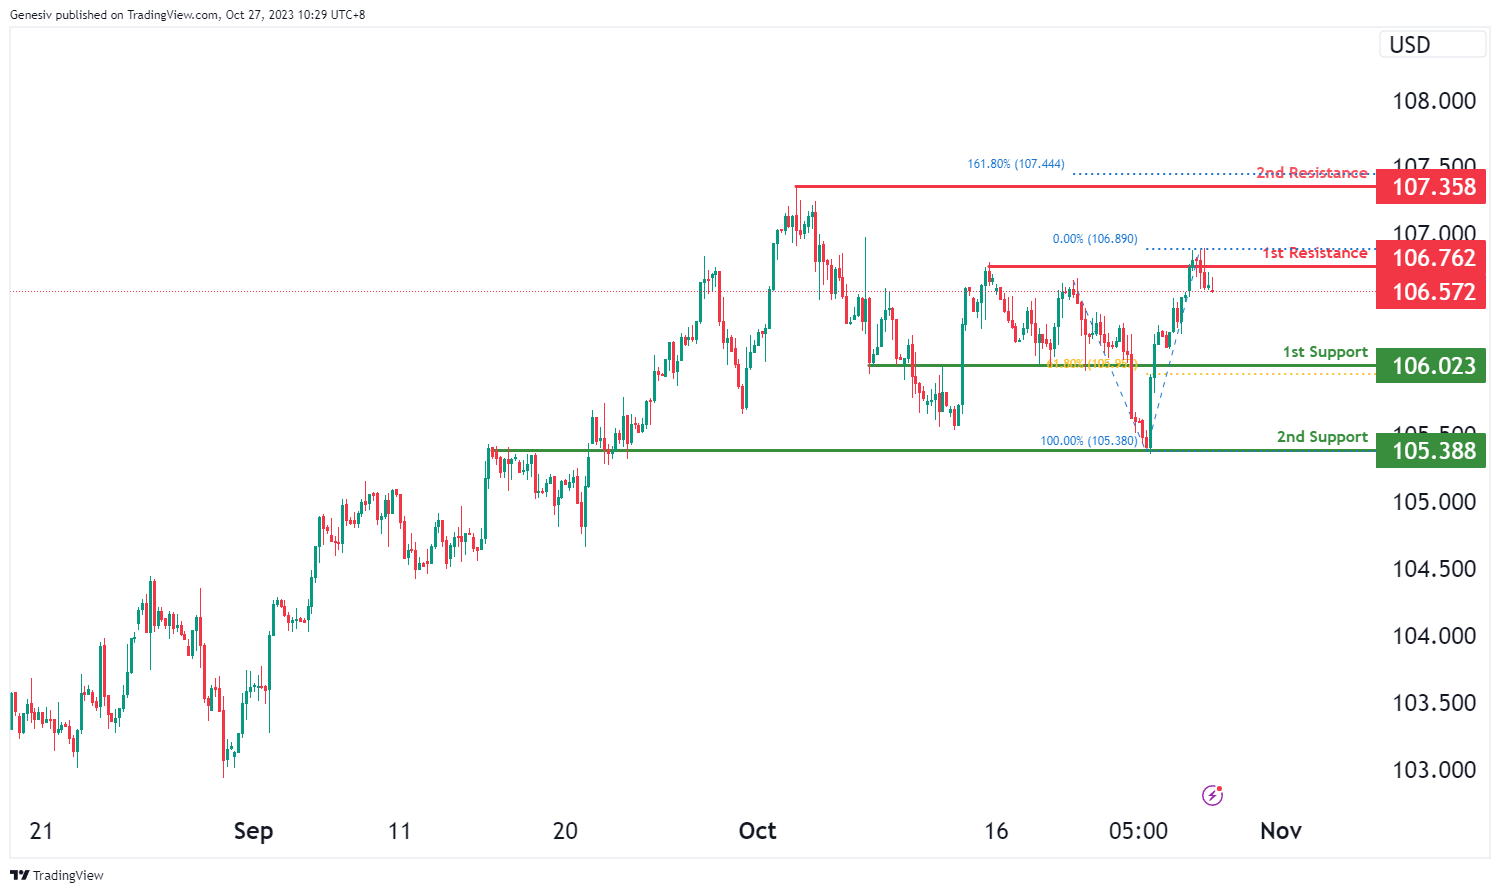
The chart for DXY (US Dollar Index) currently shows a bearish momentum, suggesting the potential for a bearish continuation towards the 1st support level at 106.02. This support level is considered significant as it aligns with a pullback support and coincides with the 61.80% Fibonacci Retracement level, making it a strong potential support zone.
Additionally, there is a 2nd support level at 105.38, which is identified as an overlap support, further reinforcing its potential as a support area.
On the resistance side, the 1st resistance at 106.72 is characterized as a multi-swing high resistance, indicating it could be a substantial barrier to upward price movement.
Furthermore, the 2nd resistance at 107.37 is marked as a swing high resistance and aligns with the 161.80% Fibonacci Extension level, adding to its significance as a potential resistance zone.
EUR/USD:
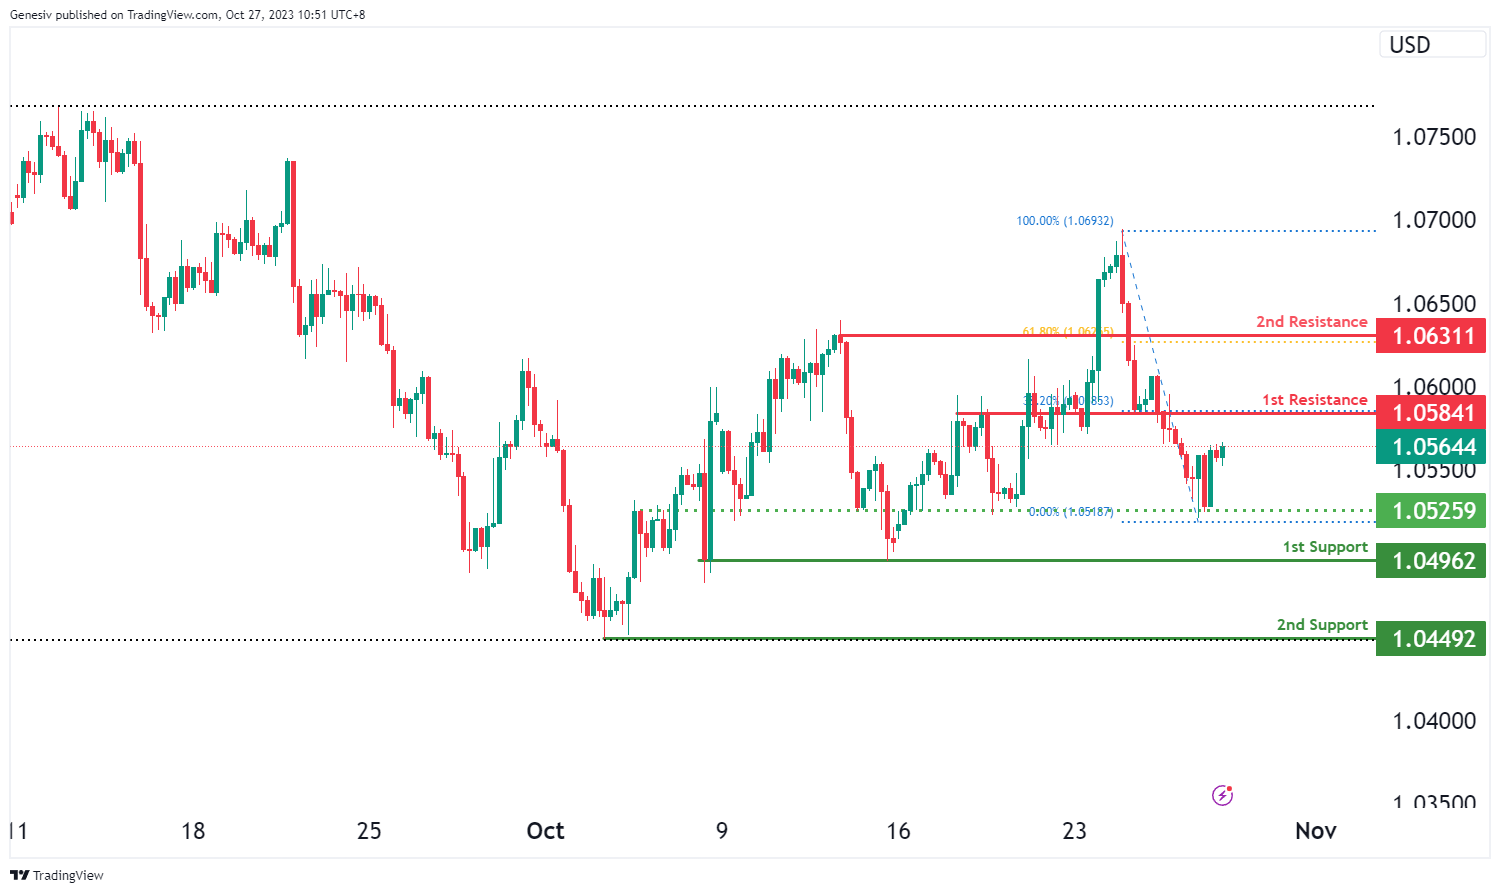
The chart for EUR/USD currently indicates a bullish momentum, suggesting the potential for a bullish continuation towards the 1st resistance level at 1.0584. This resistance level is considered significant as it aligns with a pullback resistance and coincides with the 38.20% Fibonacci Retracement level, making it a strong potential resistance zone.
Additionally, there is a 2nd resistance level at 1.0631, which is also identified as a pullback resistance and aligns with the 61.80% Fibonacci Retracement level, further reinforcing its potential as a barrier to upward price movement.
On the support side, the 1st support at 1.0496 is characterized as a multi-swing low support, indicating it could serve as a substantial area of price support. Similarly, the 2nd support at 1.0449 is identified as a swing low support, adding to the potential support levels.
An intermediate support level at 1.0525 is also noted as an overlap support, providing an additional layer of potential support for price movements.
EUR/JPY:
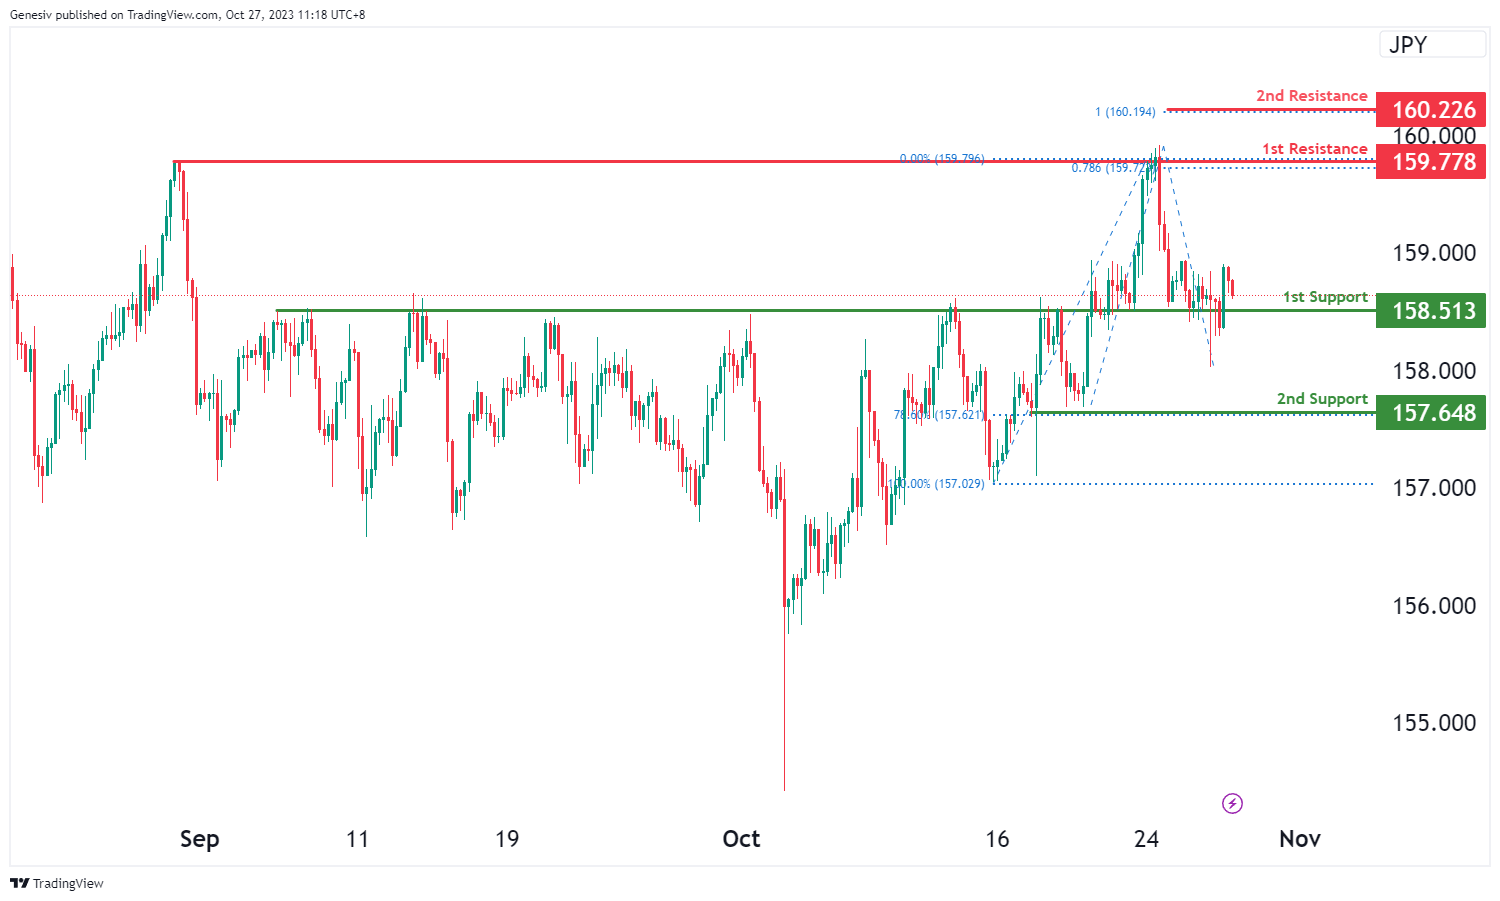
For EUR/JPY, the chart currently indicates a bullish overall momentum, suggesting that the price may potentially experience a bullish bounce off the first support at 158.51 and head towards the first resistance at 159.77.
The first support at 158.51 is considered significant due to its overlap support characteristics.
The second support at 157.64 is also noteworthy, as it features multi-swing low support and is associated with the 78.60% Fibonacci Retracement, making it a strong level of potential support.
On the resistance side, the first resistance at 159.77 is marked by multi-swing high resistance characteristics and is also associated with the 78.60% Fibonacci Projection, making it a substantial level of resistance. The second resistance at 160.22 is significant, as it involves the 100% Fibonacci Projection, indicating another important level of resistance.
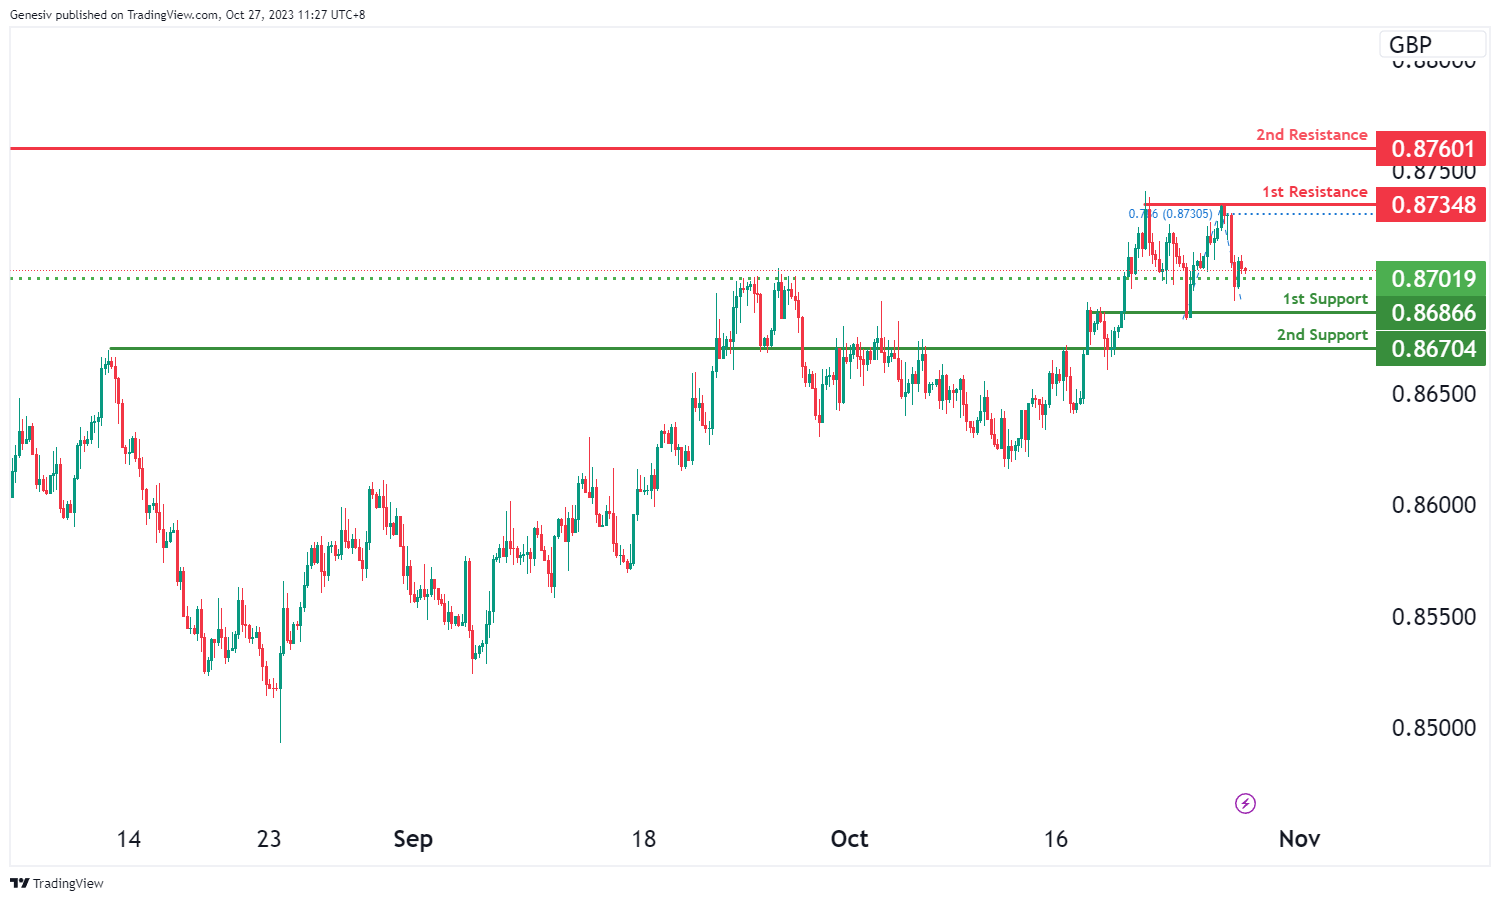
EUR/GBP:
For EUR/GBP, the chart currently reflects a bearish overall momentum, indicating that the price could potentially continue in a bearish direction towards the first support at 0.8686.
The first support at 0.8686 is considered a strong level due to its overlap support characteristics and the presence of the 78.60% Fibonacci Projection, making it a significant potential support level.
The second support at 0.8670 is also noteworthy, as it features overlap support.
On the resistance side, the first resistance at 0.8729 is marked by multi-swing high resistance characteristics and is associated with the 78.60% Fibonacci Projection, indicating a substantial level of resistance. The second resistance at 0.8760 is significant due to its overlap resistance features.
Additionally, there is an intermediate support level at 0.8701, which is supported by its overlap support characteristics.
GBP/USD:
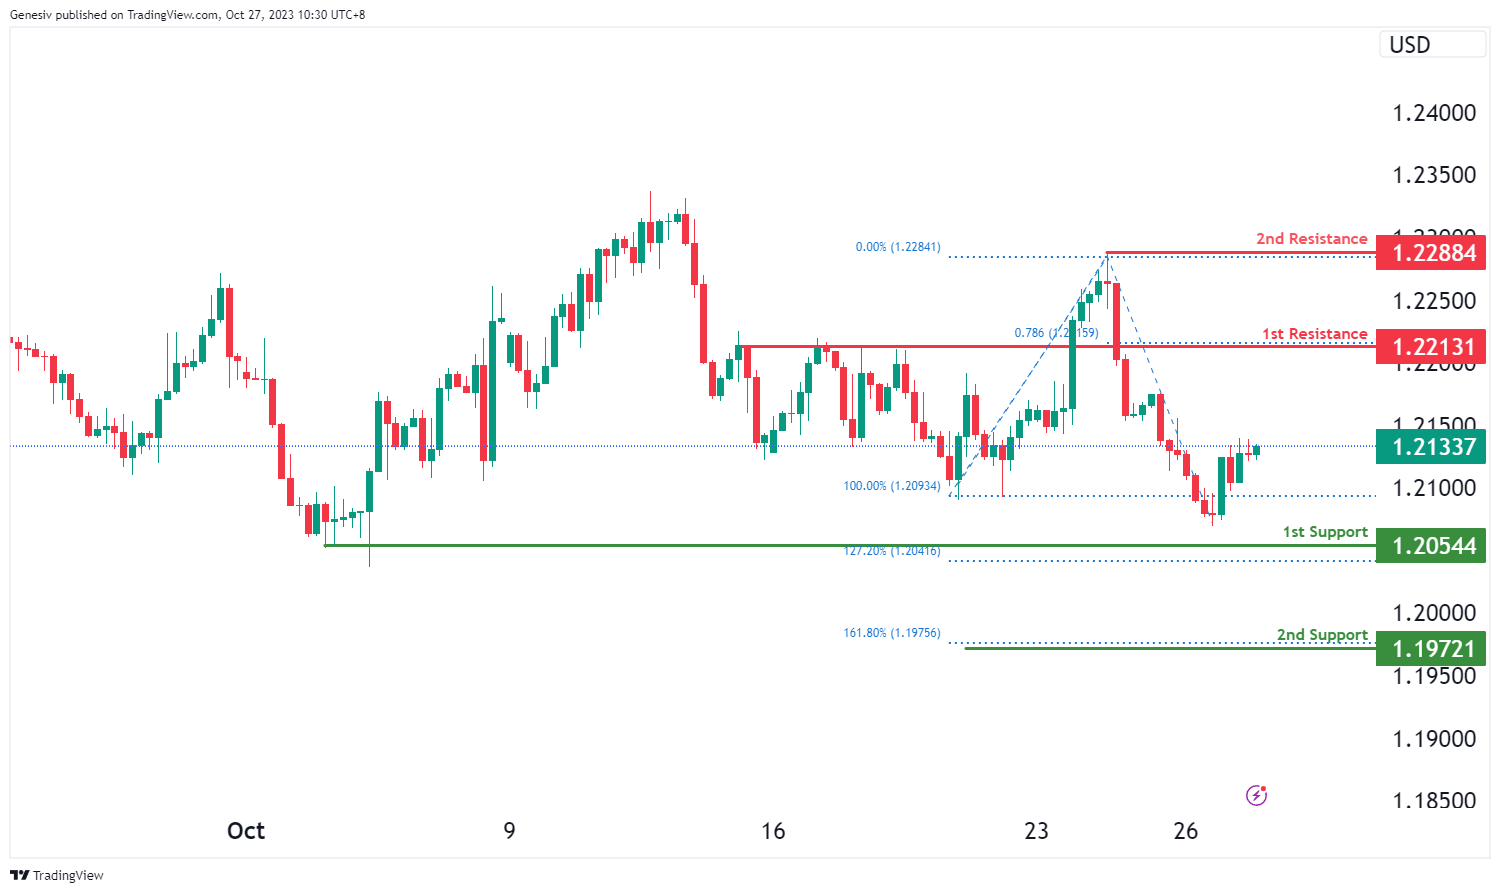
The GBP/USD chart currently demonstrates a bullish momentum, suggesting the potential for a bullish continuation towards the 1st resistance level at 1.2213. This resistance level is considered significant as it aligns with a pullback resistance and coincides with the 78.60% Fibonacci Projection, making it a strong potential resistance zone.
Additionally, there is a 2nd resistance level at 1.2288, which is identified as a swing high resistance, further reinforcing its potential as a barrier to upward price movement.
On the support side, the 1st support at 1.2054 is characterized as a multi-swing low support, indicating it could serve as a substantial area of price support. The 2nd support at 1.197 is associated with the 161.80% Fibonacci Extension, adding to its significance as a potential support level.
GBP/JPY:
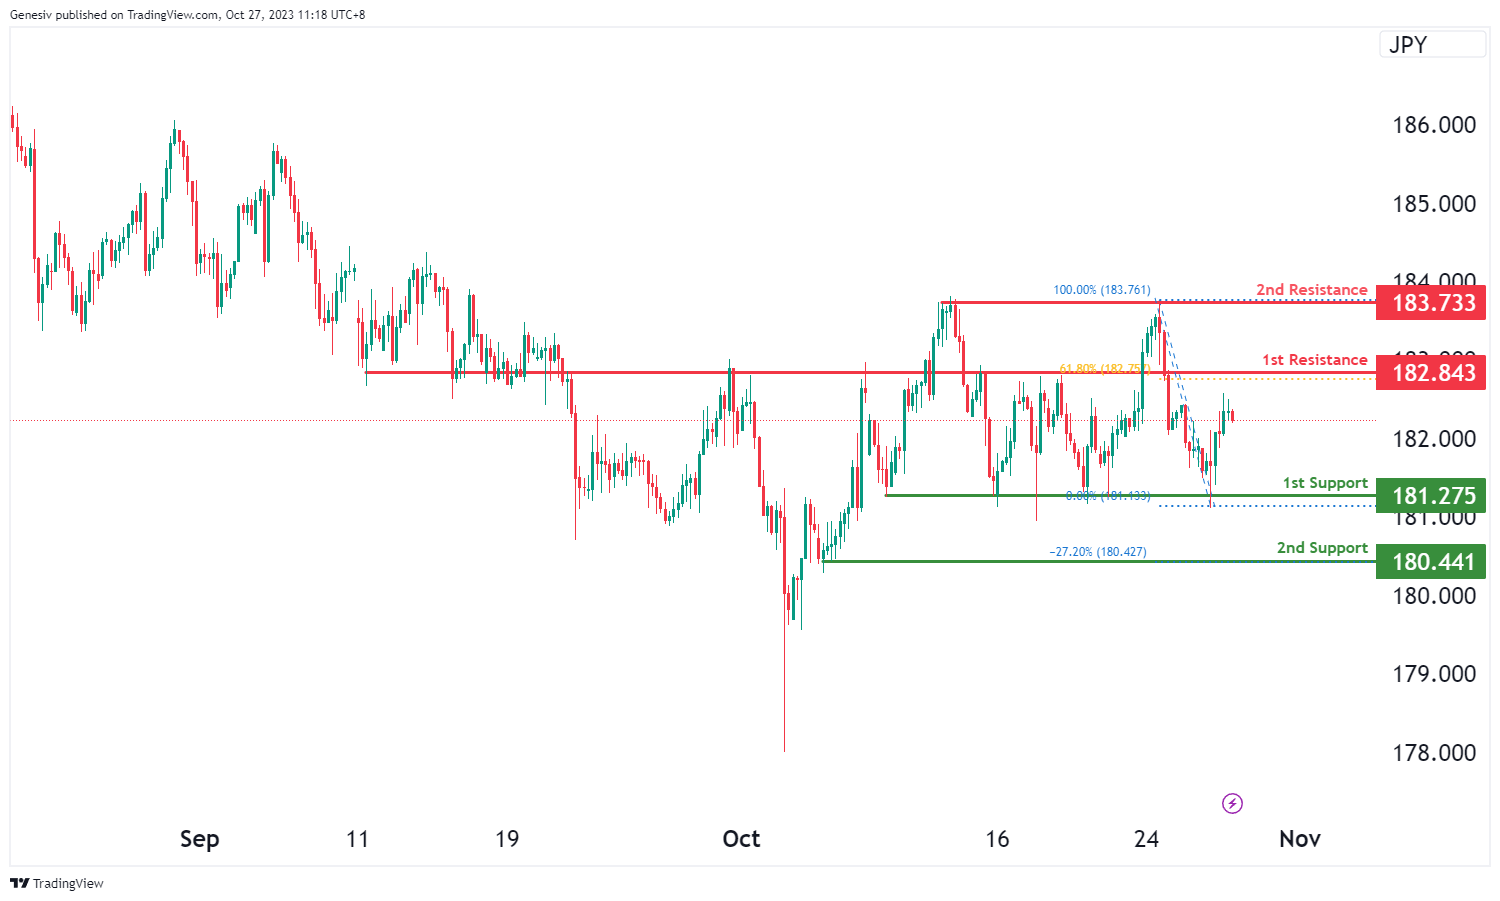
For GBP/JPY, the chart currently indicates a bearish overall momentum, suggesting that the price could potentially continue in a bearish direction towards the first support at 181.27.
The first support at 181.27 is considered strong due to its multi-swing low support characteristics.
The second support at 180.44 is also significant as it features swing low support and is associated with the -27% Fibonacci Expansion, making it another level of potential support.
On the resistance side, the first resistance at 182.84 is marked by pullback resistance and is associated with the 61.80% Fibonacci Retracement, indicating a substantial level of resistance. The second resistance at 183.73 is noteworthy for its multi-swing high resistance characteristics.
USD/CHF:
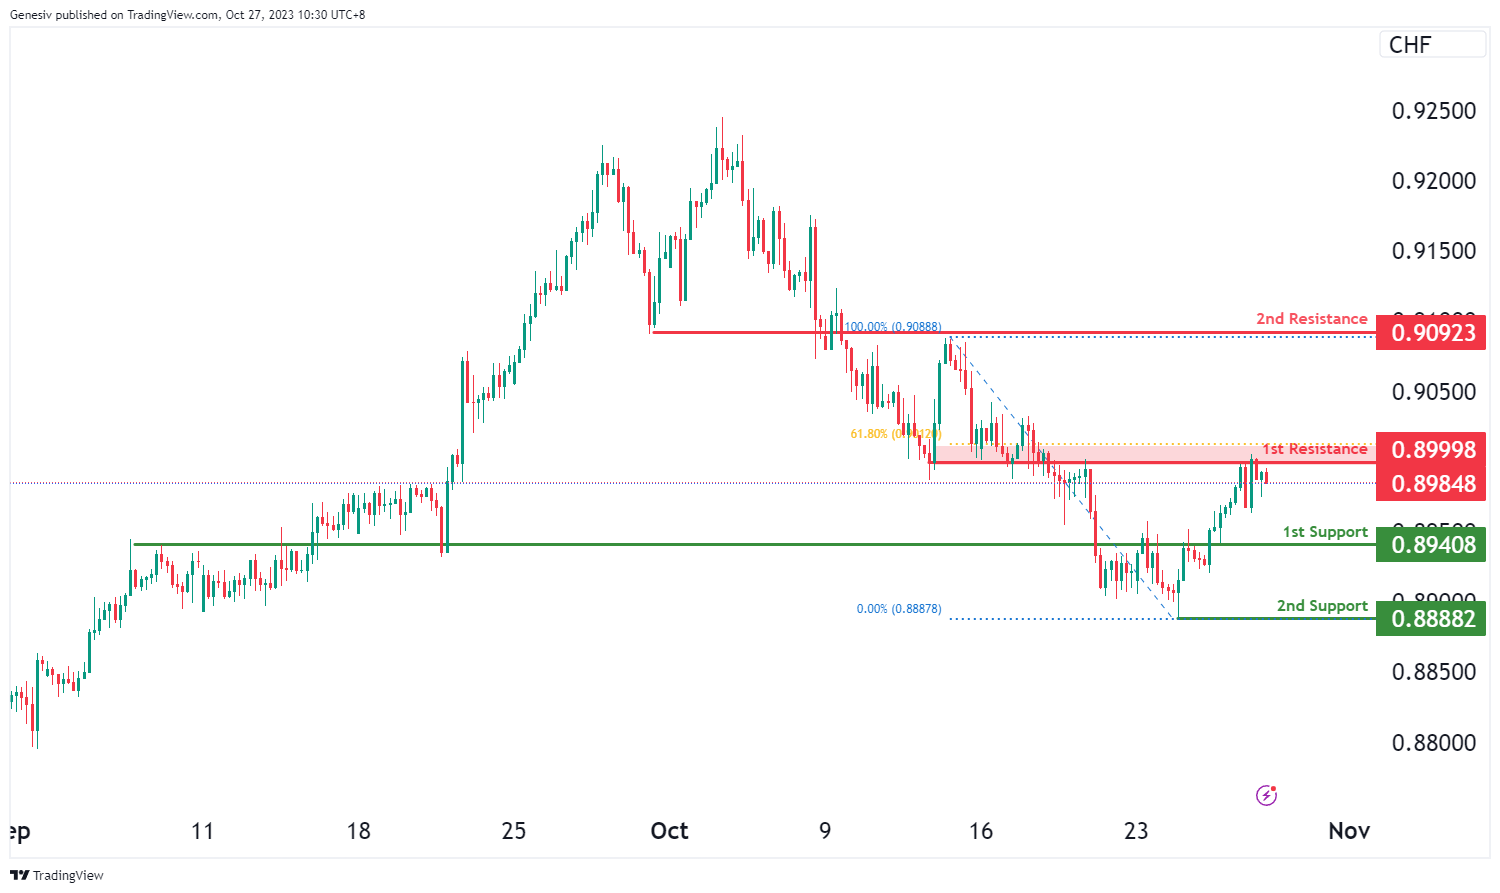
The USD/CHF chart currently indicates a bearish momentum, suggesting the potential for a bearish continuation towards the 1st support level at 0.8940. This support level is considered significant as it aligns with an overlap support.
Additionally, there is a 2nd support level at 0.8888, which is identified as a swing low support, reinforcing its potential as a support zone.
On the resistance side, the 1st resistance at 0.8999 is characterized as an overlap resistance and coincides with the 61.80% Fibonacci Retracement level, making it a strong potential barrier to upward price movement. The 2nd resistance at 0.9092 is also noted as an overlap resistance, adding to its significance as a potential area where selling pressure may emerge.
USD/JPY:
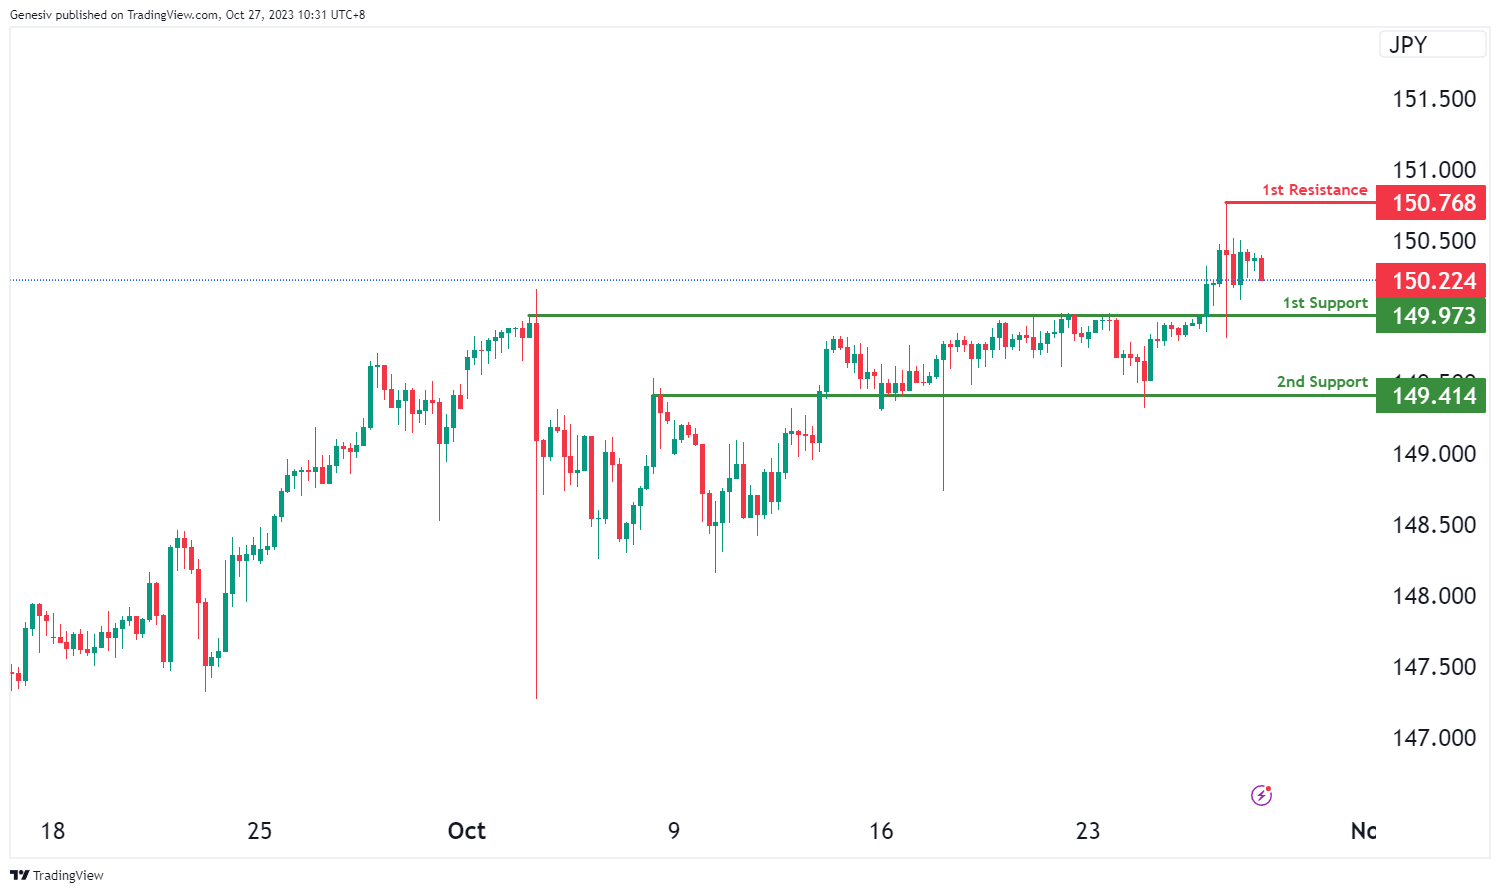
The USD/JPY chart currently exhibits bullish momentum, with the potential scenario of a bullish bounce off the 1st support level at 149.97 and a move towards the 1st resistance level at 150.76.
The 1st support at 149.97 is considered significant as it aligns with an overlap support, indicating its potential to act as a strong support level. Additionally, there is a 2nd support level at 149.41, which is also identified as an overlap support, further reinforcing the potential support zone.
On the resistance side, the 1st resistance at 150.76 is characterized as a swing high resistance, suggesting it could serve as a significant barrier to further upward price movement in the bullish direction.
USD/CAD:
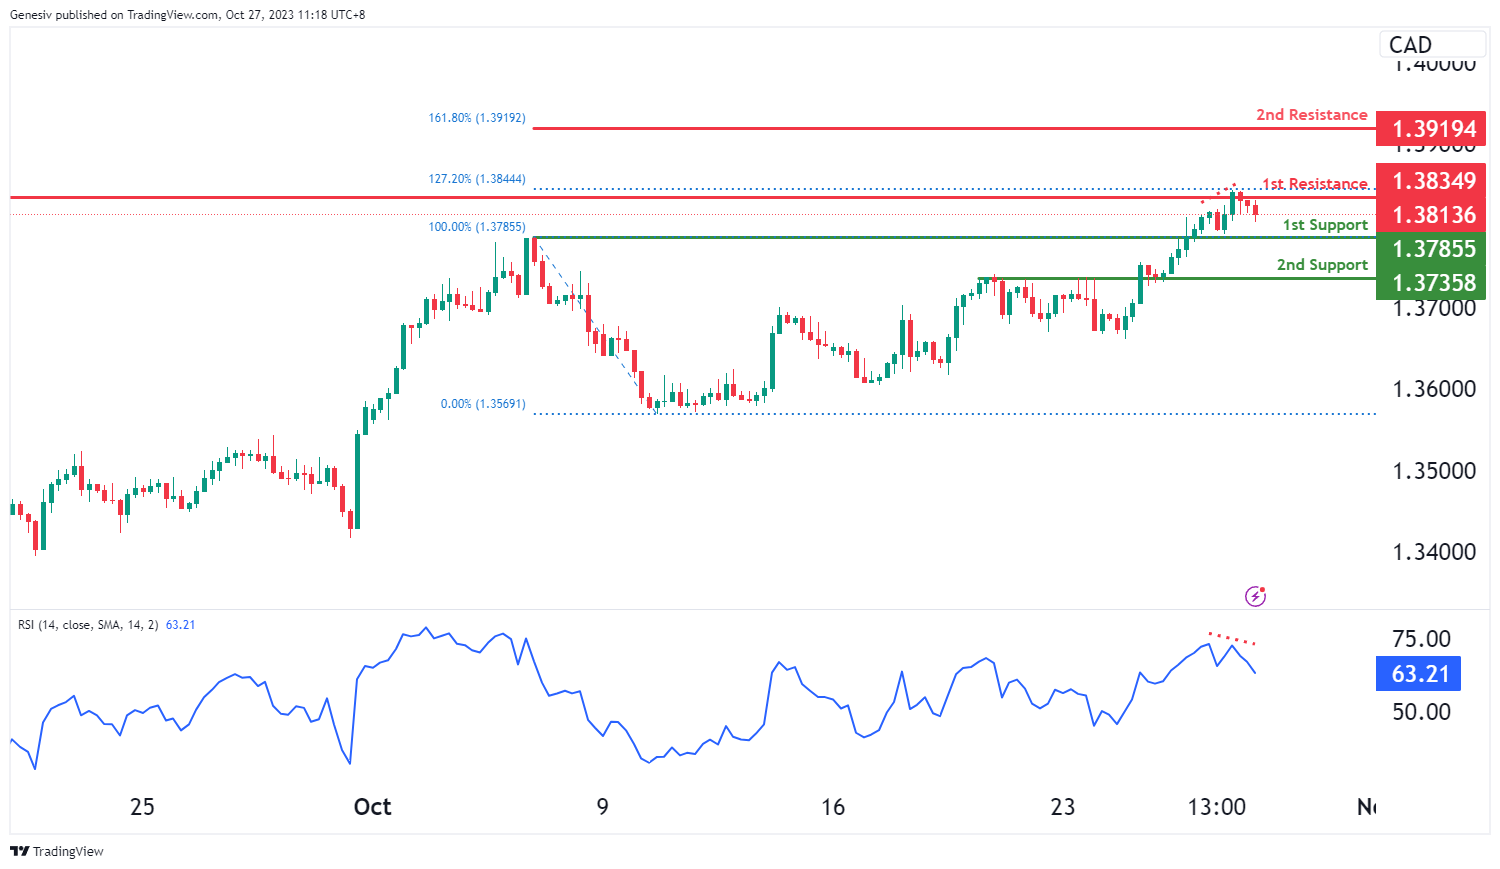
The USD/CAD chart currently exhibits an overall bullish momentum. However, the Relative Strength Index (RSI) is displaying bearish divergence versus price, indicating the likelihood of a bearish move towards the 1st support level.
The 1st support level at 1.3786 is identified as a pullback support. Further below, the 2nd support level at 1.3736 is noted as an overlap support, potentially acting as a strong support zone.
To the upside, the 1st resistance level at 1.3835 is identified as a multi-swing-high resistance that aligns with the 127.20% Fibonacci extension level. Higher up, the 2nd resistance level at 1.3919 is marked as a resistance level that aligns with the 161.80% Fibonacci extension level, potentially acting as a barrier to further bullish advances.
AUD/USD:
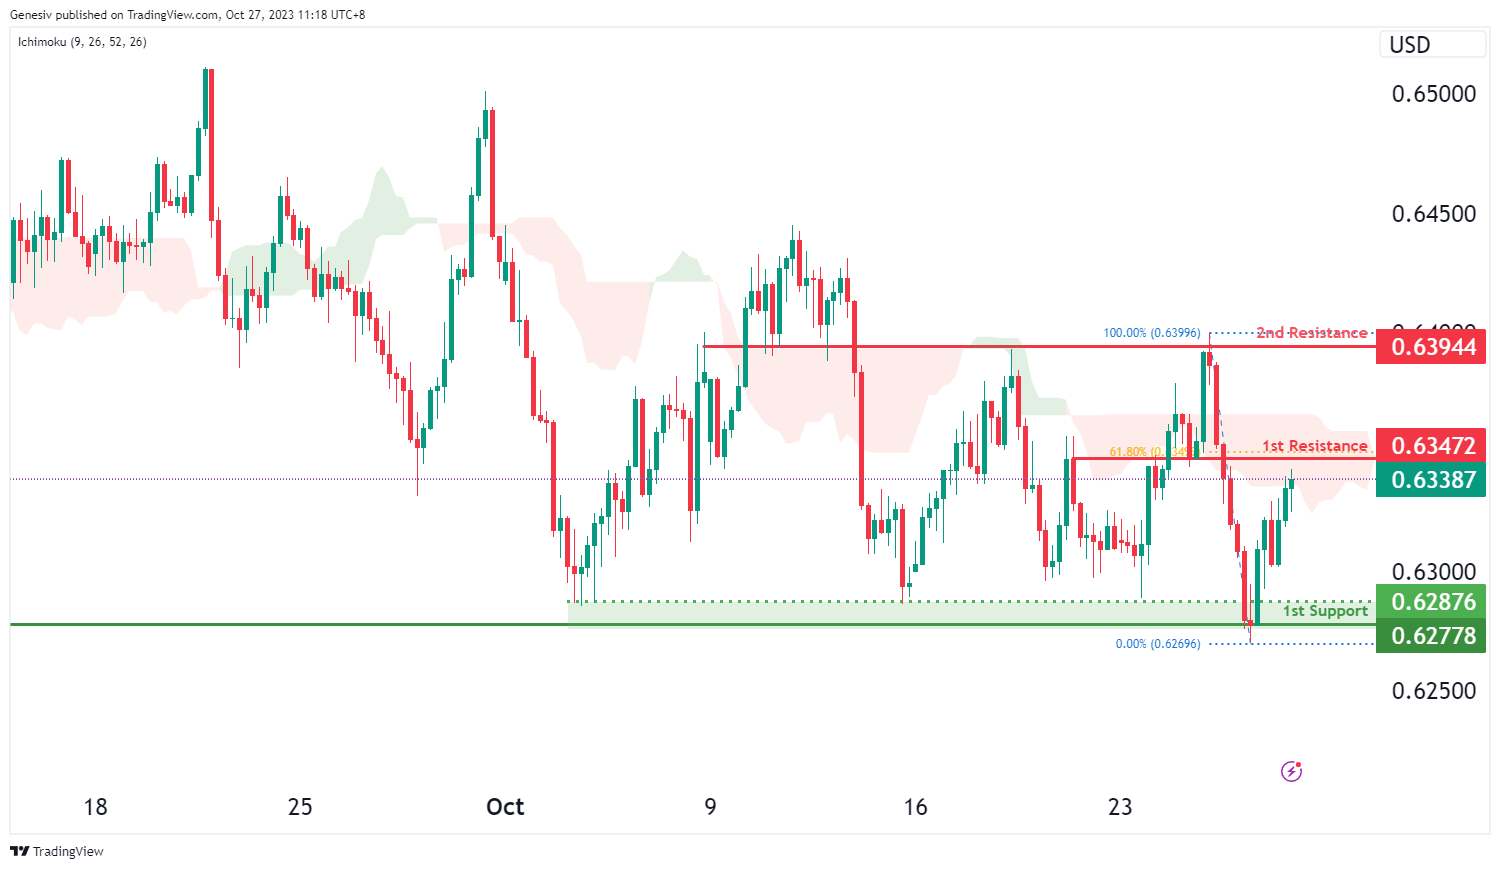
The AUD/USD chart currently exhibits an overall bearish momentum with a potential for price to make a bearish reaction off the 1st resistance level to drop lower towards the 1st support level. Price is also trading below the bearish Ichimoku cloud, adding to the overall bearish momentum.
The 1st resistance level at 0.6347 is identified as an overlap resistance that aligns with the 61.80% Fibonacci retracement level. Higher up, the 2nd resistance level at 0.6394 is also marked as an overlap resistance, making it a potentially strong resistance level.
To the downside the 1st support level at 0.6278 is identified as a multi-swing-low support, further reinforcing its importance as a potential support area.
NZD/USD
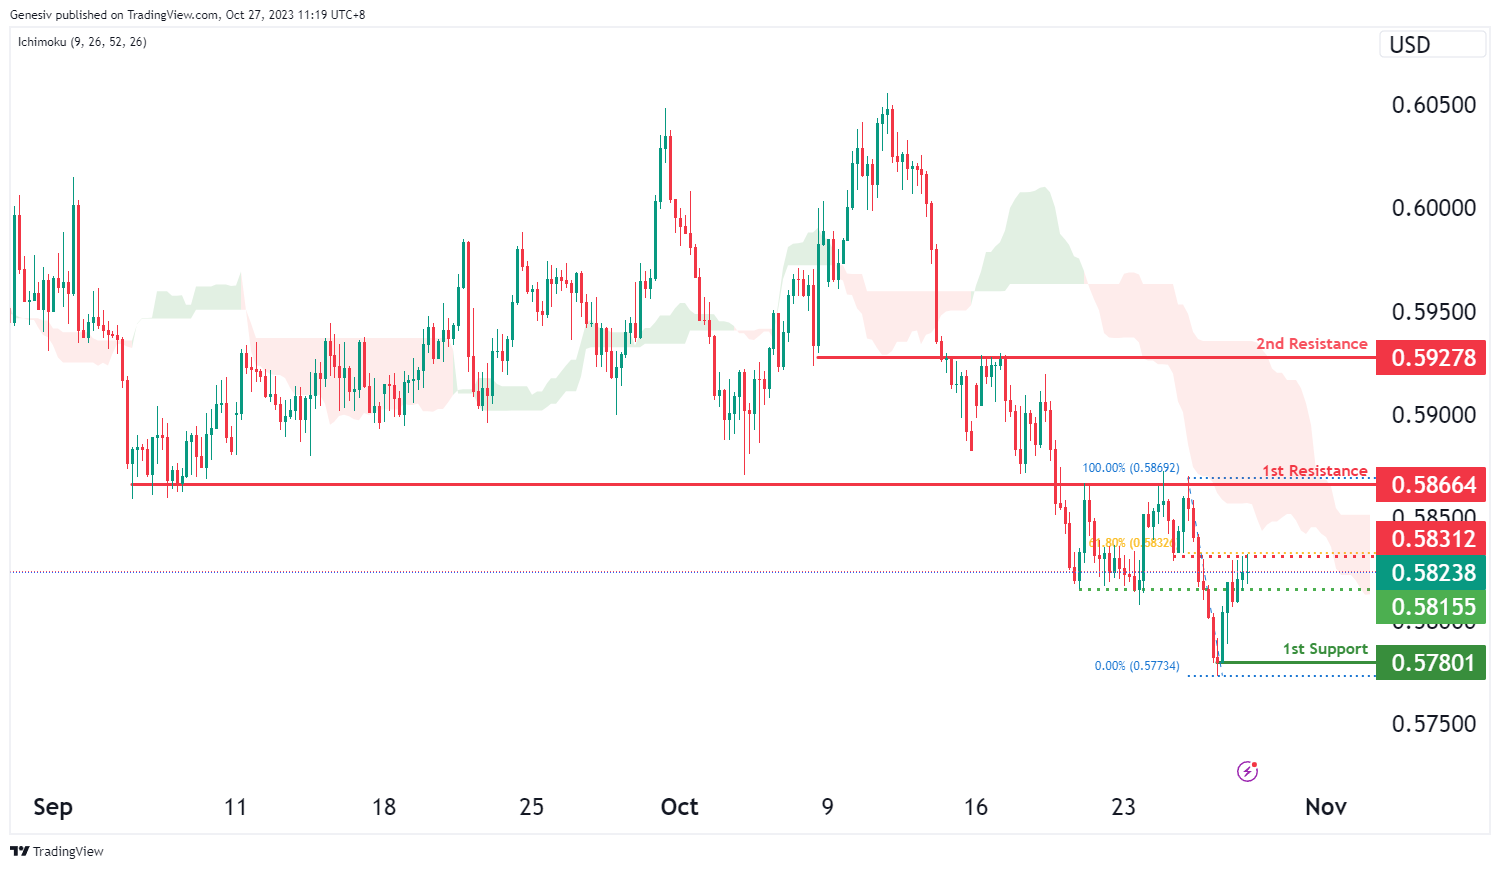
The NZD/USD chart currently exhibits an overall bearish momentum with price potentially making a bearish continuation towards the 1st support level, especially if price breaks below the intermediate support level. Price is also trading below the bearish Ichimoku cloud, adding to the overall bearish momentum.
The intermediate support at 0.5816 is identified as an overlap support while the 1st support level at 0.5780 is marked as a swing-low support, further reinforcing its importance as a potential support area.
To the upside, the intermediate resistance level at 0.5831 is identified as an overlap resistance that aligns with the 61.80% Fibonacci retracement level while the 1st resistance level at 0.5866 is also marked as an overlap resistance. Higher up, the 2nd resistance level at 0.5928 is also noted as an overlap resistance, making it a potentially strong resistance level.
DJ30:
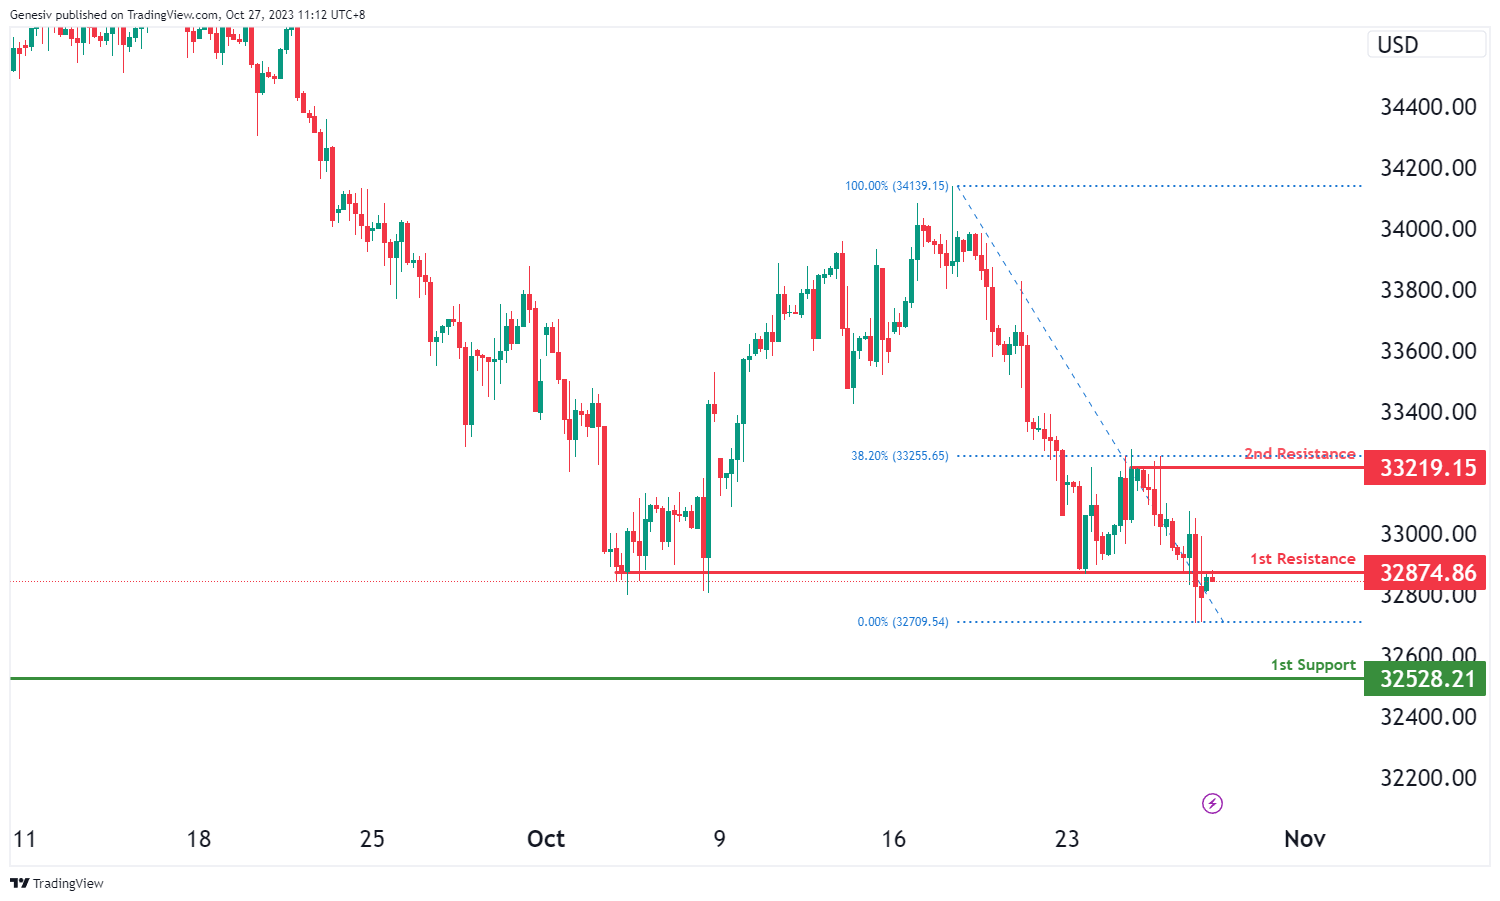
For DJ30, the chart currently indicates a bearish overall momentum, suggesting that the price may potentially experience a bearish reaction off the first resistance at 32874.86 and drop to the first support at 32528.21.
The first support at 32528.21 is considered strong due to its pullback support characteristics, making it a significant level of potential support.
On the resistance side, the first resistance at 32874.86 is noteworthy for its overlap resistance characteristics. The second resistance at 33219.15 is marked by multi-swing high resistance, making it another important level of resistance.
GER40:
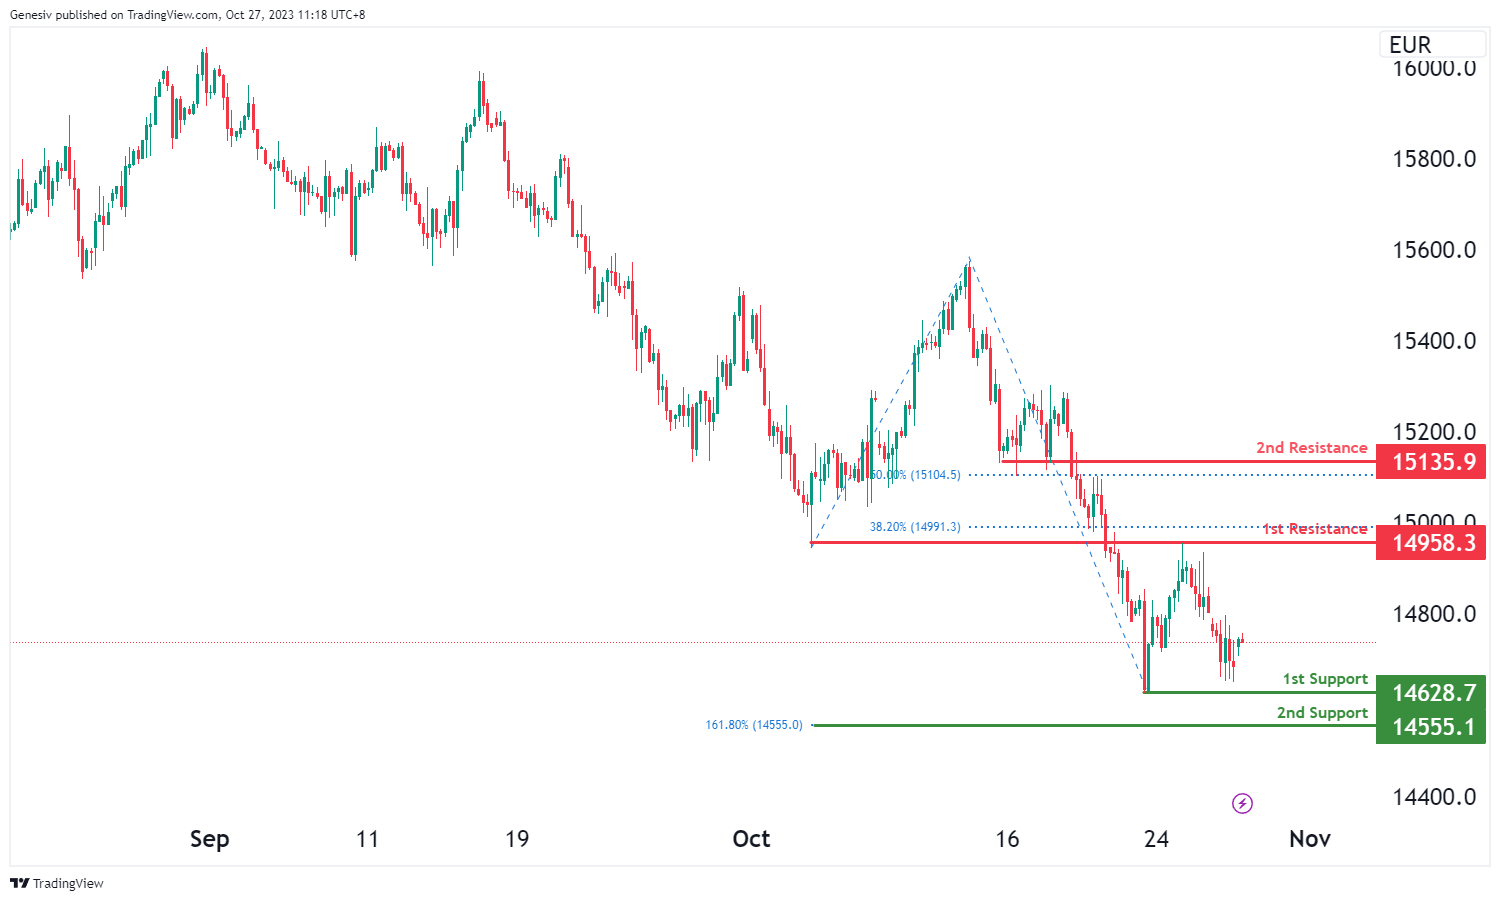
For GER40, the chart currently reflects a neutral overall momentum, indicating that the price could potentially fluctuate between the first resistance at 14958.30 and the first support at 14628.70.
The first support at 14628.70 is considered strong due to its swing low support characteristics, while the second support at 14555.10 is significant due to the presence of the 161.80% Fibonacci Extension.
On the resistance side, the first resistance at 14958.30 is noteworthy for its overlap resistance characteristics and the presence of the 38.20% Fibonacci Retracement, making it a notable level of resistance. The second resistance at 15135.90 is marked by pullback resistance and the presence of the 50% Fibonacci Retracement, making it another important level of resistance.
US500
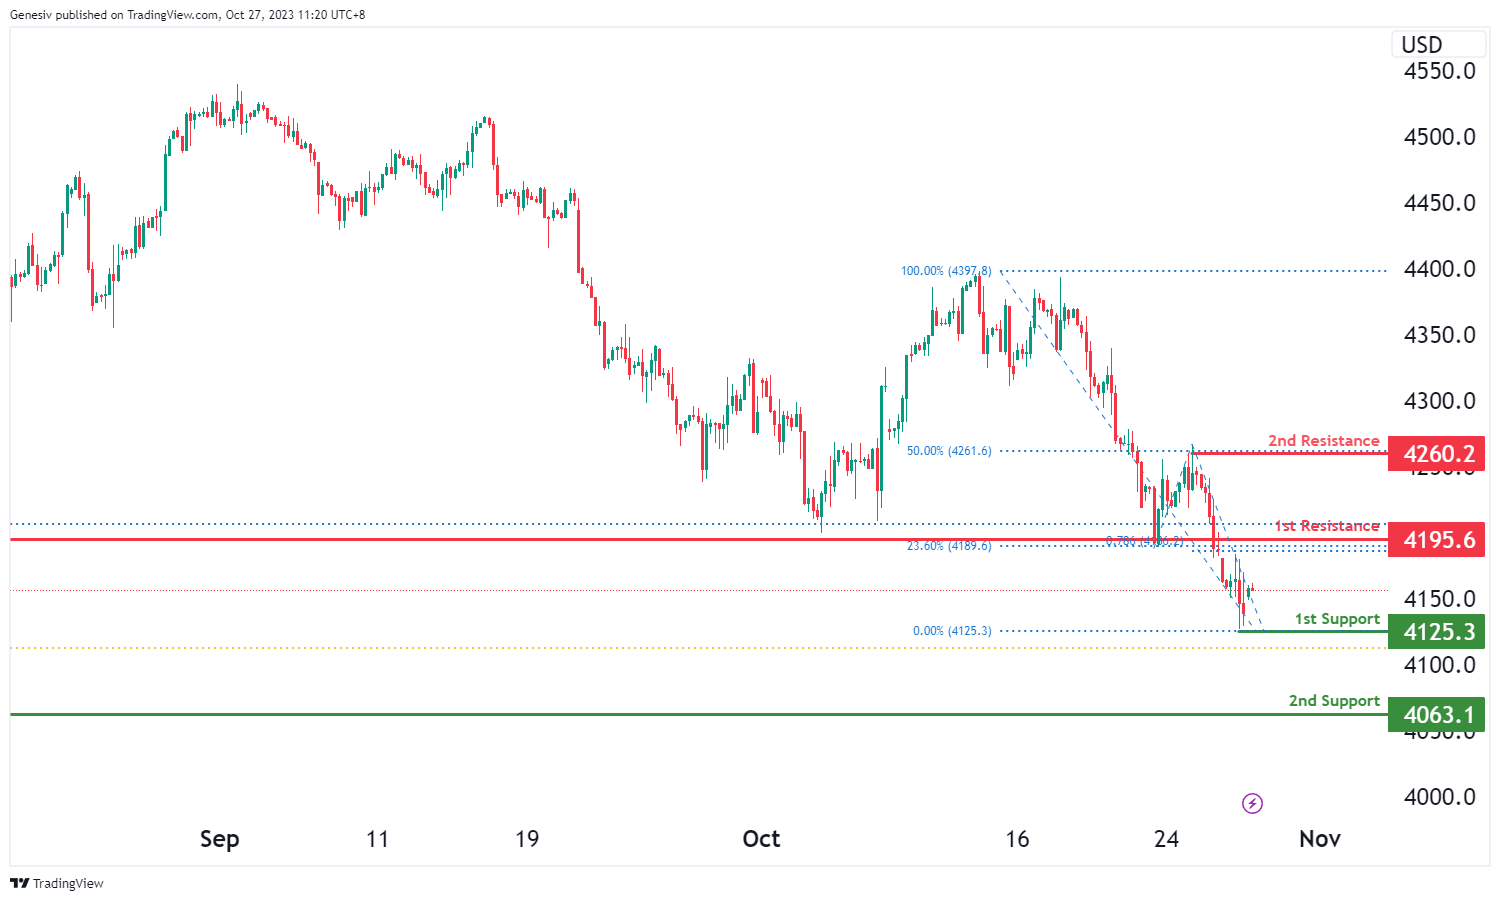
For US500, the chart currently exhibits a bearish overall momentum, suggesting that the price could potentially continue in a bearish direction towards the first support at 4125.3.
The first support at 4125.3 is considered strong due to its swing low support characteristics and the presence of the 61.80% Fibonacci Retracement, making it a significant level of potential support.
The second support at 4063.1 is also significant as it features overlap support.
On the resistance side, the first resistance at 4195.6 is noteworthy for its pullback resistance characteristics, and it also involves the 23.60% Fibonacci Retracement and the 78.60% Fibonacci Projection, indicating Fibonacci confluence and making it a substantial level of resistance.
The second resistance at 4260.2 is marked by swing high resistance and is associated with the 50% Fibonacci Retracement, making it another important level of resistance.
BTC/USD:
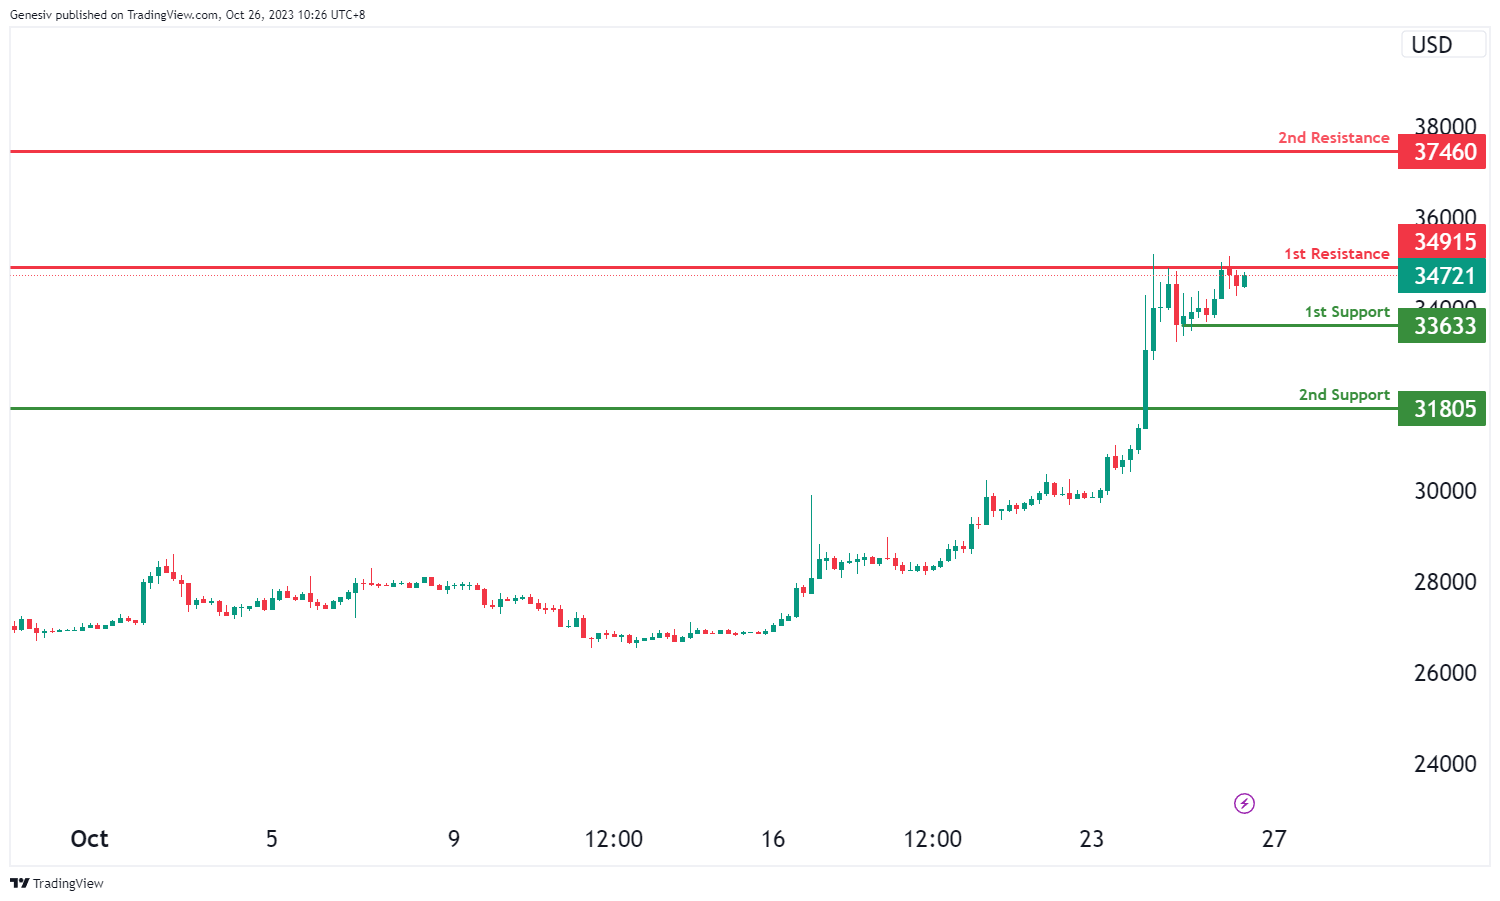
For BTC/USD, the chart currently indicates a bullish overall momentum, suggesting that the price may potentially experience a bullish bounce off the first support at 33633 and head towards the first resistance at 34915.
The first support at 33633 is considered strong due to its swing low support characteristics. The second support at 31805 is also significant, as it provides pullback support.
On the resistance side, the first resistance at 34915 is noteworthy for its overlap resistance characteristics, indicating a substantial level of resistance. The second resistance at 37460 is marked by pullback resistance, making it another important level of resistance.
ETH/USD:
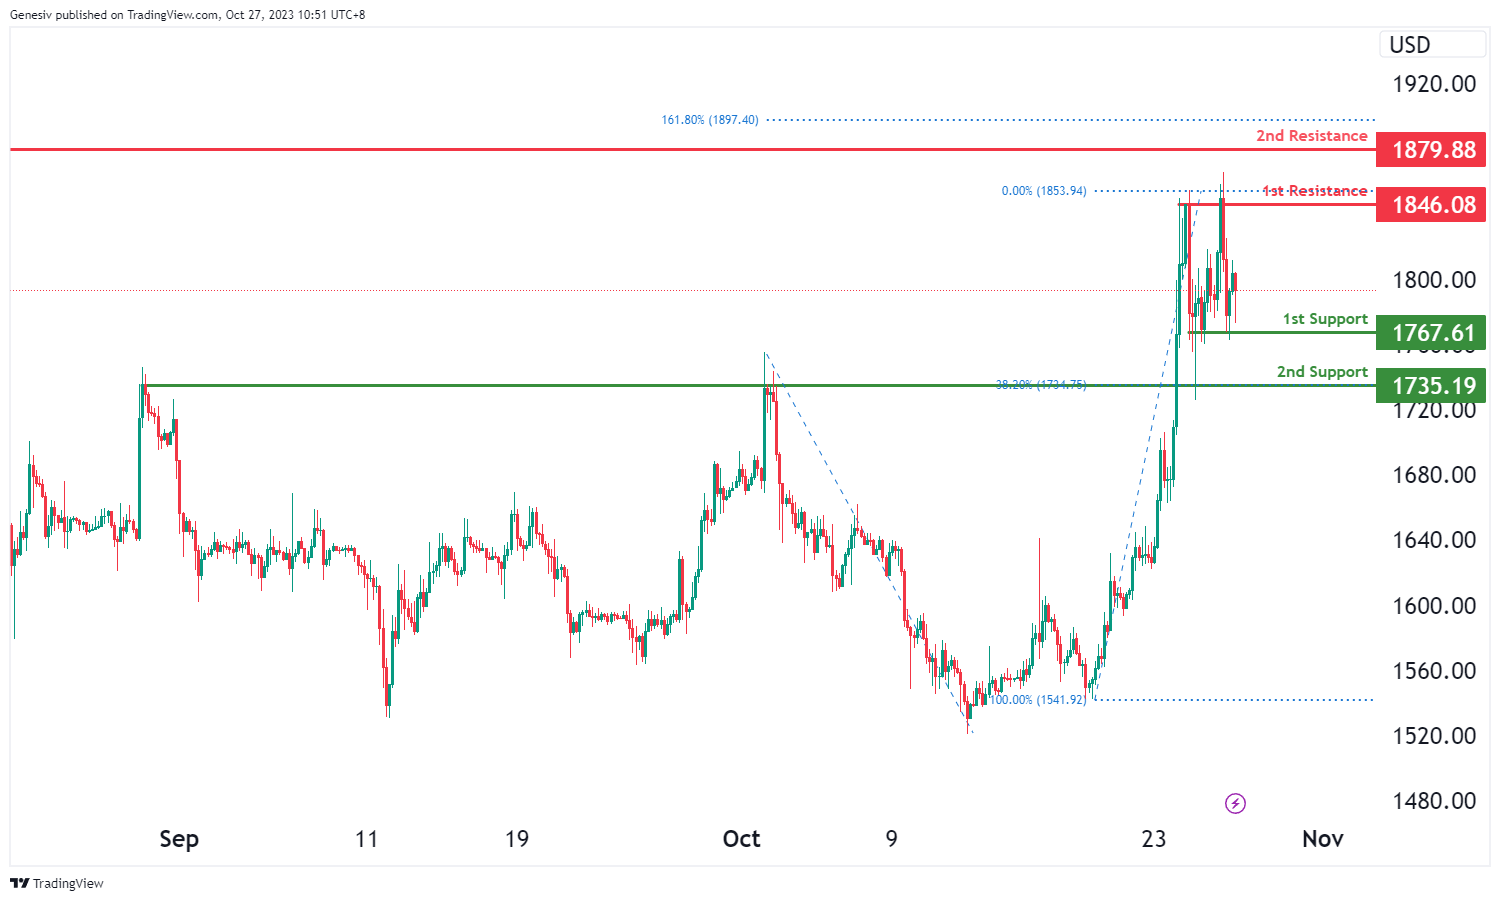
For ETH/USD, the chart currently indicates a bullish overall momentum, suggesting that the price may potentially experience a bullish bounce off the first support at 1767.61 and head towards the first resistance at 1846.08.
The first support at 1767.61 is considered strong due to its multi-swing low support characteristics. The second support at 1735.19 is also significant, as it provides pullback support and is associated with the 38.20% Fibonacci Retracement.
On the resistance side, the first resistance at 1846.08 is noteworthy for its multi-swing high resistance characteristics, indicating a substantial level of resistance. The second resistance at 1879.88 is marked by multi-swing high resistance and is associated with the 161.80% Fibonacci Extension, making it another important level of resistance.
WTI/USD:
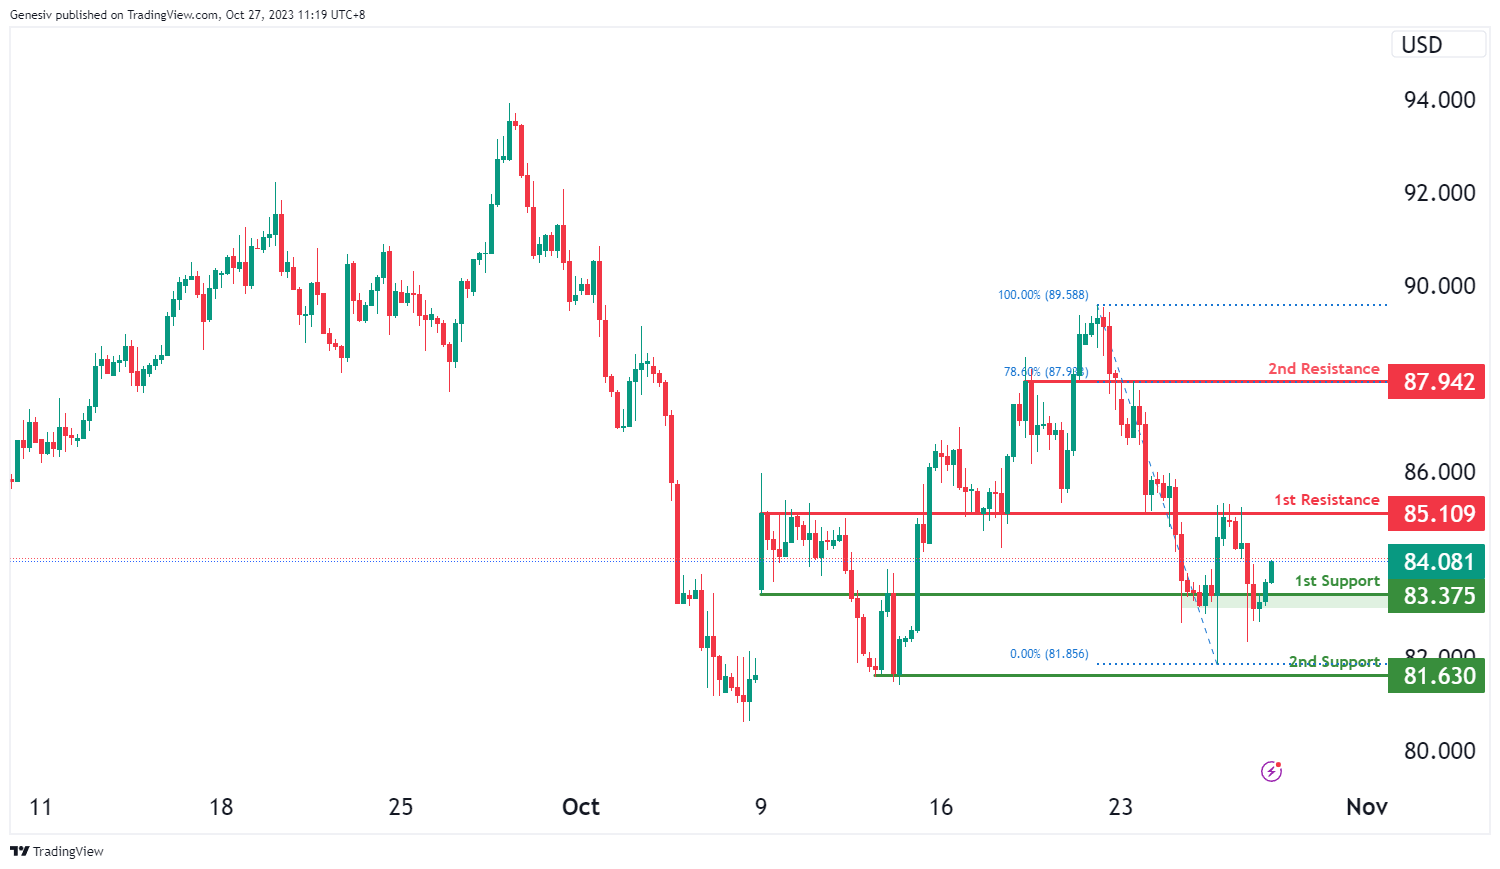
The WTI chart currently exhibits an overall bullish momentum, indicating a potential scenario for price to make a bullish continuation towards the 1st resistance level.
The 1st resistance level at 85.11 is identified as an overlap resistance. Beyond this, the 2nd resistance level at 87.94 is also noted as an overlap resistance that aligns with the 78.60% Fibonacci retracement level, making it a potentially strong resistance level.
To the downside, the 1st support level at 83.38 is identified as an overlap support. Further below, the 2nd support level at 81.63 is also marked as a swing-low support, indicating a potential support zone.
XAU/USD (GOLD):
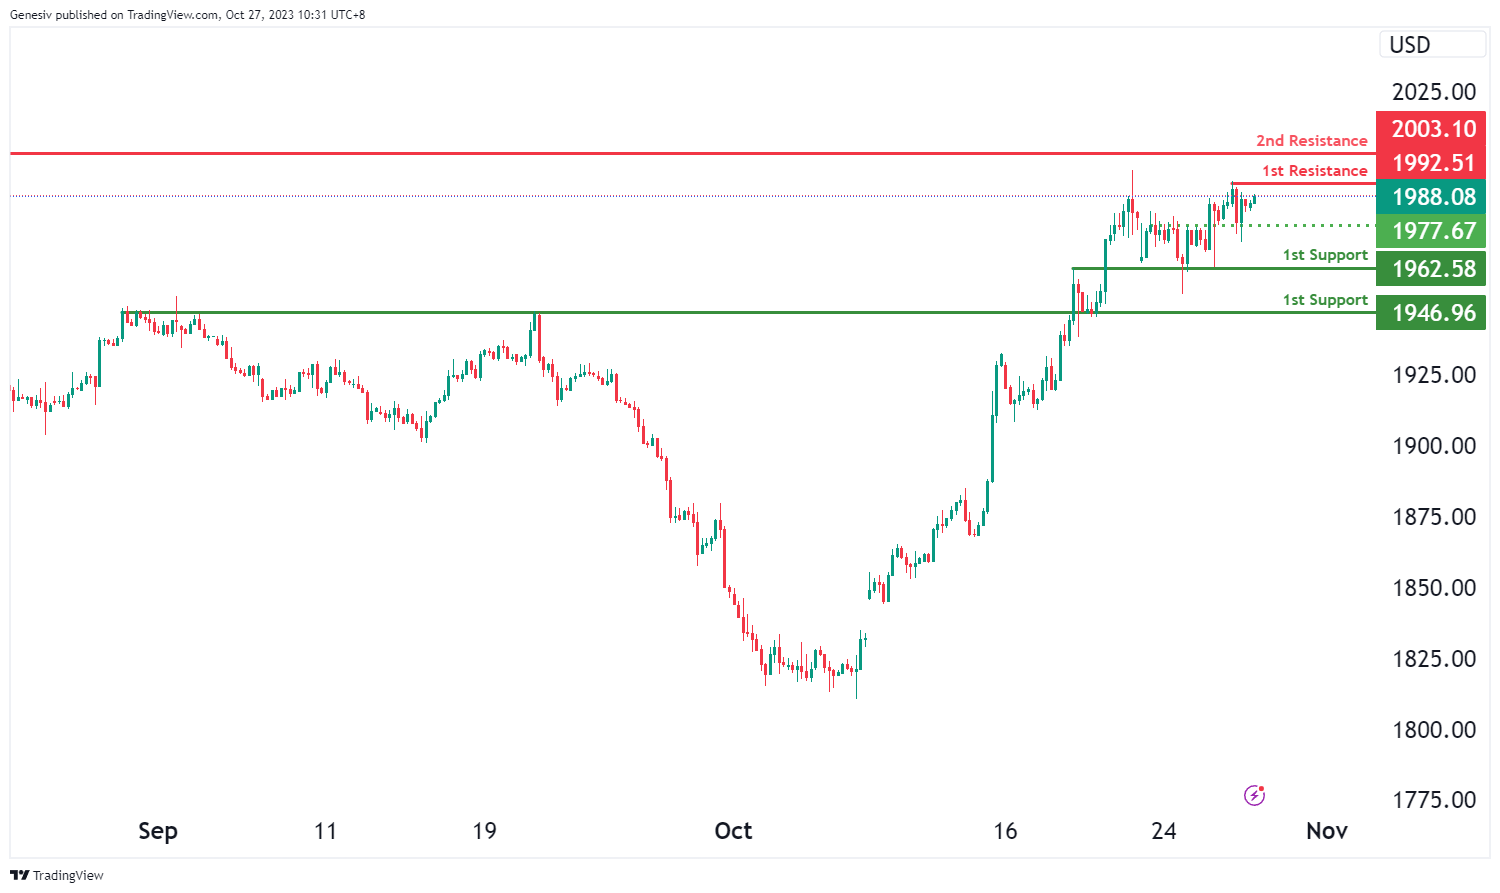
The XAU/USD (Gold/US Dollar) chart currently demonstrates bullish momentum, suggesting the potential for a bullish continuation towards the 1st resistance level at 1992.51.
The 1st support at 1962.58 is considered significant as it aligns with an overlap support, indicating its potential to act as a strong support level. Additionally, the 2nd support level at 1946.96 is also identified as an overlap support, reinforcing the potential support zone.
On the resistance side, the 1st resistance at 1992.51 is characterized as a multi-swing high resistance, implying that it could pose a significant obstacle to any notable upward price movement in the bullish direction. Furthermore, the 2nd resistance at 2003.10 is identified as a swing high resistance, indicating another potential level where the price may face resistance.
An intermediate support level is also observed at 1977.67, labeled as a pullback support. This level may serve as a temporary resting point for the price during its bullish trajectory.