

Sample Category Title
WTI Oil Futures Capped by 50-day SMA
- WTI futures bounce off the lower end of the Ichimoku cloud
- But their rebound is being held down by the 50-day SMA
- Momentum indicators got rejected before entering bullish territories
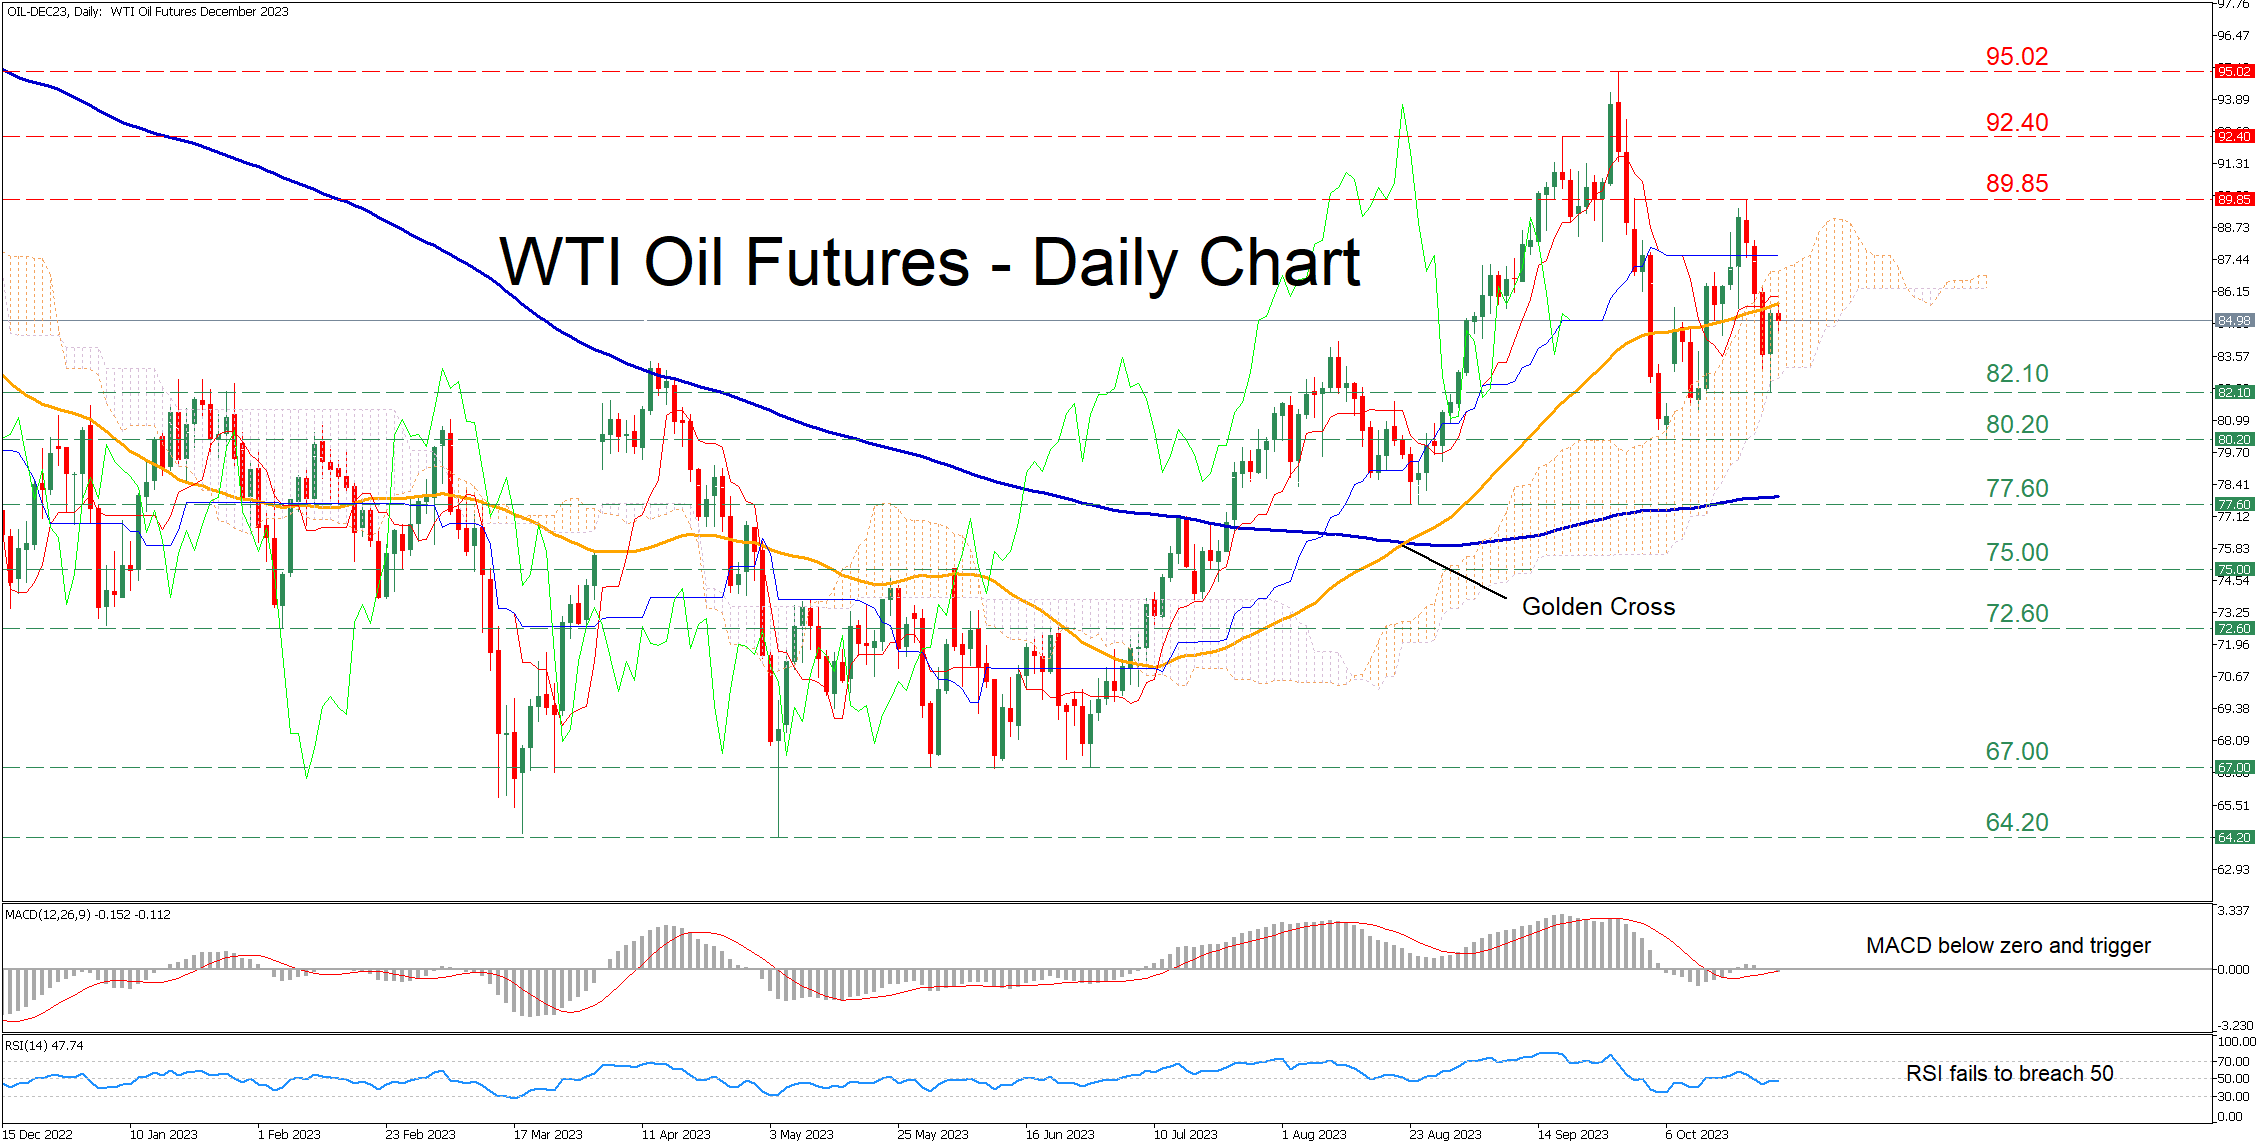
WTI oil futures (December delivery) had been in a steady advance since their October bottom of 82.10 before experiencing a pullback. Although the commodity managed to halt its latest retreat and recoup some losses, the 50-day simple moving average (SMA) has been acting as a strong ceiling.
Should the price conquer the 50-day SMA, there is no prominent resistance zone before the October high of 89.85. Piercing through that wall, the price could test the September resistance of 92.40. A violation of that territory could open the door for the 2023 high of 95.02, which is also a 13-month peak.
Alternatively, if the price reverses lower, the recent support of 82.10, which overlaps with the lower boundary of the Ichimoku cloud, could act as the first line of defense. Sliding beneath that floor, WTI futures could challenge the October bottom of 80.20 ahead of the August low of 77.60. Even lower, the June resistance of 75.00 may provide downside protection.
In brief, WTI oil futures managed to pause the latest retreat, but their recovery seems to be faltering near the 50-day SMA. However, the neutral technical picture remains intact for the commodity as long as the price keeps hovering within the Ichimoku cloud.
EURUSD Gives Up Gains But Not Bearish Yet
- EURUSD switches back to losses after touching resistance
- Technical signals weaken but bears not in control yet
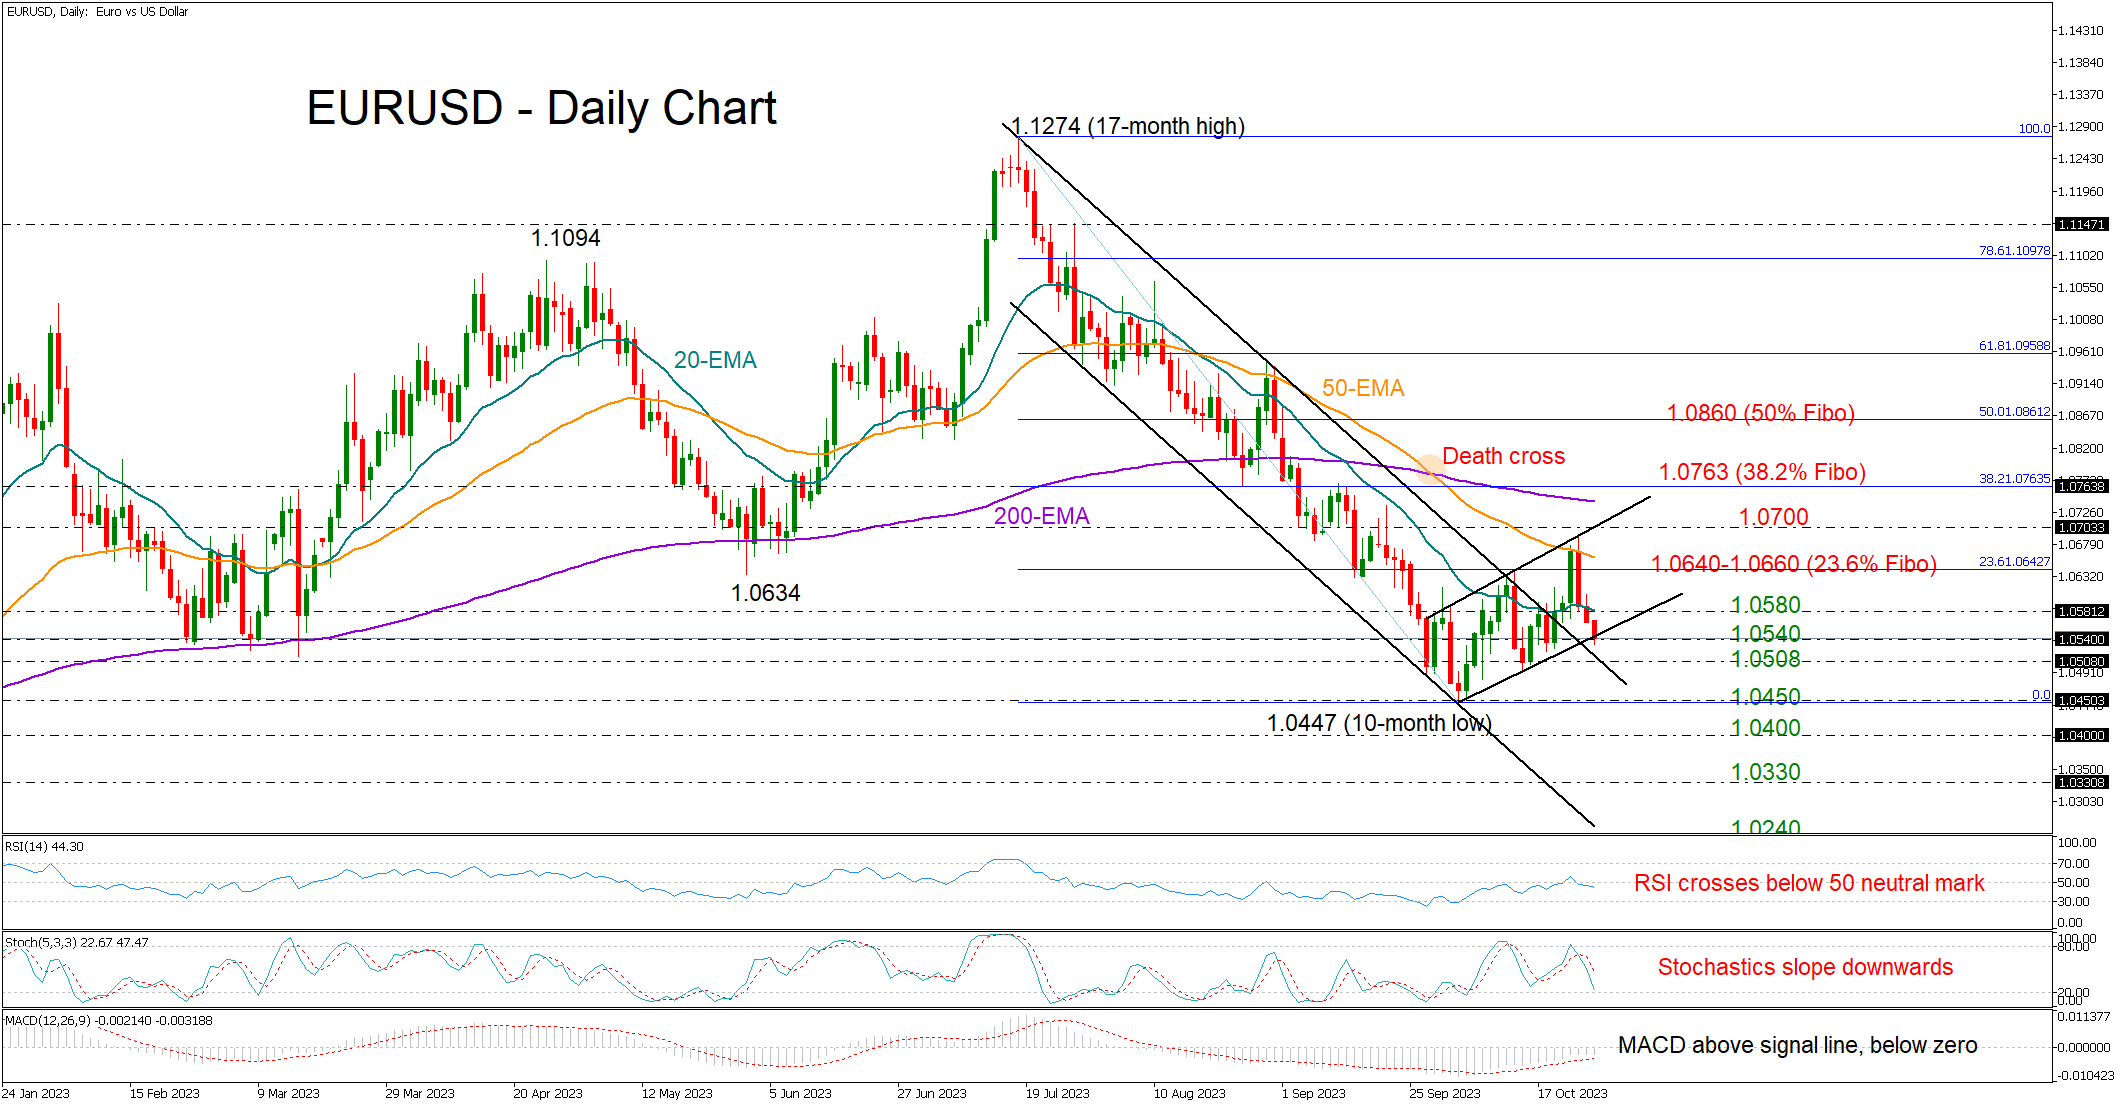
EURUSD was harshly pressured after touching its 50-day exponential moving average (EMA), erasing almost all the gains it made last week ahead of the ECB policy announcement.
The price went below its 20-day EMA, and the RSI dropped below 50, causing concerns of potential market dominance by sellers in the short-term.
On a positive note, there is a short-term bullish channel in the chart that is currently protecting against downward pressure around 1.0540. The upper band of the former bearish channel could also cease selling pressure nearby at 1.0508. If the bears breach that base, the price could tumble towards October’s low of 1.0447, while a step below 1.0400 could cause a sharp decline towards the November 2022 barrier of 1.0330.
If the price drifts higher and above the constraining 20-day EMA at 1.0584, the spotlight will turn again to the 50-day EMA, which is converging towards the 23.6% Fibonacci retracement of the latest downleg at 1.0640. A successful battle there might lift the pair towards the channel’s upper boundary at 1.0700. Still, only a decisive rally above the 200-day EMA and the 38.2% Fibonacci mark of 1.0763 would brighten the short-term outlook.
Overall, the latest aggressive pullback in EURUSD has yet to confirm a bearish bias. For that to happen, the pair will need to slide below 1.0508.
Euro Under Pressure ahead of ECB Meeting
- ECB expected to pause at today’s meeting
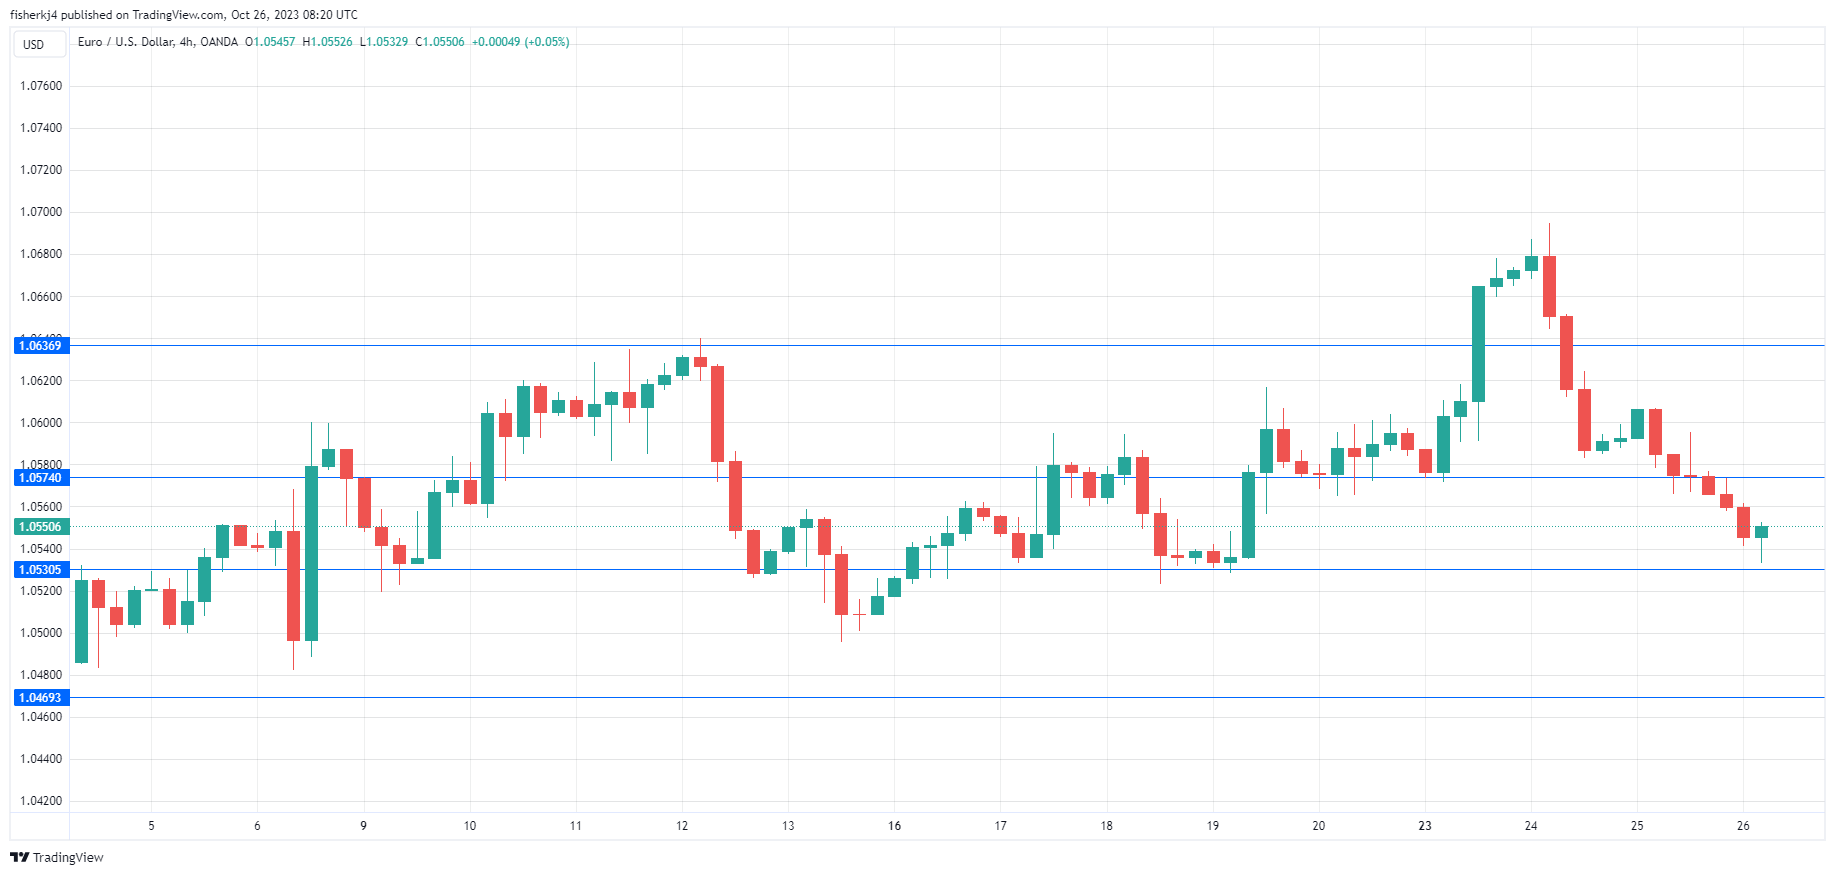
The euro continues to lose ground and has fallen over 1% since Monday. In the European session, EUR/USD is trading at 1.0545, down 0.19%.
Will the ECB take a pause?
It has been a long time coming, but barring a major surprise, the ECB will hold rates at today’s meeting. This would mark the first pause since the ECB began the current rate-tightening cycle in July 2022. The key deposit rate is currently at a record high of 4.0%.
At the previous meeting in September, the ECB raised rates by a quarter point. The policy statement signalled a “higher for longer” stance, stating that interest rates had reached levels, that if maintained sufficiently, would help push inflation back to the 2% target. At the same time, this was a strong hint that rates had peaked. The September rate hike was far from unanimous, with some Governing Council members urging a pause.
The markets have priced in a pause, based on two key factors. First, inflation in the eurozone and in Germany has fallen significantly since the September meeting. With bond yields in Europe and elsewhere climbing sharply, inflation could well continue to fall without the ECB hiking rates. Second, weak economic growth in the eurozone means that the risks of a recession are rising, and Germany is officially in a recession after two consecutive quarters of negative growth.
I would not be surprised if the ECB delivers a ‘hawkish pause’, with a message along these lines: Today’s pause was appropriate in the current economic conditions. Nevertheless, the battle against inflation is far from over and rate hikes remain on the table. If the ECB sends this kind of message at today’s meeting, the euro should be able to hold its own or even gain ground against the US dollar.
EUR/USD Technical
- EUR/USD tested resistance at 1.0648 earlier and is putting pressure on 1.0679
- 1.0574 and 1.0531 are providing support
GBP/USD: Risk Aversion Continues to Pressure
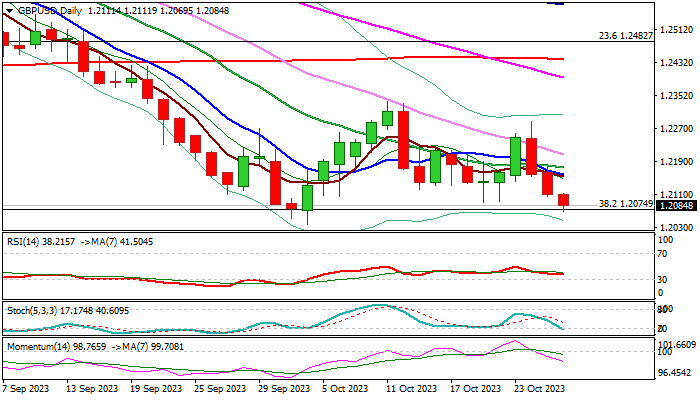
GBPUSD fell to the lowest in three weeks in early Thursday, pressured by renewed risk aversion on growing concerns that interest rates would stay high for longer period.
Bear-leg off 1.2288 (Oct 24 lower top) extends into third straight day, with break of pivotal Fibo support at 1.2108 (76.4% retracement of 1.2037/1.2337 recovery), 1.2090 (Oct 19 trough) and 1.2074 (Fibo 38.2% of larger 1.0348/1.3141 uptrend expected to generate fresh bearish signal for attack at 1.2037/29 (Oct 4 low/weekly Ichimoku cloud top) and psychological 1.20 support in extension.
Daily studies maintain strong negative momentum and MA’s are in full bearish setup, contributing to negative near-term outlook, though bears may face headwinds as stochastic is entering oversold territory, (signal is already developing on hourly and 4-h charts).
Upticks should be capped at 1.2150/70 zone to keep bears intact and offer better selling opportunities.
Caution on extension and close above 1.2200 zone which would sideline immediate bears.
Res: 1.2111; 1.2158; 1.2176; 1.2208.
Sup: 1.2052; 1.2037; 1.2000; 1.1915.
GBP/JPY Daily Outlook
Daily Pivots: (S1) 181.53; (P) 182.05; (R1) 182.46; More...
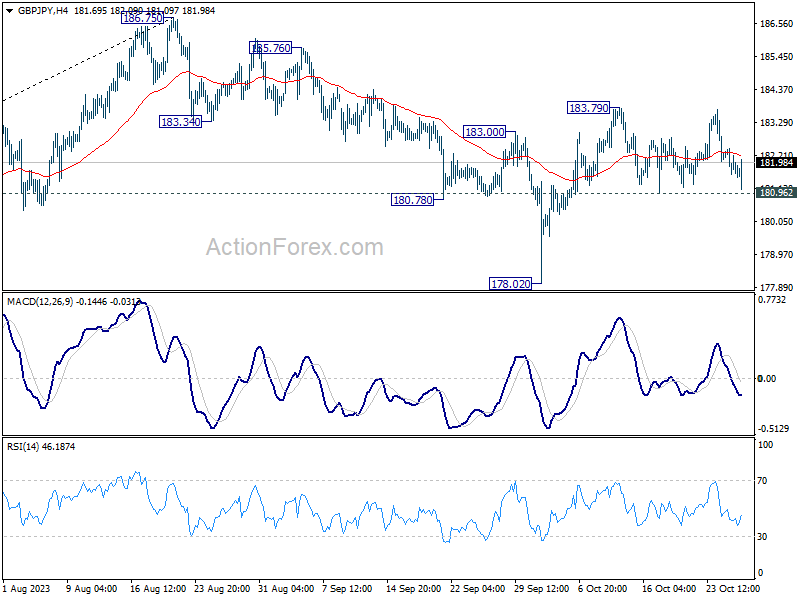
Intraday bias in GBP/JPY stays neutral at this point. With 181.00 support intact, further rise is in favor. The favored case is still that correction from 186.75 has completed at 178.02. Above 183.79 will resume the rise from 178.02 to retest 186.75 high. However, break of 181.00 will dampen this view, and turn bias back to the downside for 178.02 instead.
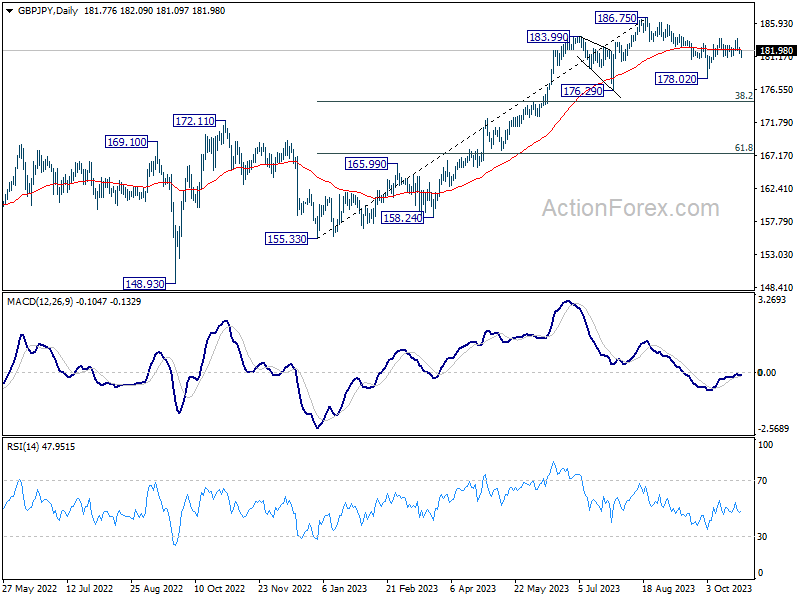
In the bigger picture, fall from 186.75 is seen as a corrective move only. As long as 176.29 support holds, larger up trend from 123.94 (202 low) should still be in progress. Break of 186.75 will target 195.86 (2015 high). Nevertheless, firm break of 176.29 will confirm medium term topping, and bring lengthier and deeper consolidations.
EUR/JPY Daily Outlook
Daily Pivots: (S1) 158.46; (P) 158.70; (R1) 158.99; More....
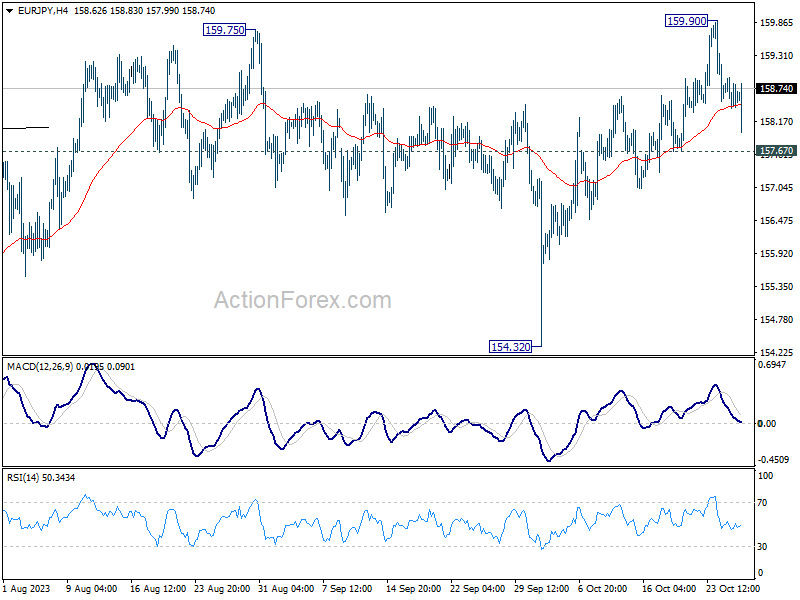
Intraday bias in EUR/JPY remains neutral for the moment. Further rise is in favor as long as 157.67 support holds. Above 159.90 will resume larger up trend to 163.06 projection level. However, firm break of 157.67 will turn bias back to the downside 154.32 support instead.
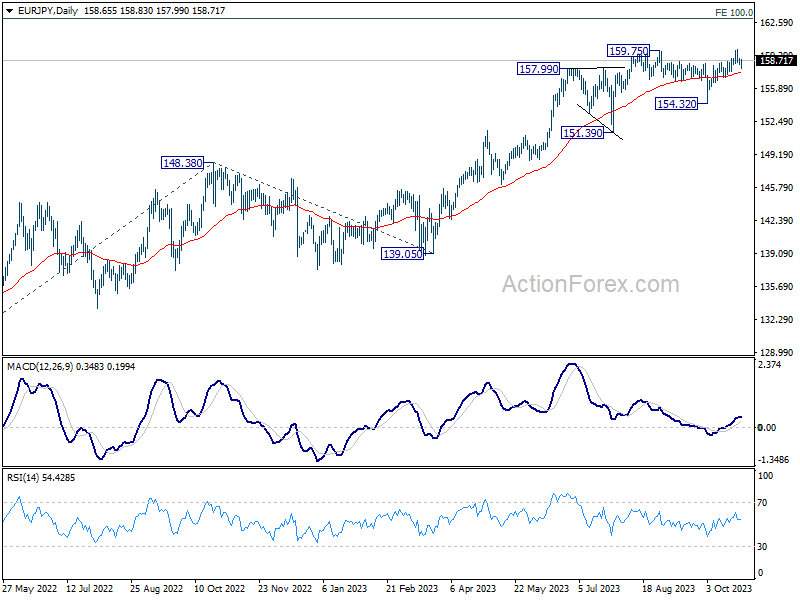
In the bigger picture, rise from 114.42 (2020 low) is in progress. next target is 100% projection of 124.37 to 148.38 from 139.05 at 163.06. On the downside, break of 154.32 support is needed to be the first sign of medium term topping. Otherwise, outlook will remain bullish even in case of deep pullback.
EUR/GBP Daily Outlook
Daily Pivots: (S1) 0.8710; (P) 0.8719; (R1) 0.8732; More....
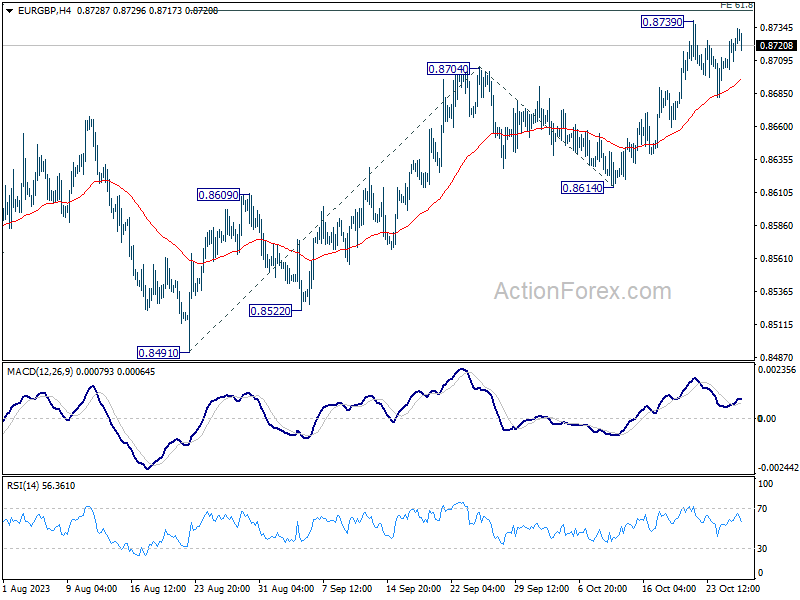
Intraday bias in EUR/GBP stays neutral at this point. Consolidation from 0.8739 might still extend. But downside of retreat should be contained well above 0.8614 support to bring another rally. Firm break of 0.8739 will target 100% projection of 0.8491 to 0.8704 from 0.8614 at 0.8827 next.
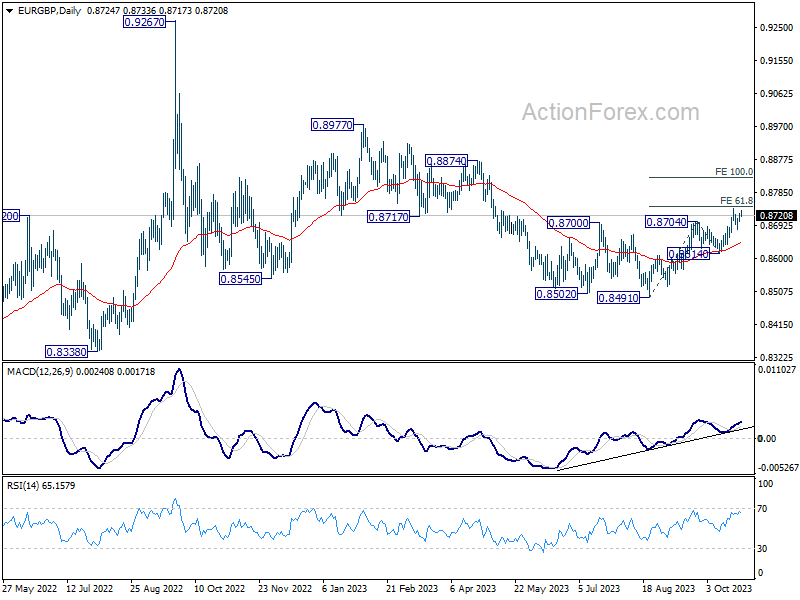
In the bigger picture, current development suggests that whole down trend from 0.9267 (2022 high) has completed with three down to to 0.8491. Rise from 0.8491 is seen as another leg inside that pattern from 0.9499 (2020 high). Further rally should be seen to 0.8977 resistance and above. This will now remain the favored case as long as 0.8614 support holds.
EUR/AUD Daily Outlook
Daily Pivots: (S1) 1.6620; (P) 1.6689; (R1) 1.6819; More...
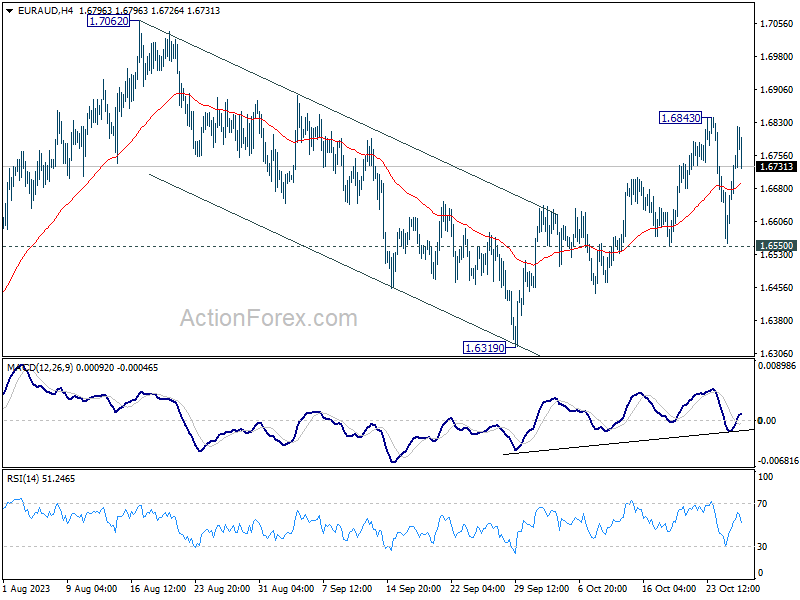
Intraday bias in EUR/AUD remains neutral for the moment. On the upside, above 1.6843 will resume the rebound from 1.6319. Firm break there will resume larger up trend. However, break of 1.6550 support will bring deeper fall back to 1.6319 support instead.
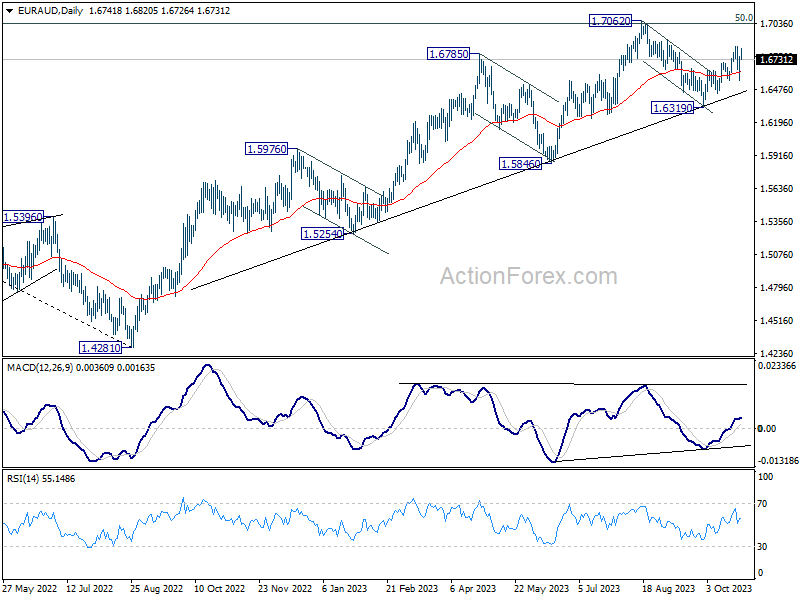
In the bigger picture, the strong support from medium term rising trend line indicates that rise from 1.4281 (2022 low) is still in progress. Sustained break of 1.7062 will pave the way to 61.8% retracement of 1.9799 (2020 high) to 1.4281 at 1.7691. In any case, outlook will stay bullish as long as 1.6319 support holds.
EUR/CHF Daily Outlook
Daily Pivots: (S1) 0.9458; (P) 0.9474; (R1) 0.9491; More...
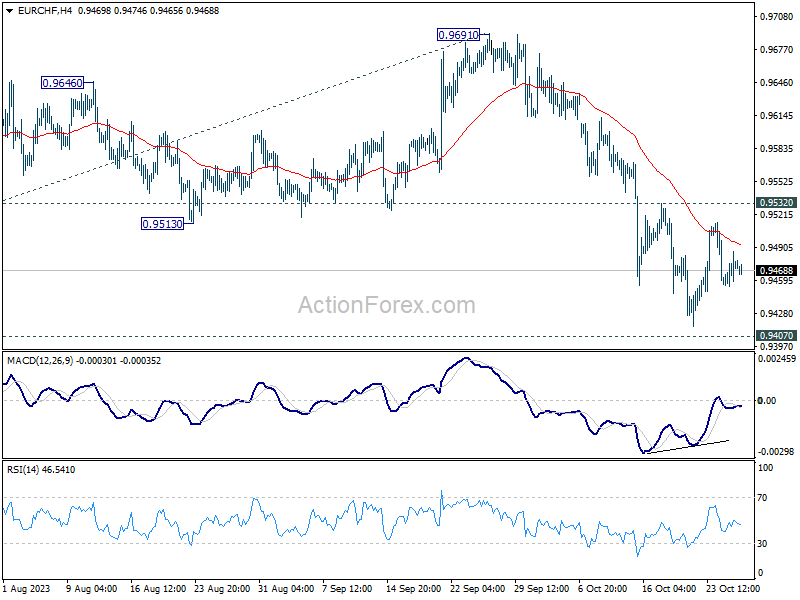
EUR/CHF is staying in sideway consolidation and intraday bias stays neutral. Outlook remains bearish with 0.9532 resistance intact. On the downside, decisive break of 0.9407 medium term bottom will confirm resumption of larger down trend. Next near term target will be 100% projection of 0.9840 to 0.9520 from 0.9691 at 0.9499, and then 161.8% projection at 0.9179. However, firm break of 0.9532 will confirm short term bottoming, and turn bias to the upside for 0.9691 resistance instead.
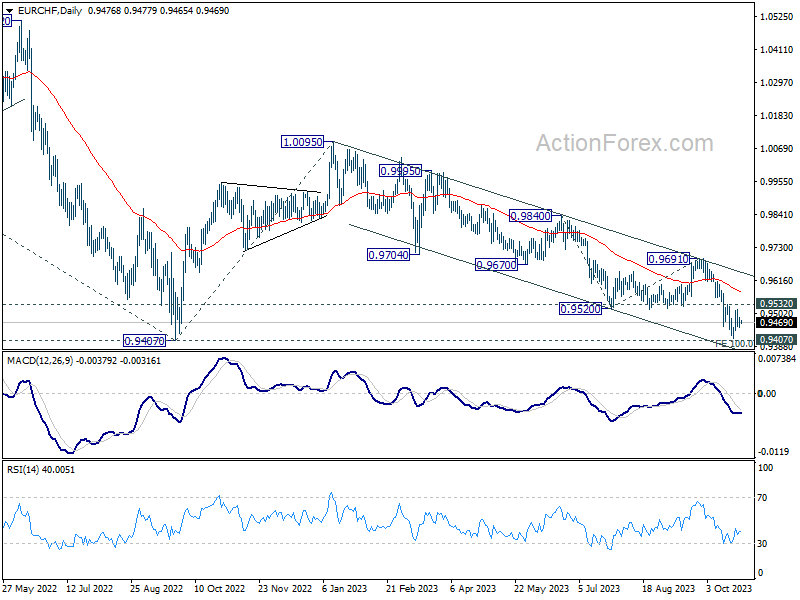
In the bigger picture, down trend from 1.2004 (2018 high) is still in progress. Decisive break of 0.9407 will confirm resumption, and target 61.8% projection of 1.1149 to 0.9407 from 1.0095 at 0.9018. On the upside, break of 0.9691 resistance is needed to be the first sign of medium term bottoming. Otherwise, outlook will stay bearish.
Gold Technical: Bullish Impulsive Up Move May Have Resumed
- The minor pull-back of Spot Gold (XAU/USD) from last Friday, 20 October high of US$1,997 may have ended on Tuesday, 24 October with an intraday low of US$1,953.
- Daily and 1-hour RSI indicators are showing a revival of bullish momentum.
- Next intermediate resistances are at US$2,006 and US$2,028/2,037.
Spot Gold (XAU/USD) has indeed shaped the minor pull-back so far of 2.2% from last Friday, 20 October high of US$1, 997 to print an intraday low of US$1,953 on Tuesday, 24 October but fell short of hitting the expected support zone of US$1,1932/1,920 as highlighted in our previous report.
Revival of bullish momentum
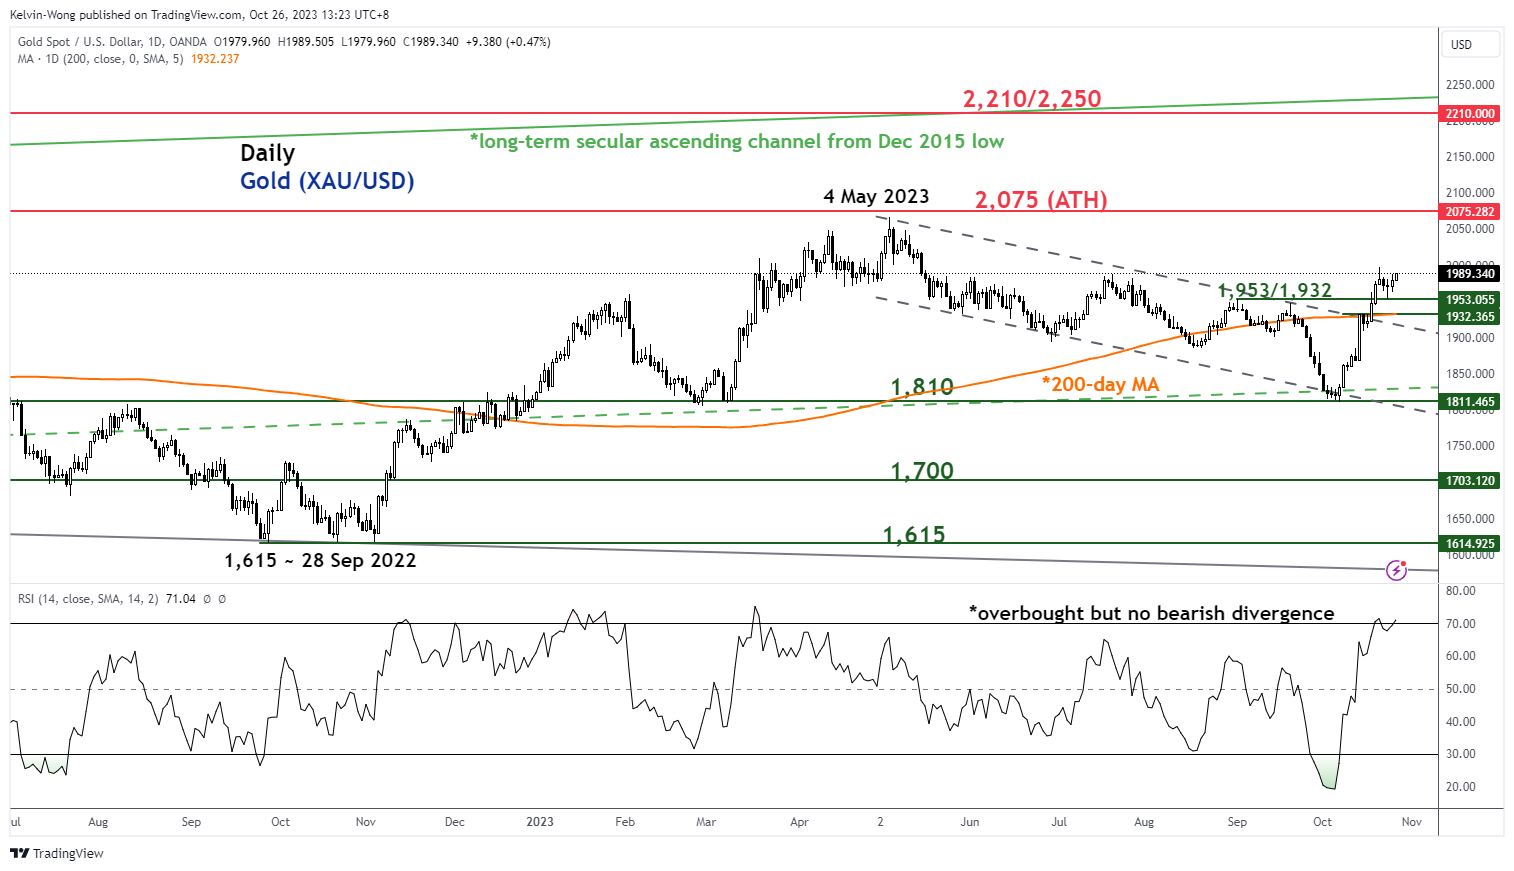
Fig 1: Spot Gold (XAU/USD) medium-term trend as of 26 Oct 2023 (Source: TradingView, click to enlarge chart)
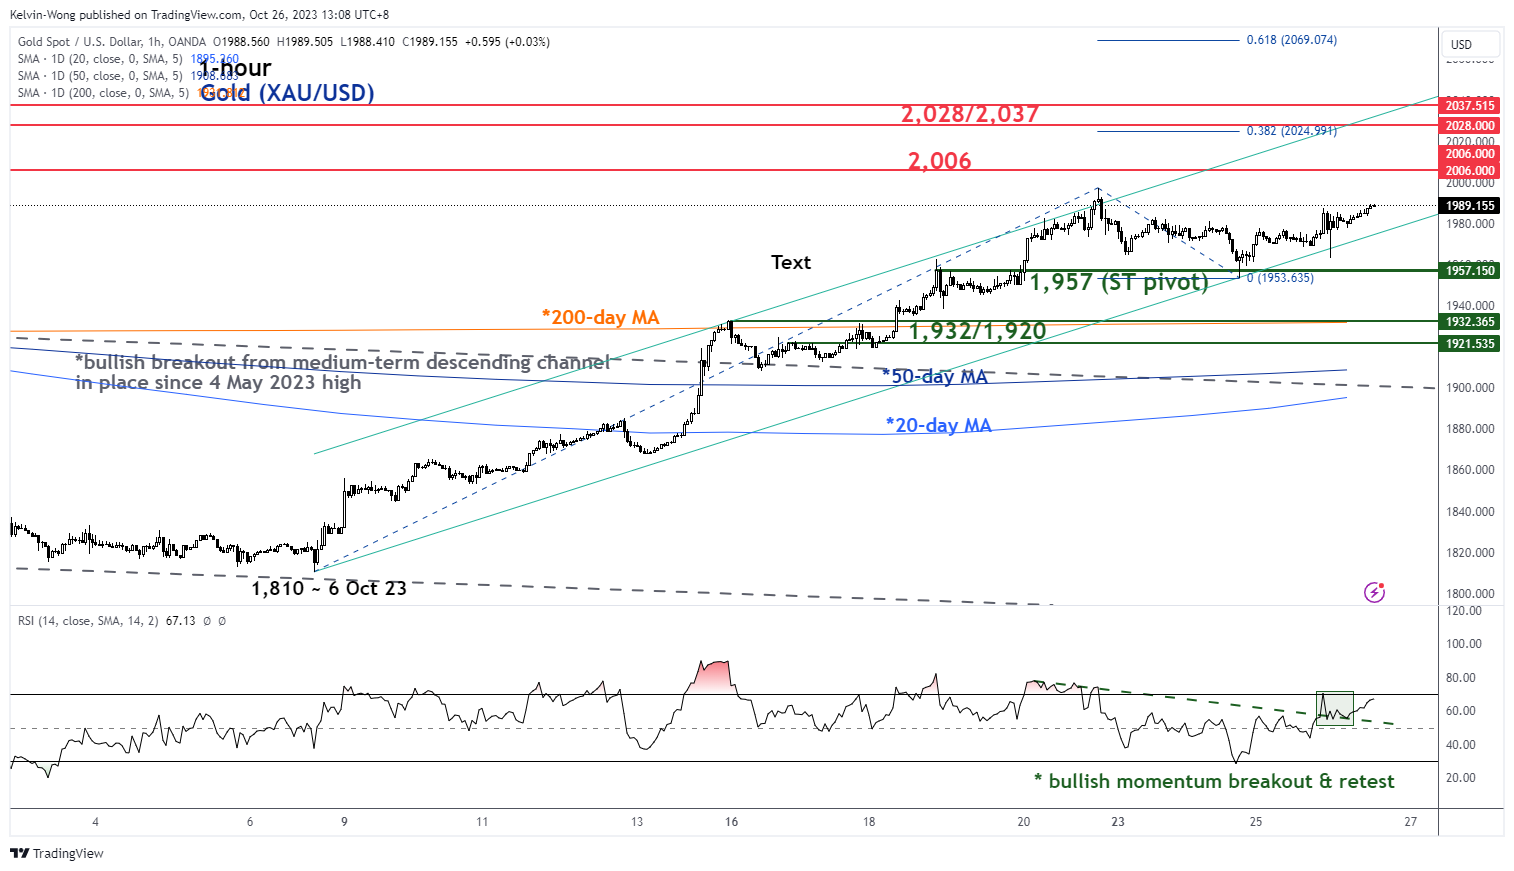
Fig 2: Spot Gold (XAU/USD) minor short-term trend as of 26 Oct 2023 (Source: TradingView, click to enlarge chart)
Current price actions in the past two days of Spot Gold (XAU/USD) have exhibited signs of bullish momentum.
Firstly, the daily RSI momentum indicator has not flashed any clear bearish divergence condition despite being at the overbought region (above 70) which in turn suggests the medium-term uptrend phase in place since the 6 October 2023 low of US$1,810 is still likely to have inertia to shape “higher highs” in price actions (see Figure 1).
Secondly, in the lower time frame as indicated by the 1-hour RSI, it has staged a bullish breakout from a parallel descending resistance with a retest on it yesterday, 25 October (see Figure 2).
All in all, these latest key technical developments have suggested that the minor pull-back of Spot Gold (XAU/USD) may have ended and it is likely to be in the midst of another potential impulsive up move sequence within its medium-term uptrend phase.
Watch the key short-term pivotal support at US$1,957 with the next intermediate resistances coming in at US$2,006 and US$2,028/2,037 (upper boundary of the short-term ascending channel from 6 October 2023 low & Fibonacci extension).
On the other hand, a break below US$1,957 negates the bullish tone to revive an extended pull-back scenario to expose the support zone of US$1,932/1,920 (also the 200-day moving average).