

Sample Category Title
Technical Outlook and Review
DXY:
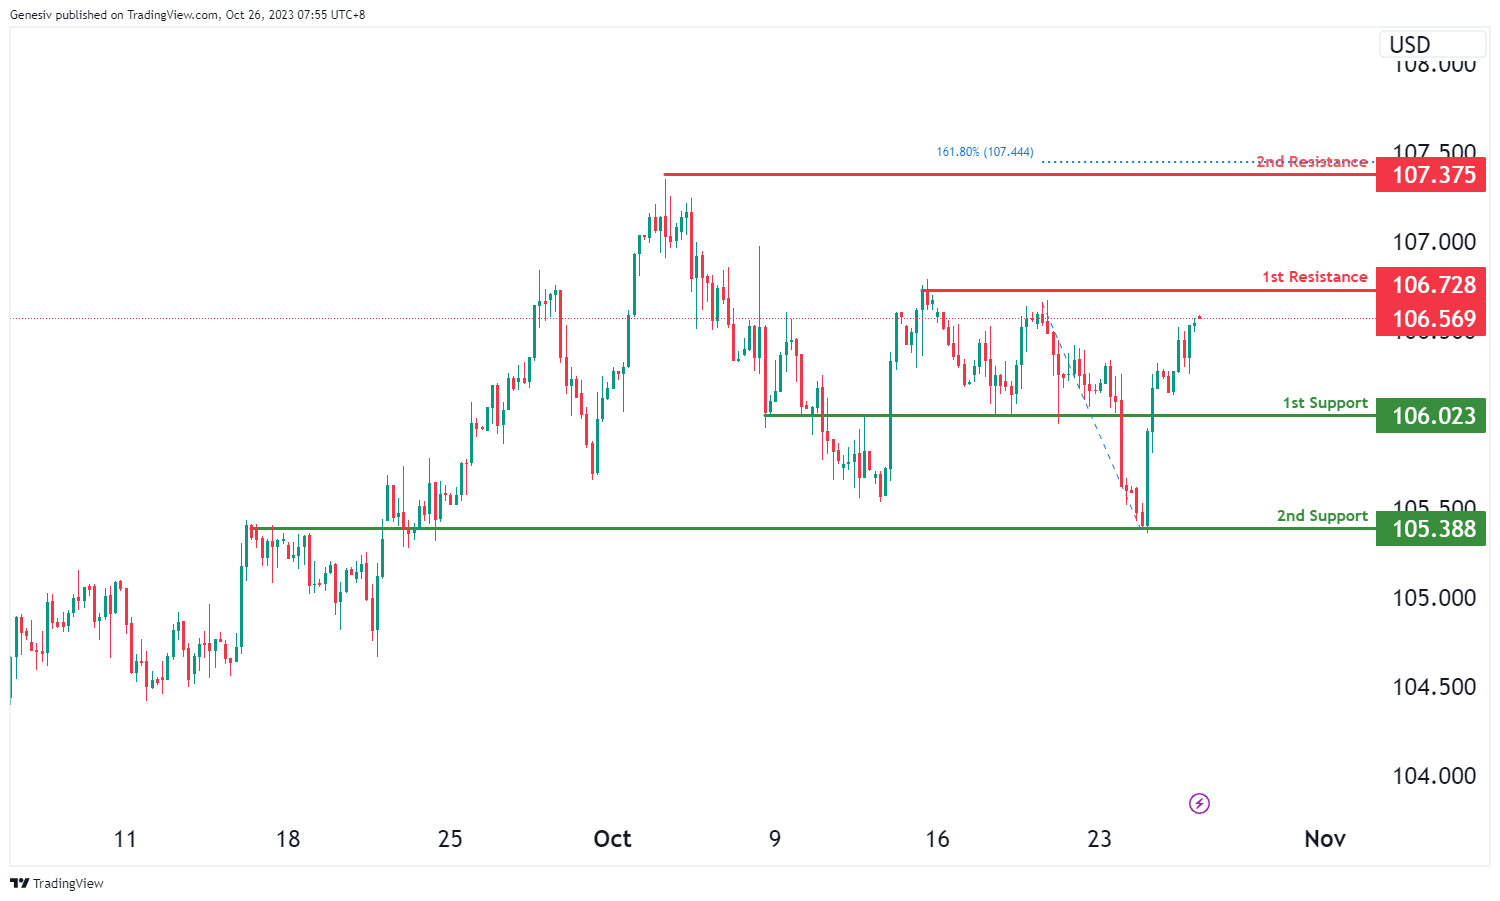
The DXY (US Dollar Index) chart currently exhibits a bullish overall momentum, indicating the potential for a bullish continuation towards the 1st resistance level.
The 1st support at 106.02 is considered a significant level as it aligns with a pullback support, suggesting it may provide a foundation of potential price support. Furthermore, the 2nd support at 105.38 is identified as an overlap support, reinforcing the potential for it to act as a support level.
On the resistance side, the 1st resistance at 106.72 is characterized as a swing high resistance level, indicating that it may serve as a notable barrier to upward price movement. Additionally, the 2nd resistance at 107.37 is identified as a swing high resistance and is associated with the 161.80% Fibonacci Extension level, further emphasizing its potential resistance significance.
EUR/USD:
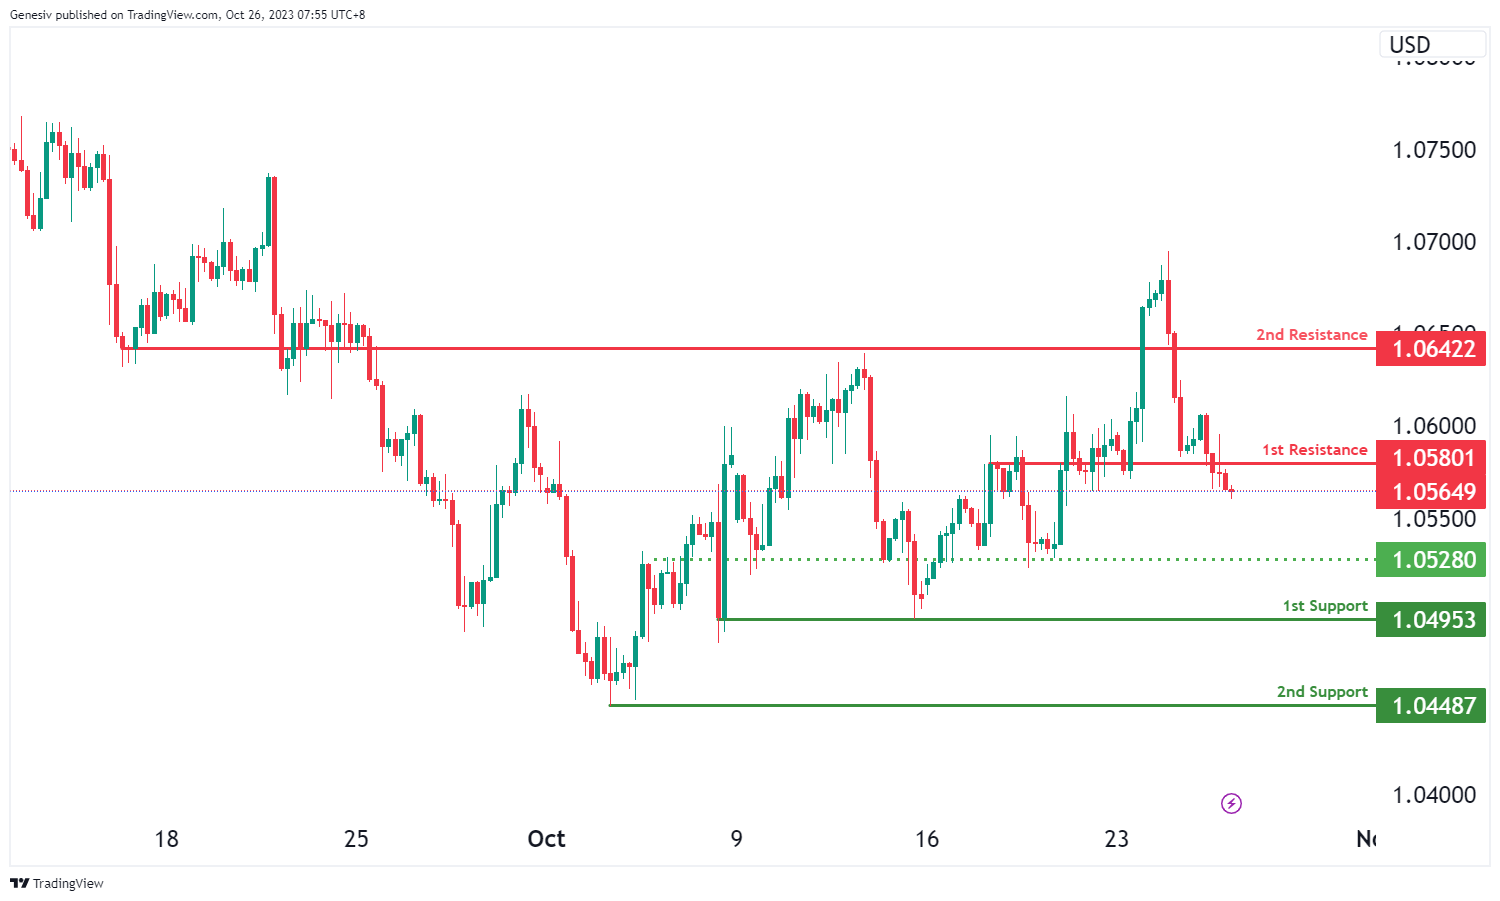
The EUR/USD chart currently shows a bearish overall momentum, and there is a potential scenario for a bearish continuation towards the 1st support level.
The 1st support at 1.0495 is considered significant as it aligns with a multi-swing low support level, indicating a strong potential area of price support. Additionally, the 2nd support at 1.0448 is identified as a swing low support, further reinforcing the potential for it to act as a support level.
On the resistance side, the 1st resistance at 1.0580 is characterized as an overlap resistance level, suggesting that it may serve as a notable barrier to upward price movement. Furthermore, the 2nd resistance at 1.0642 is identified as a pullback resistance level, indicating potential resistance significance.
An intermediate support level at 1.0528 is also mentioned as an overlap support, providing additional insights into potential price support zones.
EUR/JPY:
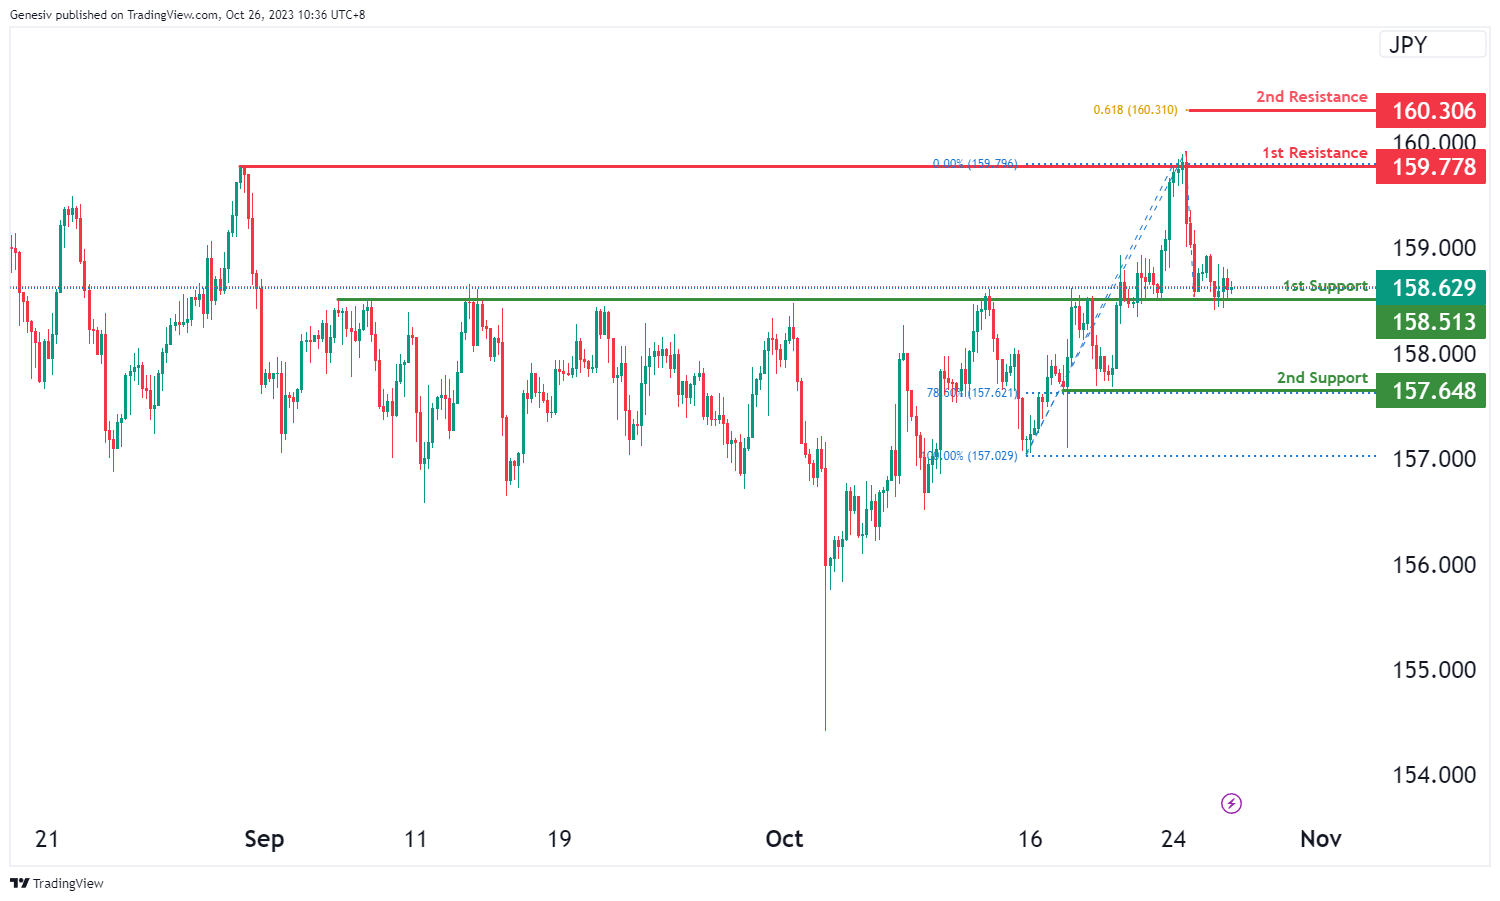
The EUR/JPY instrument is currently demonstrating a bullish overall momentum on the chart. There is potential for a bullish breakout through the first resistance at 159.77, with the expectation of the price rising to the second resistance at 160.30.
The first support at 158.51 is deemed strong due to its overlap support characteristics. The second support at 157.64 is significant as it features multi-swing low support and is also associated with the 78.60% Fibonacci Retracement.
Conversely, the first resistance at 159.77 is noteworthy for its multi-swing high resistance properties. The second resistance at 160.30 is significant due to the presence of the 61.80% Fibonacci Projection.
EUR/GBP:
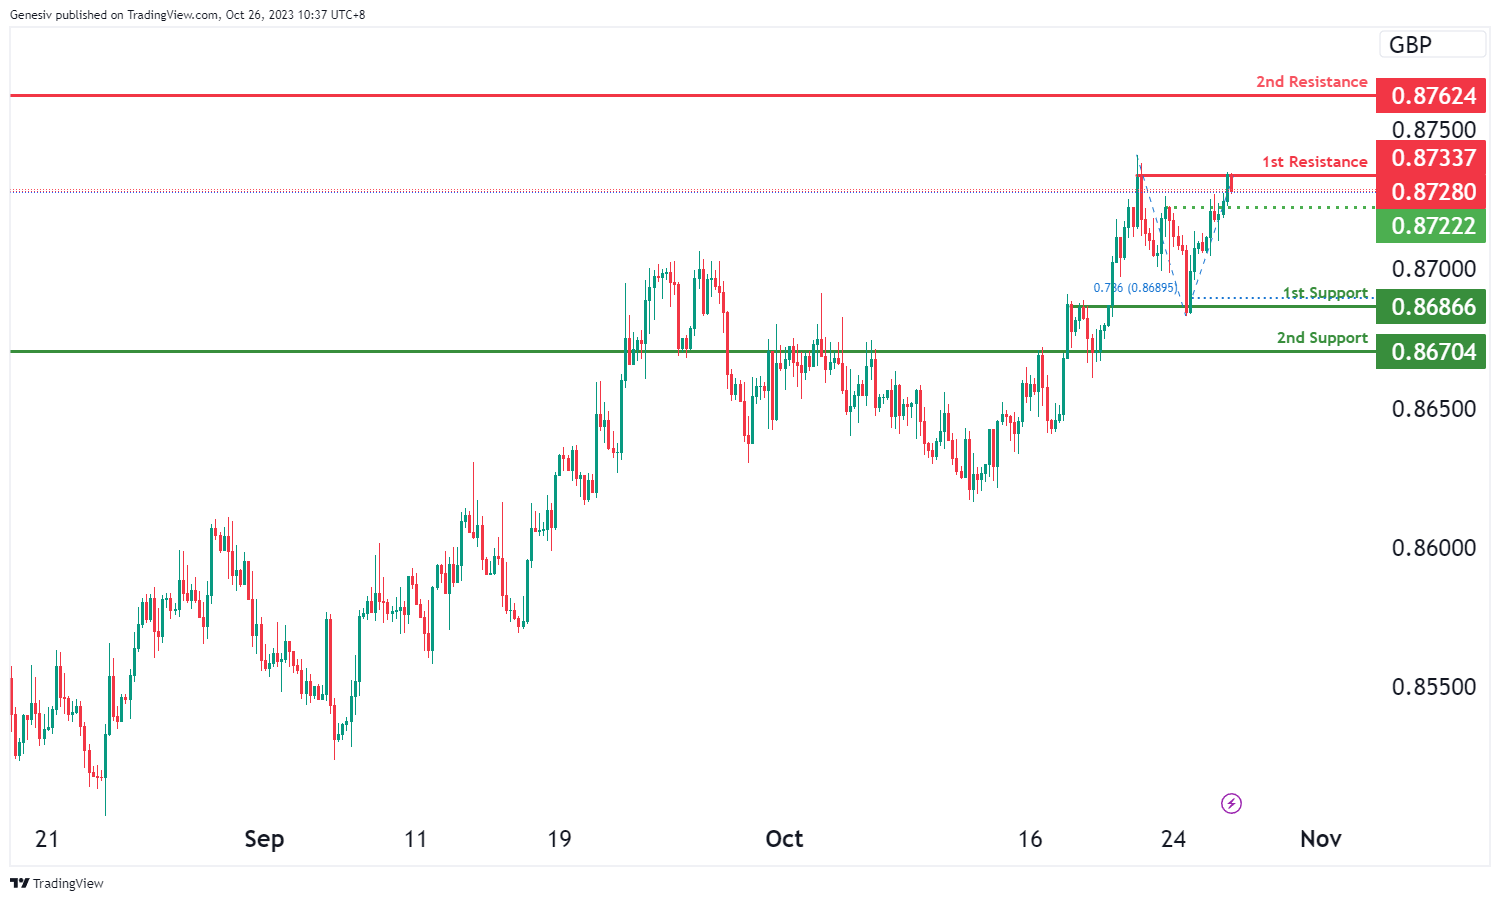
For the EUR/GBP instrument, the chart currently exhibits a bearish overall momentum, suggesting a potential bearish continuation in price movement towards the first support at 0.8686. This support level is notable for its overlap support characteristics and the presence of the 78.60% Fibonacci Projection, making it a strong potential level of support.
The second support at 0.8670 is also significant as it features overlap support.
On the resistance side, the first resistance at 0.8733 is marked by multi-swing high resistance characteristics. The second resistance at 0.8762 is noteworthy for its overlap resistance.
Additionally, there is an intermediate support level at 0.8722, which is supported by its pullback support attributes.
GBP/USD:
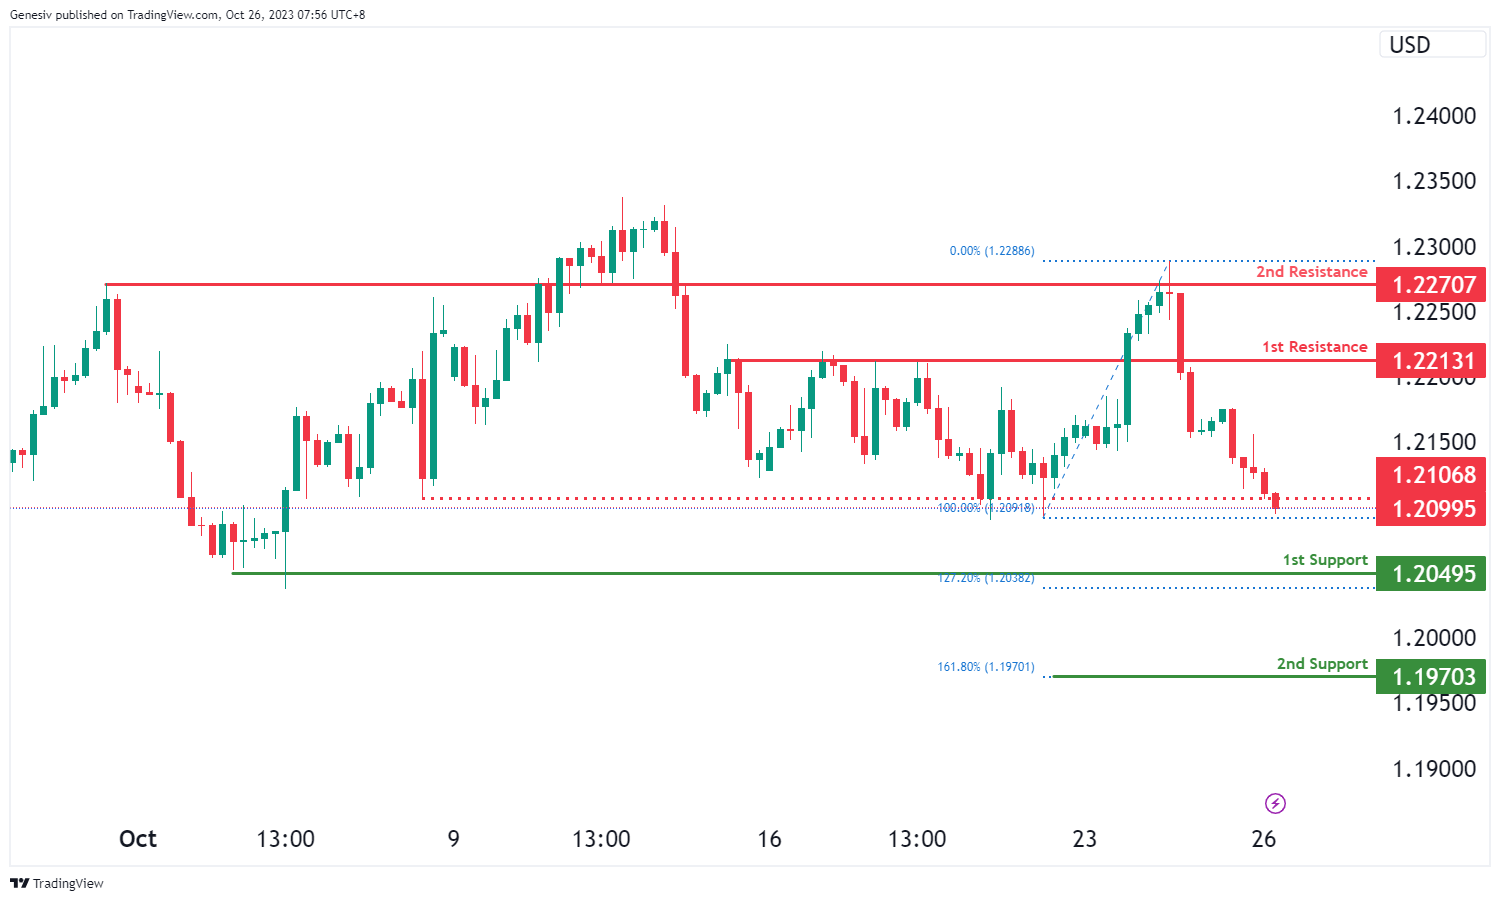
The GBP/USD chart currently exhibits a bearish overall momentum, and there is a potential scenario for a bearish continuation towards the 1st support level.
The 1st support at 1.2049 is considered significant as it aligns with a multi-swing low support level and coincides with the 127.20% Fibonacci Extension level, indicating a strong potential area of price support. Additionally, the 2nd support at 1.1970 is identified as a support level and coincides with the 161.80% Fibonacci Extension, further reinforcing its potential as a support zone.
On the resistance side, the 1st resistance at 1.2213 is characterized as a pullback resistance level, suggesting that it may act as a notable barrier to upward price movement. Furthermore, the 2nd resistance at 1.2270 and the intermediate resistance at 1.2106 are also identified as pullback resistance levels, indicating potential resistance significance at these levels.
GBP/JPY:
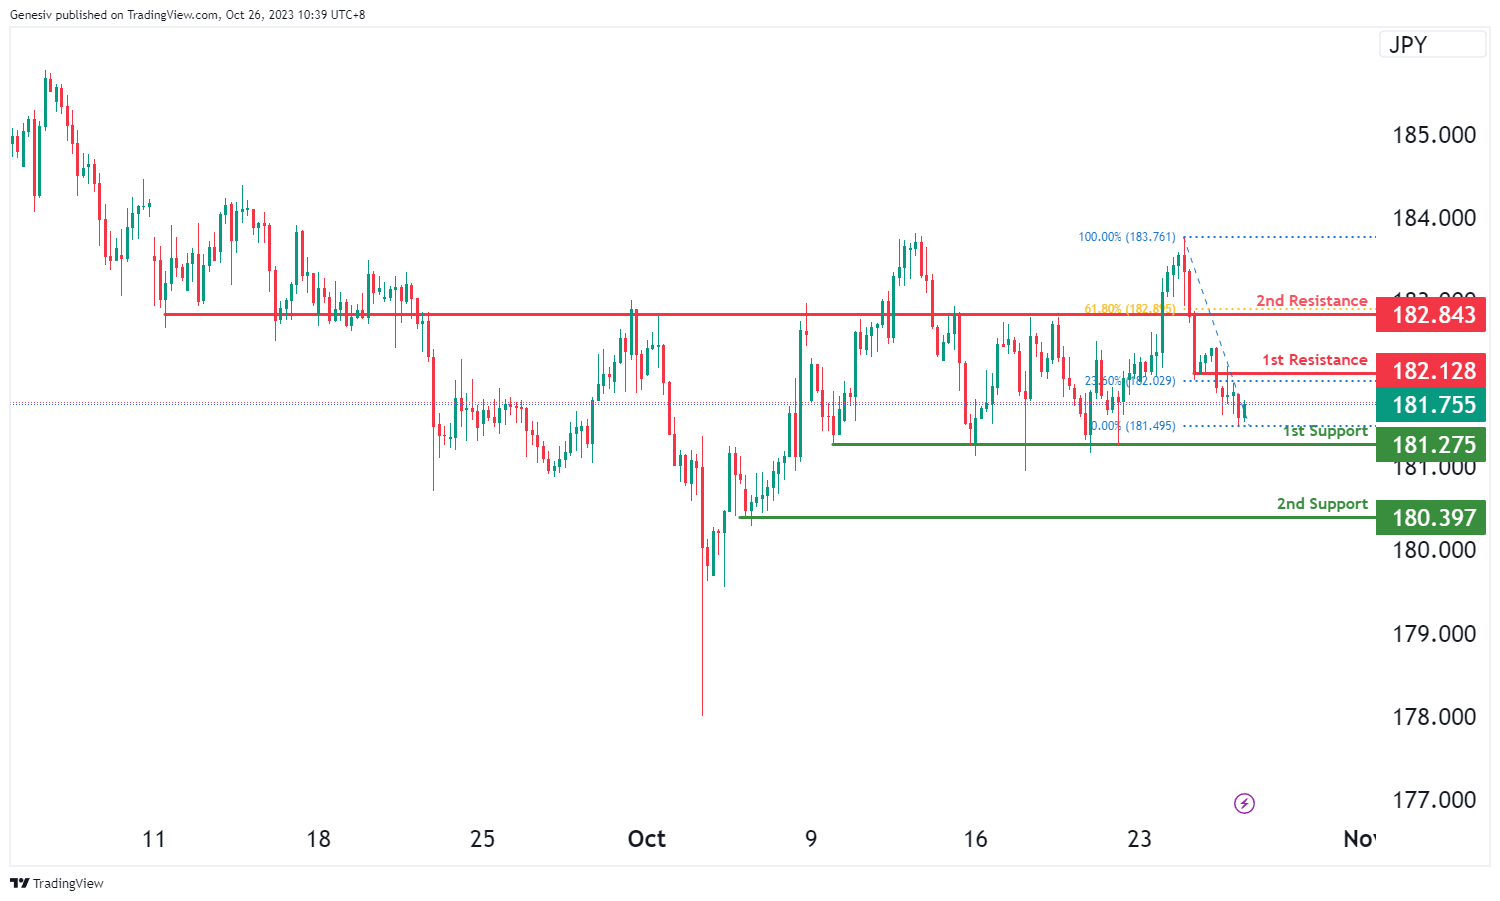
The GBP/JPY instrument is currently exhibiting a bullish overall momentum on the chart, indicating the potential for a bullish continuation in price movement towards the first resistance at 182.12.
The first support at 181.27 is considered strong due to its multi-swing low support characteristics. The second support at 180.39 is also significant as it features swing low support.
On the resistance side, the first resistance at 182.12 is noteworthy for its overlap resistance characteristics and the presence of the 23.60% Fibonacci Retracement, making it a substantial level of resistance. The second resistance at 182.84 is marked by pullback resistance and the presence of the 61.80% Fibonacci Retracement, making it another important level of resistance.
USD/CHF:
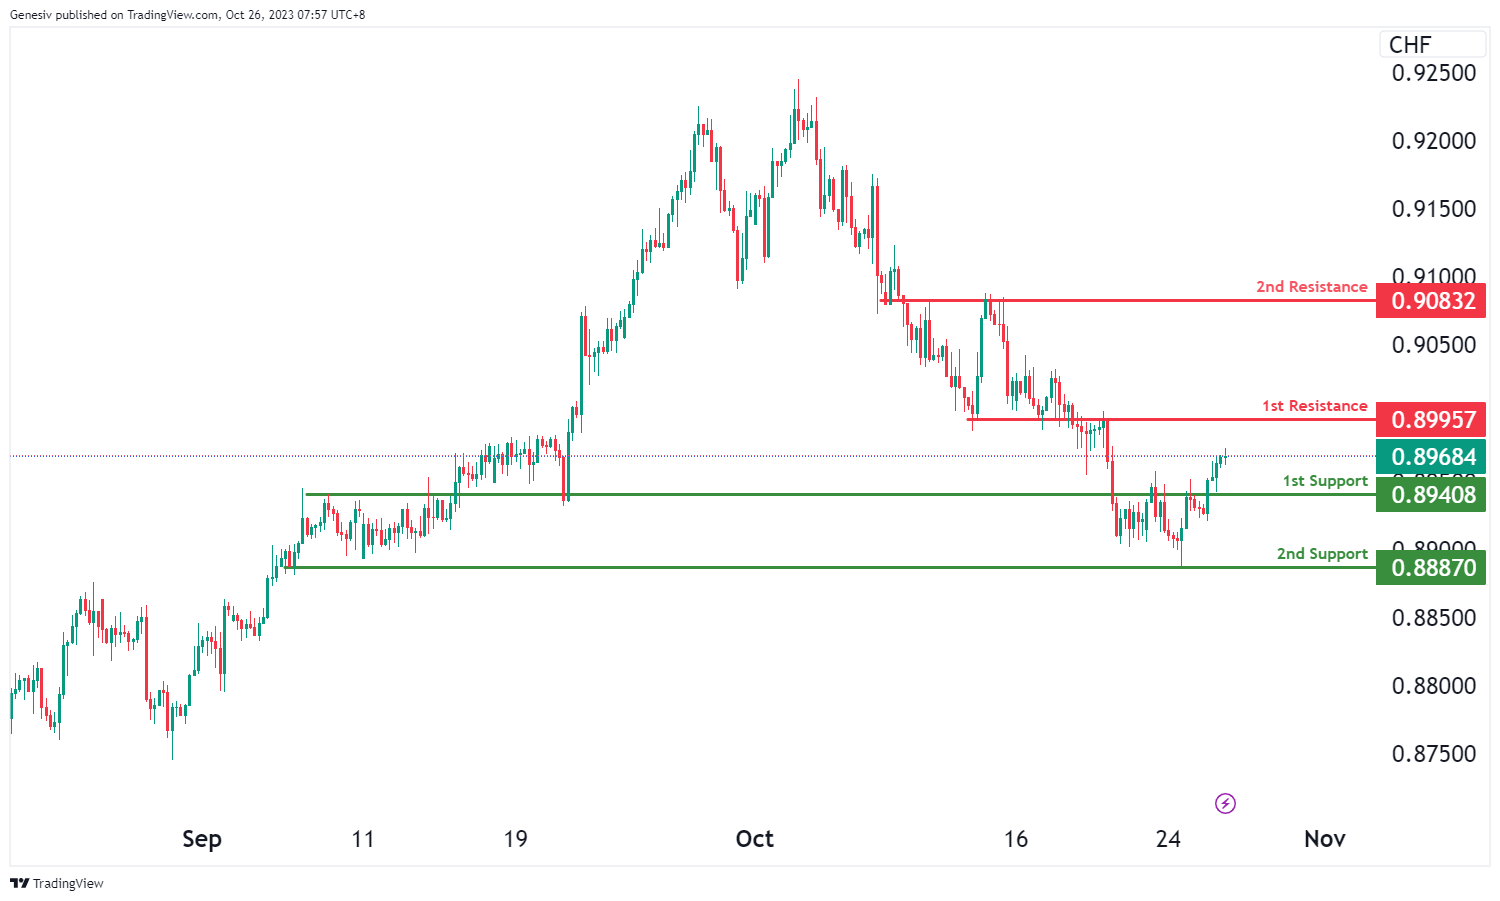
The USD/CHF chart currently displays bullish overall momentum, with the potential scenario of a bullish continuation towards the 1st resistance level.
The 1st support at 0.8940 is considered significant as it aligns with an overlap support level, indicating a potential area of price support. Additionally, the 2nd support at 0.8887 is identified as a swing low support, further reinforcing the potential for support at this level.
On the resistance side, the 1st resistance at 0.8995 is characterized as an overlap resistance level, suggesting potential resistance significance that price may encounter. Beyond this, the 2nd resistance at 0.9083 is also identified as an overlap resistance, indicating another potential barrier to further upward price movement.
USD/JPY:
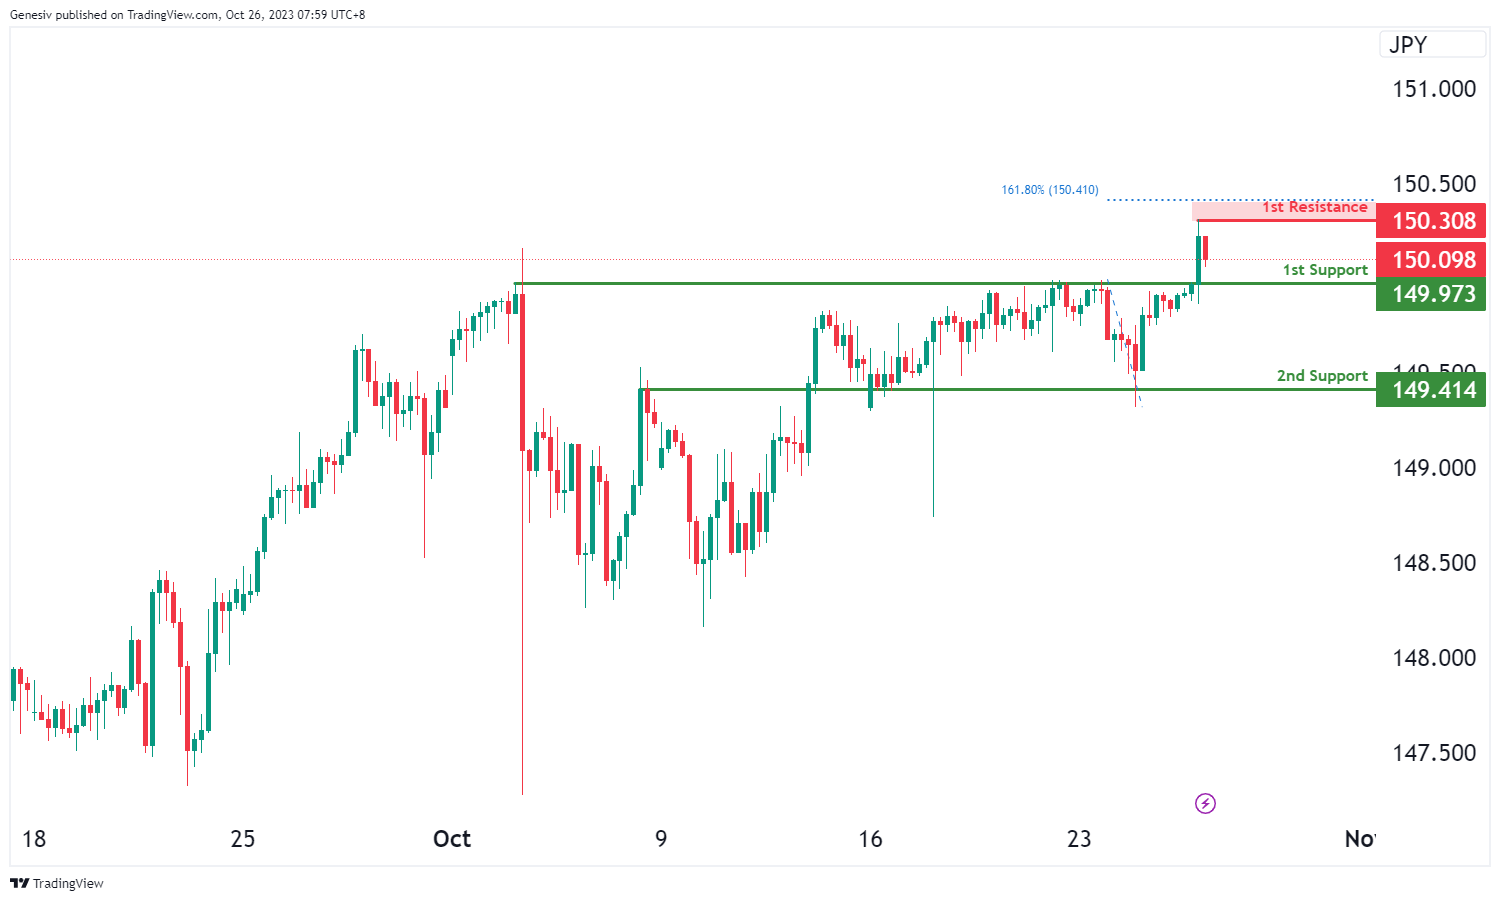
The USD/JPY chart currently exhibits bullish overall momentum, with the potential scenario of a bullish bounce off the 1st support level towards the 1st resistance.
The 1st support at 149.97 is considered significant as it aligns with a pullback support level, indicating a potential area of price support. Additionally, the 2nd support at 149.41 is identified as an overlap support, further reinforcing the potential for support at this level.
On the resistance side, the 1st resistance at 150.30 is characterized as a multi-swing high resistance level, suggesting potential resistance significance that price may encounter as it attempts to move higher.
USD/CAD:
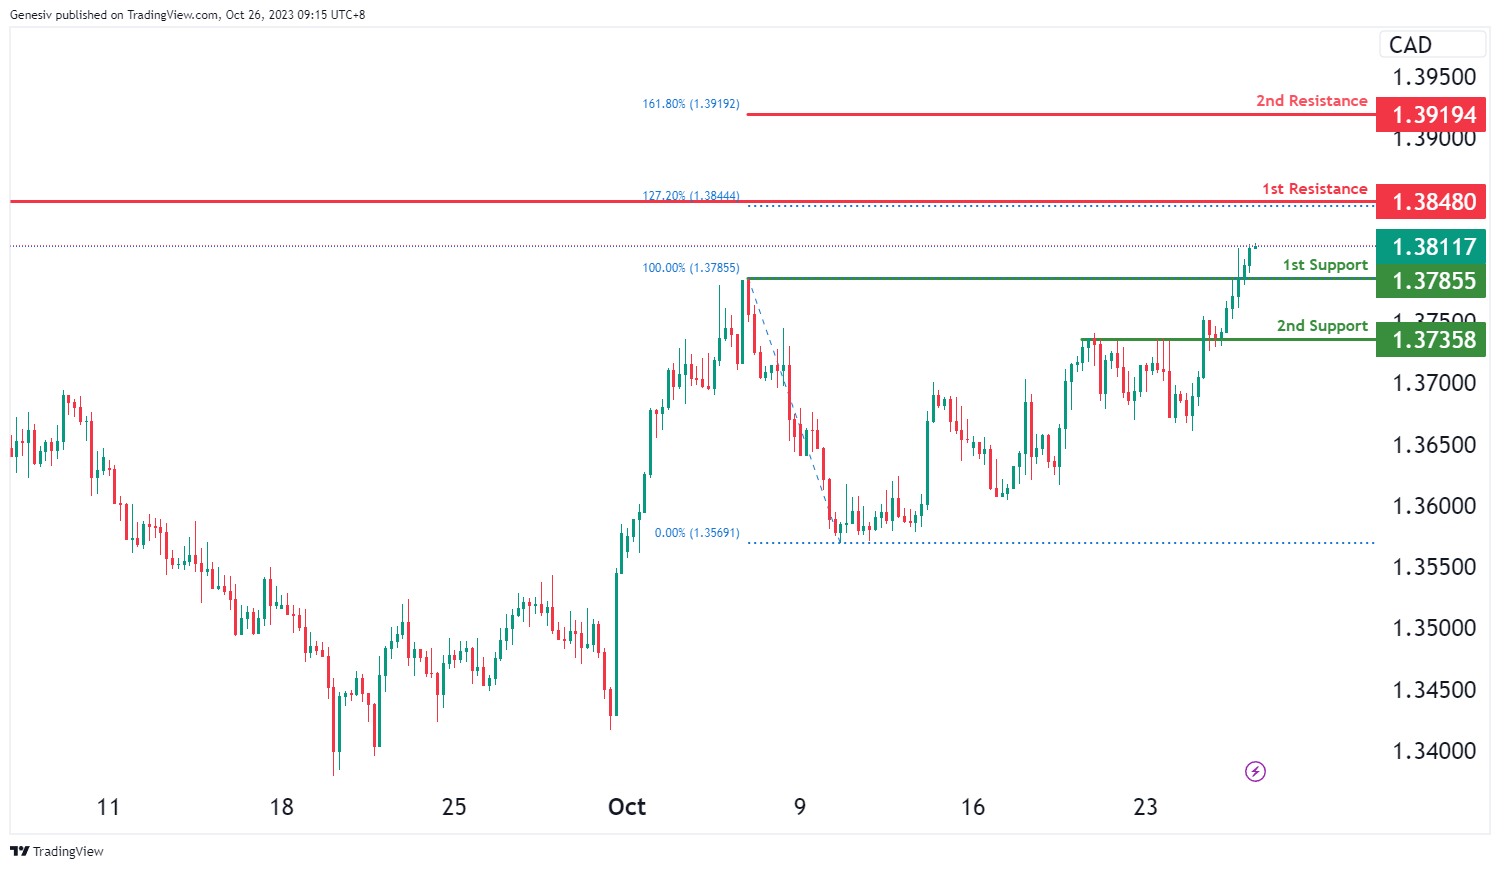
The USD/CAD chart currently exhibits an overall bullish momentum indicating the likelihood of a bullish continuation towards the 1st resistance level, especially after breaking above the significant swing-high resistance at 1.3786.
The 1st resistance level at 1.3848 is identified as a swing-high resistance that aligns with the 127.20% Fibonacci extension level. Higher up, the 2nd resistance level at 1.3919 is marked as a resistance level that aligns with the 161.80% Fibonacci extension level, potentially acting as a barrier to further bullish advances.
To the downside, the 1st support level at 1.3786 is identified as a pullback support. Further below, the 2nd support level at 1.3736 is noted as an overlap support, potentially acting as a strong support zone.
AUD/USD:
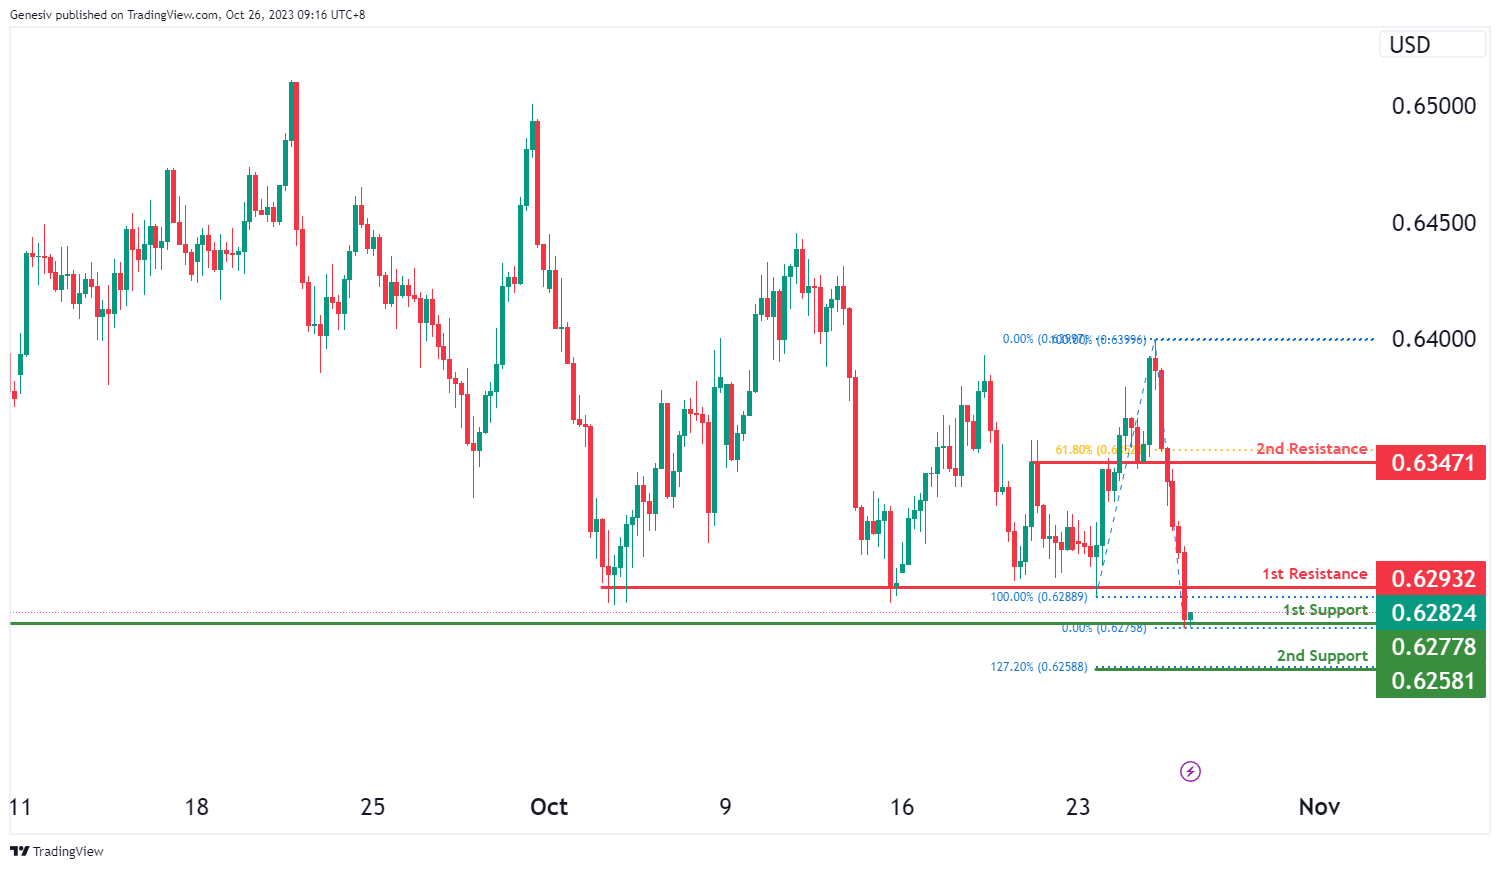
The AUD/USD chart currently exhibits an overall bearish momentum with price potentially making a bearish reaction off the 1st resistance level to drop lower towards the 1st support level.
The 1st resistance level at 0.6293 is identified as a pullback resistance. Higher up, the 2nd resistance level at 0.6347 is marked as an overlap resistance that aligns close to the 61.80% Fibonacci retracement level, making it a potentially strong resistance level.
To the downside the 1st support level at 0.6278 is identified as a multi-swing-low support. Additionally, the 2nd support level at 0.6258 is noted as a support level that aligns with the 127.20% Fibonacci extension level, further reinforcing its importance as a potential support area.
NZD/USD
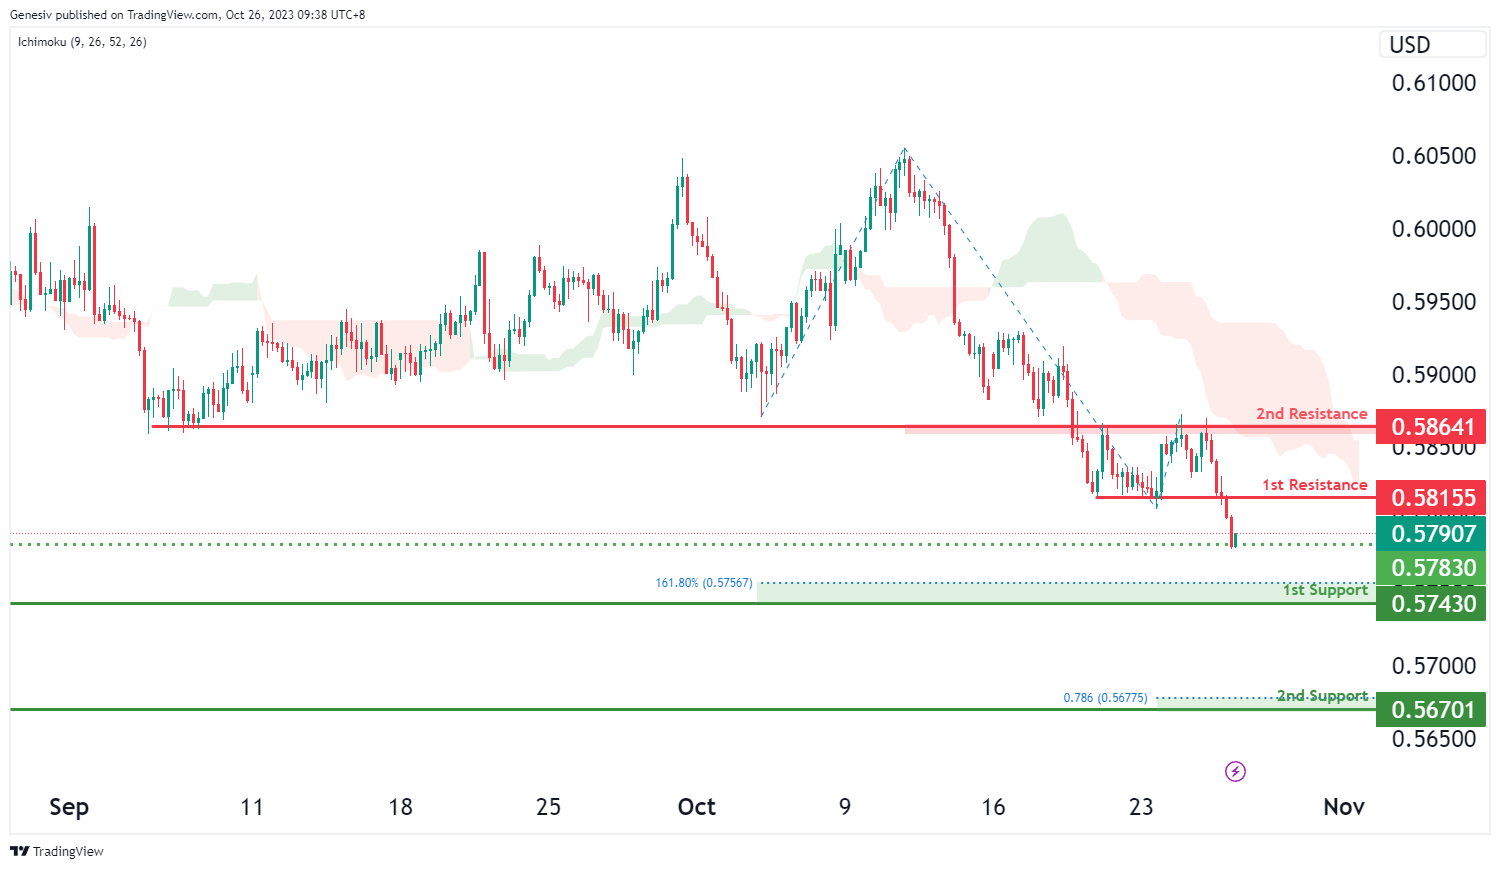
The NZD/USD chart currently exhibits an overall bearish momentum with price potentially making a bearish continuation towards the 1st support level, especially if price breaks below the intermediate support level.
The intermediate support at 0.5783 is identified as an overlap support while the 1st support level at 0.5743 is marked as a swing-low support that aligns close to the 161.80% Fibonacci extension level. Additionally, the 2nd support level at 0.5670 is noted as a pullback support that aligns close to the 78.60% Fibonacci projection level, further reinforcing its importance as a potential support area.
To the upside, the 1st resistance level at 0.5816 is identified as a pullback resistance. Higher up, the 2nd resistance level at 0.5864 is marked as an overlap resistance, making it a potentially strong resistance level.
DJ30:
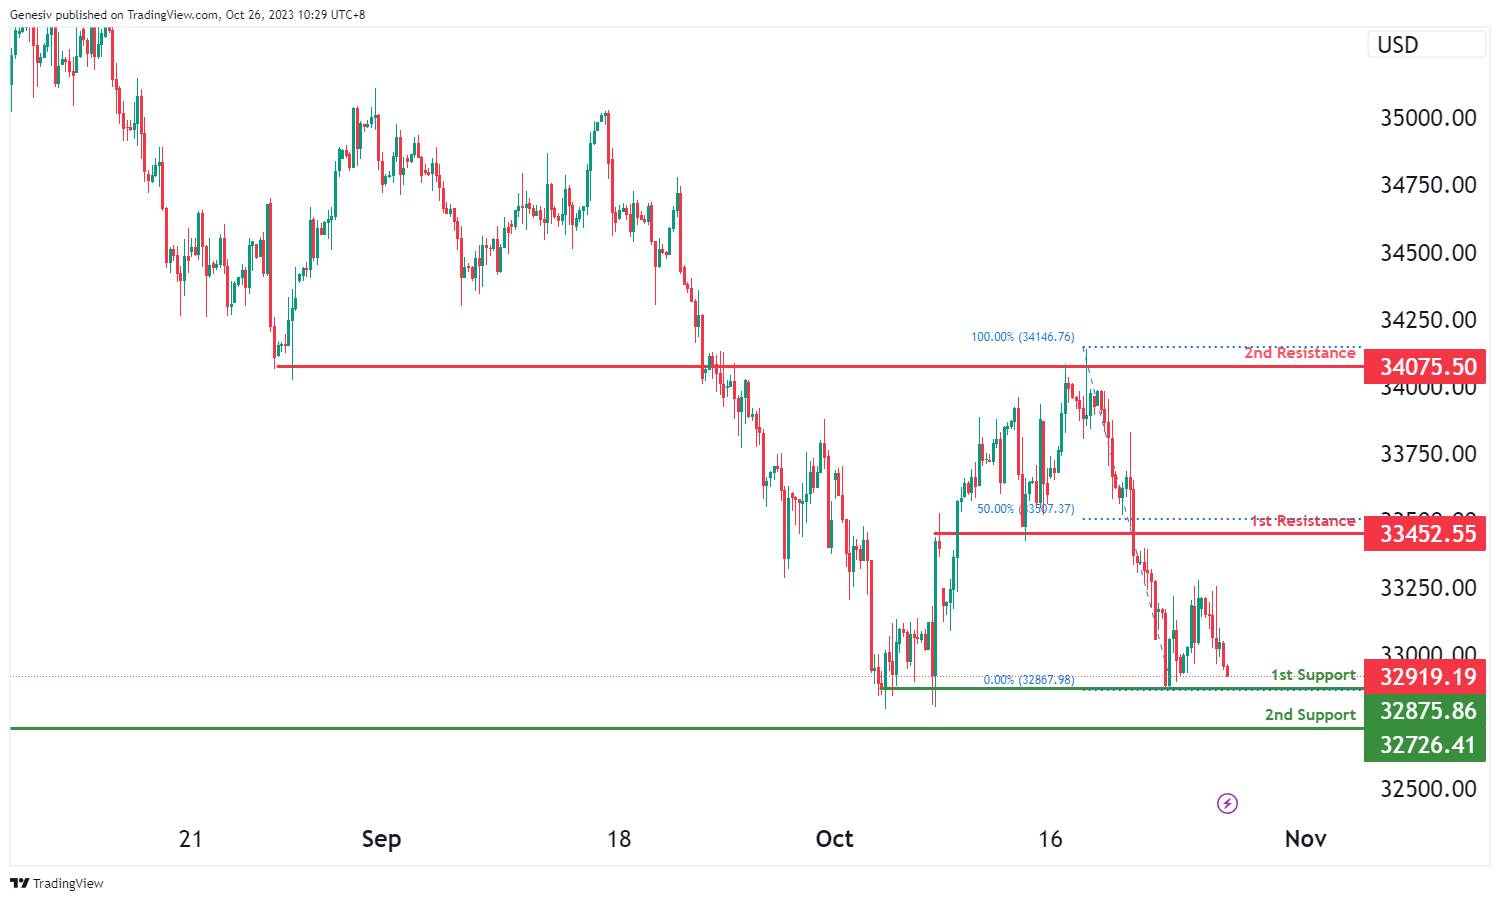
The instrument DJ30 currently exhibits a bullish overall momentum on its chart. The price may potentially drop further to the first support level at 32875.86 in the short term before bouncing from there and rising towards the first resistance at 33452.55.
The first support at 32875.86 is considered a strong level due to its multi-swing low support characteristics, while the second support at 32726.41 shares the same attribute.
On the other hand, the first resistance at 33452.55 is noteworthy for its pullback resistance, and the second resistance at 34075.50 is significant due to an overlap resistance.
GER40:
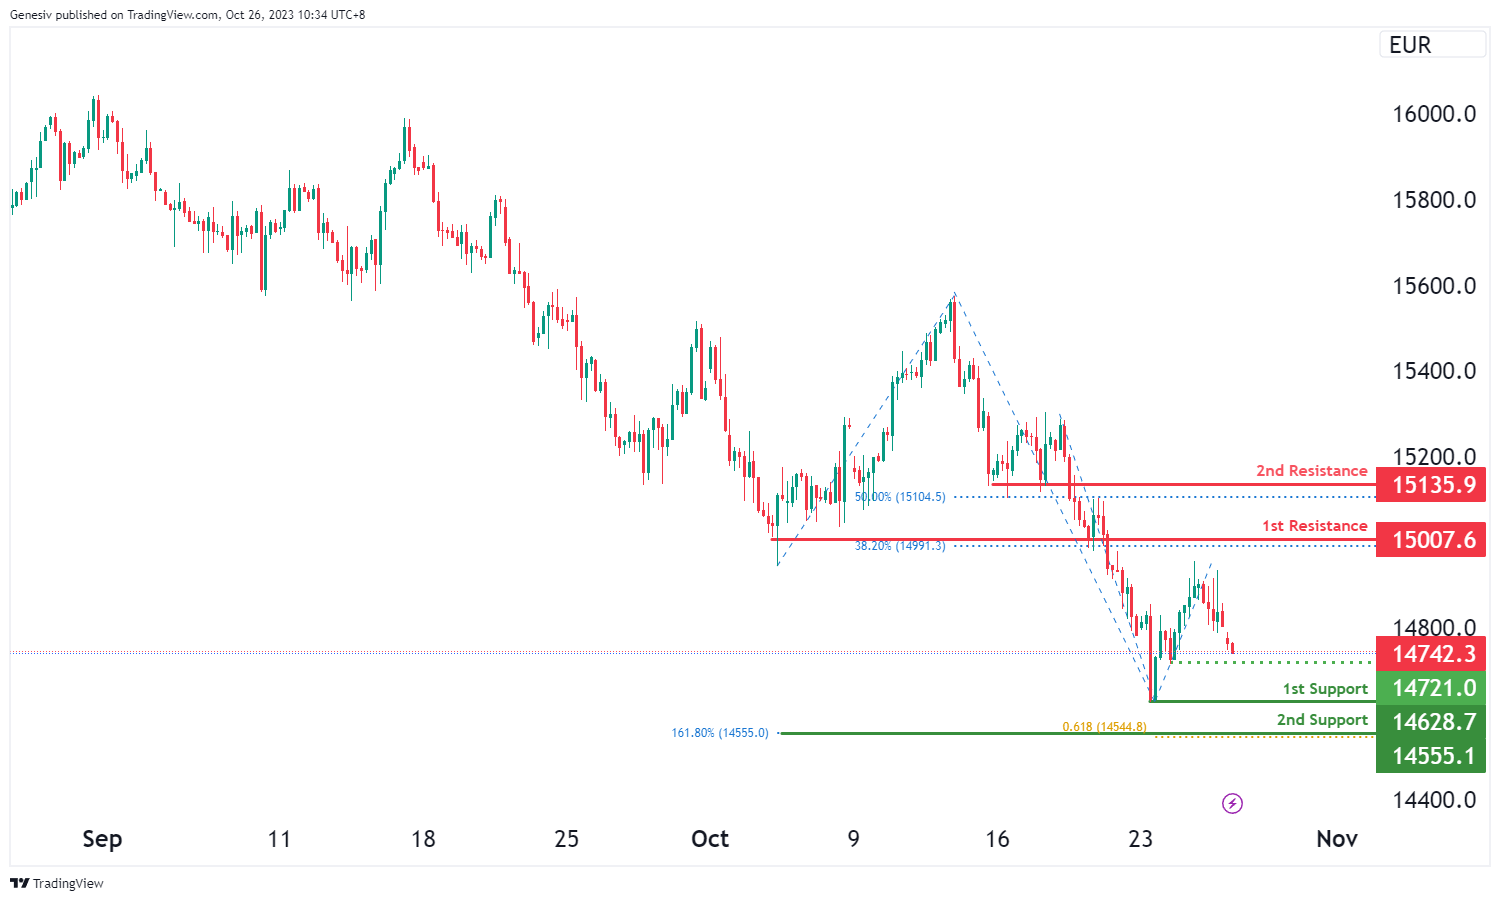
For the GER40 instrument, the chart is currently showing a bearish overall momentum. Price is expected to potentially continue in a bearish direction, heading towards the first support at 14628.70, which is considered a robust level due to its swing low support characteristics. The second support at 14555.10 is also significant, attributed to the 161.80% Fibonacci Extension.
On the other hand, the first resistance at 15007.60 is noteworthy for its pullback resistance and the presence of the 38.20% Fibonacci Retracement, while the second resistance at 15135.90 is marked by pullback resistance and the 50% Fibonacci Retracement. Additionally, there is an intermediate support level at 14721.00, which is supported by its swing low support characteristics.
US500
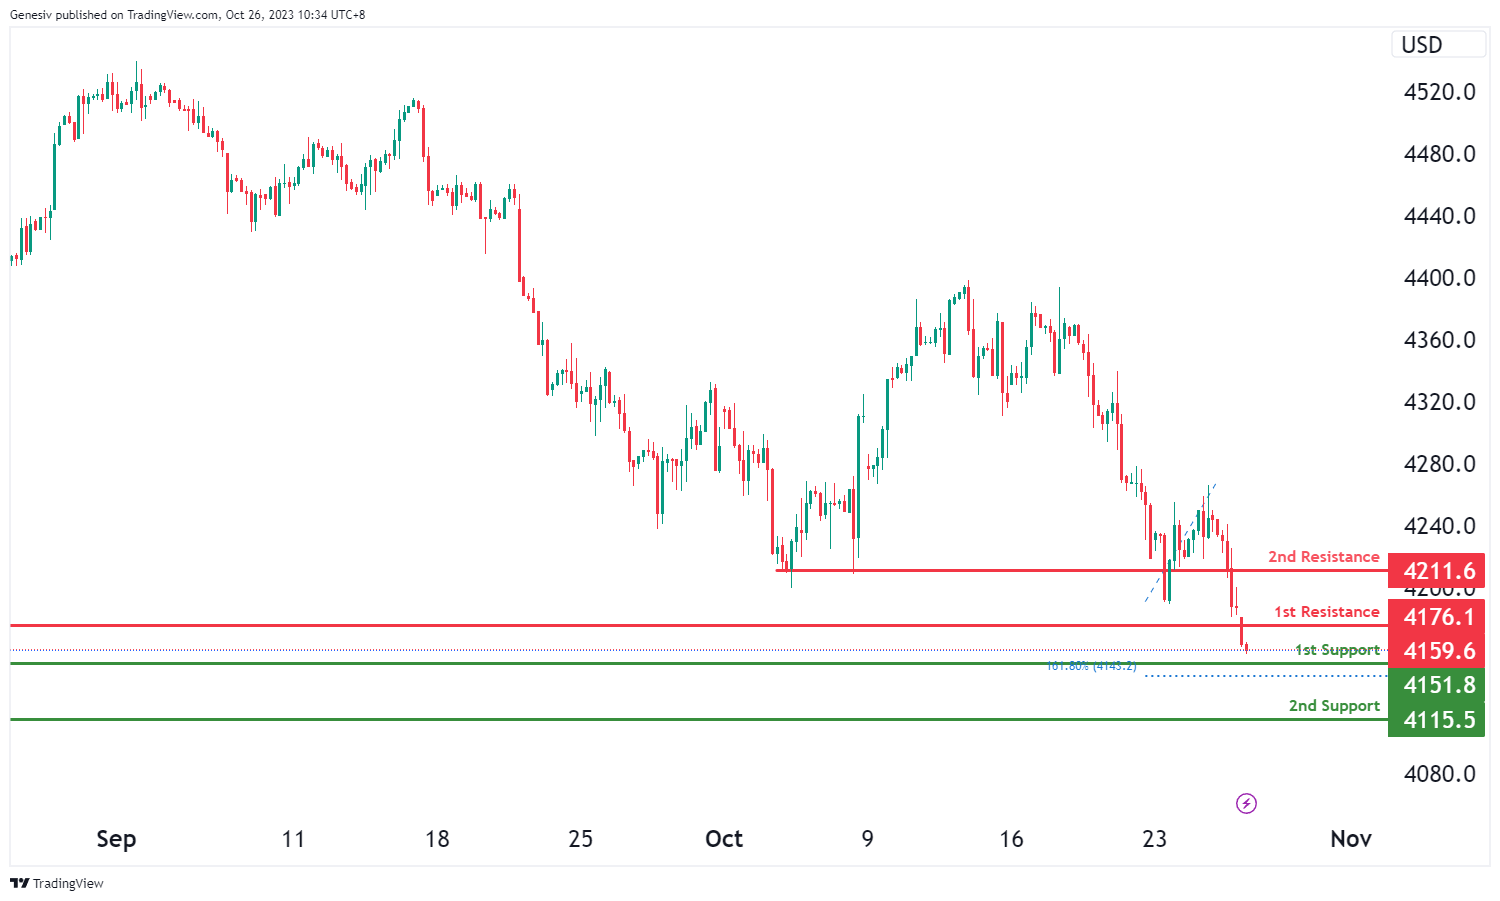
The US500 instrument currently displays a bullish overall momentum on the chart. It’s anticipated that the price may potentially experience a short-term drop to the first support level at 4151.8 before bouncing from there and rising towards the first resistance at 4176.1.
The first support at 4151.8 is considered a strong level due to its pullback support characteristics and the presence of the 161.80% Fibonacci Extension. The second support at 4115.5 is significant because of its swing low support features and the 61.80% Fibonacci Projection.
Conversely, the first resistance at 4176.1 is noteworthy for its pullback resistance. The second resistance at 4211.6 is also significant due to its pullback resistance properties.
BTC/USD:
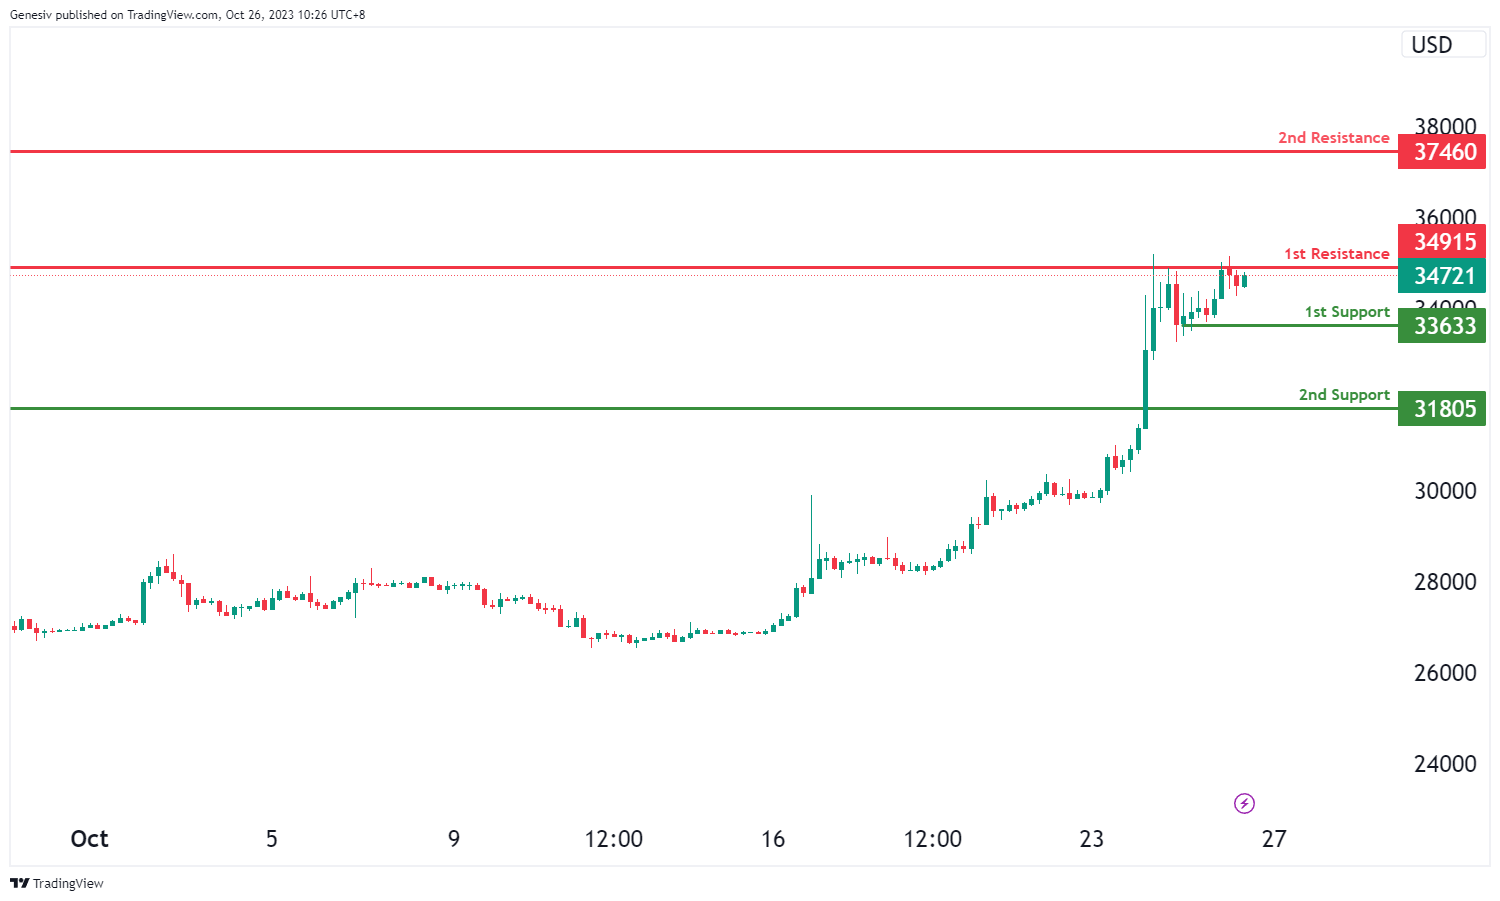
In the analysis of BTC/USD, the overall momentum of the chart indicates a bullish trend.
It is anticipated that the price may continue to move in a bullish direction, potentially heading towards the first resistance level.
The first support level is at 33,633, which is considered significant as it represents a swing low support.
The second support level is at 31,805, and it is also of importance as it denotes a pullback support.
On the resistance side, the first resistance level is at 34,915, which is notable because it marks a pullback resistance.
The second resistance level is at 37,460, and it is significant as well as it represents another pullback resistance level.
ETH/USD:
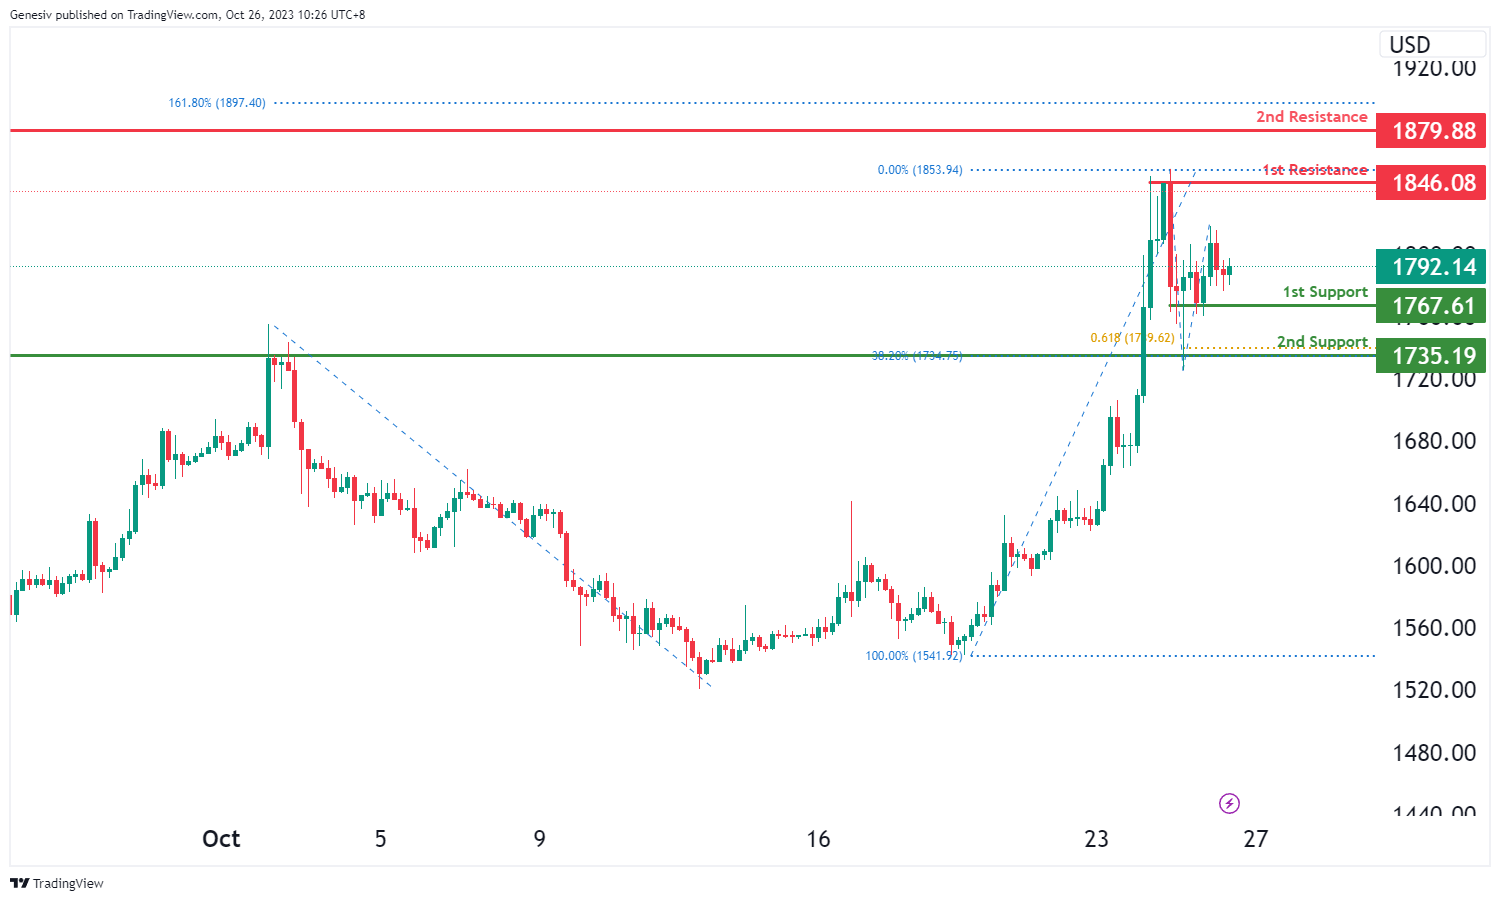
In the analysis of ETH/USD, the overall momentum of the chart indicates a bullish trend.
It is anticipated that the price may continue to move in a bullish direction, potentially heading towards the first resistance level.
The first support level is at 1,767.61, which is considered significant as it represents a multi-swing low support.
The second support level is at 1,735.19, and it is also of importance as it denotes a pullback support, along with confluence from the 38.20% Fibonacci Retracement and the 61.80% Fibonacci Projection.
On the resistance side, the first resistance level is at 1,846.08, which is notable because it marks a multi-swing high resistance.
The second resistance level is at 1,879.88, and it is significant as well as it represents another multi-swing high resistance with the added confluence of the 161.80% Fibonacci Extension. This indicates a potential bullish continuation in the chart.
WTI/USD:
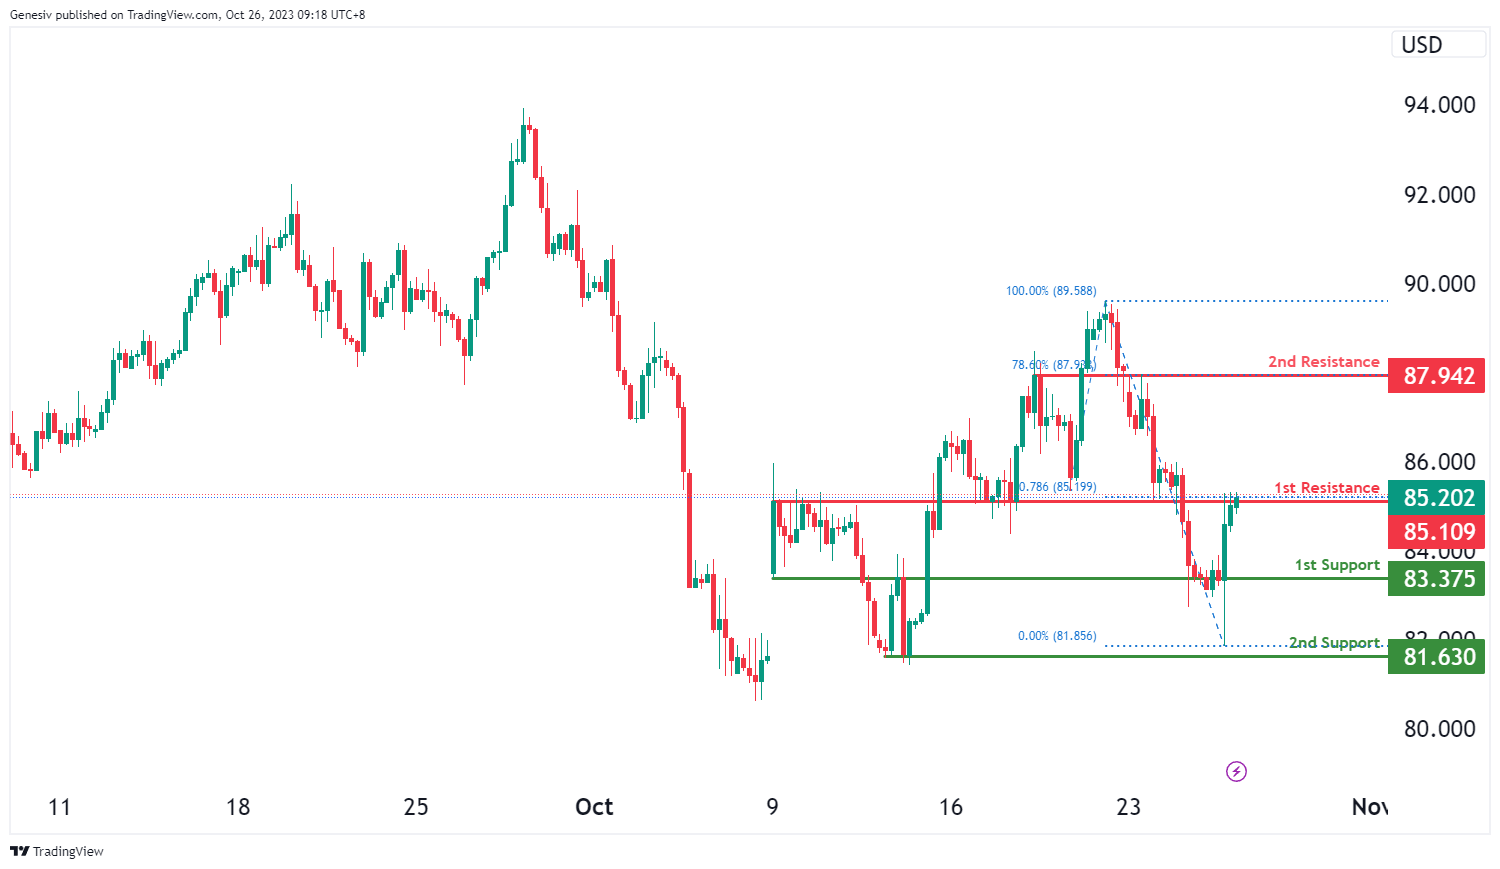
The WTI chart currently exhibits an overall bullish momentum, indicating a potential scenario for price to make a bullish continuation towards the 2nd resistance level should it break above the 1st resistance level.
The 1st resistance level at 85.11 is identified as an overlap resistance that aligns with the 78.60% Fibonacci projection level. Beyond this, the 2nd resistance level at 87.94 is noted as an overlap resistance that aligns with the 78.60% Fibonacci retracement level, making it a potentially strong resistance level.
To the downside, the 1st support level at 83.38 is identified as an overlap support. Further below, the 2nd support level at 81.63 is also marked as a swing-low support, indicating a potential support zone.
XAU/USD (GOLD):
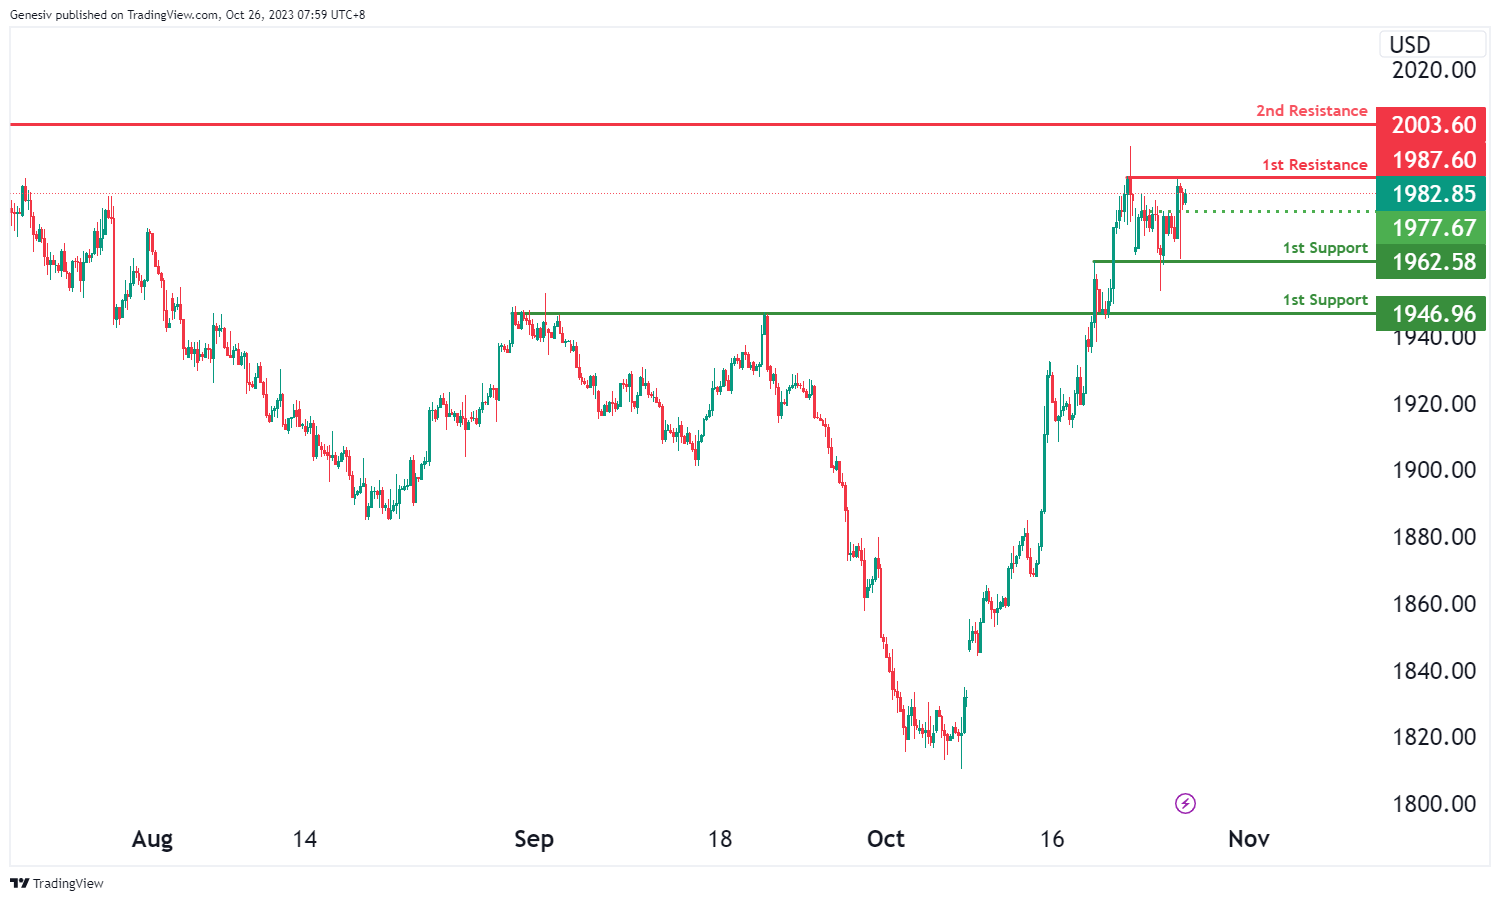
The XAU/USD chart currently exhibits bearish overall momentum, with the potential scenario of a bearish continuation towards the 1st support level.
The 1st support at 1962.58 is considered significant as it aligns with an overlap support level, indicating a potential area of price support. Additionally, the 2nd support at 1946.96 is also identified as an overlap support, further reinforcing the potential for support at this level.
On the resistance side, the 1st resistance at 1987.60 is characterized as a multi-swing high resistance level, suggesting potential resistance significance that price may encounter as it attempts to move higher. Beyond this, the 2nd resistance at 2003.60 is identified as a swing high resistance, which can act as a significant barrier to upward price movement.
An intermediate support level at 1977.67 is also noted as a pullback support, adding another layer of potential support for price action.
Gold Price Could Soon Surpass $2K, US GDP Next
Key Highlights
- Gold prices could extend gains above the $2,000 resistance.
- A connecting bullish trend line is forming with support near $1,968 on the 4-hour chart.
- Crude oil prices trimmed gains and traded below $85.00.
- The US GDP could grow 4.2% in Q3 2023 (Preliminary).
Gold Price Technical Analysis
Gold prices remained in strong demand due to the Israeli–Hamas war. The price rallied above the $1,920 and $1,950 resistance levels.
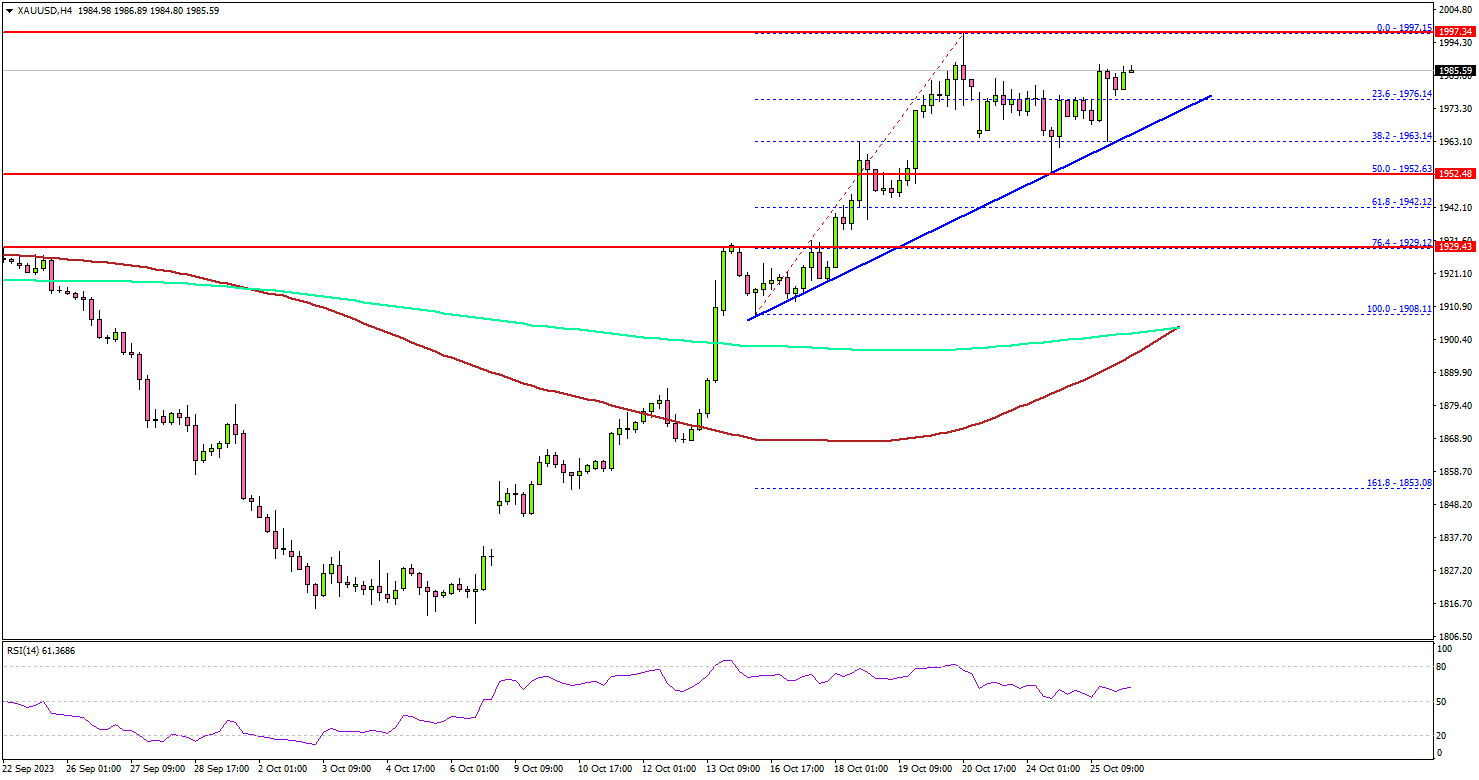
The 4-hour chart of XAU/USD indicates that the price settled above the $1,965 resistance, the 100 Simple Moving Average (red, 4 hours), and the 200 Simple Moving Average (green, 4 hours).
It even spiked toward the $2,000 level before the price started a minor downside correction. The price dipped below the $1,965 level. It tested the 50% Fib retracement level of the upward move from the $1,908 swing low to the $1,997 high.
There is also a connecting bullish trend line forming with support near $1,968 on the same chart. The current price action suggests there are high chances of more upsides above $1,980.
Immediate resistance is near the $1,995 level. The first major resistance is $2,000. An upside break above the $2,000 level could send the price soaring toward the $2,050 resistance. The next major resistance is near the $2,080 level, above which Gold could revisit the key $2,120 resistance zone.
On the downside, the price might find support near the $1,968 level. The next key support is near the gap area at $1,950. If the bulls fail to protect the $1,950 support, there is a risk of a major decline. In the stated case, the price could decline toward the $1,930 level.
Looking at crude oil prices, there was a downside correction and the bears were able to push the price below the $85 level.
Economic Releases to Watch Today
- US Initial Jobless Claims - Forecast 208K, versus 198K previous.
- US Gross Domestic Product for Q3 2023 (Preliminary) – Forecast 4.2% versus previous 2.1%.
ECB to finally pause, EUR/USD looking soft
Today, ECB is broadly anticipated to maintain its main refinancing rate at 4.50% and the deposit rate at 4.00%. Having increased rates consistently during its previous ten meetings to tackle surging inflation, ECB hinted at a pause last month, reflective of the policy's apparent efficacy, as evidenced by deceleration in the Eurozone economy.
President Christine Lagarde, along with other top officials, has been keen to redirect discussions toward the duration for which the interest rates might need to remain at these current restrictive thresholds.
Amid this backdrop, there's also been speculation regarding ECB's potential move for an early reduction in bond holdings within its colossal EUR 1.7T euro Pandemic Emergency Purchase Programme. However, given the prevailing climate of heightened macroeconomic, geopolitical, and financial ambiguities, it's probable that the ECB will resist any hasty decisions to expedite quantitative tightening.
Some previews on ECB:
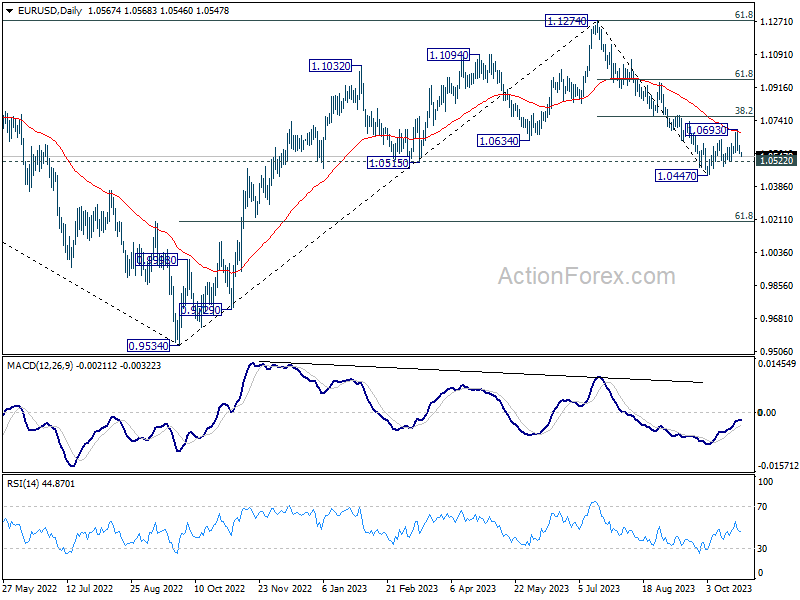
Technically, it's possible that EUR/USD's recovery from 1.0447 has completed at 1.0693, after rejection by 55 D EMA. Immediate focus for today is 1.0522 minor support. Firm break there should strengthen this bearish case. Further break of 1.0447 will resume whole fall from 1.1274, and target 61.8% retracement of 0.9534 to 1.1274 at 1.0199 next.
As USD/JPY breaks 150, Japan faces intervention and YCC decision
In a significant move, USD/JPY surpasses the key psychological level of 150 today, marking its highest point in a year. This uptick has reignited concerns among investors regarding market interventions by Japan, given that the 150 mark is widely regarded as a trigger point for such actions.
Japanese finance minister Shunichi Suzuki addressed the market developments, reiterating, "I'm watching market moves with a sense of urgency, as before." Notably, despite the heightened speculation, he refrained from commenting on any immediate intervention measures. This silence has led to further ambiguity, especially considering the suspected actions by Japan on October 3 to buy Yen, actions that have yet to be officially confirmed.
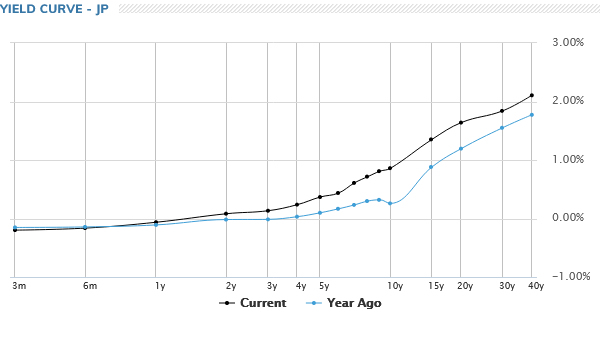
A primary reason for the sustained pressure on Yen can be attributed to increasing yield gap between Japan and other major economies. This disparity intensifies the debate on the necessity for BoJ to revise its yield curve control, especially in light of rising global interest rates. There are rumblings about a possible adjustment to the 10-year yield cap, even though it was adjusted only three months prior, especially with a policy meeting on the horizon.
Nevertheless, BoJ has consistently asserted that previous adjustments to the yield curve control were primarily to rectify any irregularities in the bond market's operations. The current yield curve appears more natural, especially when contrasted against the noticeable dip in 10-year yield in the curve from a year ago. It remains uncertain whether BoJ feels the immediacy to modify its YCC in the near term.
RBA’s Bullock undecided on rate hike following CPI surprise
In the Senate Economics Committee session today, RBA Governor Michele Bullock indicated that the bank was not entirely caught off guard by the stronger than expected CPI data released yesterday. She refrained from offering a definitive direction for the bank's next steps
The Q3 and September CPI data, which Bullock admitted "came out a little higher" than the projections in the August Statement on Monetary Policy, still aligned with the bank's expectations. She clarified, "The numbers were pretty much where we thought it would come out".
When queried on the prospect of another rate hike in the forthcoming meeting, Bullock responded, "We're still analyzing the numbers at the moment. I wouldn't like to say more or less likely, we're still looking at it."
Bullock reiterated the bank's position, stating, "We've always said we have a low tolerance" on inflation surprises. She added, "We are wary and we don't know if the job has been done yet."
Looking forward, Bullock hinted at imminent changes to their economic projections, announcing, "We will be releasing a new set of forecasts after the board meeting." Moreover, she alluded to the significance of these revisions by stating, "There is going to be a change to our forecasts. We have to look at whether or not it's material enough to change our views on monetary policy."
We Have Seen Enough for RBA’s Next Move to be an Increase
Last week we noted that the RBA would leave rates unchanged so long as they saw inflation coming down as they had expected. But if the data flow showed inflation declining slower than that, they would raise rates. This message was reinforced in the Governor's first speech, on Tuesday, where she said "The Board will not hesitate to raise the cash rate further if there is a material upward revision to the outlook for inflation." The September quarter CPI release was always going to be crucial.
Has the RBA seen enough to move? At 1.2% in the quarter, both headline and trimmed mean inflation was a little higher than the Westpac team expected (see Westpac Senior Economist Justin Smirk's note). We assessed that it would take a significant upside surprise to induce the RBA Board to raise rates at the November meeting. A 0.1% difference might not seem like a lot, but the underlying detail was sobering.
So yes, I've seen enough to make my first-ever rate call to be a prediction of a hike.
In August, the RBA expected that the trimmed mean rate of inflation would reach 3.9% over 2023. That seems a long way out of reach now: the December quarterly result would have to print at 0.5% for this to happen. The higher result also cannot be attributed solely to volatile components that will reverse out soon. Fuel inflation was stronger in the quarter, but so were vehicle price inflation, homebuilding cost inflation and inflation in a range of services components such as meals out and takeaway, dental fees and transport fares. Recreational services more broadly were also strong. And a significant fraction of the index saw quarterly changes moderating by less than expected.
Looking at some of the risks we called out last week, it is noteworthy that some traded goods prices are still holding up, even as similar prices decline in other economies; see the graph in Justin Smirk's inflation note for more detail. The cumulative difference in price movements is too large to explain as an exchange rate effect. A sequence of above average inflation outcomes is also evident in the related services series, which includes things like streaming services. Along with strong services inflation more broadly, these outcomes suggest that domestic demand pressures are still driving domestic inflation, even though consumer spending growth more broadly is very weak. Strong population growth is a factor here, and recent arrivals data suggest it will remain so.
Another risk that will remain front of the Board's mind is that housing prices continue to rise. Related to this, the material in the Financial Stability Review and the Governor's speech this week highlighted that the household sector has been resilient to the tightening in monetary policy so far. So although the household sector is currently facing a squeeze on real incomes, and household spending is weak, the Board could conclude that the risk that domestic demand remains stronger than expected has increased. The recent resurgence in US retail sales is a salutary example of what can happen, though it should be emphasised that the US consumer sector is in a very different position to Australia's.
That said, we do not think that a decision to increase rates at the November meeting is entirely clear cut. There is an argument that bygones are bygones, and the upside surprise on the September quarter data will not carry through to subsequent quarters. If the RBA did not want to raise rates this month, it could upgrade its 2023 forecast for inflation but not the forecast for 2024 and beyond. It could then argue that there had been no material upward revision to the outlook for inflation, only to the history.
As an aside, we do not take any signal from the Governor's parliamentary testimony this morning on the interpretation of the CPI data. Having spelled out so clearly that a material surprise to the outlook would warrant a rate increase, she simply had to be equivocal to avoid front-running the Board's decision, which is still more than a week away.
The Board could point to the reduced risk of a price-wage spiral and the turning in the labour market as evidence in support of a decision to keep rates on hold. The Board might also want to reference the current uncertainty generated by the conflict in the Middle East and the tightening in global financial conditions. Some of the near-term strength in services inflation could be a passing through of award wage increases that probably won't be repeated, as well as non-standard timing of increases in health insurance. Business services have been showing cost pressures easing, and growth in the real economy is relatively weak.
But this seems like a hard case to make. It is going to be a finely balanced decision and a decision to hold still can't be ruled out entirely. An increase this month won't be the outcome the RBA had hoped for. But given the strength of their rhetoric around upside surprises, I don't think they will try to craft a rates-on-hold story. Nor will they wait until the following month. There is not enough in the way of new data between the November and December meetings, and waiting would be inconsistent with the clear language from the Governor's speech this week about not hesitating if the outlook changes.
GBPUSD Wave Analysis
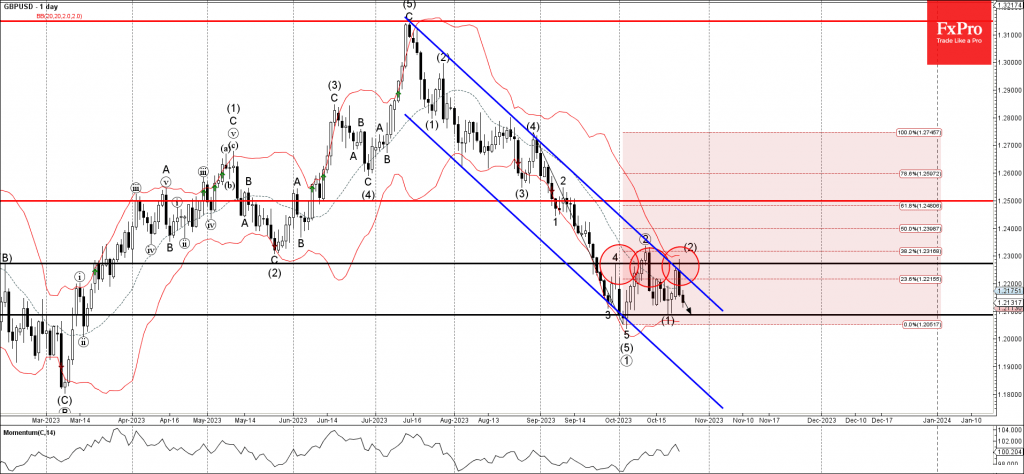
- GBPUSD reversed from resistance level 1.2270
- Likely to fall to support level 1.2085
GBPUSD earlier reversed down with the Piercing Line candlesticks pattern from the key resistance level 1.2270 (which also stopped the previous waves 4 and 2).
The resistance level 1.2270 was strengthened by the upper daily Bollinger Band, 38.2% Fibonacci correction of the previous downward impulse from August and the resistance trendline of the daily down channel from July.
Given the moderate USD bullishness, GBPUSD can be expected to fall further toward the next support level 1.2085 (low of the previous waves (5) and (1)).
EURUSD Wave Analysis
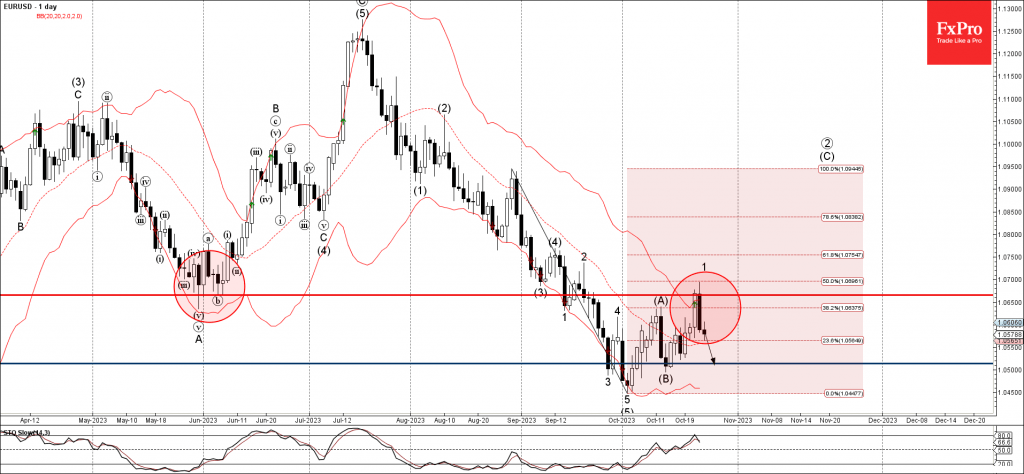
- EURUSD reversed from resistance level 1.0665
- Likely to fall to support level 1.0515
EURUSD currency pair recently reversed down with the Bearish Engulfing from the key resistance level 1.0665 (former strong support from May and June) intersecting with the upper daily Bollinger Band.
The resistance level 1.0665 was strengthened by the 50% Fibonacci correction of the previous downward impulse from August.
Given the clear daily downtrend, EURUSD can be expected to fall further toward the next support level 1.0515 (low of the previous wave (B)).
Canada: Sluggish Growth, Slowing Inflation, Softer Currency
Summary
- Incoming data continues to point to increasing challenges and slower growth for the Canadian economy ahead. Past monetary tightening has led to a significant rise in the household debt servicing burden, while forward-looking surveys point to a softening business outlook. Amid this backdrop, we have lowered our Canadian GDP growth forecasts for 1.1% for 2023 and 0.7% for 2024.
- Although Canada's September CPI surprised to the downside, inflation remains elevated for now and continues to move only gradually in a more favorable direction.
- The Bank of Canada (BoC) held its policy rate at 5.00% at its October announcement, and maintained a moderate tightening bias. However, we believe the BoC's interest rate pause will be an interest rate peak. Given we forecast slower growth and inflation than the central bank, we expect policy rate to hold steady for an extended period, before rate cuts begin in Q2-2024.
- As Canadian growth remains subdued and in the absence of further BoC tightening, we also see potential for further Canadian dollar weakness over the next several months.
Canadian Growth Challenges Accumulating
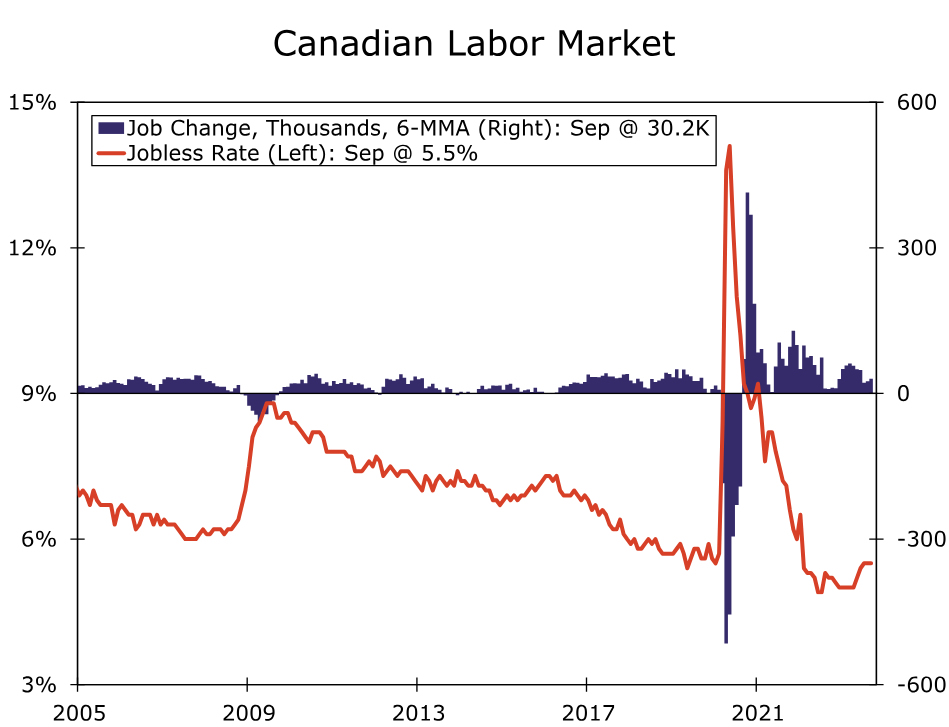
While Canada's economy has shown pockets of strength in recent months, incoming data continues to point to increasing challenges and slower growth for the Canadian economy ahead. The main bright spot for Canada has been the labor market, which added a combined 103,700 jobs in July and August, while hourly wage growth for permanent employees remains elevated at 5.3% year-over-year. Even so, the employment gains are perhaps not as strong as they might appear at first glance. A 48,000 gain in full-time jobs accounted for less than half of the increase, whereas for the outstanding level of employment, full-time jobs make up 82% of total employment. Moreover, the July-August period saw a decline in private sector employees, with the jobs increase instead driven by a rise in public sector employees and self-employment. Other areas of the economy are noticeably less robust. Despite the employment gains, higher interest rates and cost-of-living issues appear to be contributing to consumer caution, with real retail sales having declined for three months in a row through August. More broadly, Canada's Q2 GDP growth contracted at a 0.2% quarter-over-quarter annualized rate and, based on available data for July and preliminary data for August, is at best on track for only very modest positive growth in Q3.
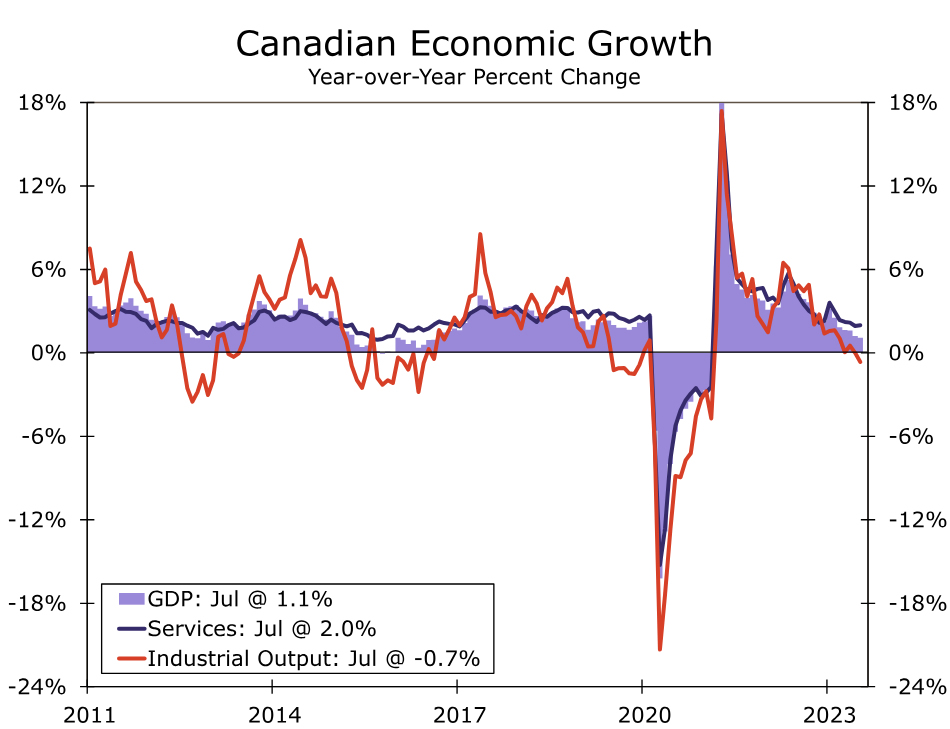
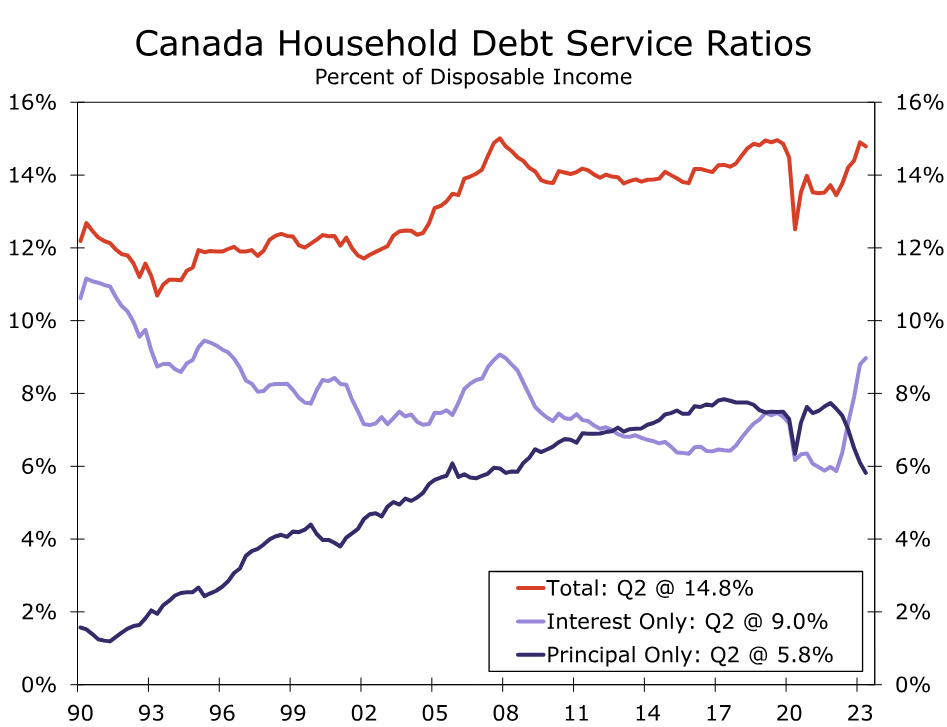
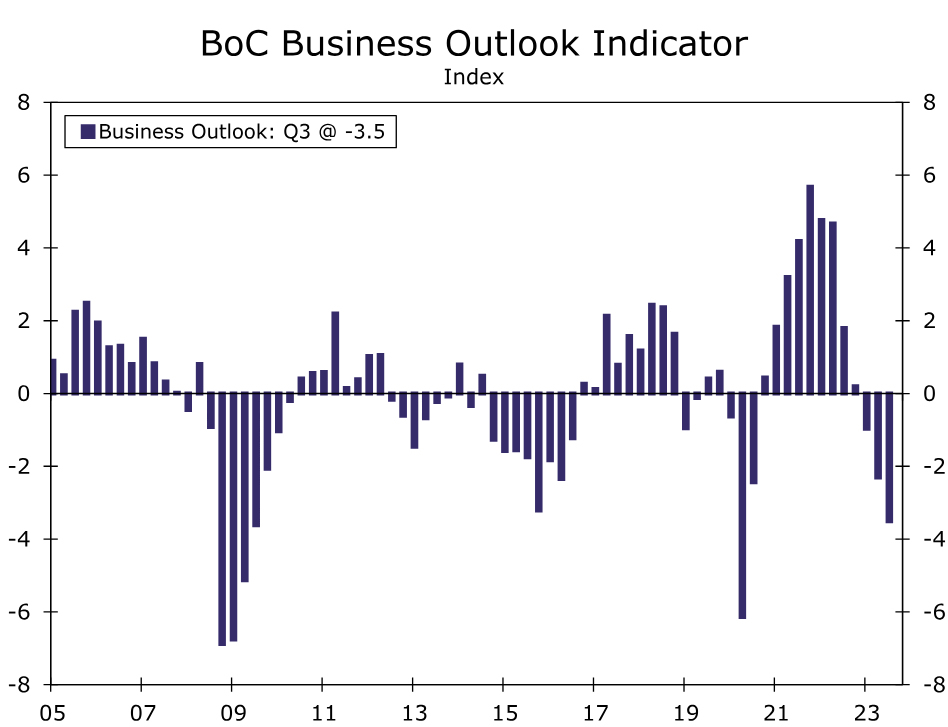
Moreover, economic fundamentals and forward-looking indicators do not point to an improvement in Canada's growth prospects any time soon. From a consumer perspective, the outlook is mixed. Growth in real household disposable income has returned to positive territory and the household saving rate of 5.1% remains slightly above pre-pandemic levels. However, the Bank of Canada's monetary tightening has led to a rising interest and debt servicing burden for Canadian households. In Q2, interest costs were 9.0% of disposable income, while total debt servicing costs (that is, principal and interest) were 14.8% of disposable income. Those metrics are elevated by historical standards, and suggest continued consumer restraint going forward. The outlook for businesses is similarly subdued. Declining corporate profit growth has led to a drop in business fixed investment through mid-2023, and the central bank's Q3 Business Outlook Survey suggests the outlook may have worsened further since. The Bank of Canada's (BoC) Business Outlook Indicator fell further to -3.5, the weakest reading since the depths of the pandemic. In addition, the Indicators of Future Sales balance, which takes into account factors such as order books, advance bookings, sales inquiries and so on, fell to zero in Q3, also the weakest reading since Q3-2020. Finally, more than half of firms surveyed by the BoC believe that the effects of past monetary tightening on their businesses are far from over. To the extent that more cautious businesses scale back hiring plans, that could add to headwinds for Canadian households and consumers. Against this backdrop we have pared our growth forecast for Canada, and now anticipate GDP growth of 1.1% in 2023 (previously 1.2%) and 0.7% in 2024 (previously 1.0%).
Canadian Inflation: High, But Heading In The Right Direction
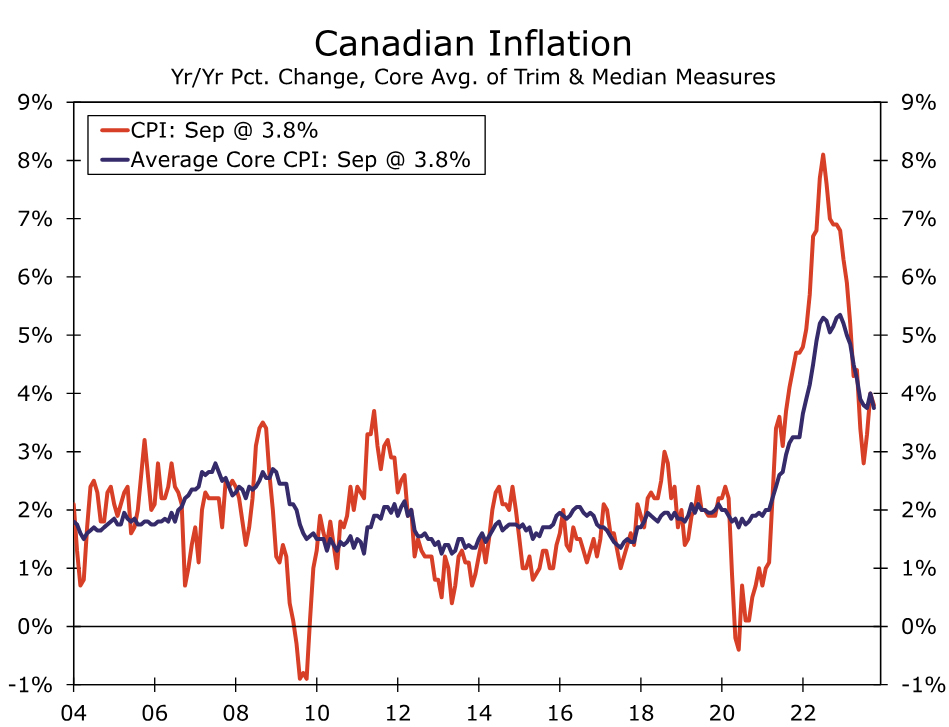
While recent news on Canadian growth has been disappointing, news on the inflation front has been slightly more hopeful. The message from actual inflation data as well as forward-looking indicators are the same—inflation remains too high for now, but is gradually heading in the right direction. With respect to the September CPI, both headline and core inflation surprised to the downside. The headline CPI slowed to 3.8% year-over-year, while the average core CPI similarly eased to 3.8% year-over-year. Importantly, the average core CPI rose at a 3.67% three-month annualized pace through September. That is less than the increase seen in August, even if the recent trend of underlying inflation remains above the central bank's 2% target and the underlying pace of disinflation remains frustratingly slow.
Survey data also point to elevated inflation trends that are nonetheless moving in a more favorable direction. The BoC's Business Outlook Survey showed more firms expecting slower input and output price inflation over the next 12 months. For example, the net balance for input price inflation fell to -63 in Q3 from -53 in Q2 (that is, more respondents seeing slower input price inflation), while the net balance for output price inflation fell to -43 in Q3 from -33 in Q2 (more seeing slower output price inflation). In terms of firms' CPI inflation expectations over the next two years, 53% saw inflation above 3% during that period, still high but less than the 64% in Q2 and 79% in Q1. Finally, in a separate survey of consumers during Q3, one-year ahead and two-year ahead inflation expectations were still elevated at 5.03% and 4.04% respectively. Nonetheless, that same survey said consumers who expect more adverse effects from rate hikes are less likely to plan major purchases such as cars or appliances, and more likely to spend on discretionary items like vacations and concerts—a hint perhaps that higher interest rates are having some impact on consumer expectations.
Bank of Canada's Interest Rate Pause Will Be An Interest Rate Peak
Against this backdrop of slowing growth and gradually slowing inflation, the Bank of Canada once again held its policy interest rate steady at 5.00% at its October monetary policy announcement. In its accompanying statement, the BoC acknowledged softer economic activity, saying:
- There is growing evidence that past interest rate increases are dampening economic activity and relieving price pressures.
- Consumption has been subdued, and weaker demand and higher borrowing costs are weighing on business investment.
- A range of indicators suggest that supply and demand in the economy are now approaching balance.
- Economic growth is expected to be weak for the next year before increasing in late 2024 and through 2025.
The softer outlook is also reflected in the central bank's updated projections, which forecast GDP growth of 1.2% in 2023 (compared to 1.8% in July) and 0.9% in 2024 (compared to 1.2% in July).
At the same time, the BOC kept the option of further tightening on the table, saying it is “prepared to raise the policy rate further if needed.” The central bank clearly remains somewhat wary about the inflation outlook, saying it “is concerned that progress towards price stability is slow and inflationary risks have increased.” Those inflation concerns are also reflected in the BoC's updated inflation forecasts, which see CPI inflation at 3.0% for 2024 (previously 2.5%) and 2.2% for 2025 (previously 2.1%).
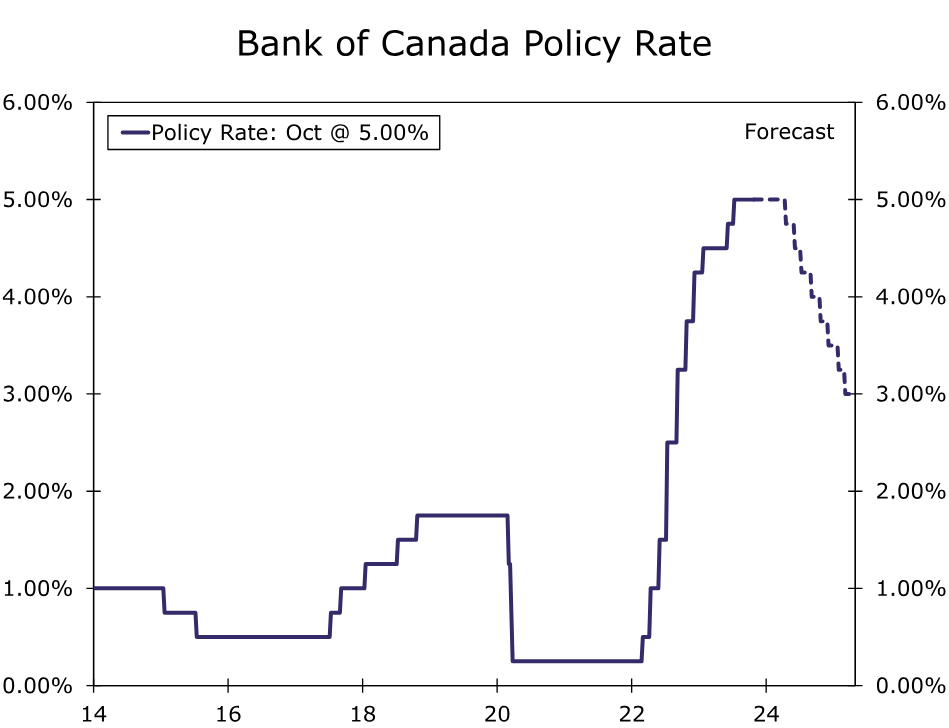
Although BoC maintained a moderate rate hike bias, we continue to believe that further tightening remains a possibility rather than a probability. We expect Canadian economic growth to slow more quickly than the central bank's forecast, and as a result, we see slightly slower CPI inflation next year than does the central bank. We believe the Bank of Canada will hold its policy rate steady at 5.00% for an extended period. That said, as growth remains subdued and underlying inflation measures move a bit closer to the central bank's 2% target, we still forecast Bank of Canada rate cuts beginning in Q2-2024, and a cumulative 150 bps of easing to 3.50% by the end of next year. As Canadian growth remains subdued and in the absence of further BoC tightening, we also see potential for further Canadian dollar weakness. The USD/CAD exchange rate has already reached our medium-term target of CAD1.3700, but a further move closer to CAD1.4000 over the next several months cannot be ruled out. We will provide a full assessment and updated currency forecasts in our International Economic Outlook, due for publication later this week.