

Sample Category Title
Tokyo Inflation Report to Set the Scene for Next Week’s BoJ Meeting
- Tokyo inflation details will be released on Thursday 23.30 GMT
- Market prepares for the next BoJ gathering as geopolitics affect sentiment
- A strong set of data could offer some short-term respite to the yen
Market prepares for the next BoJ meeting
With only a few days left until the next Bank of Japan meeting, the market is trying to evaluate the impact of geopolitical developments. An escalation in the Middle East would most likely unsettle global markets and cause another rally in oil and gas prices, similar to the 2022 episode that fueled the elevated inflation rates.
To be fair, the BoJ might not strongly complain about another inflation surge, provided it does not hamper Japan’s growth outlook. This looks quite difficult to achieve considering the amount of oil imported annually and the associated cost. However, an inflation jump would most likely result in stronger wage increases going forward, like the ones agreed during the 2023 negotiation round; this is key for most BoJ members in order to finally support the gradual reduction of the current accommodation provided by the BoJ.
Rumours for another YCC tweak
There have been rumours lately that the BoJ is considering another tweak in its yield curve control (YCC) programme. The Japanese 10-year yield is trading around 0.85%, the highest level since the distant 2013, mostly due to the upside pressure from surging US yields. While there does not appear to be strong support for such a YCC change, a tweak announcement could be used as a signal that the BoJ is aiming for a tighter monetary policy stance.
Wages are critical but the Tokyo inflation release is coming up next
Until the 2024 wages discussion gets underway, the BoJ members will have to be content with the inflation reports and earnings prints. The latest figures for the latter, in the form of the labour cash earnings, have not been exciting so the burden falls on inflation data for some positive news for the BoJ. In this context, the Tokyo print for October will be pushed on Thursday evening (23.30 GMT).
Tokyo’s headline CPI has dipped below the 3% threshold over the past two months with the national headline figure mimicking this move. More importantly, the core CPI indicator – excluding food and energy – remains elevated, pleasing certain BoJ members. Looking ahead to Thursday’s release, a small pickup in inflation rates, on the back of higher oil prices feeding through the system over the past month, would make sense.
Yen at multi-year highs across the board
It has been a brutal year for yen bulls as the underperformance against the key global currencies has reached double digits. However, there have been some muted signs of life from the yen lately, for example the pound-yen pair. This is mostly the result of intervention threats, but the divergent rhetoric of the two respective central banks has probably been a factor as well.
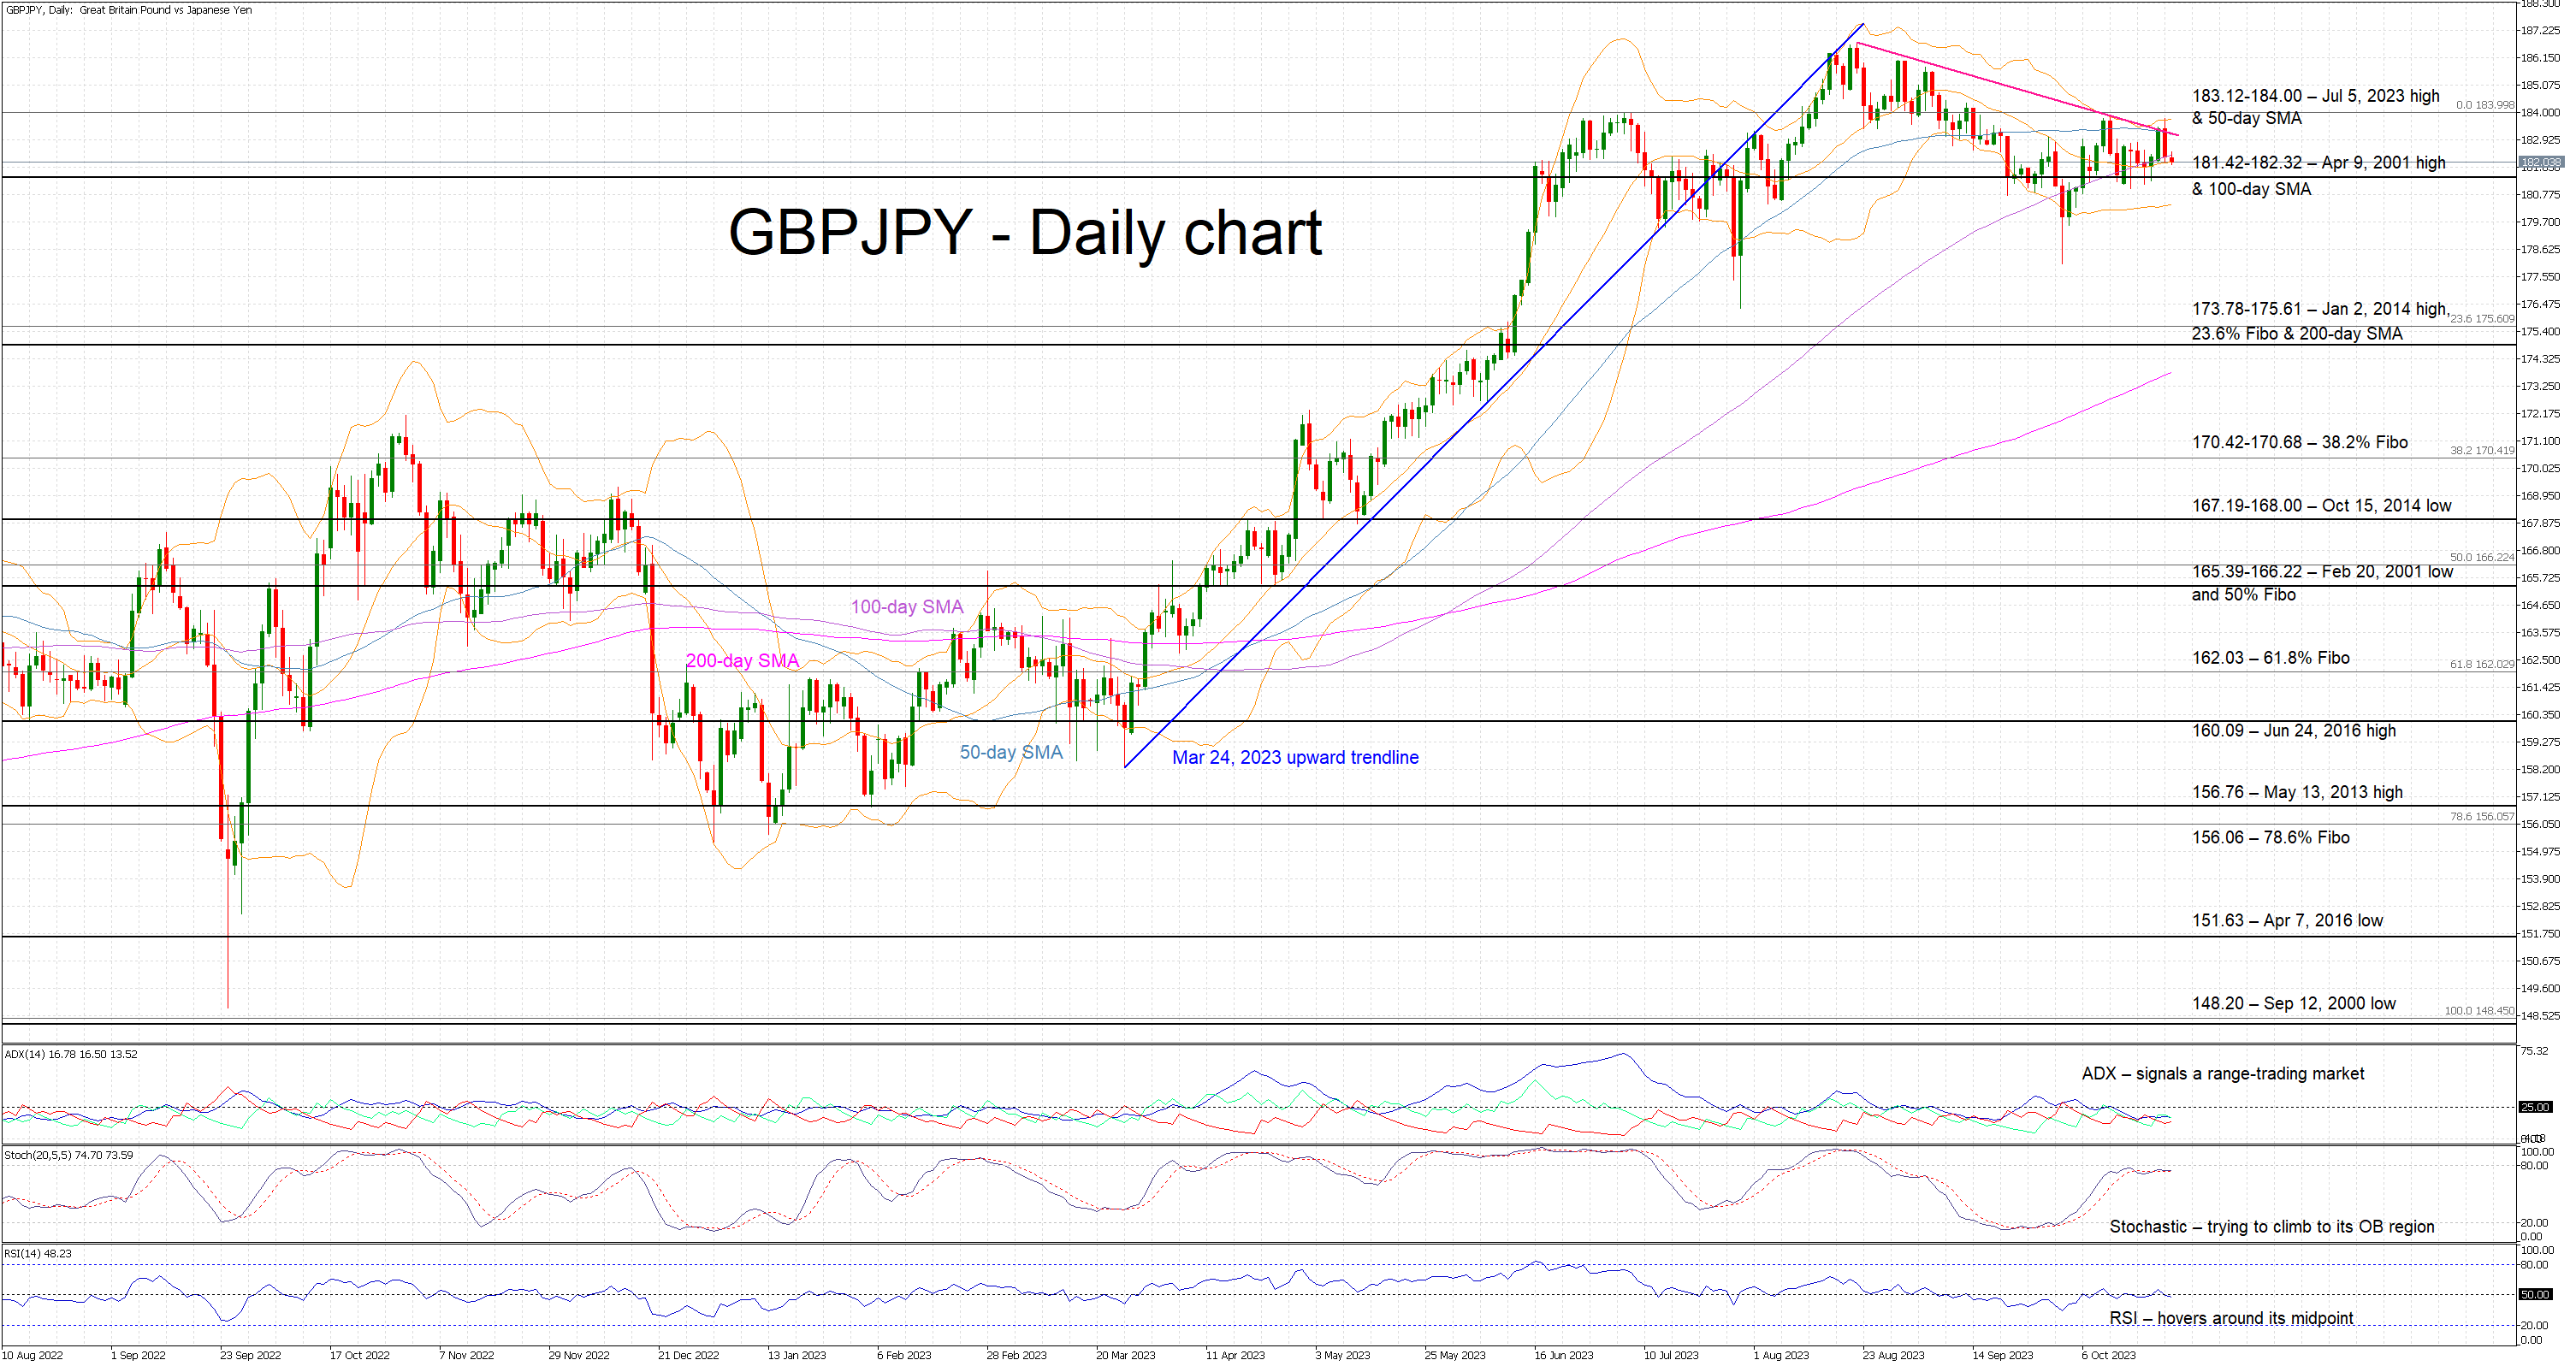
Having said that, an upside surprise in Thursday’s data could result in a small downleg below the 181.42-182.32 area, but this move would most likely prove to be short-lived. On the flip side, a weak inflation report would cause a smaller market reaction higher as the intervention threat remains at large.
USDCAD Has Another Round of Fighting Ahead
- USDCAD jumps above 1.3700 ahead of BoC rate decision
- Will the pair breach the neutral triangle pattern too?
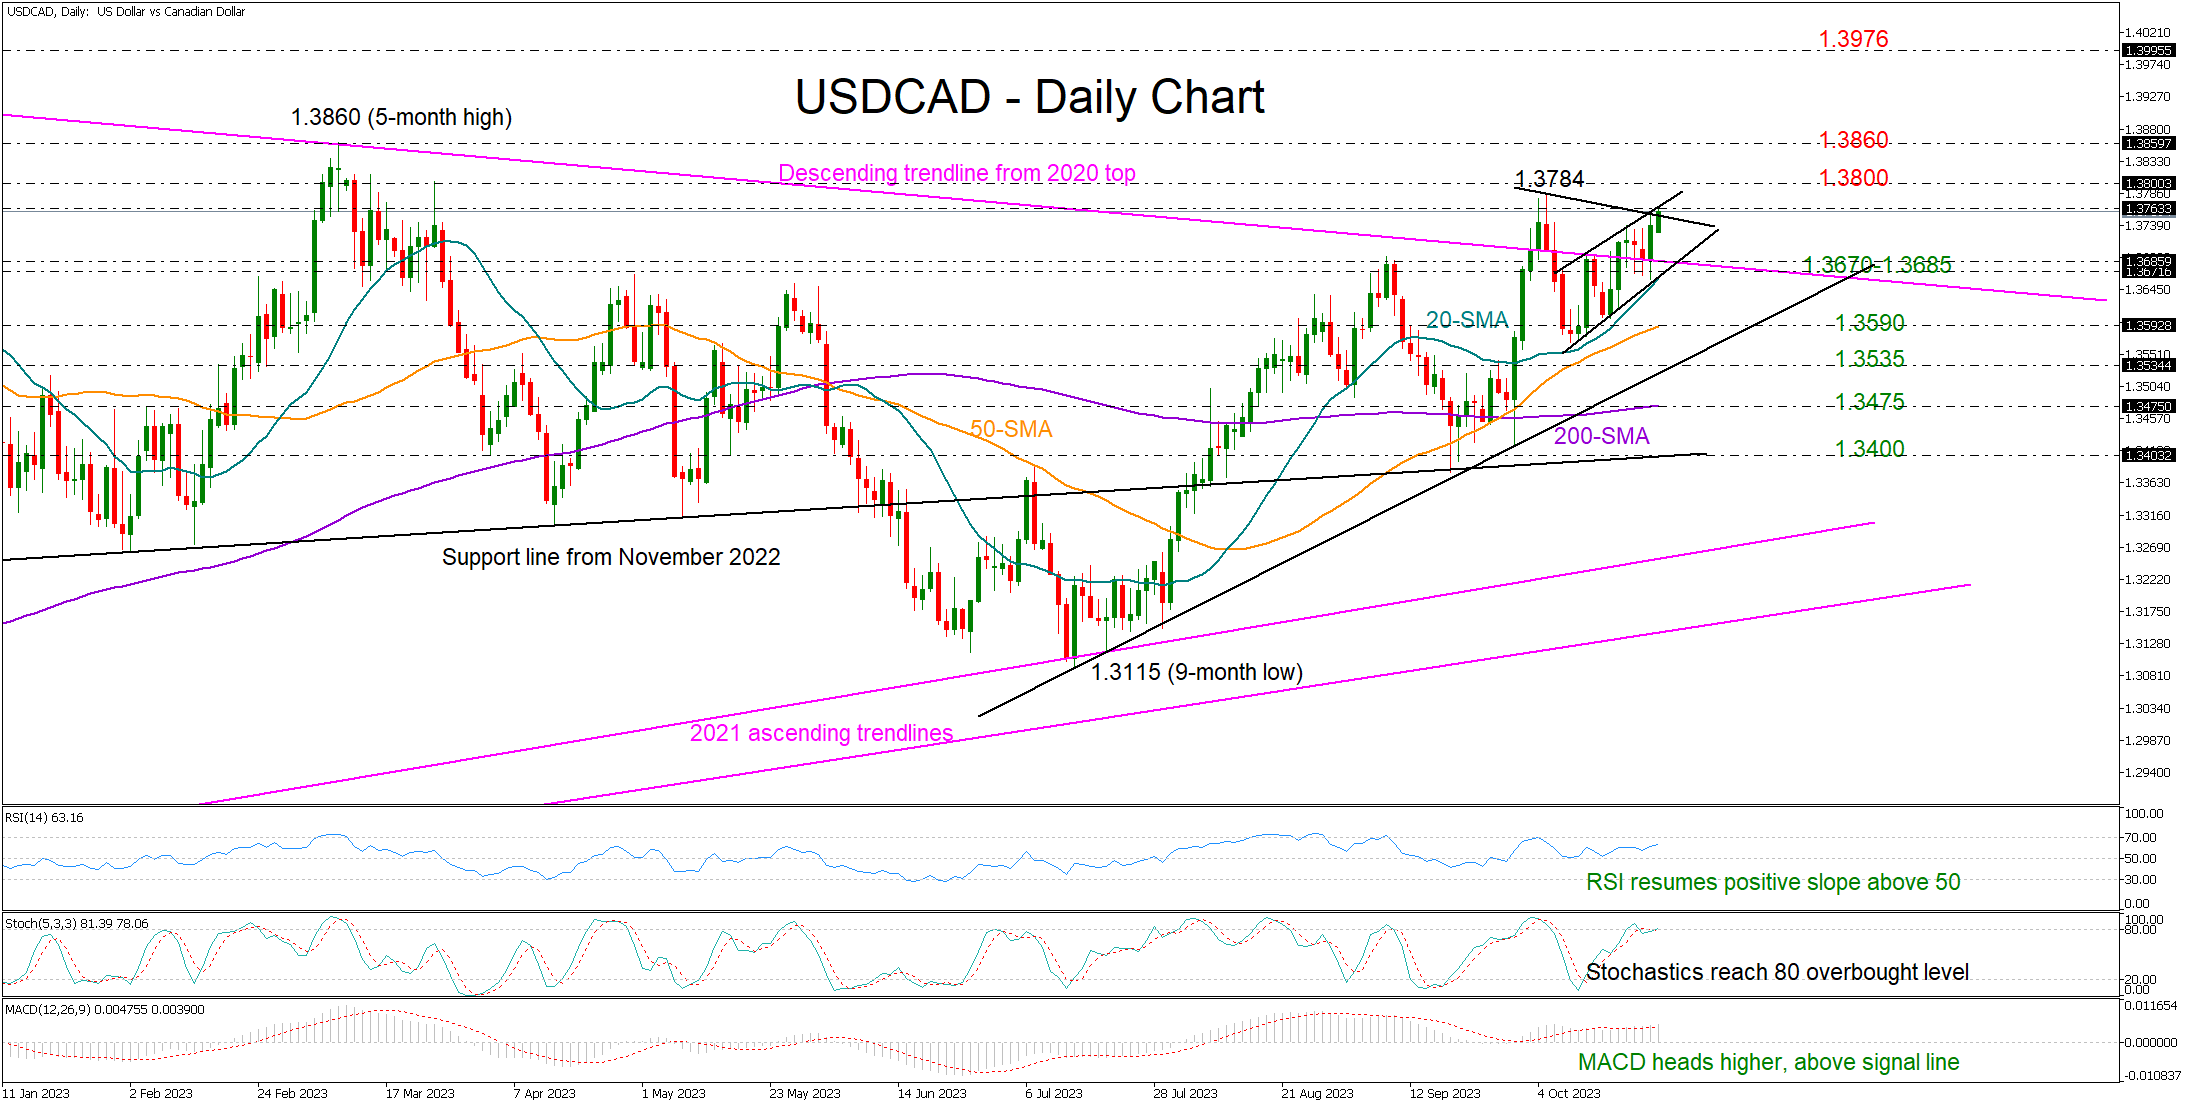
USDCAD held its footing above the resistance-turned-support trendline drawn from the 2020 peak and bounced back into the 1.3700 area on Tuesday.
The latest bullish action shifted the attention back to the 1.3800-1.3860 region ahead of the Bank of Canada’s policy meeting, with the technical indicators promoting further progress in the market. The RSI has resumed its positive slope above 50 and the MACD is heading higher above its red signal line.
Conversely, the stochastic oscillator is staying close to its 80 overbought level, implying that the bulls are lacking the strength to push upwards. Also, the price itself has yet to close above the resistance line of a symmetrical triangle at 1.3750, making a pullback likely.
Should the pair accelerate above 1.3860, the next destination could be the 2022 top of 1.3976.
On the downside, the 1.3670-1.3685 zone, which encapsulates the 2020 constraining line and the 20-day simple moving average (SMA) could come first into view. A close below this range could confirm more losses towards the 50-day SMA, while a sharper decline could challenge the short-term ascending trendline from July at 1.3535 and the 200-day SMA.
In summary, USDCAD has the potential for more upside, but unless it successfully violates the neutral triangle structure, the bulls could face some more delays.
German Ifo business climate rose to 86.9, seeing a silver lining
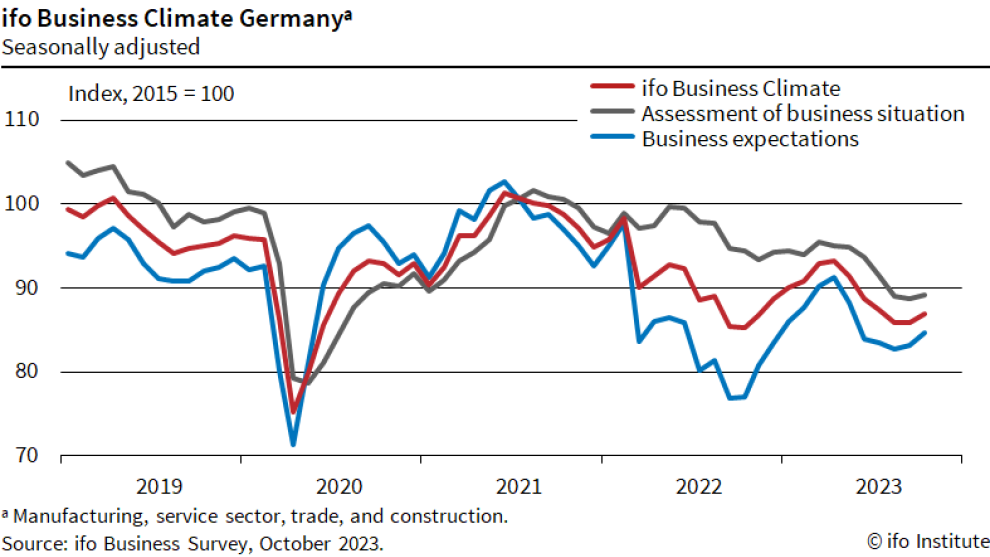
German Ifo Business Climate rose from 85.8 to 86.9 in October. Current Assessment Index rose from 88.7 to 89.2. Expectations Index rose from 83.1 to 84.7.
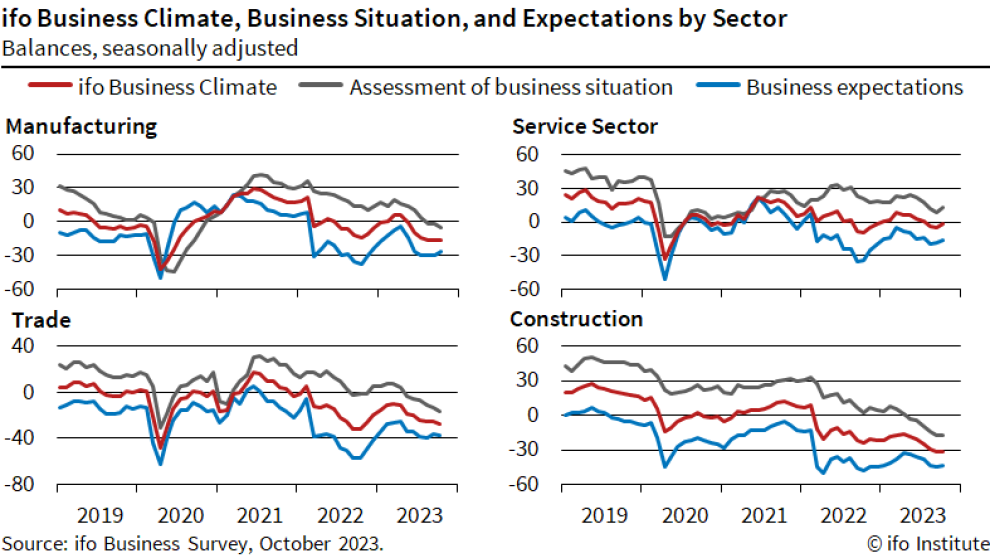
By sector, manufacturing rose from -16.2 to -15.9. Services rose from -4.9 to -1.5. Trade dropped from -25.0 to 27.2. Construction ticked up from -31.2 to -31.1.
Ifo said: "Managers were less pessimistic in their view of the coming months. Germany's economy can see a silver lining ahead."
EUR/AUD Daily Outlook
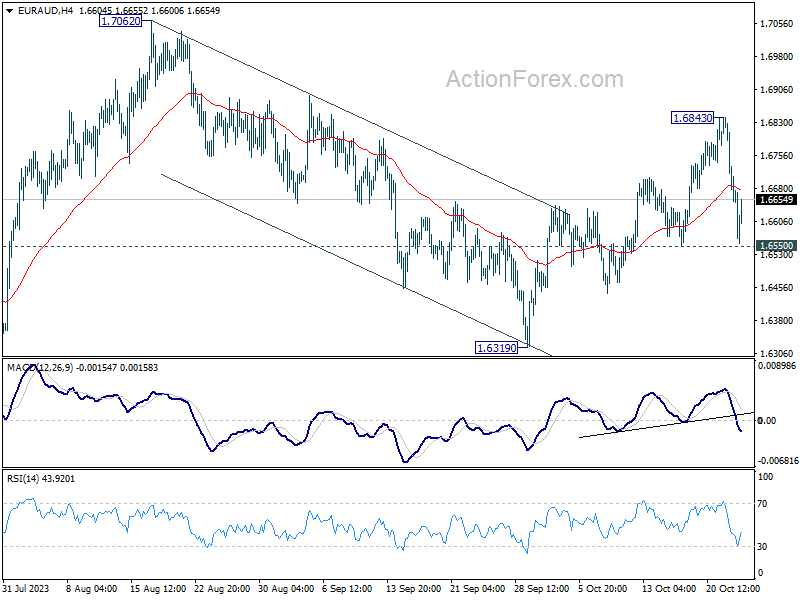
Daily Pivots: (S1) 1.6595; (P) 1.6721; (R1) 1.6791; More...
Near term outlook is mixed up by the steep pull back from 1.6843. Intraday bias is turned neutral first. On the upside, above 1.6843 will resume the rebound from 1.6319. Firm break there will resume larger up trend. However, break of 1.6550 support will bring deeper fall back to 1.6319 support instead.
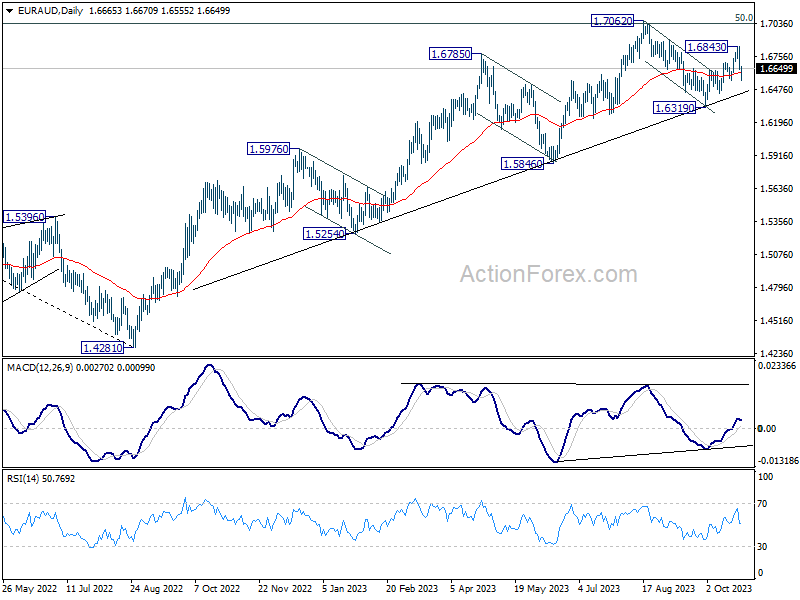
In the bigger picture, the strong support from medium term rising trend line indicates that rise from 1.4281 (2022 low) is still in progress. Sustained break of 1.7062 will pave the way to 61.8% retracement of 1.9799 (2020 high) to 1.4281 at 1.7691. In any case, outlook will stay bullish as long as 1.6319 support holds.
EUR/GBP Daily Outlook
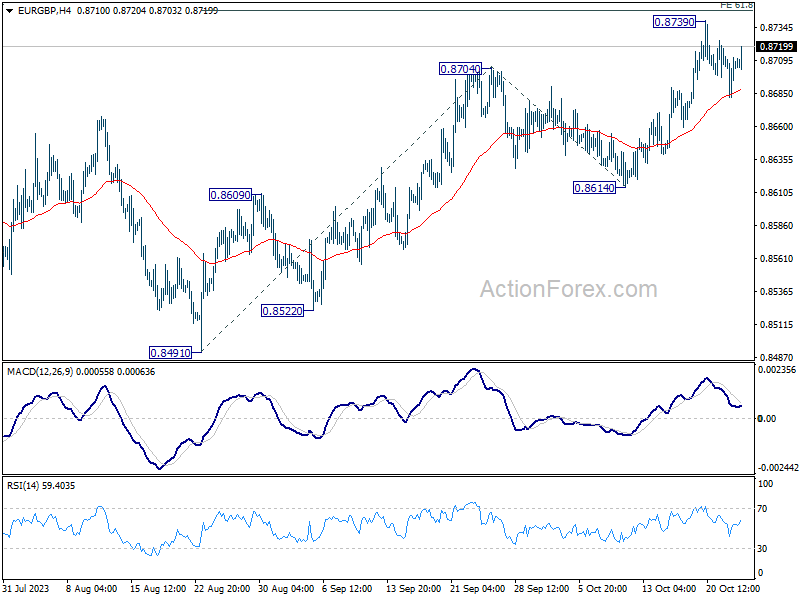
Daily Pivots: (S1) 0.8688; (P) 0.8704; (R1) 0.8726; More....
Intraday bias in EUR/GBP remains neutral as consolidation from 0.8739 is still extending. Downside of retreat should be contained well above 0.8614 support to bring another rally. Firm break of 0.8746 will target 100% projection of 0.8491 to 0.8704 from 0.8614 at 0.8827 next.
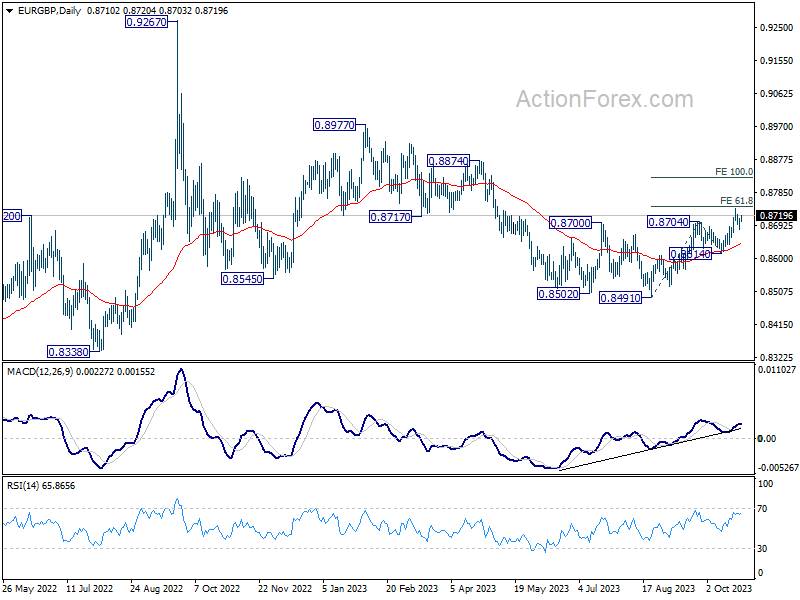
In the bigger picture, current development suggests that whole down trend from 0.9267 (2022 high) has completed with three down to to 0.8491. Rise from 0.8491 is seen as another leg inside that pattern from 0.9499 (2020 high). Further rally should be seen to 0.8977 resistance and above. This will now remain the favored case as long as 0.8614 support holds.
EUR/JPY Daily Outlook
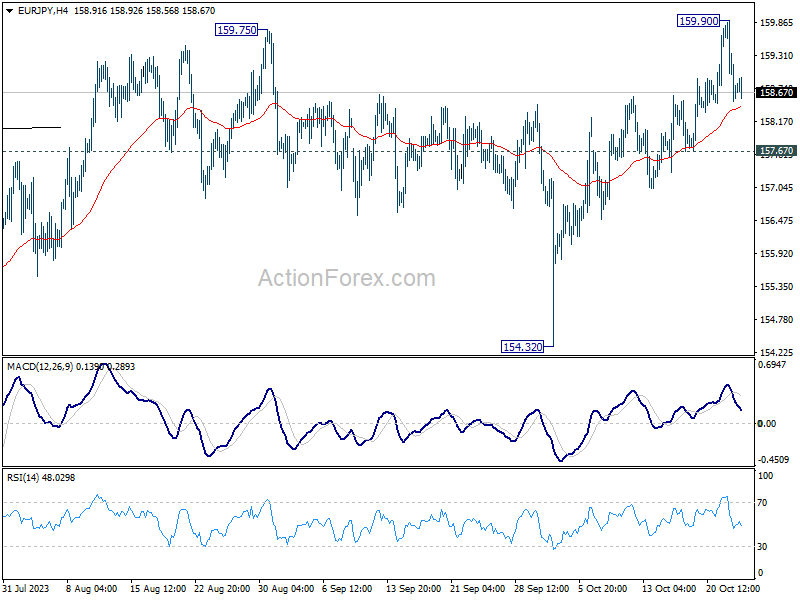
Daily Pivots: (S1) 158.23; (P) 159.08; (R1) 159.61; More....
Intraday bias in EUR/JPY is turned neutral again as it retreated quickly after hitting 159.90. For now, further rise is in favor as long as 157.67 support holds. Above 159.90 will resume larger up trend to 163.06 projection level. However, firm break of 157.67 will turn bias back to the downside 154.32 support instead.
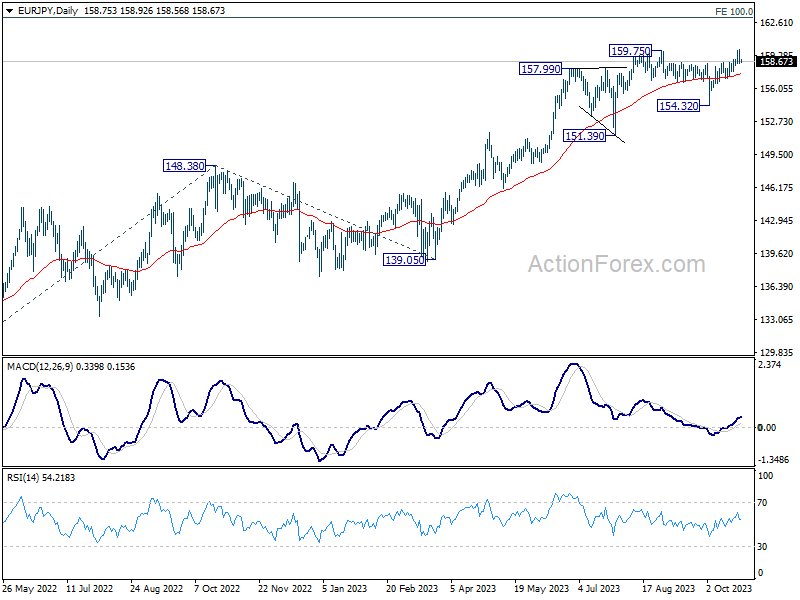
In the bigger picture, rise from 114.42 (2020 low) is in progress. next target is 100% projection of 124.37 to 148.38 from 139.05 at 163.06. On the downside, break of 154.32 support is needed to be the first sign of medium term topping. Otherwise, outlook will remain bullish even in case of deep pullback.
GBP/JPY Daily Outlook
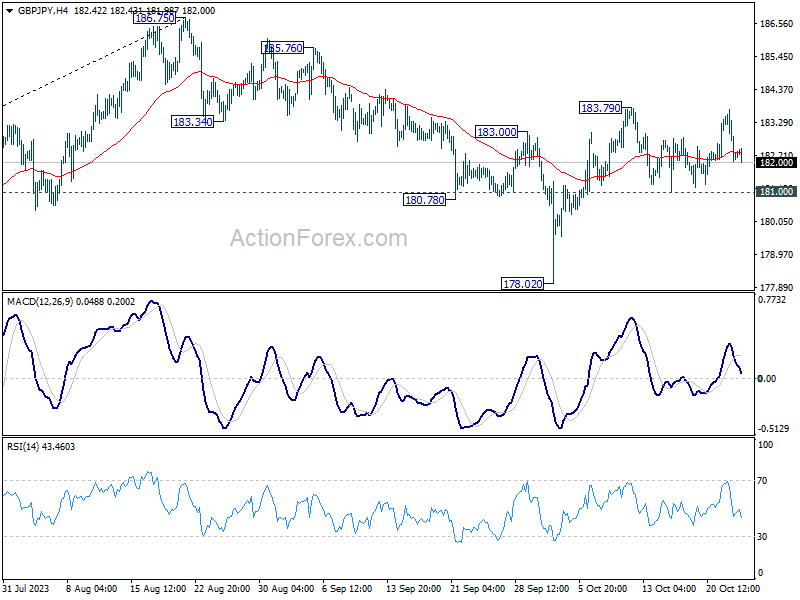
Daily Pivots: (S1) 181.66; (P) 182.70; (R1) 183.35; More...
Intraday bias in GBP/JPY remains neutral as range trading continues. With 181.00 support intact, further rise is in favor. The favored case is still that correction from 186.75 has completed at 178.02. Above 183.79 will resume the rise from 178.02 to retest 186.75 high. However, break of 181.00 will dampen this view, and turn bias back to the downside for 178.02 instead.
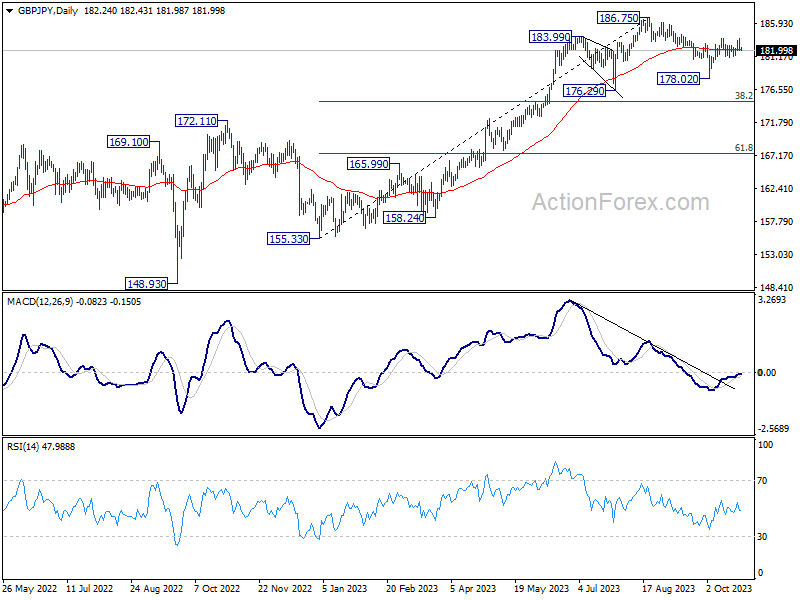
In the bigger picture, fall from 186.75 is seen as a corrective move only. As long as 176.29 support holds, larger up trend from 123.94 (202 low) should still be in progress. Break of 186.75 will target 195.86 (2015 high). Nevertheless, firm break of 176.29 will confirm medium term topping, and bring lengthier and deeper consolidations.
EUR/CHF Daily Outlook
Daily Pivots: (S1) 0.9438; (P) 0.9477; (R1) 0.9497; More...
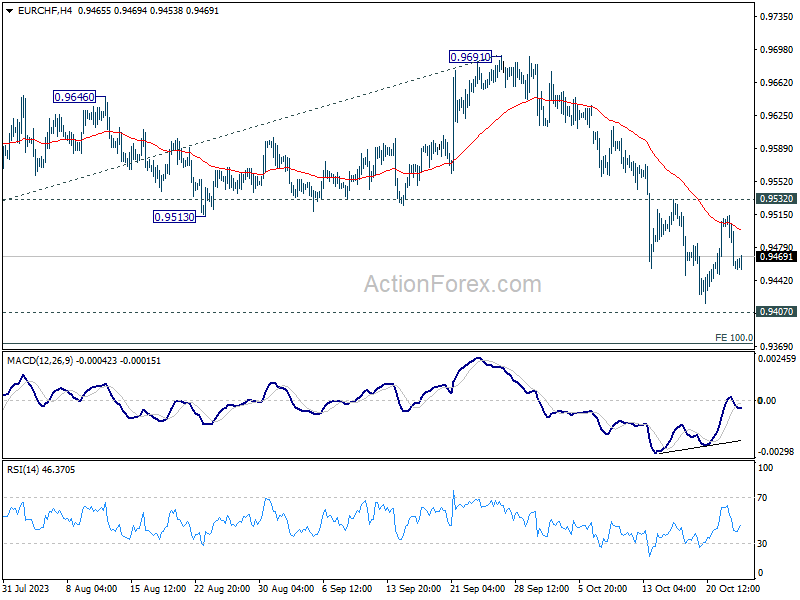
Intraday bias in EUR/CHF remains neutral and outlook stays bearish with 0.9532 resistance intact. On the downside, decisive break of 0.9407 medium term bottom will confirm resumption of larger down trend. Next near term target will be 100% projection of 0.9840 to 0.9520 from 0.9691 at 0.9499, and then 161.8% projection at 0.9179. However, firm break of 0.9532 will confirm short term bottoming, and turn bias to the upside for 0.9691 resistance instead.
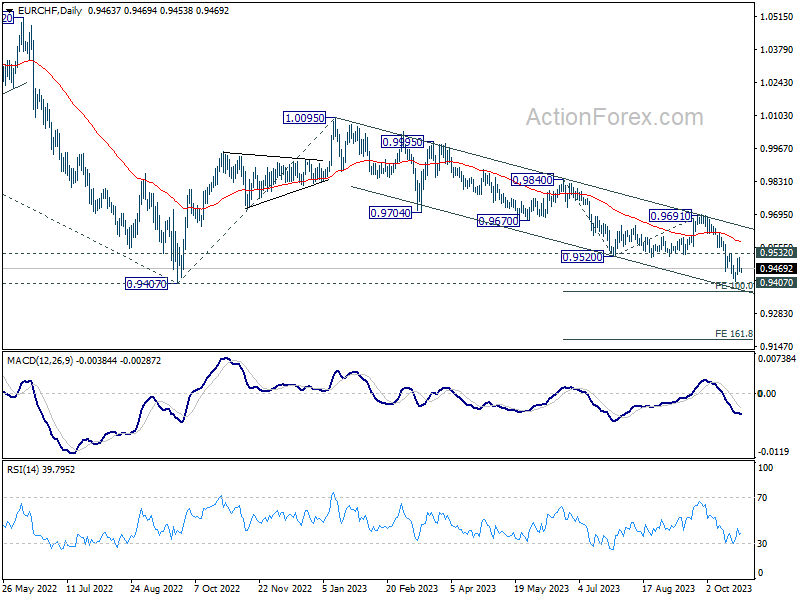
In the bigger picture, down trend from 1.2004 (2018 high) is still in progress. Decisive break of 0.9407 will confirm resumption, and target 61.8% projection of 1.1149 to 0.9407 from 1.0095 at 0.9018. On the upside, break of 0.9691 resistance is needed to be the first sign of medium term bottoming. Otherwise, outlook will stay bearish.
NZDUSD Rallies But All Eyes on Momentum Indicators
- NZDUSD is in the green again today, a tad above a key level
- Bearish pressure lingers as NZDUSD traded at a 1-year low
- Momentum indicators could soon turn bullish
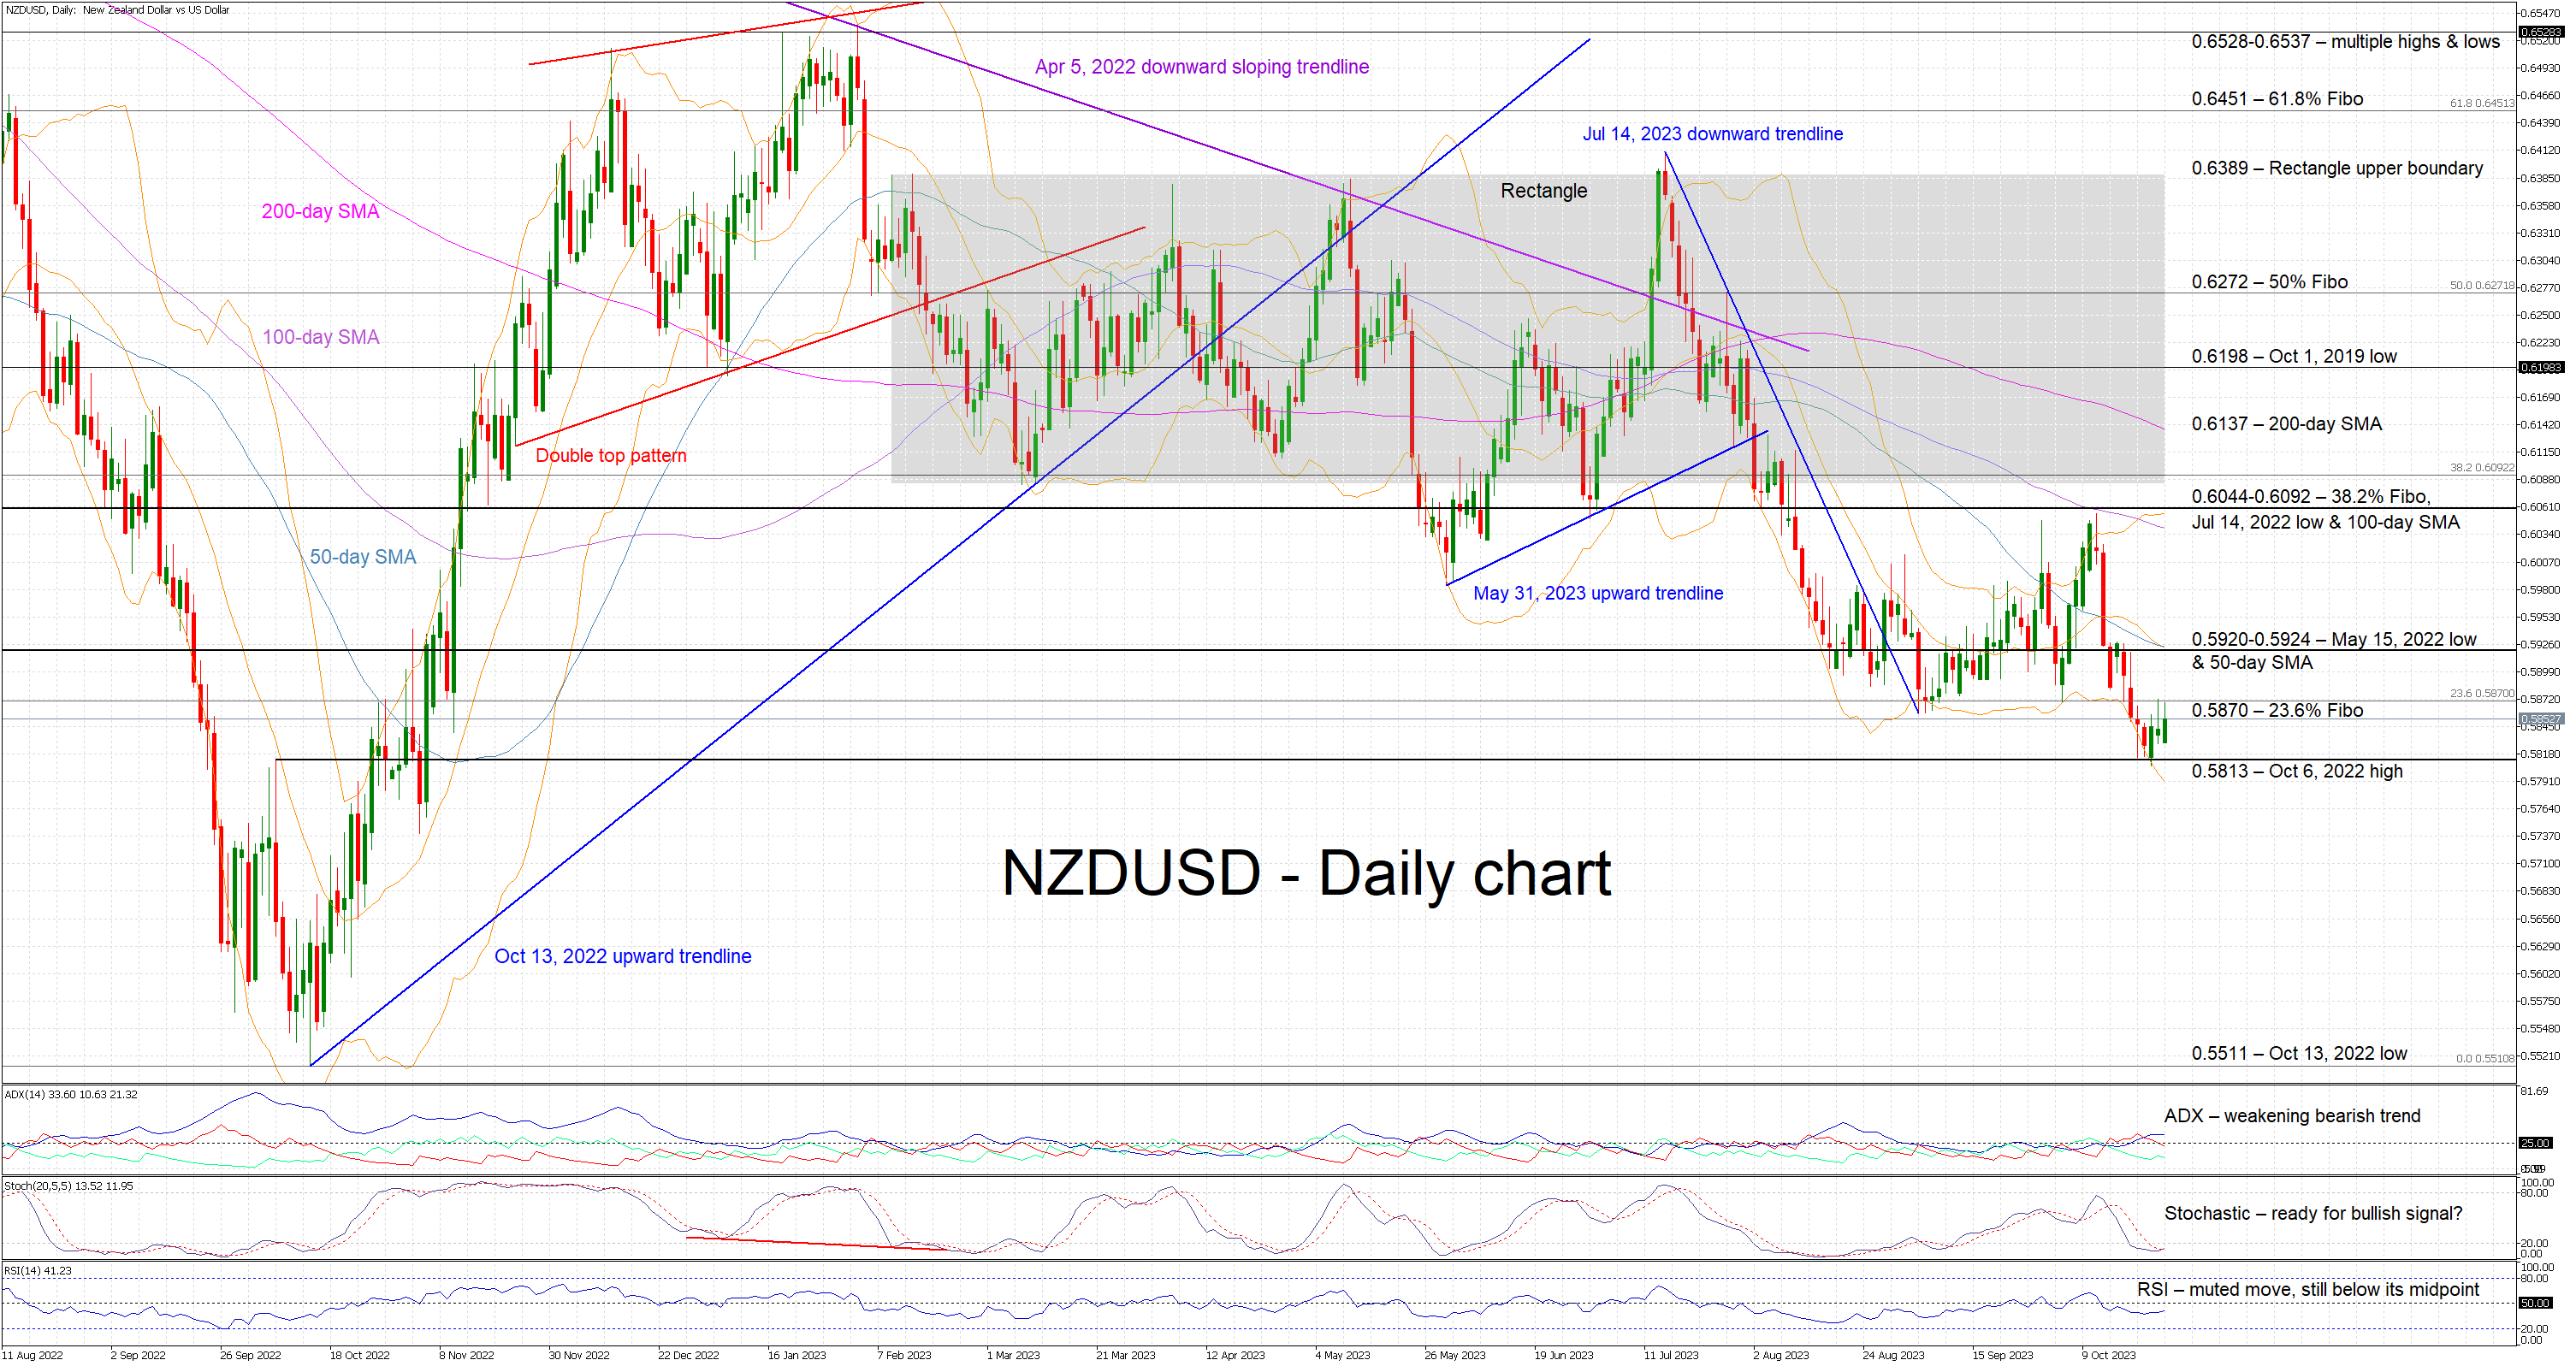
NZDUSD is edging higher today, recording its third consecutive green candle but trading only a tad above the key 0.5813 level. The bears remain in control of the market as the latest downleg, from the October 11 local peak, pushed NZDUSD to the lowest level since November 4, 2022.
Understandably, the focus is now on the momentum indicators for any indications for the next leg in NZDUSD. More specifically, the Average Directional Movement Index (ADX) points to a weakening bearish trend in the market, and the RSI remains a tad below its 50-midpoint. More importantly, the stochastic oscillator is trying to edge above its moving average and exit its oversold territory. Should this take place, the current muted upleg could gain significant traction.
If the bulls feel more confident, they could try to overcome the 23.6% Fibonacci retracement of the April 5, 2022 – October 13, 2022 downtrend at 0.5870, and then push NZDUSD towards the busier 0.5920-0.5924 region. This area is key for short-term sentiment and, if broken, it could open the door for a stronger move towards the 0.6044-0.6092 range.
On the flip side, the bears are probably taking a breather and are preparing for the next sell-off. The support set by the October 6, 2022 high at 0.5813 remains considerable, as proven last week. A successful break below this level would allow the bears to record a new 2023 low and then set sail for the October 13, 2022 low at 0.5511.
To sum up, NZDUSD bulls are trying to defend the 0.5813 level and stage a move towards 0.5920, but they need strong support from the momentum indicators to fend off the bears.
USD Downside Well Protected Going into ECB
Markets
Disappointing and weak EMU October PMI’s contrasted with slightly better (and 50+) readings in the US. European data already cement the case for a technical European recession in the second half of this year with the domestic services sector feeling more and more pain. On top, they were accompanied by the ECB’s lending survey pointing to weaker loan demand and tighter credit standards. The dismal PMI added fuel to the bond fire ignited by Monday’s Ackman tweet (hedge fund closing short US 30-yr bond trade in light of huge uncertainty and absolute yield levels). However, the likes of the Bund eventually closed well off the intraday peak levels. Changes on the German yield curve ranged between 1.7 bps (30-yr) and 5.5 bps (5-yr) with the belly of the curve outperforming the wings. Those changes are almost completely result of gapping open lower, catching up with Monday’s WS moves though. Changes on the US yield curve varied between +6.4 bps and -6.1 bps. The front end underperformed after US PMI’s while the (very) long end rallied into the close together with stock markets. Main US indices “recovered” 0.5% to 1%.
This week’s action on the USD-market deserves some special attention. On Monday, the greenback got whacked by the US Treasury rally, with the trade weighted dollar falling from 106.20 to a new October low around 105.40. The mirror image in EUR/USD was a rise from 1.0580 to nearly 1.07. Yesterday it was back to square one though on the back of those diverging PMI’s with both DXY and EUR/USD completely retracing Monday’s steps. To us, it suggests that the USD downside is well protected going into ECB (Thursday) and Fed (next Wednesday) policy meetings. We see a fair chance that the ECB meeting will produce a dovish skip, while the Fed will end up with a hawkish skip. Unless of course the ECB already introduces additional liquidity-draining measures but we expect those by December at the earliest (ending PEPP reinvestments).
Asian risk sentiment is bullish this morning with South Korea underperforming. China raised its fiscal deficit ratio to about 3.8% of GDP (from 3% target set in March), suggesting more room for fiscal stimulus. More sovereign debt will be issued to support disaster relief and construction. An unexpected central bank visit by president Xi Jinping is also considered as giving a head’s up to a growth supportive policy. Today’s eco calendar is uneventful, making room for more technical and sentiment-driven trading ahead of the ECB meeting.
News and views
The Hungarian central bank lowered the base rate from 13% to 12.25% yesterday. The 75 bps cut was bigger than expected but was justified by the fact that the real policy rate now moved into positive territory after a steep 4.2 ppt drop in September inflation to 12.2%. Core inflation still stands at 13.1% but the three-month annualized change, which is considered a better gauge in the current situation, fell to levels last seen before Covid-19 below 4%. Annual inflation is expected to reach 7-8% by the end of the year, turning real rates more positive and therefore restrictive. Given the poor economic outlook, the MNB plans to further lower the base rate. If the MNB’s inflation expectations materialize and assuming it wants to retain a positive real rate, it could go ahead with the 75 bps pace or, in theory, press the gas even faster. In practice however, the Hungarian forint is critical input to setting the easing speed. The currency gave a cautious sign of approval with EUR/HUF finishing at 383.24 from 381.71. HUF swap yields dropped more than 20 bps at the front end of the curve.
Australian Q3 inflation topped expectations. Q/Q price pressures accelerated from 0.8% to 1.2%. Disinflation still continued in the yearly readings, dropping from 6% in Q2 to 5.4% (vs 5.3% anticipated). Two closely watched core gauges printed at 1.2 and 1.3% Q/Q with Y/Y figures both coming in at 5.2%. “The most significant contributors to the rise in the September quarter were automotive fuel (+7.2%), rents (+2.2%), new dwellings purchased by owner occupiers (+1.3%) and electricity (+4.2%)”, the Australian Bureau of Statistics reported. The numbers come after fresh RBA governor Bullock warned that the central bank won’t hesitate to hike again if the inflation outlook would be raised markedly. Money markets attach a 60% probability to another rate increase (to 4.35%) at the Nov 7 meeting.