Sample Category Title
AUD/USD Daily Report
Daily Pivots: (S1) 0.6333; (P) 0.6356; (R1) 0.6379; More...
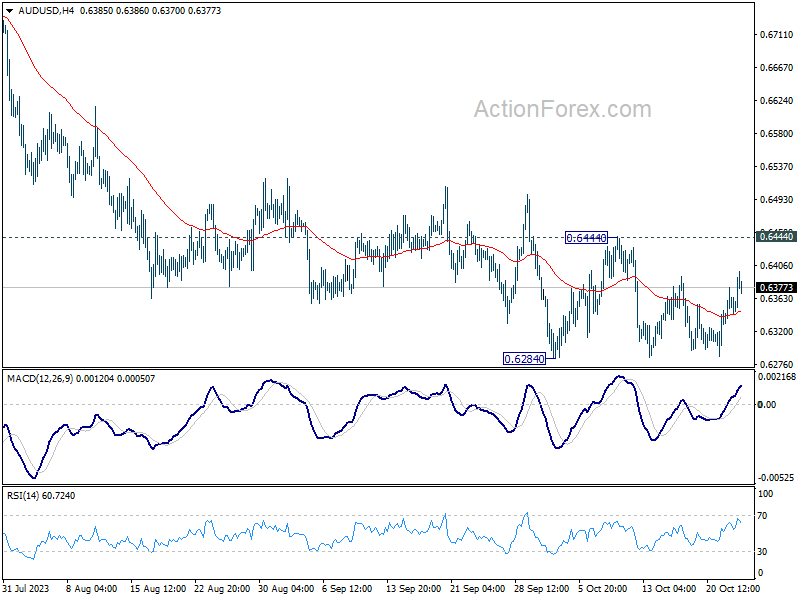
AUD/USD recovers further today but stays below 0.6444 resistance. Intraday bias remains neutral and downside breakout is expected. On the downside, firm break of 0.6284 will resume whole fall from 0.7156. Next target is 100% projection of 0.7156 to 0.6457 from 0.6894 at 0.6195, which is close to 0.6169 medium term support. However, firm break of 0.6444 will turn bias to the upside for stronger rebound.
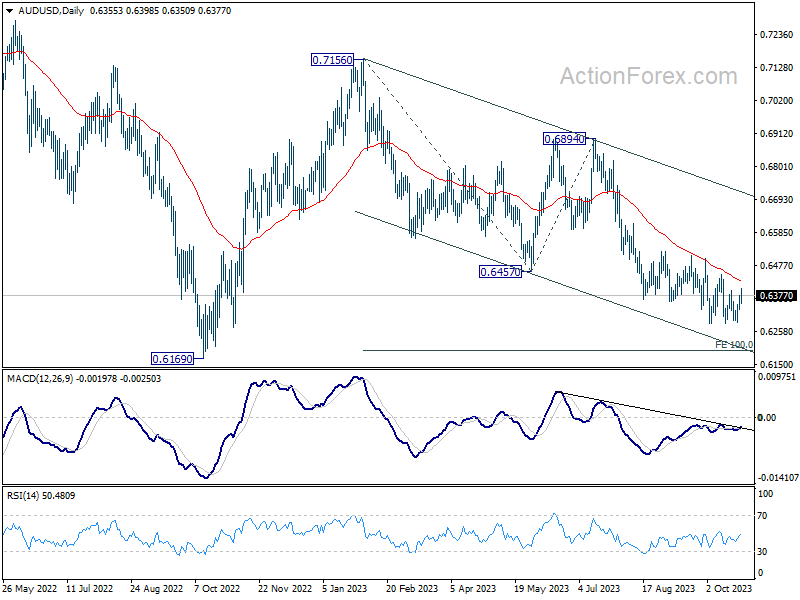
In the bigger picture, down trend from 0.8006 (2021 high) is possibly still in progress. Decisive break of 0.6169 will target 61.8% projection of 0.8006 to 0.6169 to 0.7156 at 0.6021. This will now remain the favored case as long as 0.6894, in case of strong rebound.
Aussie Rises on Inflation Data and Chinese Stimulus; Eyes on BoC and Gold Movements
Australian Dollar made significant gains in Asian session today following unexpectedly robust inflation figures for Q3 and September. This has caused a flurry of revised predictions from economists who now anticipate a rate hike by RBA in its next meeting in November. While there's speculation about a subsequent hike in December, such a back-to-back move by RBA remains a distant probability. Boosting Aussie's ascent is also reports on China's intentions to roll out a new fiscal stimulus to bolster its economic recovery. New Zealand Dollar is tailing Aussie, marking its position as the day's second strongest currency.
Conversely, all eyes are on Canadian Dollar as it lags, with BoC's impending rate decision looming large. Although the consensus leans towards BoC maintaining its current stance, market participants will be keenly observing the accompanying statement and freshly minted economic forecasts. Dollar is also on the softer side, possibly marking time until the release of US GDP figures tomorrow. With treasury yields hinting at short-term stabilization, the forthcoming economic data could be pivotal for the greenback. Meanwhile, Yen and Swiss Franc are on standby, tracking overarching risk sentiments. The Euro and Sterling are displaying a moderate recovery, offsetting some of the previous day's losses post PMI data release.
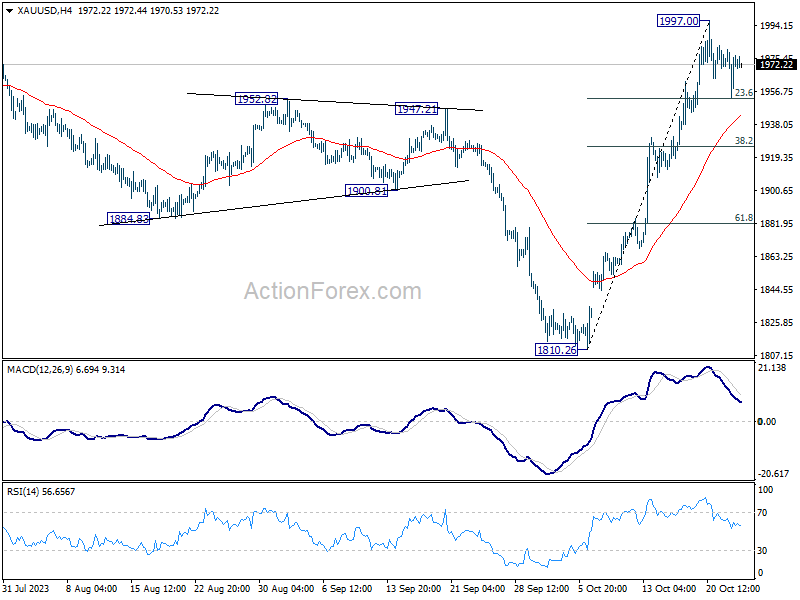
From a technical standpoint, Gold is now at a near term juncture. The precious metal's immediate challenge is to capitalize on its rebound from t3.6% retracement of 1810.26 to 1997.00 at 1925.25 and surpass the 1997.00 resistance in the next two days. Failure to do so might send it back to 38.2% retracement at 1925.66, extending the correction into mid-November.
In Asia, at the time of writing, Nikkei is up 0.87%. Hong Kong HSI is up 0.79%. China Shanghai SSE is up 0.45%. Singapore Strait Times is up 0.07%. Japan 10-year JGB yield is up 0.0024 at 0.856. Overnight, DOW rose 0.62%. S&P 500 rose 0.73%. NASDAQ rose 0.93%. 10-year yield rose 0.002 to 4.840.
Australia CPI slows to 5.4% yoy in Q3, but rises to 5.6% yoy in Sep
Australia's CPI for Q3 registered a 1.2% qoq rise, exceeding expectation of 1.1% qoq and marking an acceleration from the previous quarter's 0.8% qoq. Notably, some of the most pronounced price hikes were observed in automotive fuel (+7.2%), rents (+2.2%), new dwelling purchases by owner-occupiers (+1.3%), and electricity (+4.2%).
Over the twelve months, inflation saw a deceleration, with CPI moving from 6.0% yoy to 5.4% yoy in Q3. However, this figure surpassed the anticipated 5.3% yoy. It's essential to note that this is the third consecutive quarter where the annual inflation rate has experienced a downturn, dropping from its high of 7.8% in Q4 2022.
The trimmed mean CPI, which excludes volatile items, recorded a 1.2% qoq increase again outpacing the forecasted 1.1% qoq and the previous quarter's 1.0% qoq . When analyzing the annualized data, the trimmed mean CPI decelerated from 5.9% yoy to 5.2% yoy, surpassing the predicted 5.1% yoy.
Commenting on the latest figures, Michelle Marquardt, ABS head of price statistics, highlighted that "prices continued to rise for most goods and services." However, she also noted a few sectors that registered price declines, notably child care, vegetables, and domestic holiday travel and accommodation.
Furthermore, the monthly CPI for September recorded acceleration from 5.2% yoy to 5.6% yoy , which was above the anticipated 5.4% yoy. Significant price surges in this period were identified in Housing (+7.2%), Transport (+9.4%), and Food and non-alcoholic beverages (+4.7%).
Reflecting on these trends, Marquardt stated, "This is the second consecutive rise in the annual movement up from 5.2% in August and 4.9% in July. While many industries' price increases are slowing, automotive fuel has had large annual increases in the last two months, which has been driving the movement higher."
Aussie soars on anticipated RBA Nov hike; GBP/AUD targets 1.8854 support
Australian Dollar experienced a notable surge following the release of higher-than-anticipated consumer inflation figures. The data illustrates an accelerated quarterly inflation rate for Q3, and a more modest deceleration in the annual inflation rate than projected. Furthermore, the monthly CPI has been on the rise for two consecutive months. Given this backdrop, market participants are now anticipating another 25bps rate hike by RBA in their upcoming November 7th meeting, pushing the rate to 4.35%.
For a deeper understanding, one can refer to the minutes from RBA's October meeting which highlighted the Board's "low tolerance" towards unexpected surges in inflation. Adding weight to these expectations, Governor Michelle Bullock made it clear just a day prior, stating, "The Board will not hesitate to raise the cash rate further if there is a material upward revision to the outlook for inflation."
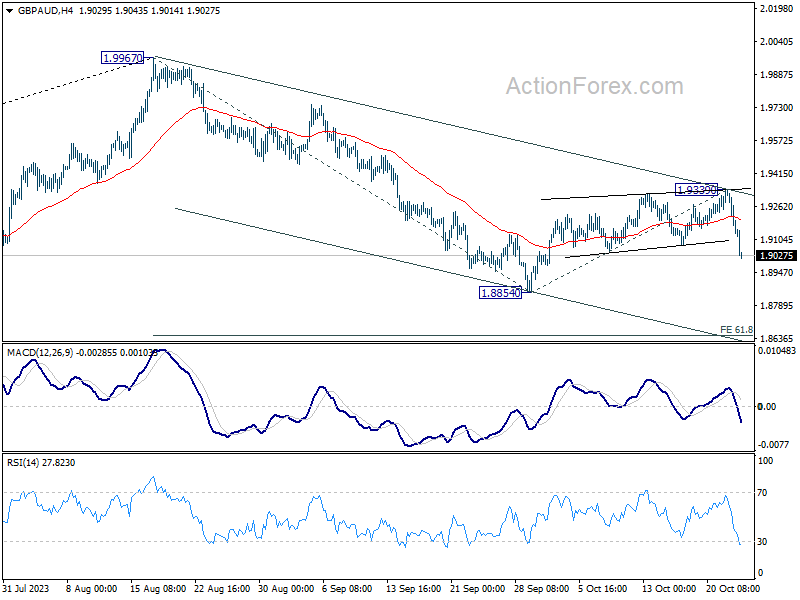
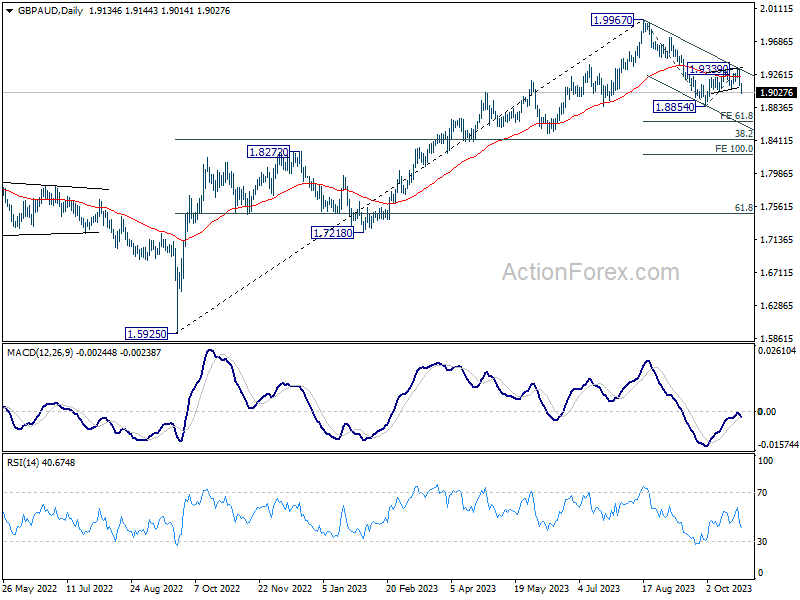
GBP/AUD's steep decline this week argues that corrective rebound from 1.8854 has completed at 1.9339 already. That came after failure to sustain above 55 D EMA (now at 1.9226). Risk will now stay on the downside as as 1.9339 resistance holds, in case of recovery. Break of 1.8854 support will confirm resumption of whole fall from 1.9967 to 61.8% projection of 1.9967 to 1.8854 from 1.9339 at 1.8651 next.
BoC to hold, with hawkish untone?
BoC rate decision is today's market highlight, as the consensus veers towards maintaining interest rate at 5.00%. The potential for a rate hike has dwindled, especially after the September CPI data revealed a more rapid deceleration in inflation than anticipated. Now, speculations swirl regarding the possibility of a "hawkish hold," which leaves the door open for further tightening.
Market consensus on the BoC's next moves, however, isn't unanimous. A recent Reuters poll showcased a split opinion. A slim majority of 8 of the 18 economists surveyed perceive a a "high" likelihood of another hike. As for rate reductions, opinions stand divided too. 19 economists project rates falling beneath the current benchmark by the end of June, while 11 anticipate maintaining or even exceeding the current level.
As the BoC is set to unveil its latest growth and inflation forecasts, market participants are keenly awaiting insights that might shed light on the bank's future monetary stance.
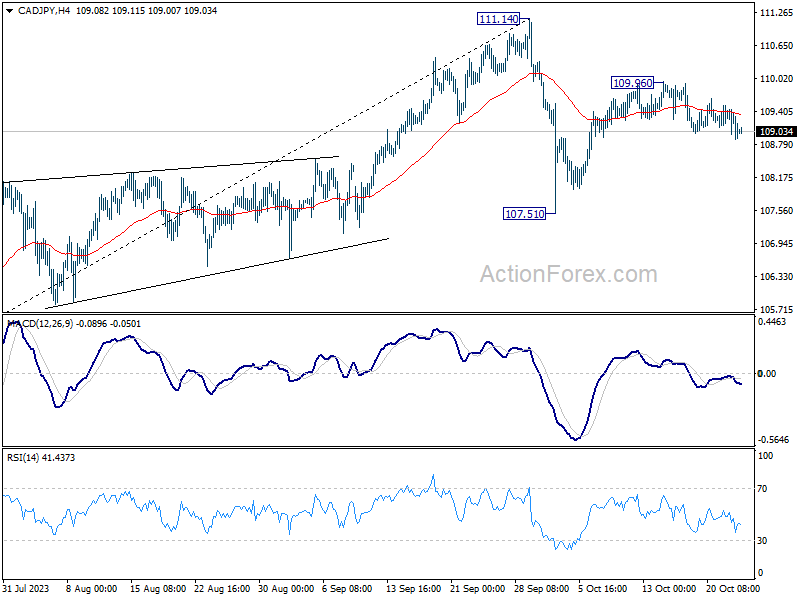
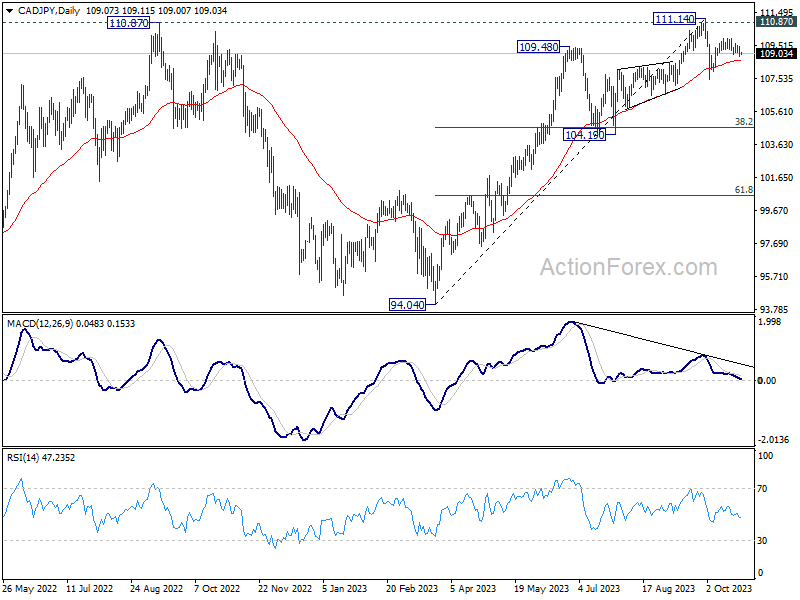
Amid these discussions, the Canadian Dollar isn't faring well, even when pitted against the underperforming Yen. Risk is mildly on the downside for CAD/JPY as long as 109.96 resistance holds. Deeper fall is slightly in favor as to 107.51 support and below to extend the corrective pattern from 111.14 high. While a break of 109.96 will resume the rebound from 107.51. Breaking 111.14 to resume larger up trend is not expected. So upside potential is limited for the near term.
Elsewhere
Germany Ifo business climate will be the highlight of European session. Later in the day, US will release new home sales.
AUD/USD Daily Report
Daily Pivots: (S1) 0.6333; (P) 0.6356; (R1) 0.6379; More...
AUD/USD recovers further today but stays below 0.6444 resistance. Intraday bias remains neutral and downside breakout is expected. On the downside, firm break of 0.6284 will resume whole fall from 0.7156. Next target is 100% projection of 0.7156 to 0.6457 from 0.6894 at 0.6195, which is close to 0.6169 medium term support. However, firm break of 0.6444 will turn bias to the upside for stronger rebound.
In the bigger picture, down trend from 0.8006 (2021 high) is possibly still in progress. Decisive break of 0.6169 will target 61.8% projection of 0.8006 to 0.6169 to 0.7156 at 0.6021. This will now remain the favored case as long as 0.6894, in case of strong rebound.
Economic Indicators Update
| GMT | Ccy | Events | Actual | Forecast | Previous | Revised |
|---|---|---|---|---|---|---|
| 00:30 | AUD | Monthly CPI Y/Y Sep | 5.60% | 5.40% | 5.20% | |
| 00:30 | AUD | CPI Q/Q Q3 | 1.20% | 1.10% | 0.80% | |
| 00:30 | AUD | CPI Y/Y Q3 | 5.40% | 5.30% | 6.00% | |
| 00:30 | AUD | RBA Trimmed Mean CPI Q/Q Q3 | 1.20% | 1.10% | 1.00% | |
| 00:30 | AUD | RBA Trimmed Mean CPI Y/Y Q3 | 5.20% | 5.00% | 5.90% | |
| 08:00 | CHF | Credit Suisse Economic Expectations Oct | -27.6 | |||
| 08:00 | EUR | Germany IFO Business Climate Oct | 85.9 | 85.7 | ||
| 08:00 | EUR | Germany IFO Current Assessment Oct | 88.5 | 88.7 | ||
| 08:00 | EUR | Germany IFO Expectations Oct | 83.3 | 82.9 | ||
| 08:00 | EUR | Eurozone M3 Money Supply Y/Y Sep | -1.70% | -1.30% | ||
| 14:00 | USD | New Home Sales Sep | 684K | 675K | ||
| 14:00 | CAD | BoC Interest Rate Decision | 5.00% | 5.00% | ||
| 14:30 | USD | Crude Oil Inventories | -0.5M | -4.5M | ||
| 15:00 | CAD | BoC Press Conference |
Bitcoin (BTCUSD) Looking to Extend Higher as Impulse
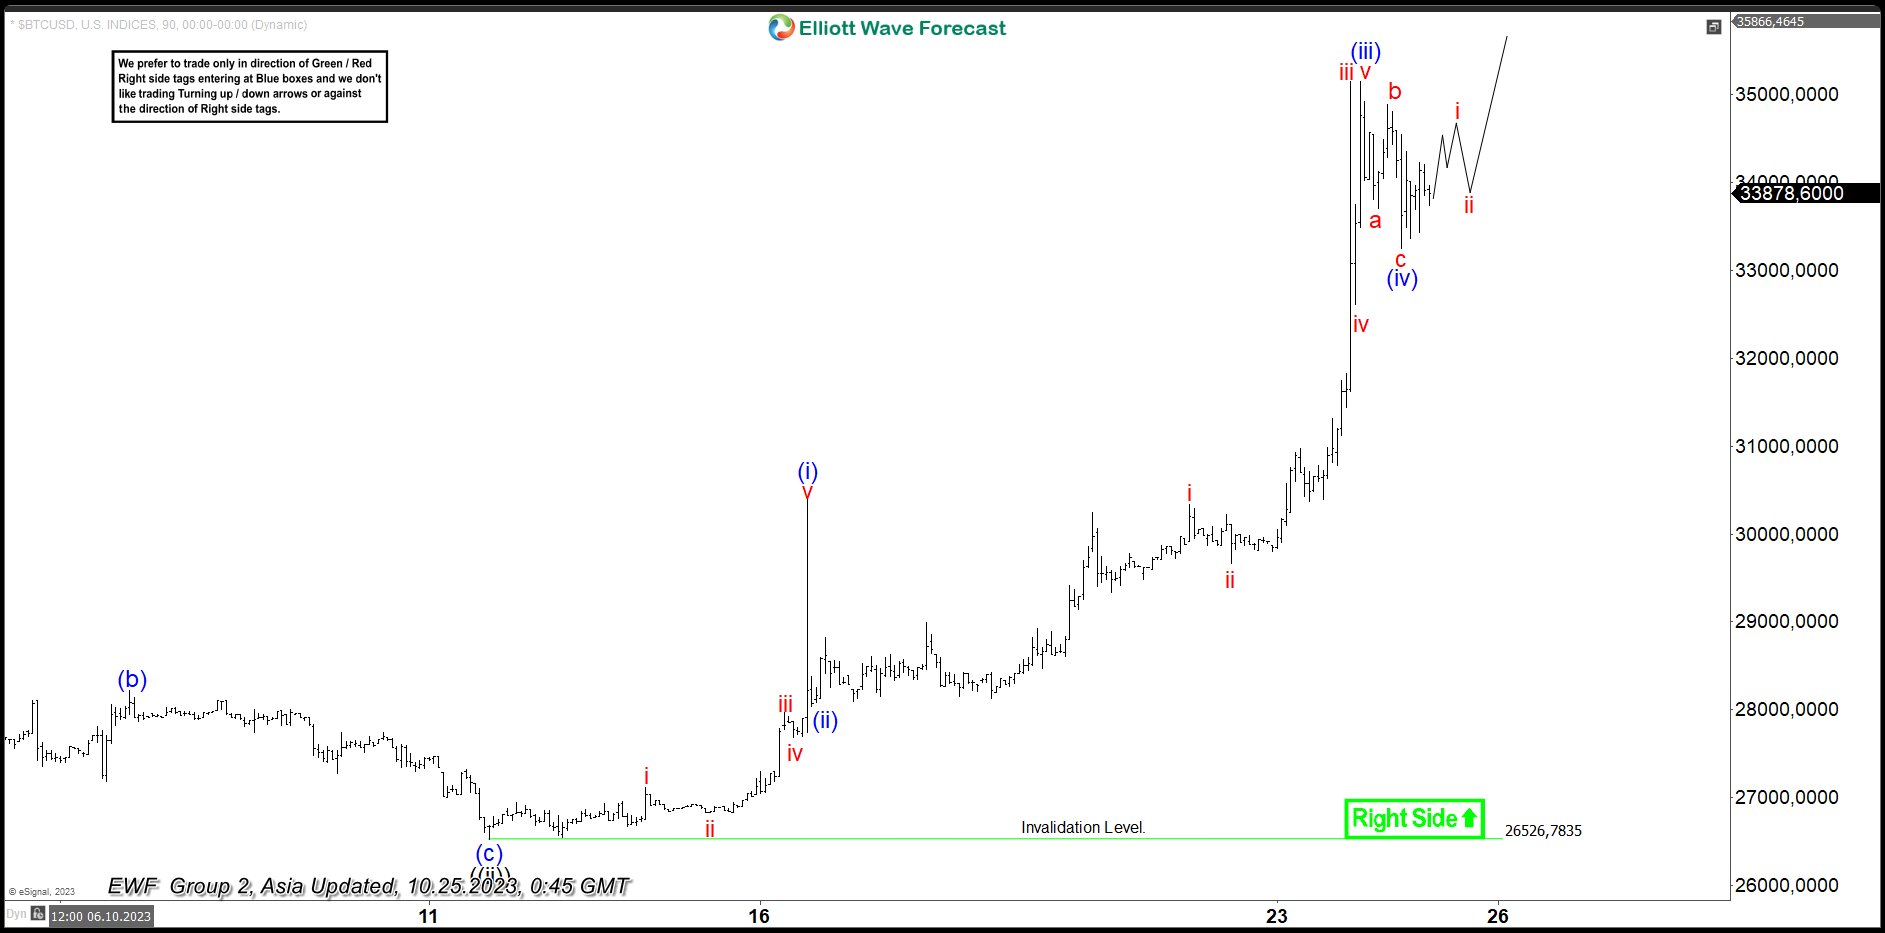
Short Term view of Bitcoin (BTCUSD) suggests that cycle from 9.11.2023 low is in progress as an impulse Elliott Wave structure. Up from 9.11.2023 low, wave 1 ended at 27493.1 and pullback in wave 2 ended at 25994.2. The crypto currency then extended higher again in wave 3. Up from wave 2, wave ((i)) at 28582.4 and pullback in wave ((ii)) ended at 26526.78 as the 90 minutes chart below shows. The crypto-currency has extended higher in wave ((iii)).
Up from wave ((ii)), wave i ended at 27113.3 and dips in wave ii ended at 26825.8. Bitcoin then extended higher in wave iii towards 27972.8 and dips in wave iv ended at 27680.1. Final leg wave v ended at 39377,3 which completed wave (i). Pullback in wave (ii) ended at 28042.70. Bitcoin then extended higher again in wave (iii). Up from wave (ii), wave i ended at 30335.7 and wave ii ended at 29669.50. Wave iii higher ended at 35150 and pullback in wave iv ended at 32671.30. Final leg wave v ended at 35152 which completed wave (iii). Pullback in wave (iv) ended at 33250. Near term, expect Bitcoin to extend 1 more leg to end wave (v) of ((iii)), then it should pullback in wave ((iv)) and turns higher again. Near term, as far as pivot at 26526.78 low stays intact, expect pullback to find support in 3, 7, or 11 swing for further upside.
Bitcoin(BTCUSD) 90 Minutes Elliott Wave Chart
BTCUSD Elliott Wave Video
https://www.youtube.com/watch?v=RoAAz4trwkQ
Bitcoin Price Consolidates Gains But Rally Could Soon Resume
Key Highlights
- Bitcoin price started a fresh rally after speculation of spot ETF approval.
- BTC is now consolidating in a contracting triangle with resistance at $34,200 on the 4-hour chart.
- Gold prices might soon climb further toward the $2,000 resistance.
- Oil prices are moving lower below the $86.50 support.
Bitcoin Price Technical Analysis
Bitcoin price a strong rally above the $30,000 resistance. There were images in circulation about spot ETF listing on exchanges. It sparked a sharp surge of over 15%.
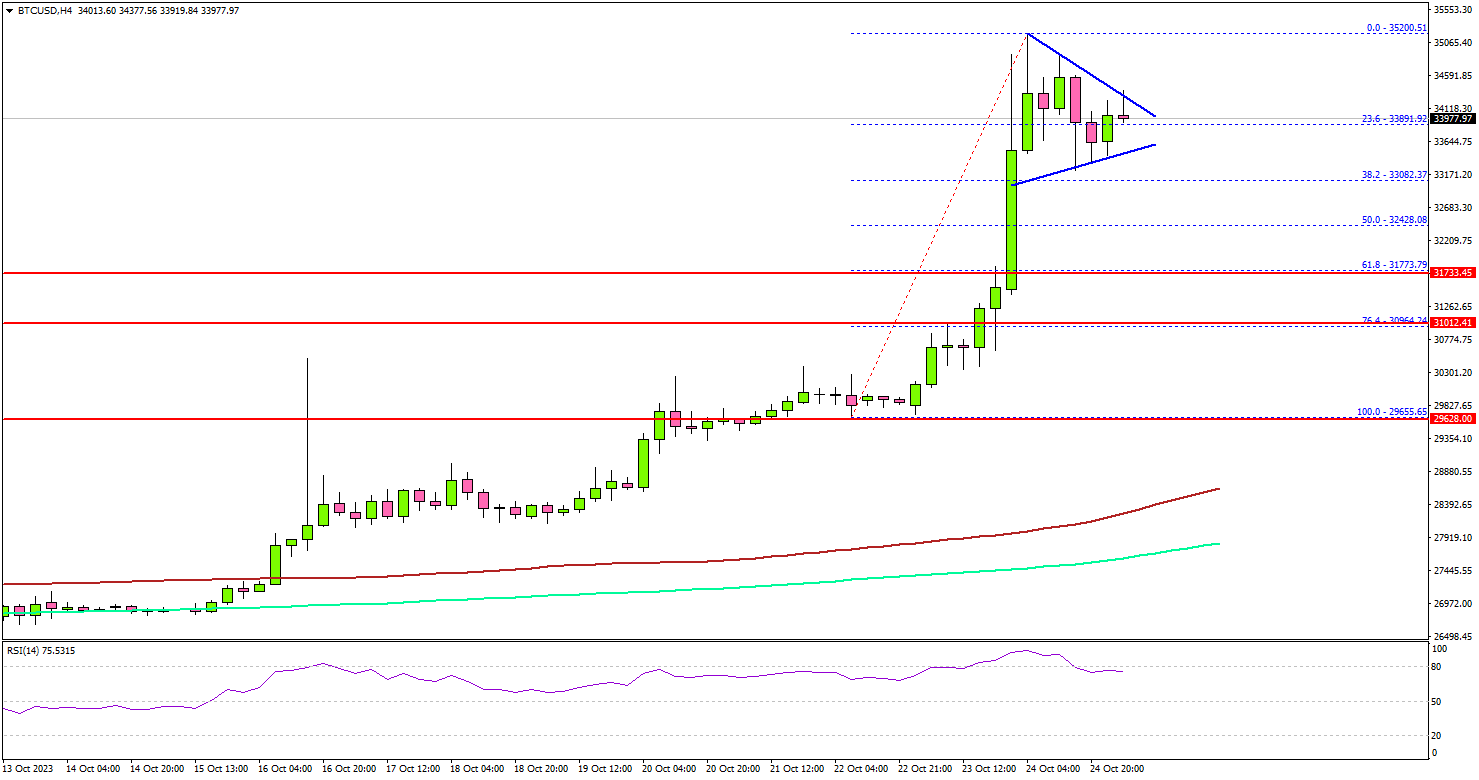
Looking at the 4-hour chart, the price rallied above the $32,000 and $33,200 resistance levels. The price even surged toward the $35,000 level before the bears appeared. A high was formed near $35,200 and the price is now consolidating gains.
It is trading in a contracting triangle with resistance at $34,200 on the 4-hour chart. If there is a fresh rally above the triangle resistance, Bitcoin could clear the $35,000 barrier.
The first major resistance is near $36,500. The next resistance is near $38,000. A successful close above the $38,000 level might spark a decent increase. In the stated case, the price may perhaps rise toward the $40,000 level.
If there is a downside break, the price might correct lower and test the $33,000 support. The next major support is near $32,400 or the 50% Fib retracement level of the upward move from the $29,655 swing low to the $35,200 high.
Any more losses might send the price toward the 76.4% Fib retracement level of the upward move from the $29,655 swing low to the $35,200 high at $31,000.
Looking at gold prices, it is now consolidating gains and might soon attempt a fresh move toward the $2,000 level.
Economic Releases
US New Home Sales for Sep 2023 (MoM) – Forecast -2.9% versus -8.7% previous.
BoC Interest Rate Decision – Forecast 5%, versus 5% previous.
RBNZ: Hawks, Doves, and Kiwis
The RBNZ has had a tough balancing act to manage in recent months. Core inflation pressures –especially those related to domestic prices – remain elevated two years after the start of the interest rate hiking cycle. In addition, economic activity and net migration have exceeded the RBNZ's expectations and the housing market is stirring. But at the same time, we are seeing mounting evidence that growth is turning down, there's been softness in some key overseas markets, and longer-term interest rates have pushed higher both in New Zealand and abroad.
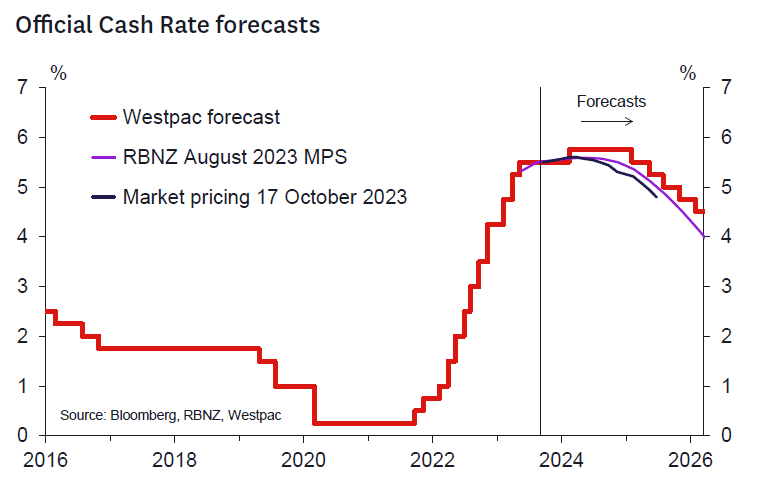
With arguments on both sides, the Westpac Economics team has again been considering how the outlook for monetary policy might evolve over the coming year or so. To help organise our thoughts and promote thought and debate, we have marshalled a range of hawkish and dovish considerations that, while not exhaustive, could influence the future direction of policy. We don't weigh the various arguments to reach a conclusion, but we seek to highlight the issues we have been thinking about as we mull over the outlook in preparation for our updated Economic Outlook later this month. We invite feedback on the perspectives we discuss here and any additional relevant viewpoints.
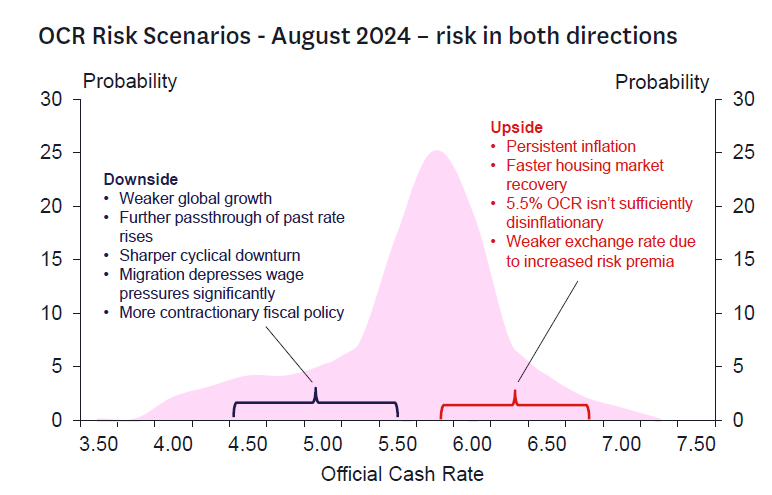
The Hawk's Eye View.
Net migration surge underpins strength in demand and inflation (see Figure 1).
- Net migration rose to a record 110,000 in the year to August and is set to rise further over the coming months, pushing population growth to the highest levels we've seen in decades.
- While population inflows are helping to address labour shortages, they are also adding to demand. That could mean current domestic inflation pressures take longer to dissipate.
- The strength in migration could also add to pressures in the housing market. New rents are already rising rapidly in larger regions like Auckland.

Housing market resurgence frustrates disinflation (see Figure 1).
- The earlier fall in house sales and prices has been arrested, and the housing market is now turning upwards despite increased borrowing rates.
- First home buyers/owner occupiers could be joined by investors given the more investor friendly policies campaigned on by the incoming centre- right government.
- A further resurgence in the housing market could boost demand more generally, including related increases in household spending or construction.
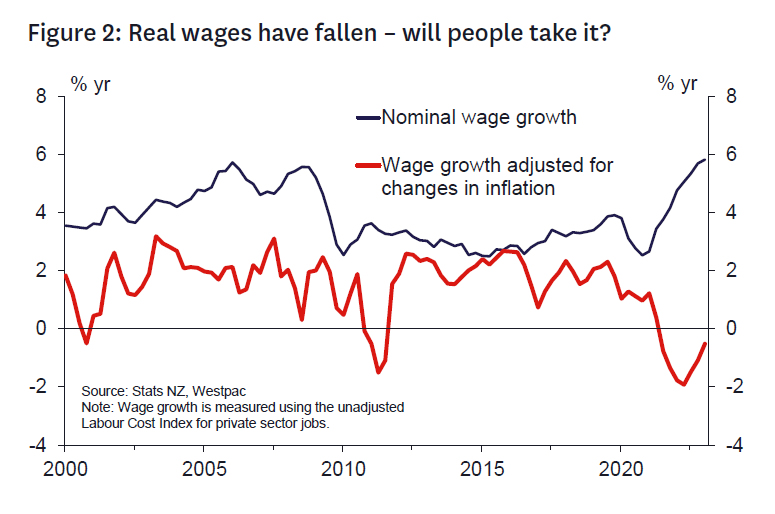
Strong household income growth prevents significant disinflation (see Figure 2).
- Strong job and wage growth relative to productivity growth could underpin domestic demand.
- The unemployment rate remains low, the labour participation rate is at record highs and employment is elevated, supporting household income growth.
- Workers pursue real wage gains/protection (e.g., through multi-year wage agreements) that prevent disinflation in the services/non-tradables sectors.
- Savings rates have risen since the pandemic, and households are ahead on mortgage repayments.
Output growth does not decline significantly due to bottoming confidence and population growth.
- Households and firms have weathered the worst and now anticipate rising asset prices and near peak interest rates.
- Public sector capex remains strong due to infrastructure needs, including replacing damage from this year's storms.
Risk of an exchange rate correction as global risk-free rates ratchet higher (see Figure 3).
- Global risk-free interest rates are adjusting up to reflect a higher than pre-COVID norm in part reflecting persistent global inflation.
- NZ rates need to remain high to manage exchange rate risks from the elevated current account deficit. Related risk for imported inflation.

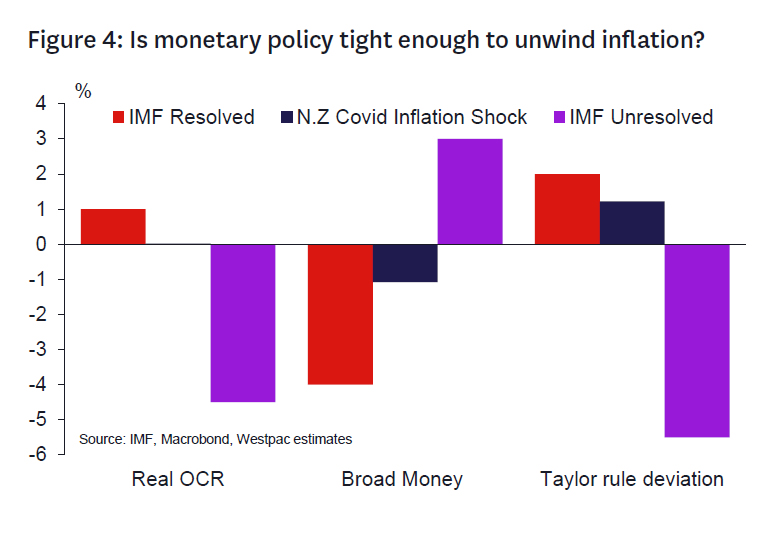
NZ interest rates are higher but not high (see Figure 4).
- Higher interest rates have disproportionately affected upper quintile income households who have a lower propensity to consume.
- Other households have seen strong income growth (reflecting labour market shortages during COVID) and their wealth has not been reduced by falling asset prices.
- Aggregate demand proves resilient as nonmortgagees continue to spend.
- Comparing the RBNZ tightening cycle since Covid-19 against the metrics determined in a recent IMF study on the metrics associated with countries who have in the past successfully versus unsuccessfully unwound large inflation shocks could suggest the RBNZ has not done enough.
Inflation remains persistently high, resulting in high inflation expectations.
- RBNZ needs to pursue tighter policy to dislodge inflation.
The Dove's Tale.
Monetary policy works with long and variable lags; policymakers need to be forward-looking.
- The economy is growing below trend and key upstream indicators of inflation are clearly moving in the right direction, even though policy is yet to attain its maximum effect.
- As long as those upstream indicators maintain their current trend, the RBNZ can afford to be patient and allow the current policy stance to work.
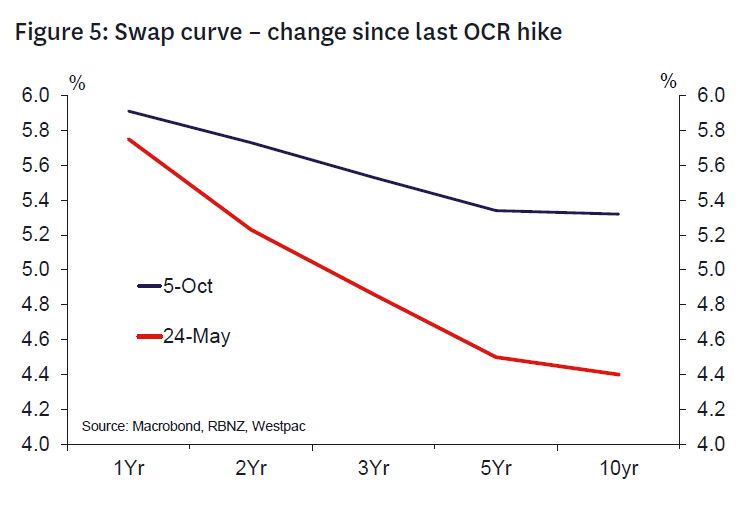
Markets are now working with the RBNZ, rather than against it (see Figure 5).
- Earlier in the year markets were undermining the effectiveness of the RBNZ's stance by pricing in an early easing, keeping longer term interest rates lower than otherwise.
- The recent sharp rise in longer term interest rates (and thus mortgage rates) means that the RBNZ now has greater leverage for a given OCR, tightening overall financial conditions.
Tightening further would add volatility to the economy.
- Tightening further to achieve a quicker decline in inflation would result in a steeper downturn in the economy, potentially making it more difficult to calibrate the eventual easing.
- Adding volatility to growth and interest rates increases uncertainty for businesses, which is as detrimental to the economy as temporarily above-target inflation.
Households are yet to feel the full impact of past rate hikes (see Figure 7).
- Mortgage rate fixing has delayed the impact of OCR hikes. A sizeable rise in debt servicing costs will occur in 2023/24, even more so now given the recent lift in mortgage rates.
- The effective mortgage rate will rise well above pre- Covid average levels, crimping household spending and homebuilding.

Downside risks for Chinese growth remain.
- Chinese households are overleveraged, asset prices are overvalued and consumer confidence is weak.
- While Chinese authorities have announced numerous small measures aiming at boost the economy, it remains to be seen whether they will have a durable impact.
Aside from China, there are a number of other risks that could impact negatively on the economy.
- Global inflation proves persistent requiring further policy tightening offshore, leading to slower global growth and weaker demand for New Zealand's exports.
- The recent flare-up in the Middle East could develop into a regional conflict, weighing on business confidence here and abroad.
- A severe El Nino could depress agricultural production in the coming summer.
Inflation dampening impact of migration flows.
- Migrant inflows are helping reduce labour shortages and wage pressures, which should help to moderate services/non-tradeable inflation over the coming year.
- Business surveys highlight a very sharp easing in labour market pressures.
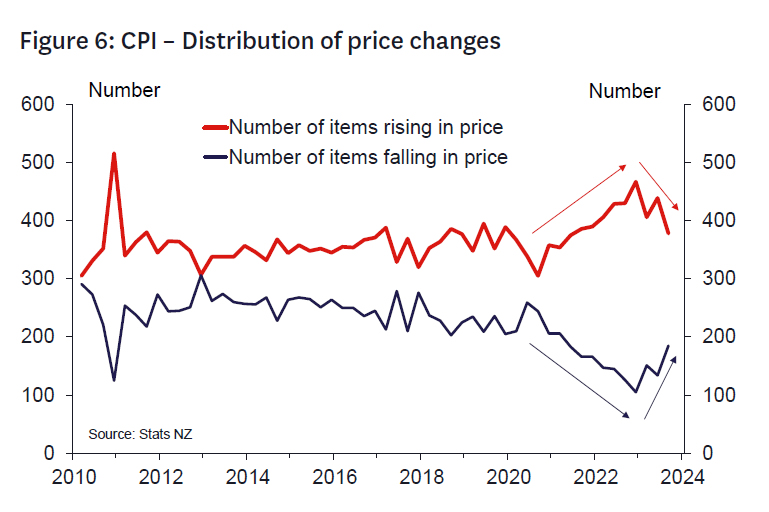
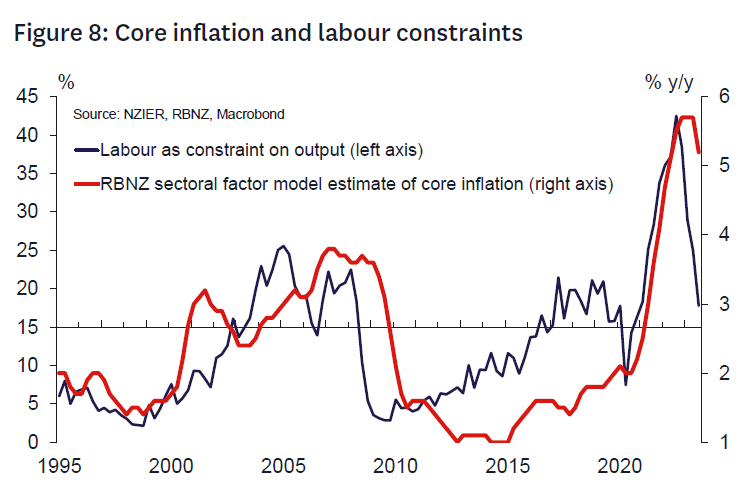
Core inflation proves less sticky than feared (see Figure 6,8).
- Encouragingly, inflation expectations have continued to decline despite a rise in petrol prices in recent months, suggesting that the RBNZ's credibility remains intact.
- Increasingly fewer items are rising in price and more items are falling price, suggesting the inflation surge is already narrowing.
Fiscal policy is likely to be more contractionary following the recent General Election.
- The National Party intends to run a modestly more contractionary fiscal policy than the outgoing government, and its likely coalition partners could lead policy to be tighter still.
- At the very least, the risk of fiscal targets being missed seems likely to be lowered.
EUR/AUD Bearish Breakdown Supported by Additional China Fiscal Stimulus and AU Inflation
- Weak PMI readings from the Eurozone, an increase in China’s budget deficit ratio, and renewed inflationary pressures in Australia may trigger a persistent bearish sentiment loop in EUR/AUD.
- Watch the key short-term resistance at 1.6700 for EUR/AUD.
- A break below 1.6250 key medium-term support on the EUR/AUD may trigger a multi-week bearish impulsive down move.
The Euro (EUR) tumbled overnight throughout the US session as it erased its prior gains against the US dollar recorded on Monday, 23 October; the EUR/USD shed -104 pips from yesterday’s intraday high of 1.0695 to close the US session at 1.0591, its weakest performance in the past seven sessions.
Yesterday’s resurgence of the USD dollar strength has been attributed to a robust set of October flash manufacturing and services PMI data from the US in contrast with weak readings seen in the UK and Eurozone that represented stagflation risks.
Interestingly, the Aussie dollar (AUD) has outperformed the US dollar where the AUD/USD managed to squeeze out a minor daily gain of 21 pips by the close of yesterday’s US session. The resilient movement of the AUD/USD has been impacted by positive news flow out from China, Australia’s key trading partner.
China’s national legislature has just approved a budgetary plan to raise the fiscal deficit ratio for 2023 to around 3.8% of its GDP which was above the initial 3% set in March and set to issue additional sovereign debt worth 1 trillion yuan in Q4. This latest round of additional fiscal stimulus suggests that China’s top policymakers are expanding their initial targeted measures to address the ongoing severe liquidity crunch in the domestic property market as well as to reverse the persistent weak sentiment inherent in the stock market.
In addition, the latest set of Australia’s inflation data surpassed expectations has also reinforced another layer of positive feedback loop in the Aussie dollar which in turn may put Australia’s central bank, RBA on a “hawkish guard” against cutting its policy cash rate too soon.
The less lagging monthly CPI Indicator has risen to an annualized rate of 5.6% in September, above consensus estimates of 5.4%, and surpassed August’s reading of 5.2% which has translated into a second consecutive month of uptick in inflationary growth.
In the lens of technical analysis, a potential bearish configuration setup has emerged in the EUR/AUD cross pair from a short to medium-term perspective.
Major uptrend phase of EUR/AUD is weakening
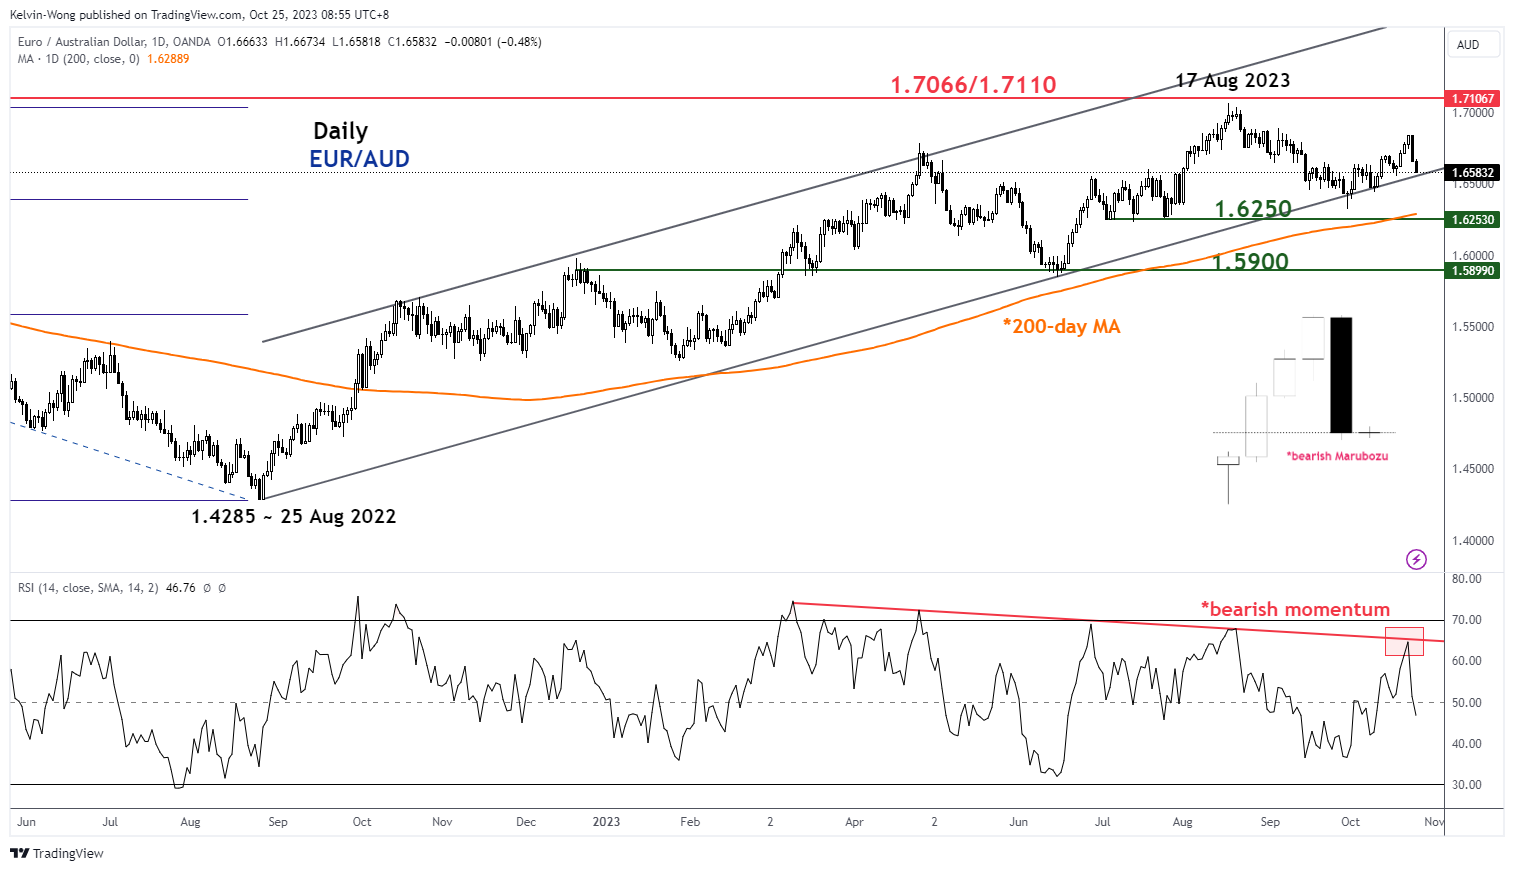
Fig 1: EUR/AUD medium-term trend as of 25 Oct 2023 (Source: TradingView, click to enlarge chart)
Even though the price actions of the EUR/AUD have been oscillating within a major ascending channel since its 25 August 2023 low of 1.4285 and traded above the key 200-day moving average so far, the momentum of this up movement is showing signs of bullish exhaustion.
Yesterday (24 October) price action ended with a daily bearish reversal “Marubozu” candlestick coupled with the daily RSI momentum indicator that retreated right at a significant parallel resistance in place since March 2023 at the 65 level which suggests a revival of medium-term bearish momentum.
EUR/AUD bears are now attacking the minor ascending support
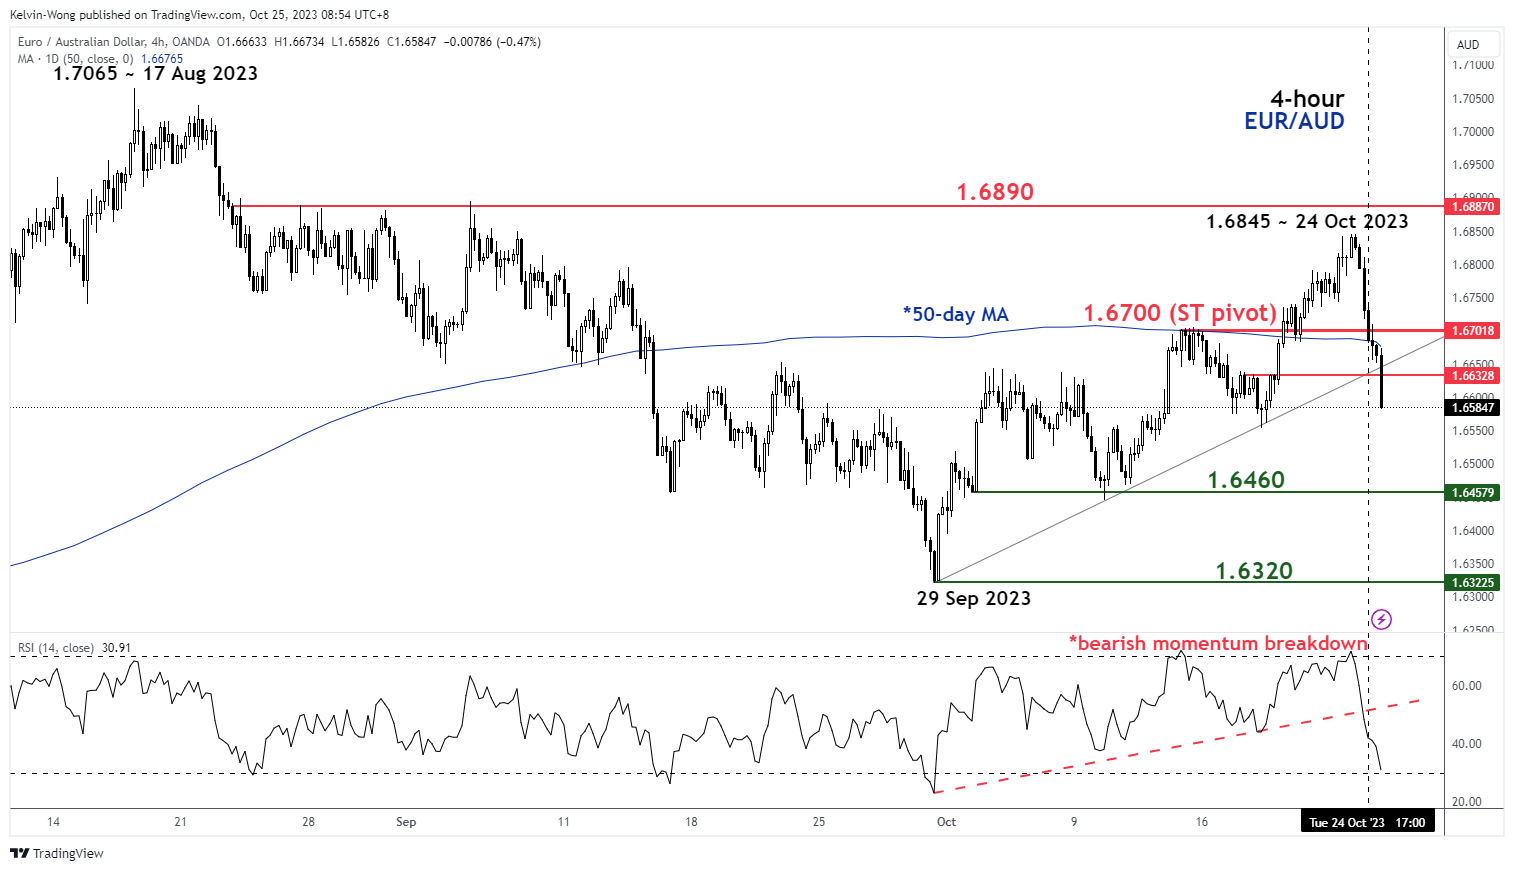
Fig 2: EUR/AUD minor short-term trend as of 25 Oct 2023 (Source: TradingView, click to enlarge chart)
The EUR/AUD has now staged a bearish price action follow-through via the breakdown of its minor ascending support from its 29 September 2023 low after a momentum bearish breakdown that was flashed earlier yesterday (24 October) during the European session as seen from the 4-hour RSI momentum indicator.
Watch the 1.6700 key short-term pivotal resistance (also the 50-day moving average) for a further potential slide toward the intermediate supports of 1.6460 and 1.6320 in the first step.
On the other hand, a clearance above 1.6700 invalidates the bearish tone to see the next intermediate resistance coming in at 1.6890.
BoC to hold, with hawkish untone?
BoC rate decision is today's market highlight, as the consensus veers towards maintaining interest rate at 5.00%. The potential for a rate hike has dwindled, especially after the September CPI data revealed a more rapid deceleration in inflation than anticipated. Now, speculations swirl regarding the possibility of a "hawkish hold," which leaves the door open for further tightening.
Market consensus on the BoC's next moves, however, isn't unanimous. A recent Reuters poll showcased a split opinion. A slim majority of 8 of the 18 economists surveyed perceive a a "high" likelihood of another hike. As for rate reductions, opinions stand divided too. 19 economists project rates falling beneath the current benchmark by the end of June, while 11 anticipate maintaining or even exceeding the current level.
As the BoC is set to unveil its latest growth and inflation forecasts, market participants are keenly awaiting insights that might shed light on the bank's future monetary stance.
Amid these discussions, the Canadian Dollar isn't faring well, even when pitted against the underperforming Yen. Risk is mildly on the downside for CAD/JPY as long as 109.96 resistance holds. Deeper fall is slightly in favor as to 107.51 support and below to extend the corrective pattern from 111.14 high. While a break of 109.96 will resume the rebound from 107.51. Breaking 111.14 to resume larger up trend is not expected. So upside potential is limited for the near term.
Aussie soars on anticipated RBA Nov hike; GBP/AUD targets 1.8854 support
Australian Dollar experienced a notable surge following the release of higher-than-anticipated consumer inflation figures. The data illustrates an accelerated quarterly inflation rate for Q3, and a more modest deceleration in the annual inflation rate than projected. Furthermore, the monthly CPI has been on the rise for two consecutive months. Given this backdrop, market participants are now anticipating another 25bps rate hike by RBA in their upcoming November 7th meeting, pushing the rate to 4.35%.
For a deeper understanding, one can refer to the minutes from RBA's October meeting which highlighted the Board's "low tolerance" towards unexpected surges in inflation. Adding weight to these expectations, Governor Michelle Bullock made it clear just a day prior, stating, "The Board will not hesitate to raise the cash rate further if there is a material upward revision to the outlook for inflation."
GBP/AUD's steep decline this week argues that corrective rebound from 1.8854 has completed at 1.9339 already. That came after failure to sustain above 55 D EMA (now at 1.9226). Risk will now stay on the downside as as 1.9339 resistance holds, in case of recovery. Break of 1.8854 support will confirm resumption of whole fall from 1.9967 to 61.8% projection of 1.9967 to 1.8854 from 1.9339 at 1.8651 next.
Australia CPI slows to 5.4% yoy in Q3, but rises to 5.6% yoy in Sep
Australia's CPI for Q3 registered a 1.2% qoq rise, exceeding expectation of 1.1% qoq and marking an acceleration from the previous quarter's 0.8% qoq. Notably, some of the most pronounced price hikes were observed in automotive fuel (+7.2%), rents (+2.2%), new dwelling purchases by owner-occupiers (+1.3%), and electricity (+4.2%).
Over the twelve months, inflation saw a deceleration, with CPI moving from 6.0% yoy to 5.4% yoy in Q3. However, this figure surpassed the anticipated 5.3% yoy. It's essential to note that this is the third consecutive quarter where the annual inflation rate has experienced a downturn, dropping from its high of 7.8% in Q4 2022.
The trimmed mean CPI, which excludes volatile items, recorded a 1.2% qoq increase again outpacing the forecasted 1.1% qoq and the previous quarter's 1.0% qoq . When analyzing the annualized data, the trimmed mean CPI decelerated from 5.9% yoy to 5.2% yoy, surpassing the predicted 5.1% yoy.
Commenting on the latest figures, Michelle Marquardt, ABS head of price statistics, highlighted that "prices continued to rise for most goods and services." However, she also noted a few sectors that registered price declines, notably child care, vegetables, and domestic holiday travel and accommodation.

Furthermore, the monthly CPI for September recorded acceleration from 5.2% yoy to 5.6% yoy , which was above the anticipated 5.4% yoy. Significant price surges in this period were identified in Housing (+7.2%), Transport (+9.4%), and Food and non-alcoholic beverages (+4.7%).
Reflecting on these trends, Marquardt stated, "This is the second consecutive rise in the annual movement up from 5.2% in August and 4.9% in July. While many industries' price increases are slowing, automotive fuel has had large annual increases in the last two months, which has been driving the movement higher."
EURJPY Wave Analysis
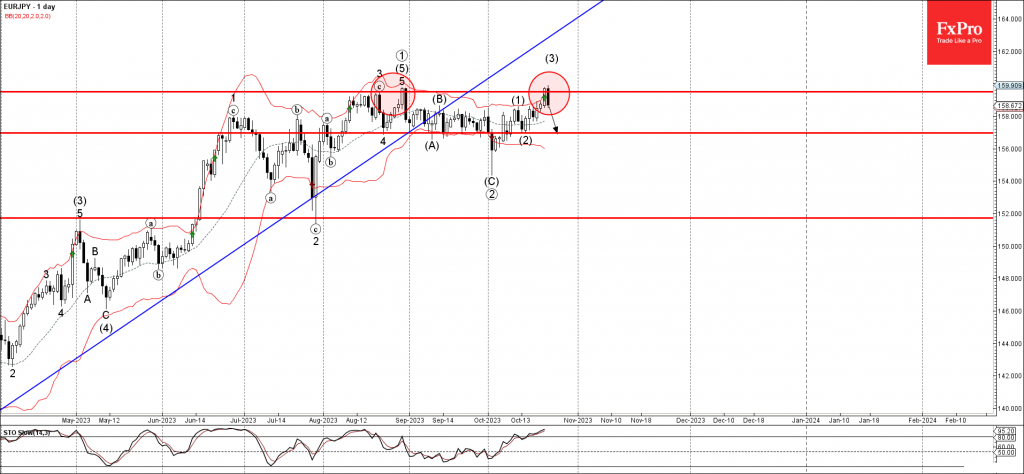
- EURJPY reversed from resistance level 159.50
- Likely to fall to support level 0.8100
EURJPY currency pair recently reversed down from the powerful resistance level 159.50 (which reversed the pair twice in August) intersecting with the upper daily Bollinger Band.
The downward reversal from the resistance level 159.50 is likely to form the daily Bearish Engulfing – which will stop the active impulse wave (3).
Given the strength of the resistance level 159.90, euro outflows and the overbought daily Stochastic, EURJPY can be expected to fall further toward the next support level 156.95 (low of the previous wave (2)).