

Sample Category Title
EURUSD Gets Rejected at Descending Trendline
- EURUSD stuck in a clear downward path, seems unable to recover
- Latest rebound encounters strong resistance at key trendline
- Momentum indicators endorse a resumption of the downtrend
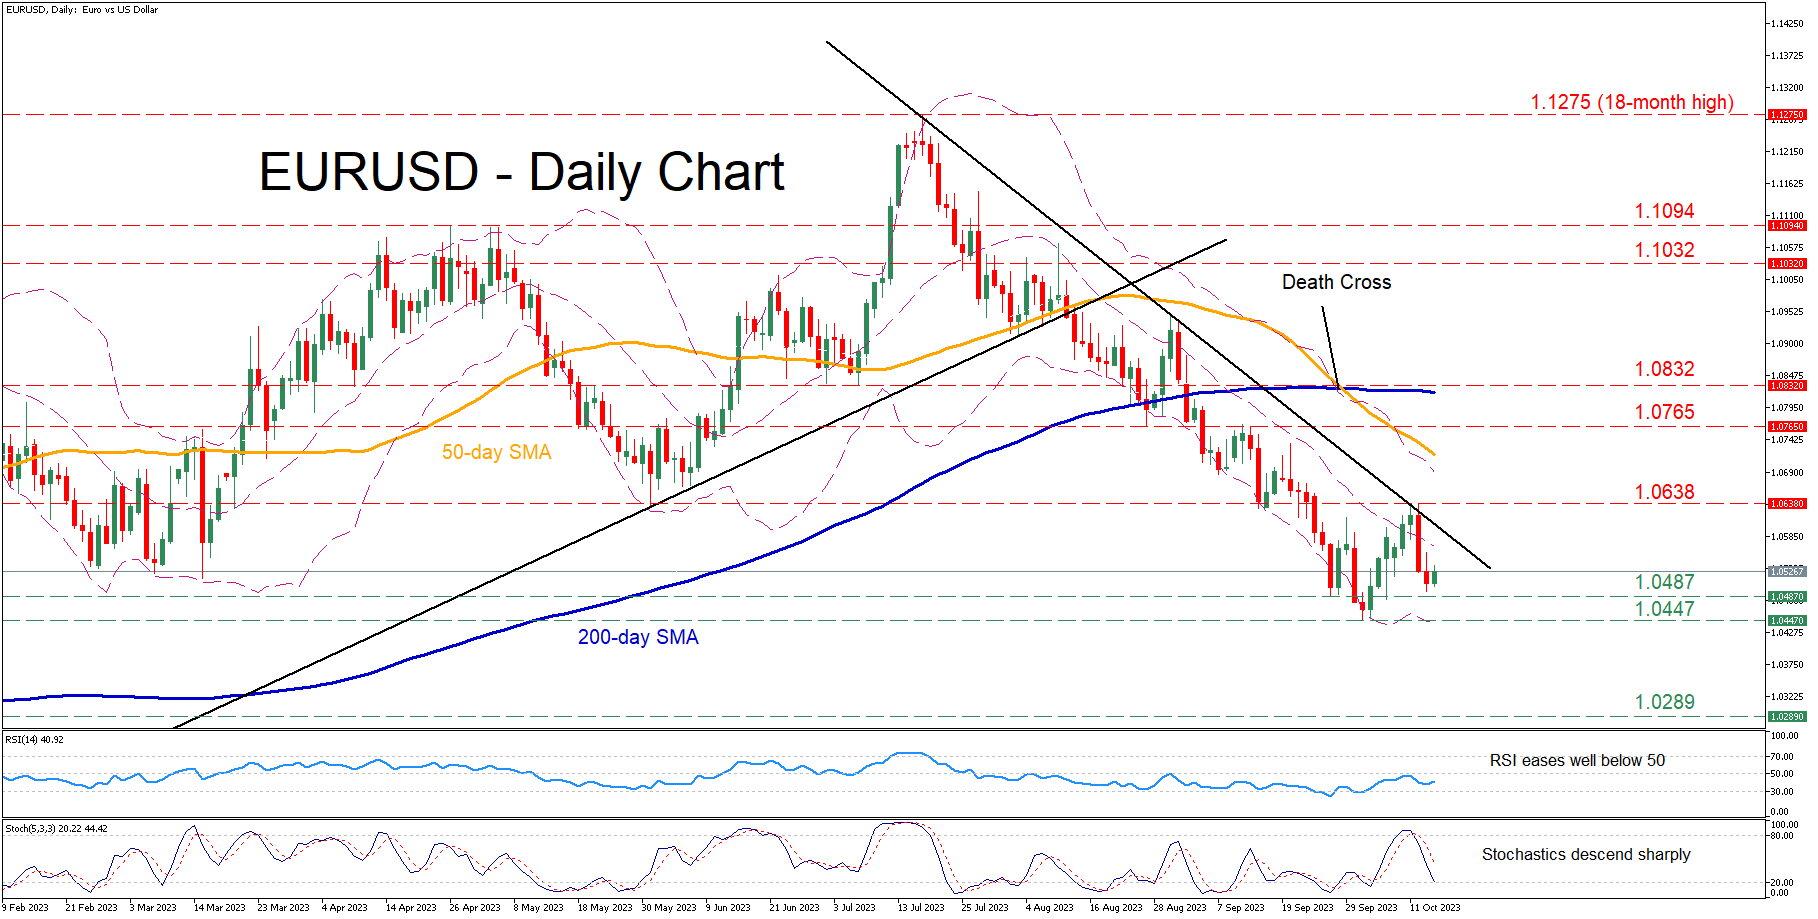
EURUSD has been in a steady retreat after peaking at the 18-month high of 1.1275, generating a series of lower highs and lower lows. Although the pair managed to find its feet at the 10-month bottom of 1.0487, its recovery faltered after hitting the descending trendline that connects its recent lower highs.
Should the bears attempt to push the price lower, the September support of 1.0487 could prove to be the first barrier for the pair to clear. A violation of that floor could pave the way for the 10-month low of 1.0447. Piercing through that region, the price might then slide towards the November 2022 support zone of 1.0289.
On the flipside, if the pair reverses back higher, initial advances could be rejected by the downward sloping trendline ahead of the recent resistance region of 1.0638. Conquering this barricade, the bulls could aim for the September resistance of 1.0765. Failing to halt there, the pair could then ascend towards the June-July support of 1.0832, which may serve as strong resistance in the future.
In brief, EURUSD remains a prisoner within its medium-term bearish pattern as its latest bounce proved to be short-lived. Hence, it’s clear that a break above its descending trendline is needed to revive the bulls’ hopes for a solid recovery.
Strong Data Prints Could Unsettle the Delicate Balance at BoE
- Key data releases coming up as the market digests geopolitical developments
- All eyes on CPI release (Wednesday 06:00 GMT) as the BoE is uneasy with strong prints
- Calendar also includes labour market information, average earnings data and retail sales
The Bank of England does not really favour further rate hikes
At the September meeting the BoE kept its bank rate unchanged at 5.25%. It was a very close call, reminiscent of past and more turbulent times at the BoE. Governor Bailey kept the door open to further tightening steps if there were to be evidence of more persistent inflationary pressures. However, the market is aware of BoE’s sclerotic stance in terms of delivering further rate hikes, and it is thus almost fully convinced that the tightening cycle has been completed.
Most investment houses have started debating the timing of the first rate cut, pleasing many BoE members. However, four members voted for a rate hike at the September meeting and, to their eyes, little has changed over the past month. All in all, with the geopolitical developments taking center stage and thus raising the possibility of new oil and natural gas rallies, their rhetoric is unlikely to shift towards the dovish spectrum.
Wednesday is inflation day
Understandably, the economic data releases determine, to a great extent, the BoE outlook, and this week is action-packed. On Wednesday, the September inflation report will be published. The headline CPI for August surprised on the downside by dropping to 6.7% YoY, the lowest print since February 2022. The market expects further deceleration at the annual rate to 6.5%. In comparison, the recent US CPI figure for September edged a tad higher to 3.7% YoY while Germany showed a sizeable drop to just 4.5% YoY increase.
It is evident that inflation in the UK remains elevated despite the numerous BoE rate hikes. A possible upside surprise on Wednesday, especially if it rises again above 7%, will not go down well with the hawks. Such an outcome will add fuel to the hawkish fire allowing them to increase their commentary and pressure for a 25bps rate hike move at the upcoming November meeting. This is probably the worst-case scenario for Governor Bailey as he has been the frontrunner of making measured monetary policy steps.
Earnings matter but retail sales show only marginal improvement
Crucially, on Tuesday the average earnings figures for August will be released as central banks globally have been all over this data. For example, in Japan the BoJ has pinned its hopes for some form of policy normalization on stronger earnings and the next round of wage negotiations.
UK consumers are probably happy to finally enjoy earnings increases above the inflation rate, but the same cannot be said for the BoE. Second-round effects are dreaded by central banks as they feed expectations of higher future inflation. The market is forecasting another strong print at 7.8% YoY at the average earnings (excluding bonuses) indicator, unchanged from the July figure.
In the meantime, the labour market remains very strong, and Tuesday’s report is unlikely to hold any surprises. Stronger earnings and a tight labour market should, in principle, support retail sales. However, despite some improvement seen recently, the yearly pace of retail sales remains in negative territory. This situation could possibly reflect the consumers’ concerns about the upcoming winter-related utilities bills, thus most likely affecting their consumer spending habits and putting a dent on the short-term growth outlook for the UK economy.
Euro-pound to remain range bound if CPI fails to surprise
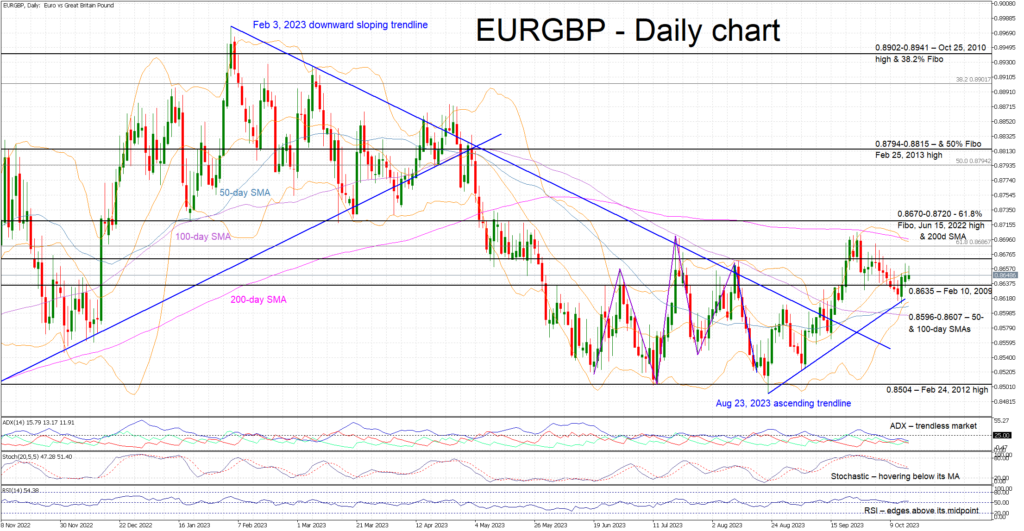
The consistent sell-off from the February 3 high has stopped as the euro-pound pair has been range-bound since early June. Attempts by both sides to stage sizeable moves have not materialized yet but this week’s data releases could reignite the pound bulls’ appetite, especially if an upside CPI surprise is recorded. In this case, a move below the 0.8596-0.8607 area could be considered plausible, potentially opening the door to a retest of the 2023 lows. On the flip side, euro bulls are anxiously trying to find an opening and push the euro-pound pair above the busy 0.8670-0.8720 region.
GBP/JPY Daily Outlook
Daily Pivots: (S1) 180.95; (P) 181.95; (R1) 182.62; More...
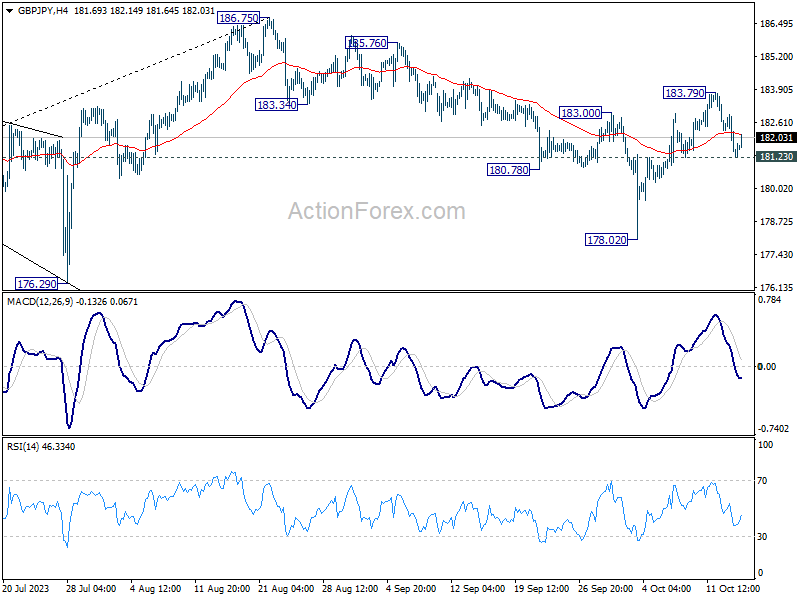
Intraday bias in GBP/JPY remains neutral at the point. For now, the favored case is still that correction from 186.75 has completed at 178.02. Above 183.79 will resume the rise from 178.02 to retest 186.75 high. However, break of 181.23 will dampen this view, and turn bias back to the downside for 178.02 instead.
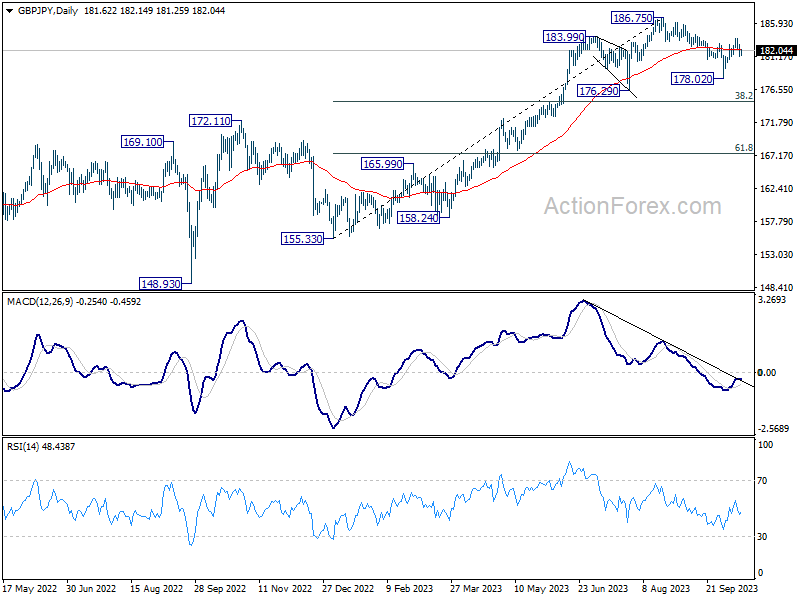
In the bigger picture, fall from 186.75 is seen as a corrective move only. As long as 176.29 support holds, larger up trend from 123.94 (202 low) should still be in progress. Break of 186.75 will target 195.86 (2015 high). Nevertheless, firm break of 176.29 will confirm medium term topping, and bring lengthier and deeper consolidations.
EUR/JPY Daily Outlook
Daily Pivots: (S1) 156.80; (P) 157.42; (R1) 157.80; More....
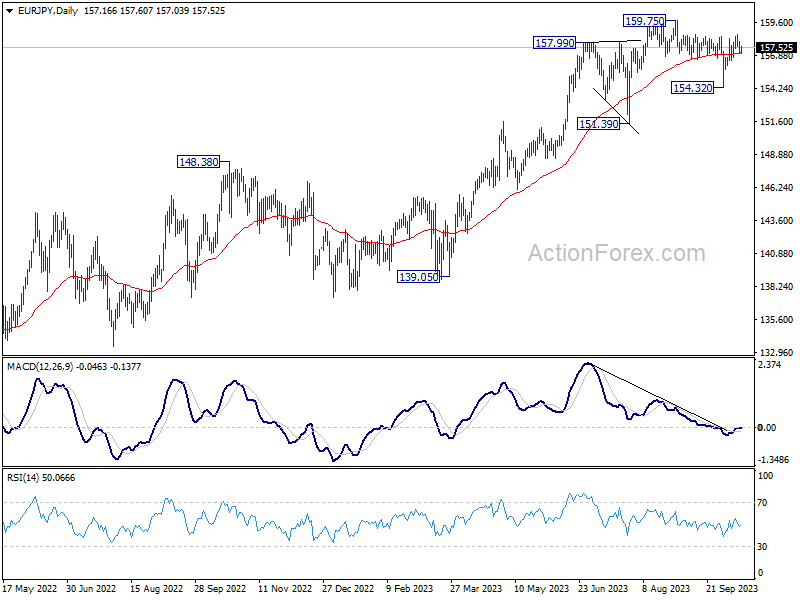
Intraday bias in EUR/JPY remains neutral at this point. For now, the favored case is still that correction from 159.75 has completed at 154.32. Above 158.60 will resume the rise from 154.32 and target 159.75 high. However, break of 156.50 will dampen this view, and bring another fall to extend the corrective pattern from 159.75.
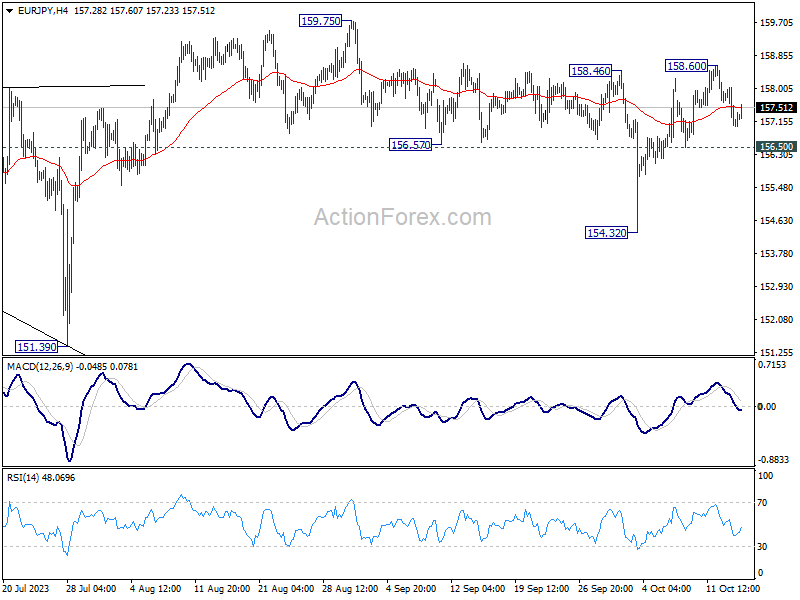
In the bigger picture, price actions from 159.75 are views as a corrective pattern. As long as 151.39 support holds, rise from 114.42 (2020 low) is expected to continue through 159.75 at a later stage. Nevertheless, firm break of 151.39 will confirm medium term topping, and bring lengthier and deeper correction.
EUR/GBP Daily Outlook
Daily Pivots: (S1) 0.8636; (P) 0.8651; (R1) 0.8667; More....
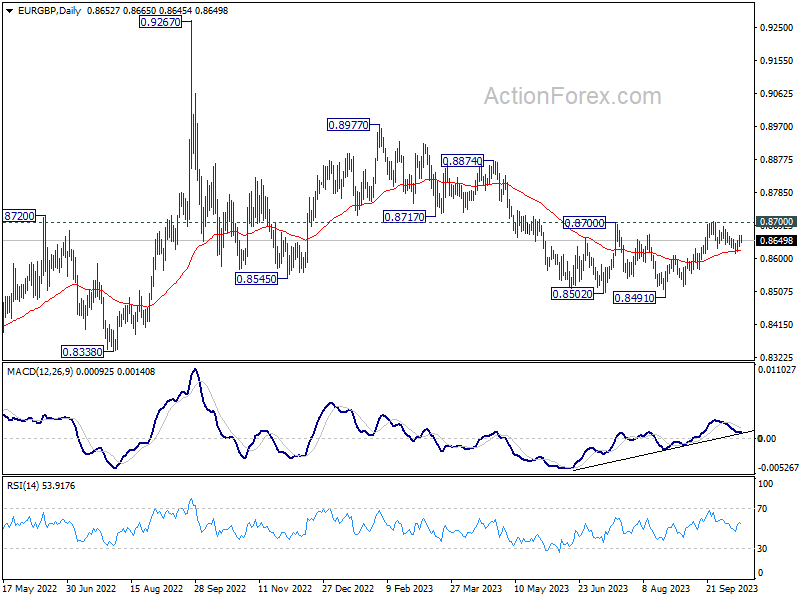
Intraday bias in EUR/GBP remains mildly on the upside for retesting 0.8700/4 resistance zone. Decisive break there will carry larger bullish implications. Nevertheless, break of 0.8614 will turn bias to the downside to resume the fall from 0.8704 instead.
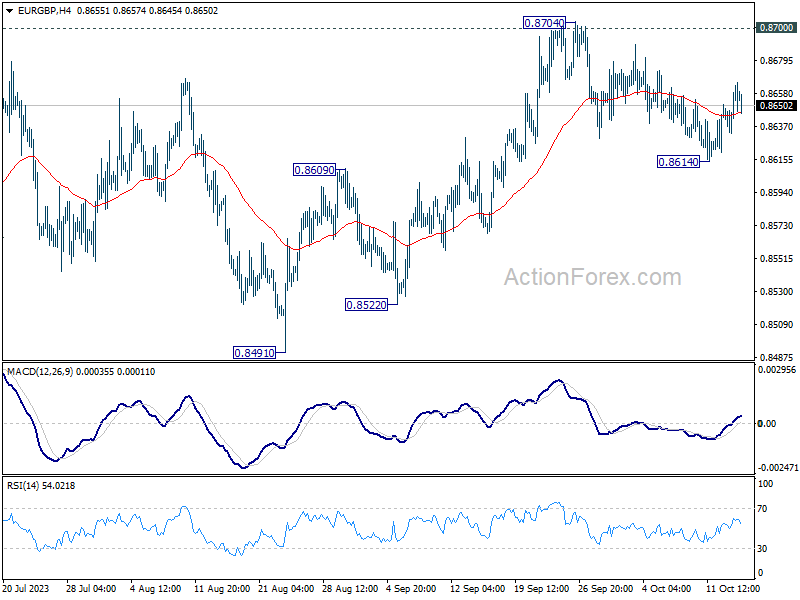
In the bigger picture, the down trend from 0.9267 (2022 high) is seen as part of the long term range pattern from 0.9499 (2020 high). Decisive break of 0.8700 resistance will argue that this decline has completed with three waves down to 0.8491. Rise from 0.8491 could then be another leg inside the pattern and targets 0.8977 and above. However, rejection by 0.8700 will keep the down trend alive for another fall through 0.8491 at a later stage.
EUR/AUD Daily Outlook
Daily Pivots: (S1) 1.6654; (P) 1.6680; (R1) 1.6715; More...
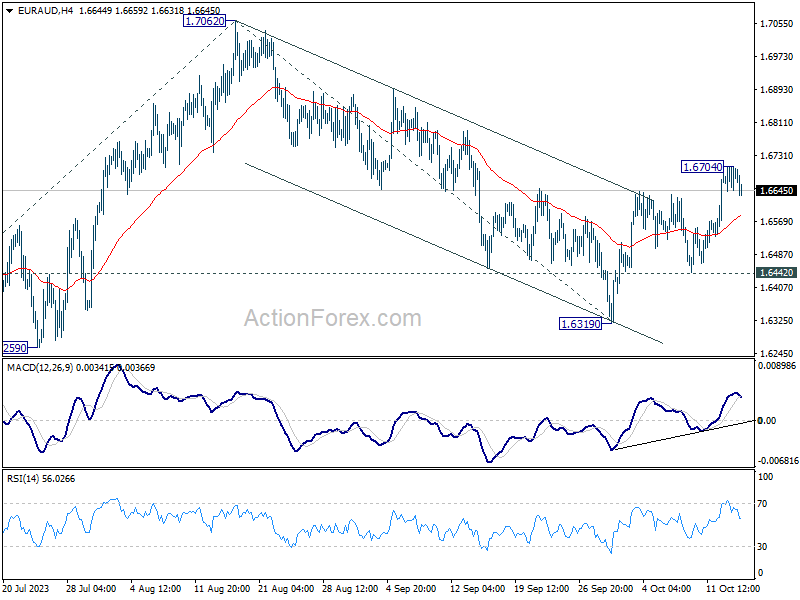
Intraday bias in EUR/AUD is turned neutral first with current retreat. But outlook is unchanged that correction from 1.7062 has completed at 1.6319. Above 1.6704 will resume the rise from 1.6319 to retest 1.7062 high. However, firm break of 1.6442 will dampen this view and turn bias back to the downside for 1.6319 support instead.
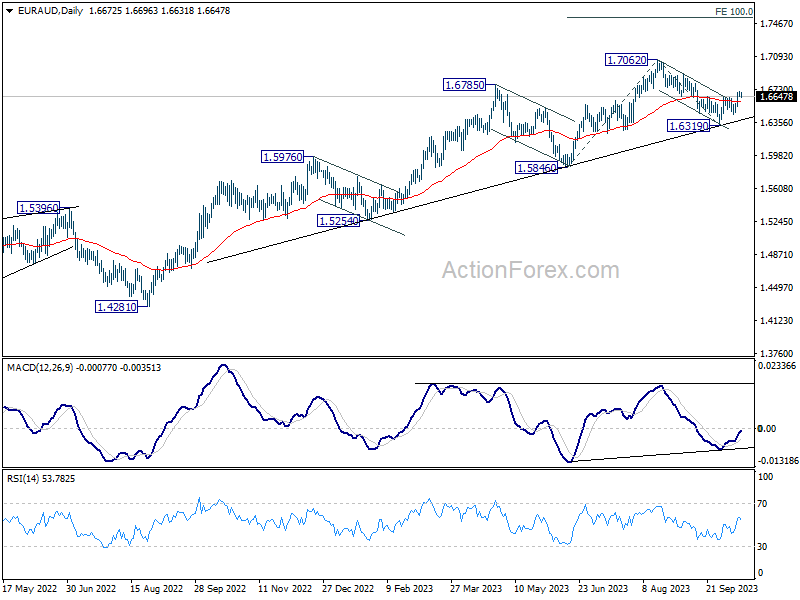
In the bigger picture, the strong support from medium term rising trend line indicates that rise from 1.4281 (2022 low) is still in progress. On resumption, next target is 100% projection of 1.5846 to 1.7062 from 1.6319 at 1.7353. In any case, outlook will stay bullish as long as 1.6319 support holds.
EUR/CHF Daily Outlook
Daily Pivots: (S1) 0.9435; (P) 0.9504; (R1) 0.9551; More...
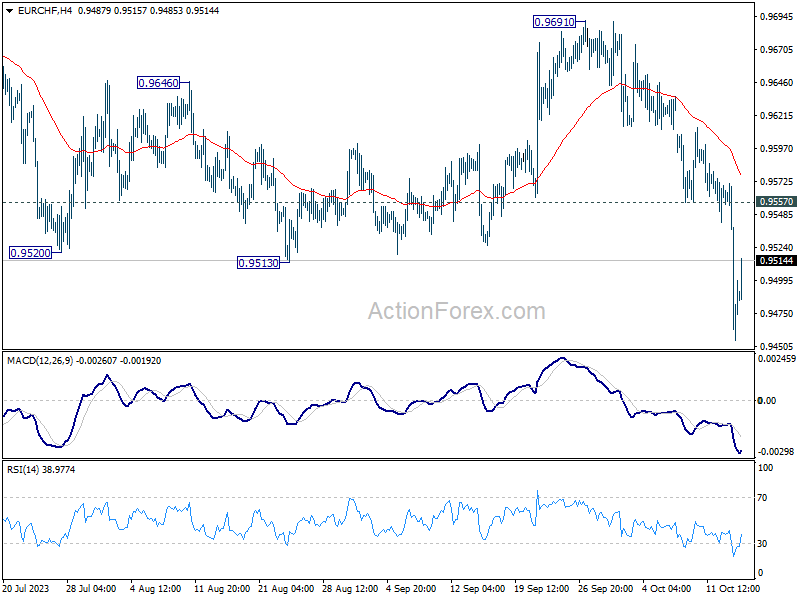
EUR/CHF recovers notably today but outlook stays bearish with 0.9557 resistance intact. Current fall is part of the whole down trend from 1.0095. Next target is 0.9407 medium term bottom. Nevertheless, break of 0.9557 will indicate short term bottoming and bring stronger rebound.
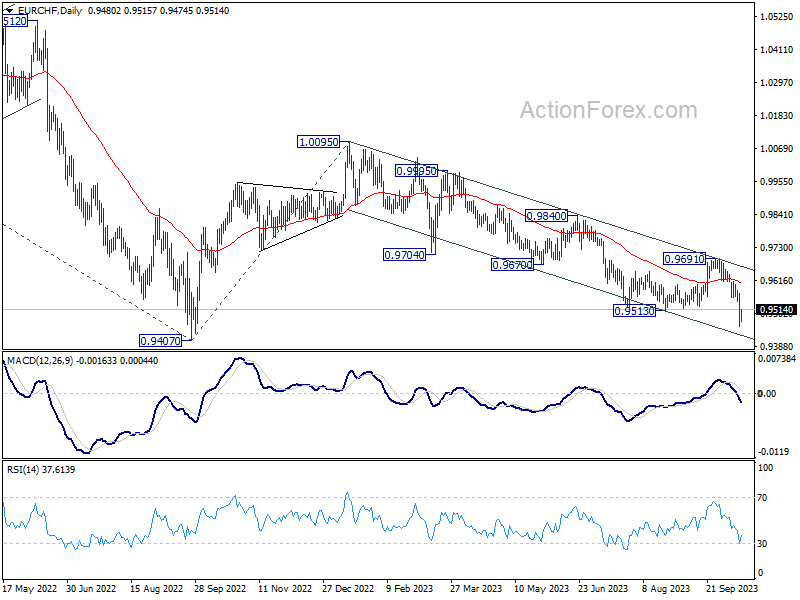
In the bigger picture, medium term outlook remains bearish with the cross capped well below falling 55 W EMA (now at 0.9782). Firm break of 0.9407 (2022 low) will confirm resumption of larger down trend from 1.2004 (2018 high). Next target will be 61.8% projection of 1.1149 to 0.9407 from 1.0095 at 0.9018. On the upside, break of 0.9691 resistance is needed to indicate medium term bottoming. Otherwise, outlook will stay bearish.
GBP/USD Restarts Decrease, EUR/GBP Aims Higher
GBP/USD started a fresh decline from the 1.2335 resistance zone. EUR/GBP is rising and might climb above the 0.8665 resistance.
Important Takeaways for GBP/USD and EUR/GBP Analysis Today
- The British Pound is again declining and trading below the 1.2200 support.
- There was a break below a key bullish trend line with support near 1.2220 on the hourly chart of GBP/USD at FXOpen.
- EUR/GBP is rising and trading above the 0.8650 zone.
- There was a break above a major bearish trend line with resistance near 0.8635 on the hourly chart at FXOpen.
GBP/USD Technical Analysis
On the hourly chart of GBP/USD at FXOpen, the pair attempted a fresh increase above 1.2200. However, the British Pound failed above 1.2320 and started a fresh decline against the US Dollar.
There was a clear move below 1.2250 and the 50-hour simple moving average. The bears pushed the pair below a key bullish trend line with support near 1.2220. It opened the doors for a move toward the 1.2120 level.
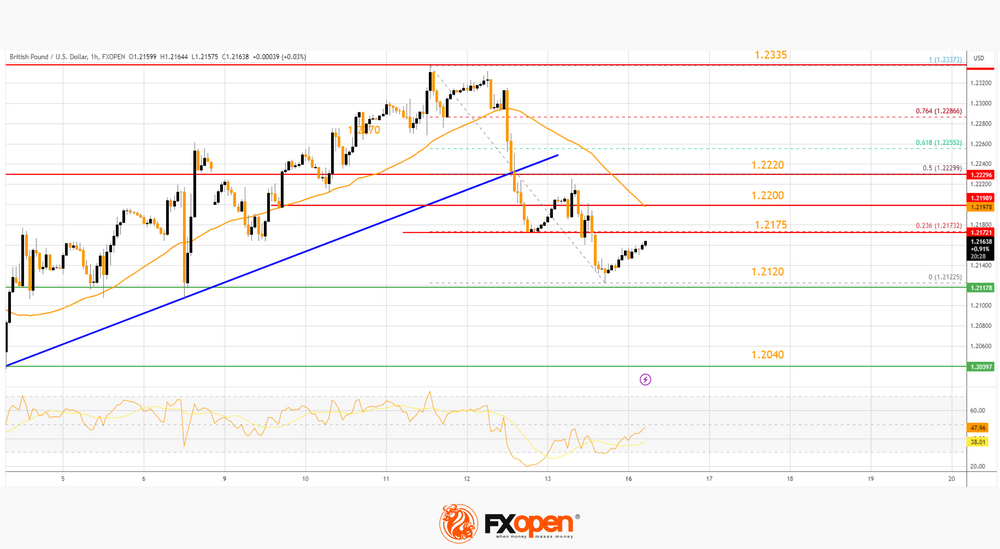
A low is formed near 1.2122 and the pair is now consolidating losses. On the upside, the GBP/USD chart indicates that the pair is facing resistance near the 23.6% Fib retracement level of the downward move from the 1.2337 swing high to the 1.2122 low at 1.2175.
The next major resistance is near the 50-hour simple moving average at 1.2200. The main resistance could be the 50% Fib retracement level of the downward move from the 1.2337 swing high to the 1.2122 low at 1.2220.
A close above the 1.2220 resistance zone could open the doors for a move toward 1.2335. Any more gains might send GBP/USD toward 1.2450.
On the downside, there is a key support forming near 1.2120. If there is a downside break below the 1.2120 support, the pair could accelerate lower. The next major support is near the 1.2040 zone, below which the pair could test 1.2020. Any more losses could lead the pair toward the 1.2000 support.
EUR/GBP Technical Analysis
On the hourly chart of EUR/GBP at FXOpen, the pair started a steady increase from the 0.8620 zone. The Euro traded above the 0.8635 pivot level to enter a positive zone against the British Pound.
Besides, there was a break above a major bearish trend line with resistance near 0.8635. The EUR/GBP chart suggests that the pair settled above the 50-hour simple moving average and 0.8650. Finally, it faced sellers near 0.8665.
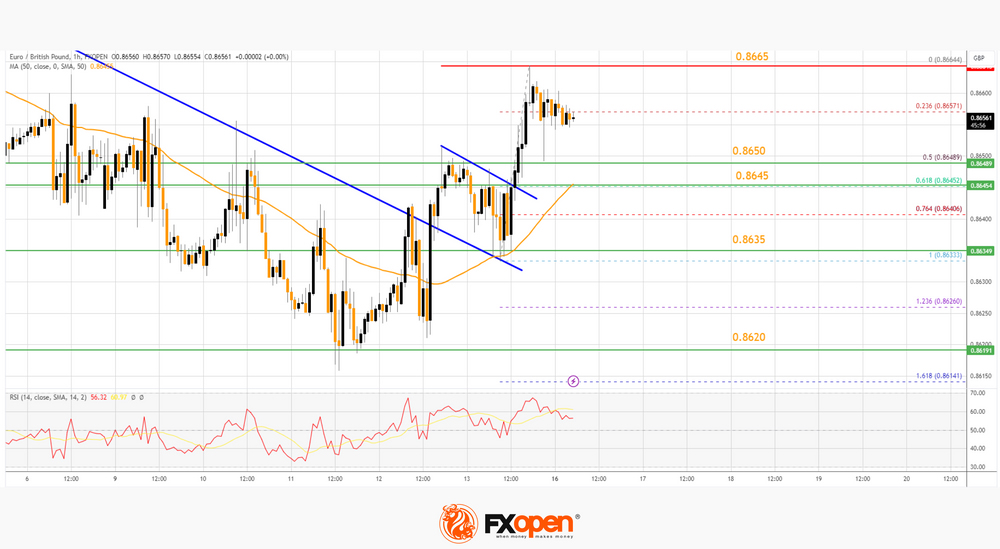
It is now correcting gains and trading below the 23.6% Fib retracement level of the recent increase from the 0.8633 swing low to the 0.8664 high.
Immediate support sits near the 50% Fib retracement level of the recent increase from the 0.8633 swing low to the 0.8664 high at 0.8650. The next major support is near the 50-hour simple moving average at 0.8645.
The main support is 0.8635. A downside break below the 0.8635 support might call for more downsides. In the stated case, the pair could drop toward the 0.8620 support level.
Immediate resistance is near the recent high at 0.8665. The next major resistance could be 0.8680. A close above the 0.8680 level might accelerate gains. In the stated case, the bulls may perhaps aim for a test of 0.8720. Any more gains might send the pair toward the 0.8780 level.
This article represents the opinion of the Companies operating under the FXOpen brand only. It is not to be construed as an offer, solicitation, or recommendation with respect to products and services provided by the Companies operating under the FXOpen brand, nor is it to be considered financial advice.
New Zealand’s Opposition Secured a Parliamentary Election
Markets
There were signs on Friday that Israel was preparing for an imminent ground invasion in Gaza City, upscaling the conflict into an outright war. With the weekend looming, markets sought shelter in core bonds. US Treasury yields fell between 1.4 and 10.1 bps. The front end underperformed after consumer confidence from the Michigan University showed US inflation expectations unexpectedly shot up in October. The one‐year ahead gauge rose from 3.2% to 3.8% while the longer‐term indicator (5‐10 year) swelled from 2.8% to 3%. Confidence levels themselves dropped more than expected, from 68.1 to 63 on a combination of weaker current and future conditions. German yields followed the US, with declines ranging from 2.2 bps to 4.9 bps. Peripheral spreads rose. Italy underperformed, adding 6 bps to top 200 bps again. Equities lost 1.5% in Europe and up to 1.2% in the US (Nasdaq). Oil prices rallied almost 6%, resulting in Brent settling above $90/b again. Gold (+3.5%, $1932) smashed the 50, 100 and 200 daily moving average in one go. The US dollar held the upper hand against most peers including the euro. EUR/USD finished just south of 1.05. Gains for the DXY (106.648) were marginal as a slightly stronger JPY offered some counterweight (USD/JPY eased to 149.57).
Friday’s moves are all going a bit in reverse this morning. The feared invasion ultimately didn’t take place, be it (officially) due to unfavourable weather conditions. But combined with the US ramping up diplomatic efforts to prevent the regional crisis to escalate into a wider one (that could include the likes of Iran), it is taking some pressure of markets. Treasuries and Bunds give up some of Friday’s gains. The poor performance on WS does leave traces on Asian‐Pacific stocks but indices quickly stabilized after gapping lower at the open. The US dollar trades on the backfoot. Poland’s zloty outperforms following the opposition’s election victory (see below).
Today’s empty economic calendar probably keeps the Israeli‐Hamas conflict in the spotlights. We could see current moves (ie slightly weaker dollar, core bond yields adding a few bps) extend into European and US dealings but we don’t expect any excessive moves. Needless to say the situation remains very delicate. There are several Fed and ECB speeches scheduled for today and by extension later this week. Economic data include US retail sales tomorrow and Chinese Q3 GDP growth on Wednesday. The UK takes center stage with a broad update about the labour market, inflation and retail sales.
News and views
An exit poll conducted by Ipsos suggests that the Polish opposition centered around the Civic Platform from former PM Tusk will be able to dethrone the ruling PiS‐party from current deputy prime minister Kaczynski which has been in power since 2015. PiS is projected to remain the biggest Polish political party, winning 36.8% of the vote, and should normally get a first shot at trying to form a government. Together with its likely coalition party, the extreme‐right Confederation (6.2%), it gathers only 212 seats in the 460‐seat Polish parliament though. Tusk’s Civic Platform (31.6%), the center‐right Third Way (13%) and the Left (8.6%) do have a route to a parliamentary majority (248 seats). Voter turnout was on course for a record with Ipsos putting it at almost 73% (up from 62% in 2019). Officials (full) results aren’t expected before late today or even early tomorrow, but Tusk is already claiming victory while Kaczynski prepares for a stay in opposition. The Polish zloty was anticipating such (pro‐EU) outcome, rallying from EUR/PLN 4.65 at the beginning of the month to 4.55 ahead of the vote. This morning, PLN extends its run to the EUR/PLN 4.45 area.
New Zealand’s opposition secured a parliamentary election as well. The National Party gained 39% of the vote (50 seats; +16) compared to 23% for the ruling Labour party (34 seats; ‐28). Christopher Luxon’s National Party is likely to team up with ACT New Zealand (11 seats; +1) and NZ First (8 seats; +8) to get control in the 120‐seat NZ parliament. All three likely participants campaigned on cutting government spending and getting tougher on criminals and welfare beneficiaries while they favor farmer‐friendly policies and could become somewhat more pro‐China. The kiwi dollar is marginally stronger at NZD/USD 0.5925 this morning (from last week’s close at 0.5885) but general USD weakness is the likely reason.
CHF/JPY Further Potential Up Move Reinforced by CHF Safe Haven Status
- CHF was the top-performing currency among the USD pairs in the past five days.
- An uptick in geopolitical risk premium has reinforced CHF’s safe haven status.
- CHF/JPY short-term and major uptrend phases remain intact with the next intermediate resistance coming in at 167.90/168.30.
The CHF/JPY has staged the expected impulsive up move sequence and met the 165.20/165.60 intermediate resistance zone as highlighted in our previous analysis; the cross-pair printed an intraday high of 166.12 last Friday, US session, 13 October.
The current short-term uptrend phase in place since the 3 October 2023 low of 160.01 has been driven by the momentum factor supporting the CHF/JPY’s major uptrend phase since the 13 January 2023 low of 137.44.
Also, the rising geopolitical risk premium trigged by the current Israel-Hamas conflict has not abated, and now with the latest attacks orchestrated over the weekend by Hezbollah, a militant group backed by Iran on Israeli army posts in the north may have caused a further rift among key stakeholders in the Middle East region which in turn can further escalate the turmoil in the current “fragile state” of international relations affairs.
CHF maintains safe haven status but not JPY
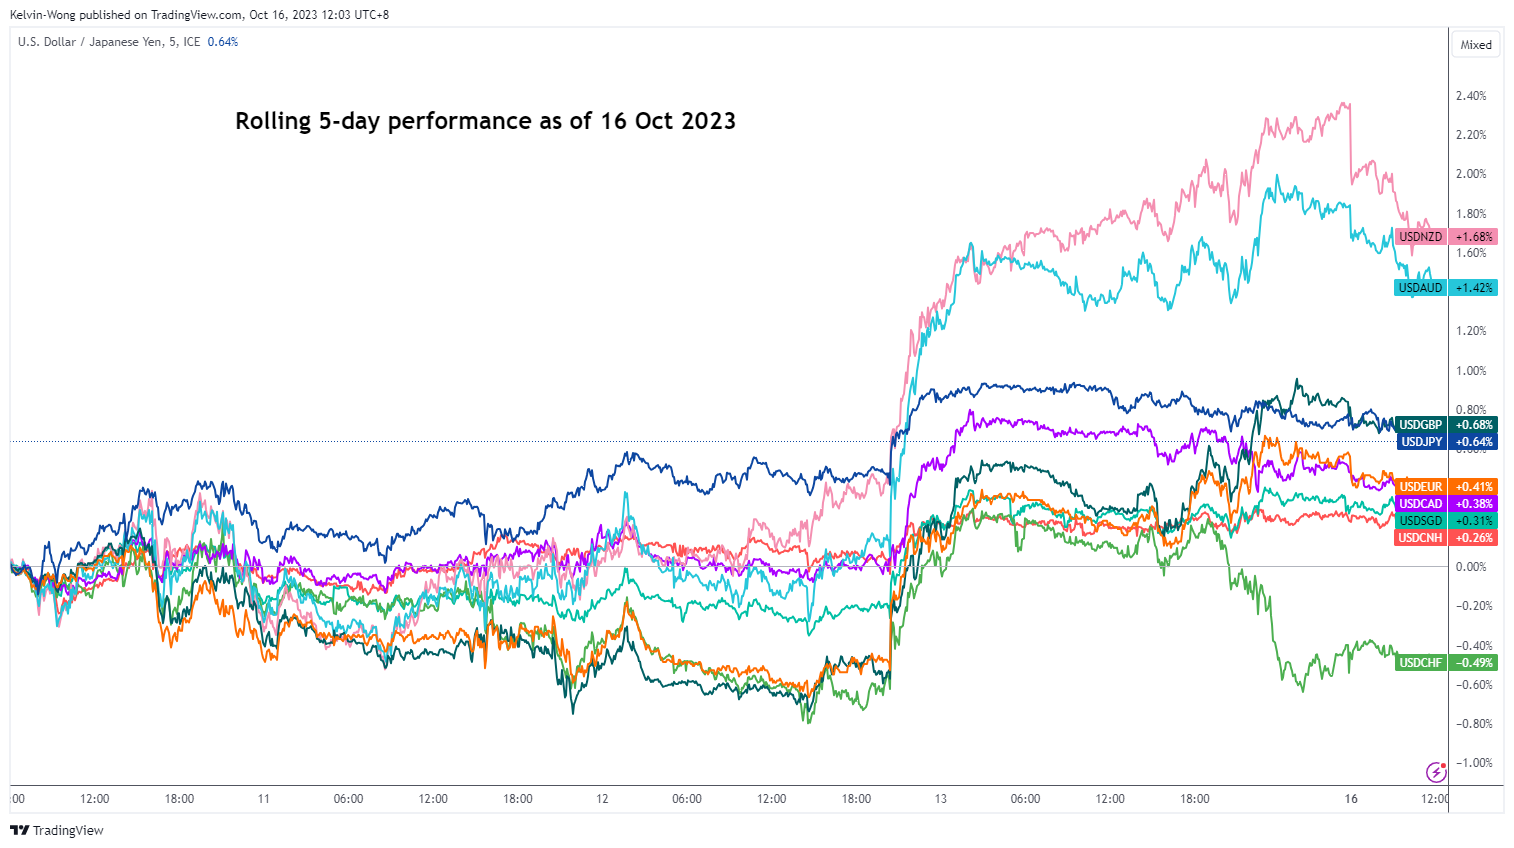
Fig 1: USD major pairs rolling 5-day performance as of 16 Oct 2023 (Source: TradingView, click to enlarge chart)
In in state of rising geopolitical tensions, the safe-haven proxy currencies, the Japanese yen (JPY) and Swiss franc (CHF) tend to be the likely outperformers in the foreign exchange market. Based on a five-day rolling performance basis as of 16 October 2023, the CHF has indeed climbed up against the US dollar where the USD/CHF rate is the worst performer among the US dollar major pairs that recorded a loss of -0.48% at this time of the writing.
However, the JPY has lost its safe haven status this time round as the USD/JPY rate has been firmed above 148.25 (the intermediate support in place since 5 October 2023) due to a “hesitant” Bank of Japan (BoJ) that does not give any clear indication of bringing forward its plans in the removal of negative interest rates policy.
Major uptrend supported by bullish momentum
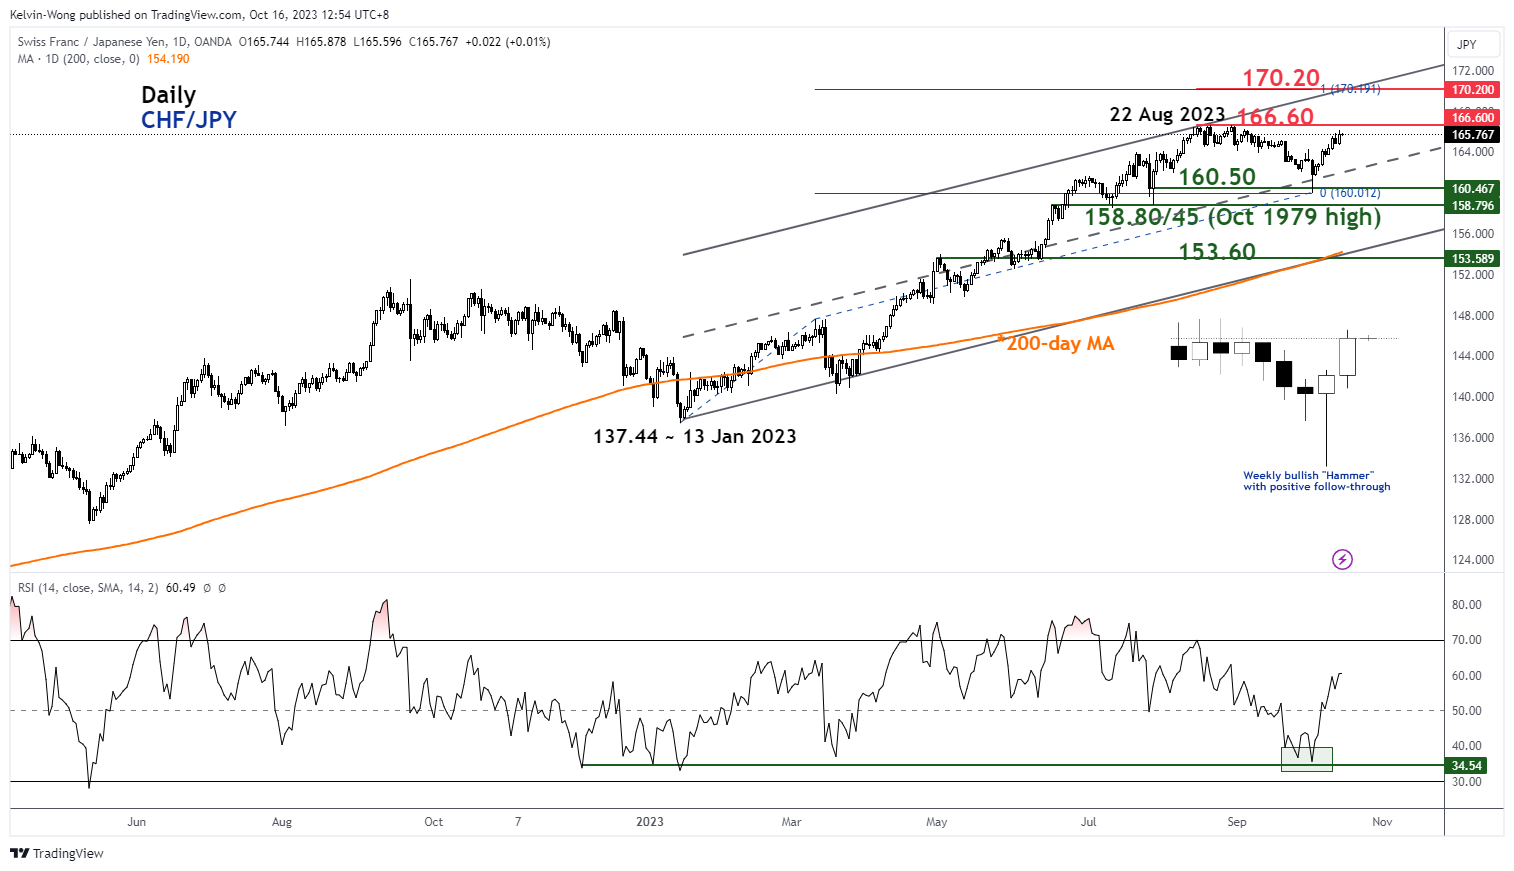
Fig 2: CHF/JPY major & medium-term trends as of 16 Oct 2023 (Source: TradingView, click to enlarge chart)
After the appearance of the weekly bullish reversal “Hammer” candlestick sighted for the week ended 6 October 2023, the price actions of the CHF/JPY had a positive follow-through that led to the formation of a weekly bullish long-bodied candlestick that ended on 13 October that surpassed the highs of the prior weekly candlesticks seen in the past three weeks.
These observations coupled with an uptick seen in the daily RSI momentum indicator that has yet to reach its overbought zone (above the 70 level) suggest that medium-term bullish momentum remains intact and has increased the odds of a clearance above the 166.60 intermediate resistance (22/30 August 2023 swing highs).
164.75 is the key support to watch in the short-term
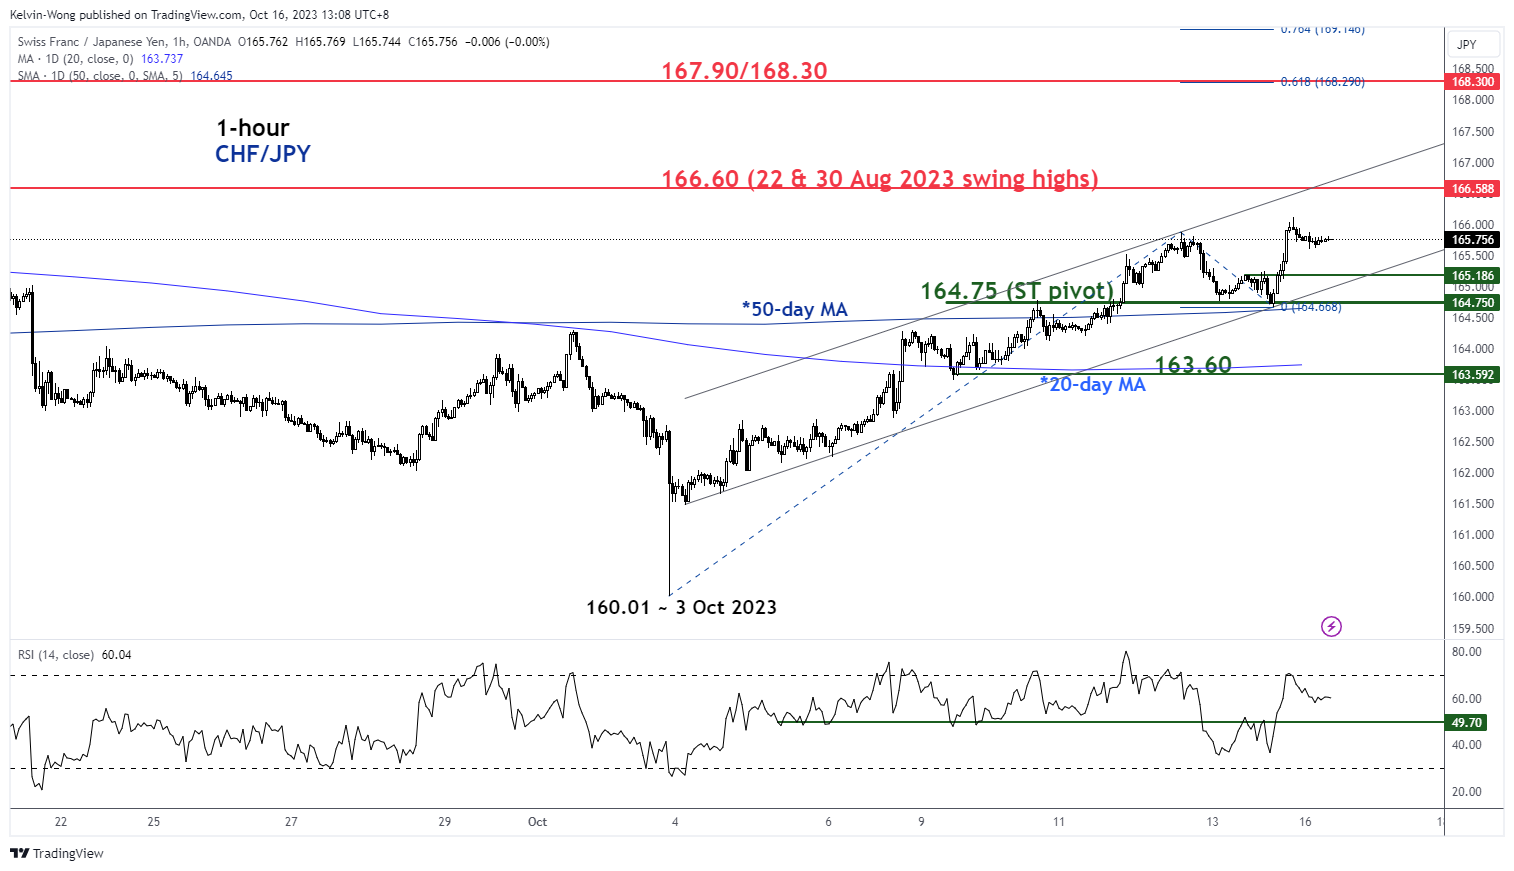
Fig 3: CHF/JPY minor short-term trend as of 16 Oct 2023 (Source: TradingView, click to enlarge chart)
Watch the 164.75 key short-term pivotal support (also the 50-day moving) on the 1-hour chart of CHF/JPY to maintain its current bullish impulsive up move sequence within its short-term uptrend phase in place since the 3 October 2023 low.
A clearance above 166.60 sees the next intermediate resistance coming in at 167.90/168.30 (a Fibonacci extension cluster).
However, a break below 164.75 negates the bullish tone for a deeper pull-back towards the next support of 163.60 (20-day moving average, 9 October 2023 minor swing low & 38.2% Fibonacci retracement of the current up move from 3 October 2023 low to 13 October 2023 high).