Sample Category Title
EUR/USD Resumes Decline, Gold and Oil Prices Surge
Key Highlights
- EUR/USD failed to climb above 1.0650 and started a fresh decline.
- The Israel-Hamas war is sparking swing moves in the US dollar, gold, and oil prices.
- Gold prices surged above the $1,900 resistance zone.
- Crude oil prices recovered and retested the $88 resistance zone.
EUR/USD Technical Analysis
The Euro recovered above 1.0580, but it failed to surpass 1.0650 against the US dollar. EUR/USD topped near 1.0640 and started a fresh decline. The ongoing Israel-Hamas war is still dominating the Forex and Crypto market. Recently, Joe Biden warned Israel against occupying Gaza.
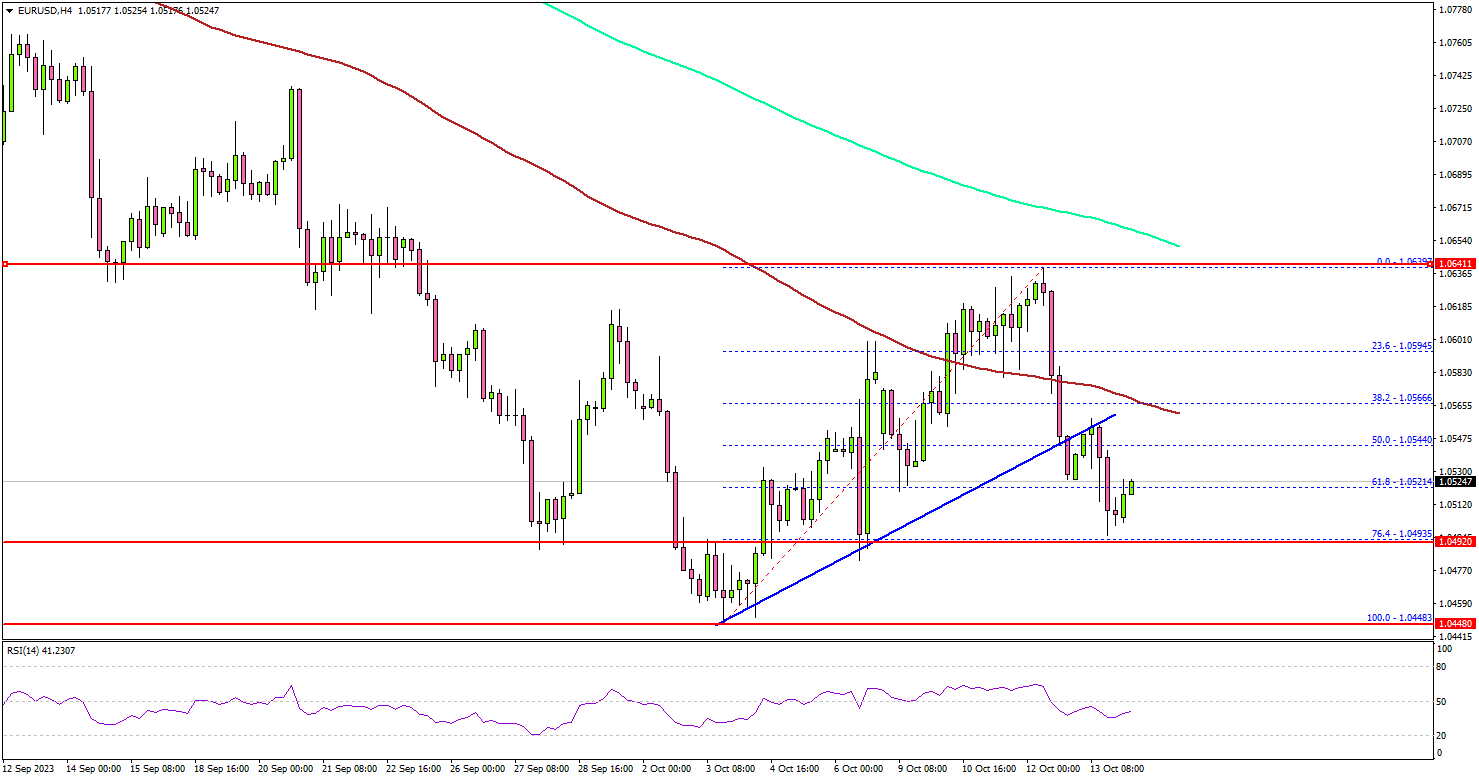
Looking at the 4-hour chart of EUR/USD, the pair declined below the 1.0565 support zone. There was a break below a key bullish trend line with support near 1.0560. The pair even settled below the 1.0550 level, the 100 simple moving average (red, 4 hours), and the 200 simple moving average (green, 4 hours).
It tested the 1.0500 support zone and the 76.4% Fib retracement level of the upward move from the 1.0448 swing low to the 1.0639 high.
If the bears remain in action, the pair could slide below 1.0480. The next key support is seen near the 1.0445 level, below which it could test 1.0420. Any more losses might send the pair toward the 1.0350 level.
On the upside, the pair might struggle to clear the 1.0550 resistance and the 100 simple moving average (red, 4 hours). The next key resistance is near 1.0640.
A close above 1.0640 could start a steady increase. In the stated case, EUR/USD might rise and recover toward the 1.0720 resistance zone. The next major stop for the bulls could be 1.0800.
Looking at gold, the price remained strong above the $1,840 level. It started a fresh increase and surged above the key $1,900 resistance zone.
Economic Releases
- NY Empire State Manufacturing Index for Oct 2023 – Forecast -1.5, versus 1.9 previous.
New Zealand BNZ Service rose to 50.7, Yet Uncertainties Linger
New Zealand's service sector showed signs of recovery in September, with BusinessNZ Performance of Services Index rising to 50.7, up from 47.7 in August. This improvement marks an end to the three consecutive months of contraction, though the index is still languishing below the long-term average of 53.5.
Among the key components, activity/sales witnessed a notable rise, moving up to 50.9 from 44.9. Meanwhile, employment indicators slightly dipped from 51.0 to 50.6. New orders/business experienced a healthy increase, reaching 53.9 from 48.5. However, stocks/inventories decreased to 47.9 from 51.4, while supplier deliveries inched up to 49.6 from 49.2.
Addressing the sentiment, BusinessNZ's Chief Executive, Kirk Hope, pointed out that negative sentiments remained prevalent, with 61.8% in September, only slightly lower than 63.9% in August. A significant portion of these concerns was attributed to uncertainties surrounding the General Election and rising cost of living.
ECB’s Lagarde: Eurozone Growth Faces Downward Pressure With Downside Risks
ECB President Christine Lagarde, during her speech at IMF annual meetings, highlighted the weakening activity in the Eurozone's economy in Q3 due to slower with risks lean more towards the downside ahead. Lagarde expects continued decline in inflation, but the path has risks on both sides. She also reiterated that current interest rate would bring inflation down to target is maintained for "sufficiently long duration".
She noted, "Incoming data suggest that activity has been weak in the third quarter," attributing this to "slower global demand and the impact of tighter financing conditions."
Lagarde noted that the "risks to the outlook continue to be tilted to the downside," while also acknowledging the possibility that factors like a "strong labour market, rising real incomes, and receding uncertainty" could uplift growth.
On the inflation front, Lagarde expects decline in Eurozone, driven by "easing cost pressures" and the influence of tighter monetary policy. But, "the downward path has risks in both directions." While upward risks could emanate from factors such as "renewed upward energy and food cost pressures," potential downside risks could arise from "weaker demand" or a deteriorating international economic environment.
Lagarde also reiterated ECB's stance on interest rates: "we consider that our key interest rates have reached levels that, maintained for a sufficiently long duration, will make a substantial contribution to the timely return of inflation to our target."
IMF Affirms Yen’s Movement Rooted in Fundamentals; Intervention Unwarranted
Sanjaya Panth, Deputy Director of IMF's Asia and Pacific Department, indicated that Yen's depreciation this year is primarily driven by fundamental factors, particularly interest rate differentials. He opined that current Yen dynamics don't necessitate intervention. Although Japan's inflation outlook is optimistic, Panth advises against immediate short-term rate hikes by BoJ due to global demand uncertainties. Instead, he suggests BoJ focus on enhancing flexibility of long-term interest rates.
He stated, "On the yen, our sense is that the exchange rate is driven pretty much by fundamentals. As long as interest rate differentials remain, the yen will continue to face pressure."
Addressing the topic of foreign exchange interventions, Panth clarified IMF's stance, emphasizing that interventions are justifiable only under specific scenarios: market severe dysfunction, elevated financial stability risks, or when inflation expectations become unanchored.
Reflecting on the recent fluctuations in Yen, he mentioned, "I don't think any of the three considerations are existing right now," essentially suggesting that the current Yen dynamics do not warrant any interventions by authorities.
Highlighting Japan's economic outlook, Panth shared a more optimistic tone on the nation's near-term inflation. He noted that there were "more upside than downside risks" to Japan's inflation forecast, with the economy operating close to its full capacity. Additionally, price increments in Japanese market are predominantly fueled by robust demand.
However, Panth believes that BoJ should hold off on any immediate hikes in short-term rates. He expressed concerns over global demand trends, saying it was "not yet the time" to act given the potential impacts on Japan's export-centric economy.
As a recommendation for BoJ's ongoing strategy, Panth encouraged measures that enhance the flexibility of long-term interest rates. This would strategically set the stage for any required monetary tightening measures in the future.
GBPUSD Wave Analysis
- GBPUSD reversed from resistance level 1.2325
- Likely to fall to support level 1.2055
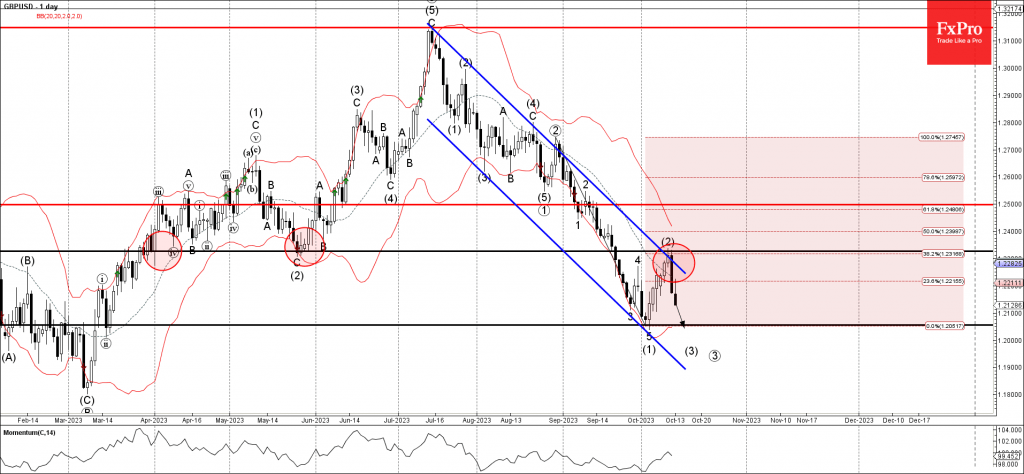
GBPUSD recently reversed down from the key resistance level 1.2325 (former strong support from May) coinciding with the resistance trendline of the daily down channel from July.
The downward reversal from the resistance level 1.2325 created the daily Japanese candlesticks reversal pattern Evening Star Doji, which started the active impulse wave (3).
Given the strong GBPUSD bearish sentiment, GBPUSD can be expected to fall further toward the next support level 1.2055 (which stopped the previous impulse wave (1)).
NZDJPY Wave Analysis
- NZDJPY under bearish pressure
- Likely to fall to support level 87.55
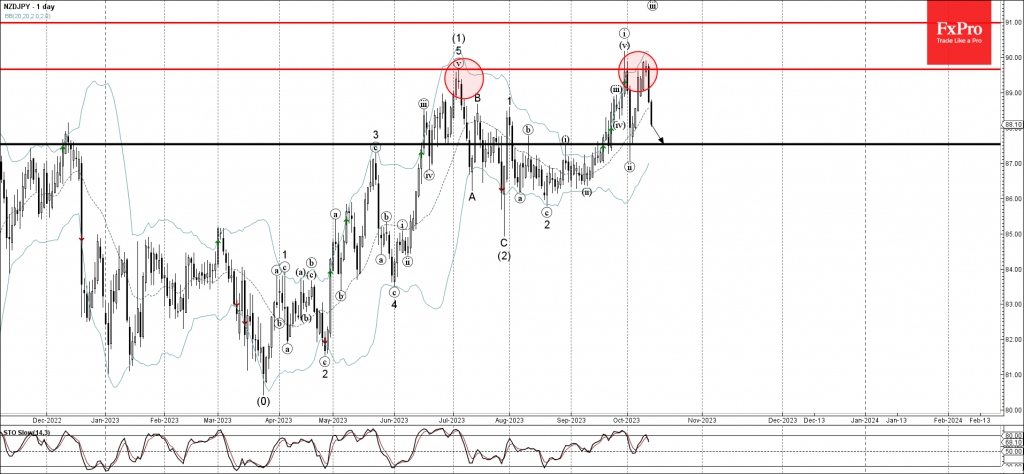
NZDJPY under the bearish pressure after the earlier downward reversal from the strong resistance level 89.70 (previous multi-month high from July) coinciding with the upper daily Bollinger Band.
The downward reversal from the resistance level 89.70 created the daily Japanese candlesticks reversal pattern Evening Star Doji, highlighted below.
Give the strength of the resistance level 89.70 and the strong NZD sales, NZDJPY can be expected to fall further toward the next support level 87.55 (former resistance from August).
Forex and Cryptocurrencies Forecast
EUR/USD: Inflation Drives Trends
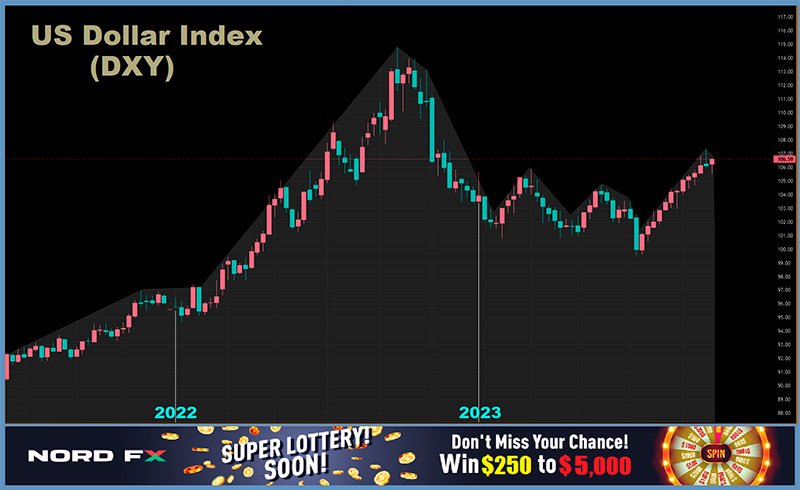
At the beginning of last week, the Dollar Index (DXY) continued its decline that began on October 3, while global equity markets experienced growth. The dovish stance of Federal Reserve officials and the falling yields on U.S. Treasury bonds were driving factors. In recent days, the regulators have been actively persuading the market of the likelihood of a "soft landing" for the U.S. economy, suggesting a potentially prolonged pause in the cycle of monetary tightening. For instance, on Wednesday, October 11, Christopher Waller, a member of the Federal Reserve Board of Governors, stated that "tightening in financial markets is doing some of our work for us," allowing the central bank to maintain a wait-and-see approach.
On the same day, the minutes of the September meeting of the Federal Open Market Committee (FOMC) were released. The document, if not dovish, was certainly not hawkish. It is worth noting that the Committee left the interest rate unchanged in September. As for future prospects, the minutes indicated that Fed leaders acknowledge "high uncertainty" regarding the future of the U.S. economy and recognize the need to maintain a cautious approach to monetary policy.
Market sentiment began to gradually shift following the publication of the U.S. Producer Price Index (PPI). The Bureau of Labor Statistics reported that the PPI rose by 0.5% in September, exceeding the forecast of 0.3%. The core PPI (MoM) increased by 0.3%, compared to the expected 0.2%. On an annual basis, it reached 2.2%, surpassing the forecast of 1.6% and the previous figure of 2%. This unexpected surge in industrial inflation led to speculation that consumer inflation could also exceed expectations.
This indeed materialized. Data released on Thursday, October 12, showed that inflation in September increased by 0.4%, higher than the 0.3% forecast. On an annual basis, the Consumer Price Index (CPI) also exceeded expectations, coming in at 3.7% against a forecast of 3.6%. Market participants concluded that such inflationary growth could prompt Federal Reserve officials to shift from a dovish to a hawkish stance, potentially raising the interest rate by another 25 basis points (bps) to 5.75% in the upcoming FOMC meeting. Amidst such sentiment, the dollar, along with the yields on U.S. government bonds, sharply increased, while equity markets declined. The DXY reached a new local peak, hitting 106.35. Yields on 10-year Treasuries rose to 4.65%, and 2-year yields reached 5.05%. EUR/USD reversed course, dropping from a high of 1.0639 to 1.0525 in just a few hours.
Germany's CPI was also released on Wednesday, September 11, showing an annual consumer inflation of 4.3% and a monthly figure of 0.3%, both of which were fully in line with forecasts and previous data. Joachim Nagel, a member of the ECB's Governing Council and the head of Bundesbank, stated that inflation in Germany has reached its peak. By 2025, he projects that the tightening of monetary policy will steer inflation in the Eurozone down to 2.7%, according to his opinion. "Until we have defeated high inflation rates, we will not rest," he assured.
The minutes from the ECB's September meeting revealed that a solid majority of the Governing Council members supported a 25 basis point interest rate hike for the euro. In their view, any pause might signal that the tightening cycle has come to an end or that the Governing Council is more concerned about the state of the economy and a possible recession than about excessive inflation. These minutes were published on Thursday, October 12.
Some Council members advocate keeping the key rates at their current level, notably François Villeroy de Galhau, the President of the Bank of France. In his opinion, patience in monetary policy currently holds more importance than activity, stating that it would be much better to achieve the goal through a "soft landing" rather than a "hard one."
With a high degree of probability, the European Central Bank will raise the interest rate to 4.75% at its next meeting on October 26. Even after this increase, the rate will still remain below that of the Federal Reserve. Combined with the apparent weakness of the Eurozone economy, this will continue to exert pressure on the euro. The situation is further complicated by a potential spike in energy prices due to the ongoing military actions in Ukraine and the recent escalation of the Israeli-Palestinian conflict as winter approaches.
EUR/USD closed at a level of 1.0507 last week. As of the evening of October 13, when this review was written, experts were divided on its near-term prospects: 80% favoured a northward correction for the pair, while 20% took a neutral stance. The number of votes in favor of further dollar strengthening stood at 0%.
Regarding technical analysis, among the trend indicators on the D1 chart, 100% sided with the bears. A majority (60%) of oscillators continue to favor the U.S. currency and are coloured in red. 30% sided with the euro, with the remaining 10% taking a neutral stance.
Near-term support for the pair is located around 1.0450, followed by 1.0375, 1.0255, 1.0130, and 1.0000. Bulls will encounter resistance in the area of 1.0600-1.0620, then 1.0670-1.0700, 1.0740-1.0770, 1.0800, 1.0865, and 1.0895-1.0930.
The upcoming week's economic calendar highlights several key events. On Tuesday, October 17, data on U.S. retail sales will be released. The Eurozone's Consumer Price Index (CPI) is scheduled for publication on Wednesday. Thursday, October 19, will feature the release of the Philadelphia Fed Manufacturing Index and the customary data on initial jobless claims in the United States. A speech by Federal Reserve Chairman Jerome Powell is also planned for the evening of that Thursday.
GBP/USD: It Was Tough, and It Will Be Tough
Overall, the GBP/USD chart closely resembled that of EUR/USD: rising until Thursday, followed by a reversal and decline after the release of consumer inflation data in the United States. In addition to the prospect of tighter U.S. monetary policy, the British pound faced additional pressure from UK industrial production data.
According to the latest figures from the Office for National Statistics (ONS), published on Thursday, the country's industrial sector activity declined again in August. Manufacturing output fell by -0.8%, compared to a forecast of -0.4% and a -1.2% decline in July. The overall industrial production dropped by -0.7%, against expected -0.2% and -1.1% in the previous month. On an annual basis, although manufacturing output did increase by 2.8% in August, it fell short of the expected 3.4%. The overall volume of industrial production also missed expectations, increasing only by 1.3% instead of the anticipated 1.7%.
Despite the fact that the UK's GDP, after contracting by -0.6% in July, increased by 0.2% in August, the risks of economic growth deceleration have heightened. This is largely due to developments in Israel – escalating tensions in the Middle East could disrupt the global supply chain, and rising prices for natural energy resources, primarily oil, will increase inflationary pressures.
Moreover, British companies have not only slowed their production growth rate due to weakened demand but have also postponed their plans for capacity expansion due to higher interest rates on loans.
This situation poses a dilemma for officials at the Bank of England (BoE), who are caught between trying to tame inflation and preventing the economy from slipping into a deep recession. Speaking at the annual meeting of the Institute of International Finance in Morocco on Friday, October 13, BoE Governor Andrew Bailey stated that "the last decision was a difficult one" and that "future decisions will also be difficult." It's worth noting that the interest rate was left unchanged at 5.25% in September. The next BoE meeting is scheduled for November 2, and whether the regulator will opt to raise the rate even by a few basis points remains a significant question.
GBP/USD closed the past week at a mark of 1.2143. Analyst opinions on its near-term future were surprisingly unanimous, with 100% forecasting an increase for the pair. (It's appropriate to remind that even such unanimity offers no guarantees regarding the accuracy of the forecast). On the contrary, trend indicators on the D1 chart are entirely bearish: 100% of them point to a decline and are coloured in red. Oscillators indicate a fall for the pair at 50%, an increase at 40%, with the remaining 10% maintaining a neutral stance. Should the pair trend downwards, it will encounter support levels and zones at 1.2100-1.2115, 1.2030-1.2050, 1.1960, and 1.1800. If the pair rises, it will meet resistance at levels of 1.2205-1.2220, 1.2270, 1.2330, 1.2450, 1.2510, 1.2550-1.2575, 1.2690-1.2710, 1.2760, and 1.2800-1.2815.
Notable events for the upcoming week include Tuesday, October 17, when data on the state of the UK labour market will be released. On Wednesday, October 18, consumer price index (CPI) data will be published for both the Eurozone and the United Kingdom. (Particularly high volatility can be expected for EUR/GBP on this day). Also of interest is Friday, October 20, when retail sales data for the United Kingdom will be made available.
USD/JPY: Coming Full Circle
What's going on in Japan? Well, the situation remains largely as usual. After plummeting to a level of 147.24 on October 3, USD/JPY resumed its upward trajectory, marking the week's high at 149.82, just shy of the key 150.00 level. It has been noted multiple times that the divergence in monetary policies between the U.S. Federal Reserve and the Bank of Japan (BoJ) will consistently push the pair upwards. Any currency interventions by Japanese financial authorities could only result in a temporary strengthening of the yen.
According to the Bank of Japan, producer inflation has been slowing for the ninth consecutive month. Producer prices, which rose by 3.3% in August with a September forecast of 2.3%, actually increased by a minimal 2.0% year-over-year, the lowest since March 2021. However, with regard to consumer inflation, the BoJ is considering raising the target for the core Consumer Price Index (CPI) for the 2023/24 fiscal year from 2.5% to around 3%. This was reported on Tuesday, October 10, by the Kyodo news agency, citing informed sources.
Evaluating the state of Japan's economy and its monetary policy, S&P Global rating agency believes that "interest rates in Japan will start rising from 2024." However, the agency's view contradicts statements made by Bank of Japan (BoJ) officials. For instance, BoJ board member Asahi Noguchi stated on Thursday, October 13th, that "an interest rate hike would be triggered by achieving the target inflation rate of 2%," and that this target is still far from being reached. According to him, "there's no need to rush," and "there's no urgent need to adjust the Yield Curve Control (YCC) policy." From Noguchi's statements, one could infer that the Japanese regulator would not even be contemplating the topic of interest rates, keeping them at a negative level of -0.1%, were it not for the monetary policy of the Federal Reserve. Noguchi stated that rate hikes "don't necessarily reflect inflation expectations in Japan, but rather U.S. interest rates.".
USD/JPY ended the trading week at the level of 149.53. While the vast majority of experts predict a weakening of the dollar against the euro and pound, only 25% of those surveyed agreed with this view when it comes to the yen. A significant 75% forecast further weakening of the yen and strengthening of the U.S. currency. All 100% of trend indicators remain in the green. Among oscillators, slightly fewer, 80%, stay green, 10% have turned red, and the remaining 10% are in a neutral gray. The nearest support level is located at 149.15, followed by 148.15-148.40, 146.85-147.25, 145.90-146.10, 145.30, 144.45, 143.75-144.05, 142.20, 140.60-140.75, 138.95-139.05, and 137.25-137.50. The closest resistance is at 149.70-150.15, then 150.40, 151.90 (the October 2022 high), and 153.15.
No significant economic data pertaining to the state of the Japanese economy is scheduled for release in the upcoming week.
CRYPTOCURRENCIES: Where Will Bitcoin Fly Next?
Last week, bitcoin began charting its own course, detaching itself from its "big brothers" and disregarding both direct and inverse correlations. Despite rising stock indices and a weakening dollar, the leading cryptocurrency fell and moved into a sideways trend when the dollar started to gain strength.
BTC/USD has been trading within a range of $24,300-$31,300 since mid-March. Over the last eight weeks, its upper boundary has dipped even further, settling into a $28,100-$28,500 zone. As this range has narrowed, short-term speculators and retail traders have become less active, causing the realized capitalization indicator to hover near zero. Long-term holders, also known as "hodlers," are adding to their BTC wallets rather than depleting them, purchasing around 50,000 coins per month.
Historically, such market stagnation has preceded significant price movements. Many investors are now speculating that triggers for another bull rally could include the upcoming 2024 halving event and the potential approval of spot bitcoin ETFs. MicroStrategy, an American technology company, has accumulated 158,245 BTC, which is worth approximately $4.24 billion. In addition, investment giant BlackRock submitted an application for a spot bitcoin ETF in June and acquired $400 million worth of shares in leading miners.
The Bull Run could potentially commence right now; however, Bloomberg strategist Mike McGlone believes that stringent U.S. policies, particularly those by the Securities and Exchange Commission (SEC), are the main obstacles hindering bitcoin's growth. ChatGPT CEO Sam Altman also shares disappointment over the U.S. government's approach towards the crypto industry. "The war on cryptocurrencies seems endless, and the authorities appear keen on taking everything under their control," stated the Artificial Intelligence entrepreneur. Altman, along with U.S. presidential candidate Robert F. Kennedy Jr., thinks that the government's hostility towards independent digital assets is partly due to their desire to introduce their own Central Bank Digital Currency (CBDC). Should this wish materialize, it would provide the state with another surveillance tool over its citizens.
Another pressure point on virtual assets comes from the monetary policy of the U.S. Federal Reserve. Analyst Nicholas Merten opines that bitcoin could take a significant hit due to the Fed's actions, potentially leading to a prolonged economic downturn in the United States. If commodity prices, such as oil, natural gas, and uranium, start to stabilize or decline, this could signal an impending short-term recession. In such a scenario, Merten believes, stock prices could drop by approximately 33%, similar to the correction that occurred in October 2022. Bitcoin, in response, would likely plummet to a range of $15,000-$17,000.
The analyst is convinced that a sustained bull trend in the market is unlikely until the Federal Reserve begins to inject more liquidity into the economy. "Bitcoin thrives when there is an increase in the money supply and when investors are risk tolerant. At present, neither of these conditions is met," explained Nicholas Merten.
The current dynamics of bitcoin seem to align with what was observed before and after the halvings in 2016 and 2020. Following its summer peak, the coin is experiencing a downward correction; however, this isn't surprising. Typically, around 200 days before a halving, the leading cryptocurrency could lose up to 60-65% of its value but then would resume its growth trajectory.
Many experts predict a significant surge in bitcoin prices in 2024. Investor optimism is also fuelled by the current price trend of this digital gold: despite the pullback from its summer high, investments in bitcoin have yielded more than 60% returns since the beginning of the year.
JP Morgan experts forecast a price rise to $45,000 in 2024, while Standard Chartered predicts it will reach $100,000. Author and investor Robert Kiyosaki and cryptographer Adam Back also target the $100,000 mark. Fundstrat Research founder Tom Lee envisions bitcoin at $180,000, while venture capitalist Tim Draper predicts a $250,000 valuation. Billionaire Mike Novogratz and ARK Invest CEO Cathy Wood project the coin's rise to $500,000 and $1 million, respectively, for the next year.
Former BitMEX CEO Arthur Hayes has set a "modest" target of $70,000 for bitcoin next year. As for the $750,000 to $1 million range, Hayes believes BTC/USD will only reach that level by 2026. He justifies his forecast based on the asset's limited supply, the prospect of spot bitcoin ETF approvals, and geopolitical uncertainty. "I think this will be the greatest financial markets boom in human history. Bitcoin will soar to absurd levels, Nasdaq will rise to absurd levels, and the S&P 500 will climb to absurd levels," stated Hayes.
Charlie Munger, Warren Buffett's partner and the Vice Chairman of American holding company Berkshire Hathaway, has predicted a dire future for digital assets. In his view, the majority of investments in these assets will eventually become worthless. "Don't get me started on bitcoin. It's the dumbest investment I've ever seen," the 99-year-old investor expressed during the Zoomtopia online conference.
As of the time of writing this review, on the evening of Friday, October 13, the total market capitalization of the crypto market stands at $1.046 trillion, down from $1.096 trillion a week ago. bitcoin's share in the overall market has increased from 39.18% at the beginning of the year to 49.92%. Analyst Benjamin Cowen believes the crypto market is entering "one of its most brutal" phases. According to the expert, bitcoin's dominance is rising amid falling altcoin prices and decreased investor interest in this asset class. Utilizing Fibonacci retracement levels, Cowen anticipates that this dominance figure will likely peak at 60%, as it did in the last cycle, but will probably not rise to 65% or 70% due to the stablecoin market. BTC/USD closed at $27,075 on October 13th. The Crypto Fear & Greed Index for bitcoin has dropped from 50 to 44 points over the week, moving back from the Neutral zone to the Fear zone.
Middle East Unrest Shakes Financial Markets; Safe Havens Gain Ground
The abrupt escalation in conflicts in the Middle East significantly influenced the global financial markets last week, causing capital influx into safe-haven assets. Amidst the military confrontations, Gold and other precious metals experienced a sharp surge in value. Oil prices also saw a rebound, reflecting the geopolitical tensions. While Treasury bonds reaped some advantages, equity markets, despite recording declines, managed to steer clear of any catastrophic plummets. These military tensions intertwined with ongoing adjustments in Fed rate expectations and persistent strong US inflation data, painting a complex picture for investors.
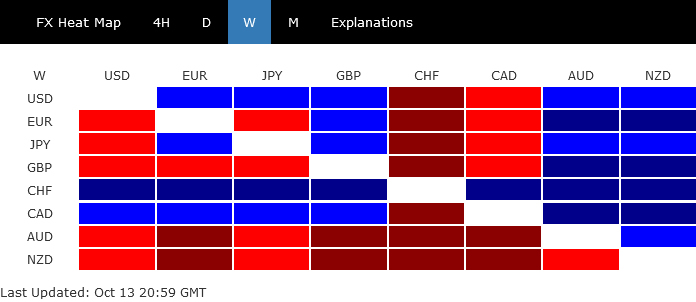
In the currency arena, Swiss Franc emerged as the frontrunner, buoyed by its recognized safe-haven status amidst geopolitical turmoil. Canadian Dollar secured the second spot, bolstered by the rebound in oil prices. US Dollar claimed the third position, underpinned by mild risk aversion in the stock markets and resilient treasury yields. Interestingly, Dollar managed to withstand the formidable rally in Gold, a testament to its inherent safe-haven appeal.
Conversely, New Zealand Dollar languished at the bottom of the performance chart, with Australian Dollar trailing closely. Sterling and Euro faced significant pressure, succumbing to accelerated selling against Swiss Franc following downside breakout. Yen, though mixed, found its descent cushioned by Japan's looming threat of intervention.
As the global gaze remains fixed on the Middle East, the forthcoming market trajectory is poised to be significantly influenced by the potential of regional expansion or containment of the Israel-Hamas conflict. Although economic data retains its pivotal role in shaping market movements, its influence may be temporarily overshadowed by the unfolding geopolitical events.
Middle East Conflict Fuels Safe Haven Rush, Boosting Gold and Swiss Franc
Investors are fleeing to safe havens at the start of the week after the devastating attacks by Hamas militants to Southern Israel. Another round of massive safe haven flow was seen towards the end of the week, after Israel begun to retaliate. Driven by the escalating Middle East conflict, Gold price had their best week in seven months while Swiss Franc surges to the strongest level against Euro and Sterling in a year. There was also some lift to oil prices, as well as treasuries. If the geopolitical situation gets gloomier, there is a good chance that these safe haven assets will be boosted further.
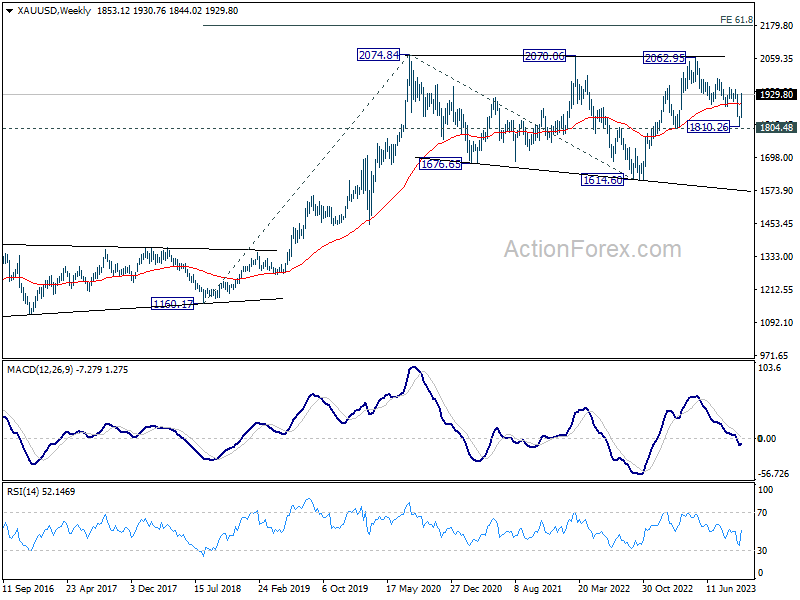
Technically, Gold's strong rally and decisive break of 55 D EMA should confirm that corrective fall from 2062.95 has completed with three waves down to 1810.26, just ahead of 1804.48 structural support. Near term outlook will now stay bullish as long as 1884.92 support holds. Firm break of 1947.21 will pave the way to retest 2062.95 high.
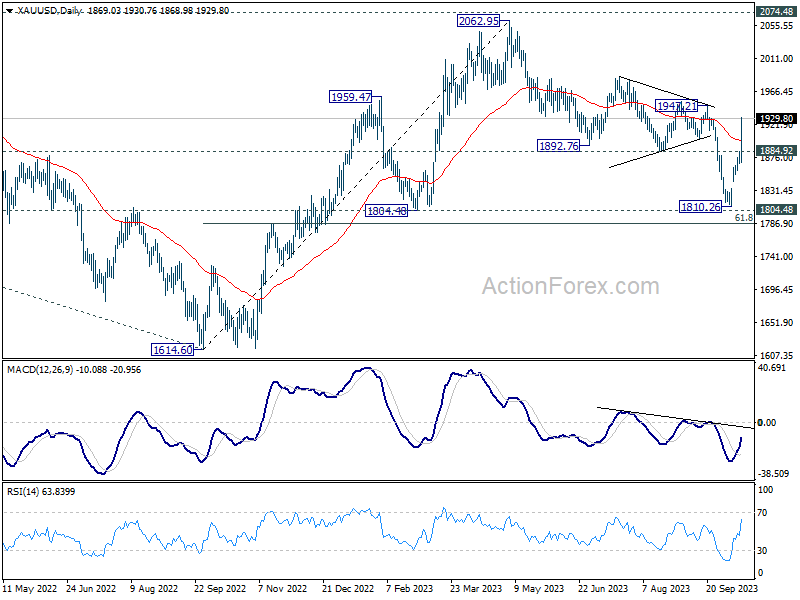
More importantly, in the bigger picture, current development, with fall from 2062.95 as a corrective move, argues that rise from 1614.60 (2022 low) is still in progress. This strengthens the case that long term corrective pattern from 2074.84 (2020 high) has completed with three waves down to 1614.60. It maybe early to confirm this bullish scenario, but it's unsure how fast the geopolitical situation could deteriorate. Firm break of 2062.95/2074.84 resistance zone will set the stage to 61.8% projection of 1160.17 to 2074.84 from 1614.60 at 2179.86.
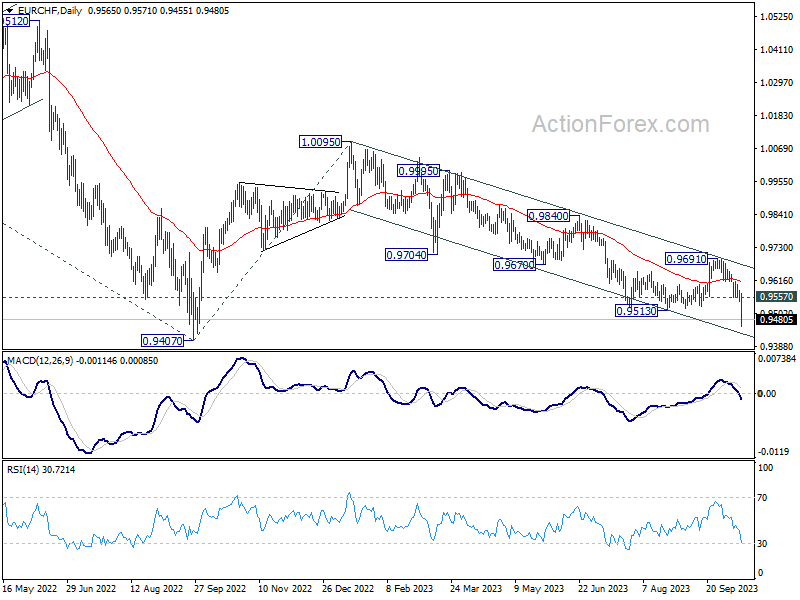
Swiss Franc was the strongest major currency last week, outshining both Canadian and Dollar. EUR/CHF break through 0.9513 support decisively to resume the down trend form 1.0095 (Jan high). Near term outlook will stay bearish as long as 0.9557 support turned resistance holds. Retest of 0.9407 (2022 low) should be seen next.
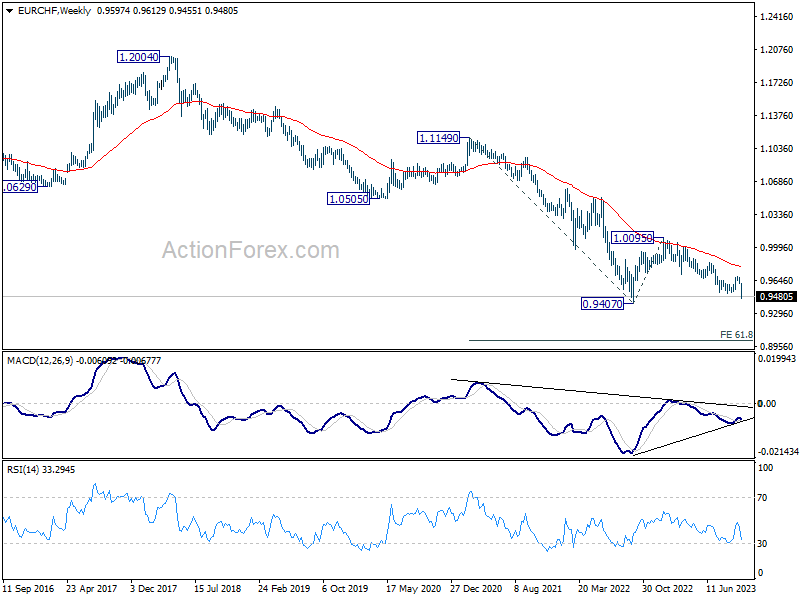
Also to be noted, firm break of the medium term lower channel support as well as 0.9407 could prompt downside acceleration in EUR/CHF, with simultaneous resumption of long term down trend. In this bearish case, 61.8% projection of 1.1149 to 0.9407 from 1.0095 at 0.9018 will be the next target.
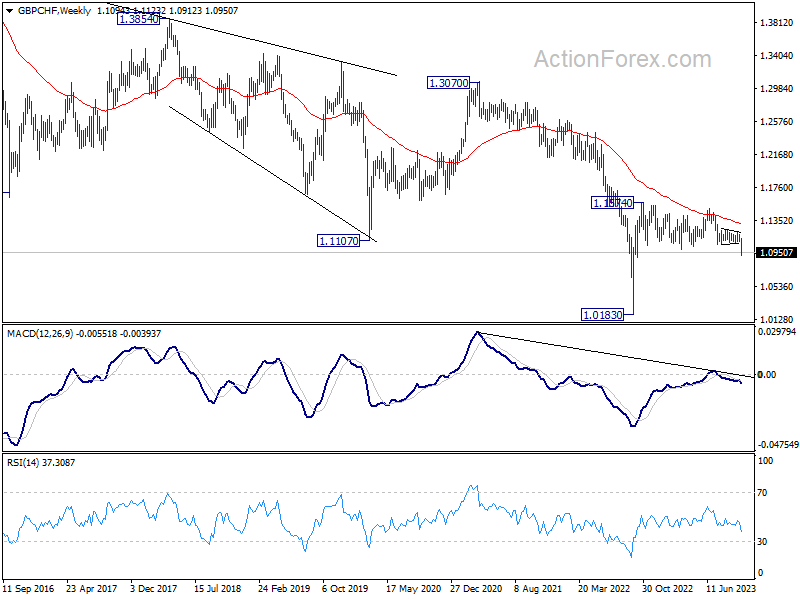
GBP/CHF also broke out, to the downside, from the year long range last week. Near term outlook will stay bearish as long as 1.1058 support turned resistance holds. Immediate focus is on 100% projection of 1.1574 to 1.0987 from 1.1502 at 1.0915. Sustained break there could prompt downside acceleration to 161.8% projection at 1.0552 next.
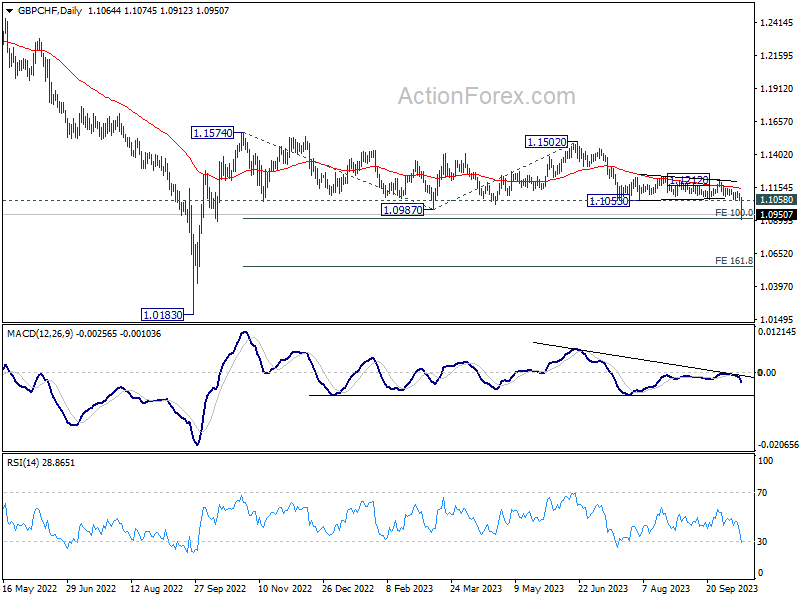
It's still premature to conclude if GBP/CHF is ready for long term down trend resumption. But prior rejection by 55 W EMA is clearly a bearish sign. Attention with be on the downside momentum of the next move, to gauge the chance of revisiting 1.0183 (2022 low).
WTI Crude Oil Sees Notable Rebound; Supports Canadian Dollar
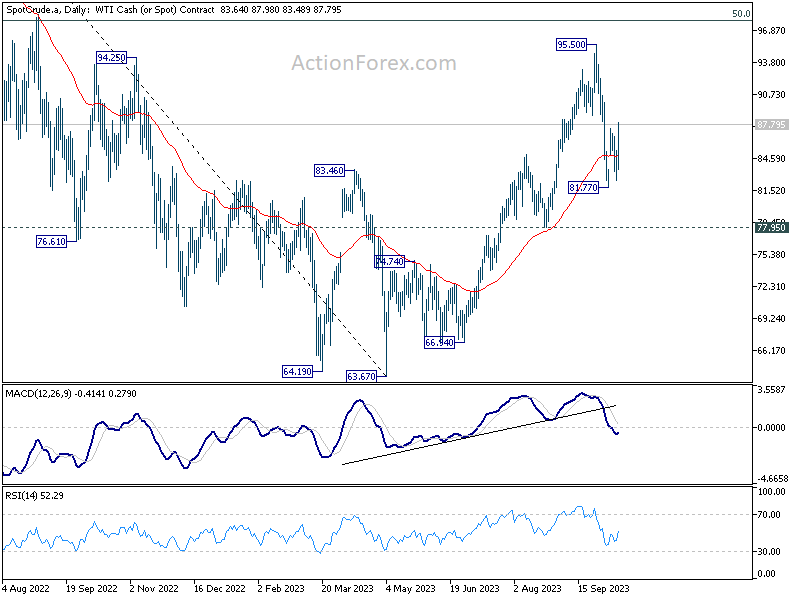
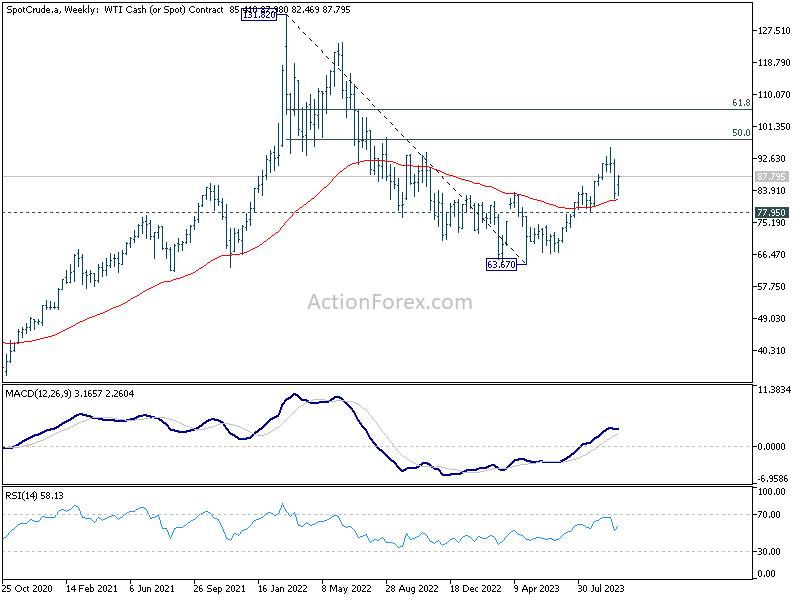
WTI crude oil exhibited a noteworthy recovery last week, showing resilience despite the more dominant surges observed in Gold and the Swiss Franc. The rebound ahead of 77.95 support is keeping rise from 63.67 alive. Thus, price actions from 95.50 is seen more of a consolidation pattern than trend reversal for now.
For the near term, further rally is in favor to retest 95.50. But even in case of a break there, the crucial resistance is at 50% retracement of 131.82 to 63.67 at 97.74. This resistance is not expected to be broken decisively in the near term considering weakening demand on global slowdown. So to conclude, WTI is now in a rising leg of a sideway pattern that should last for a while.
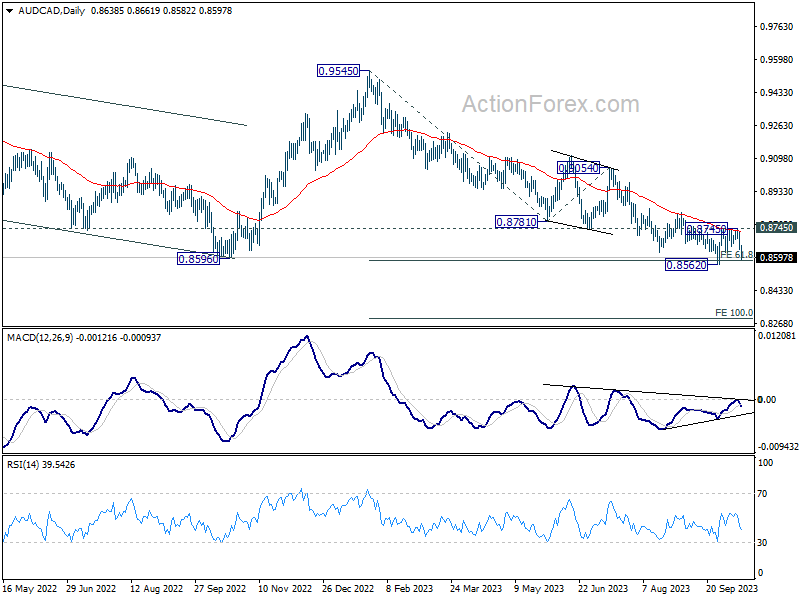
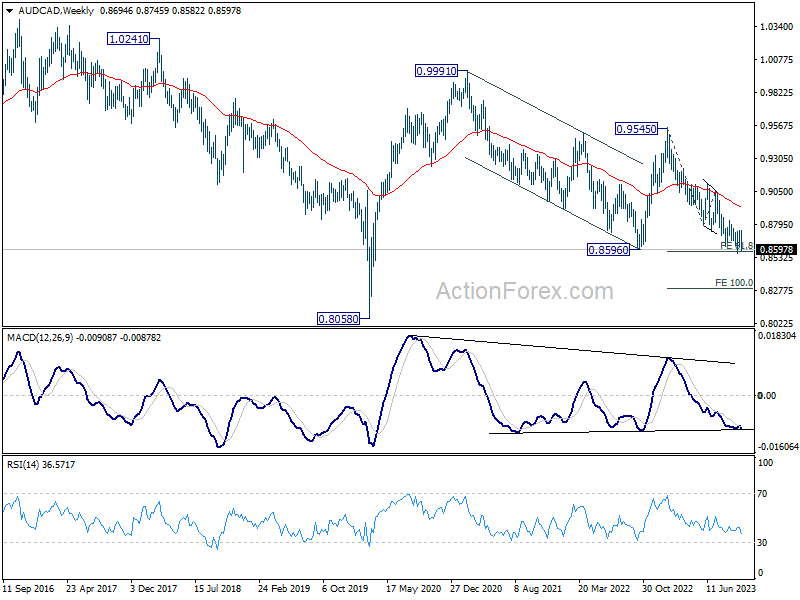
Parallel to these developments, Canadian Dollar received a bolstering impetus from the uptick in oil prices. AUD/CAD's steep decline towards the end of the week indicates rejection by 55 D EMA (now at 0.8727). Immediate focus is now on 0.8562 support. Decisive break there will resume whole fall form 0.9545, as well as the down trend from 0.9991 (2021 high). Next target will be 100% projection of 0.9545 to 0.8781 from 0.9054 at 0.8290.
Complex Dynamics in US on Elevated Treasury Yields, Geopolitical Tensions and Sticky Inflation
The US financial markets are currently ensnared in a complex web of influencing factors. Fed officials have been increasingly vocal about the impact of soaring treasury yields, suggesting that their ascent could reduce the need for further monetary tightening. However, geopolitical upheavals have incited a flight to the relative safety of treasuries, exerting downward pressure on yields. Amidst these opposing forces, robust headline CPI data serves as a stark reminder that the battle against inflation remains in full swing. Despite these challenges, the absence of a large-scale exodus from equities underscores the resilience in investor sentiment.
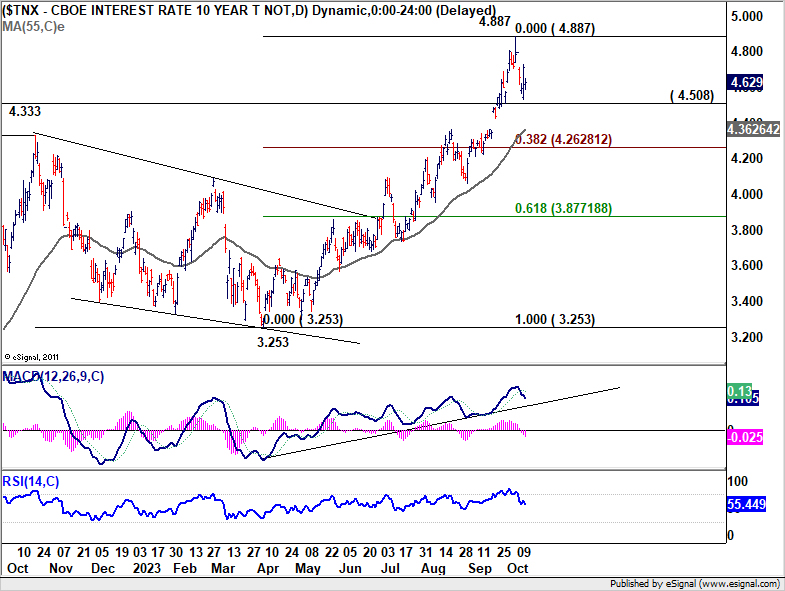
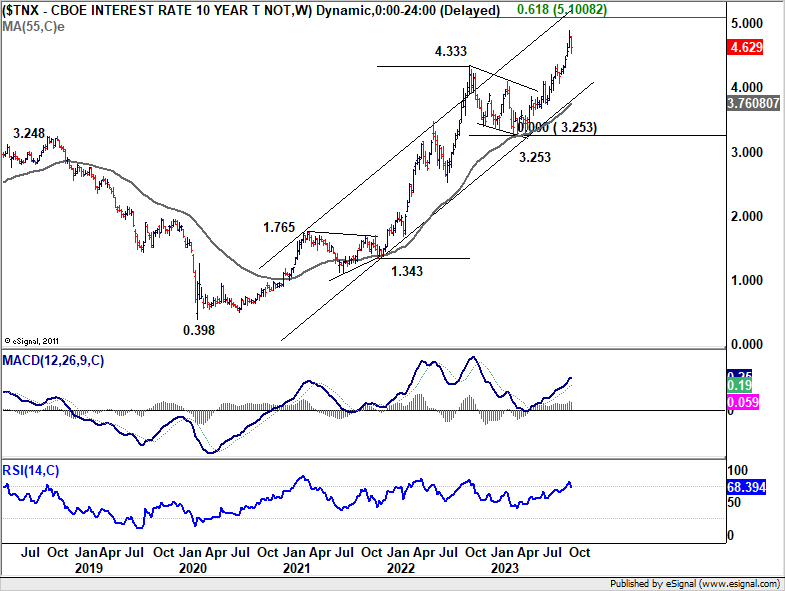
10-year yield fell to as low as 4.532 last week before stabilizing. With 4.508 support intact, price actions from 4.887 short term top is more likely a sideway consolidation pattern with range set between 4.5 and 4.9. More sideway trading could be seen in the near term, probably until FOMC meeting on November 1. Upside breakout is likely thereafter, subject to Fed's guidance, as well as next batch of non-farm payroll and CPI data. However, firm break of 4.508 will argue that it's already in correction to whole rise from 3.253. Deeper fall would then be seen to 38.2% retracement of 3.253 to 4.887 at 4.262.
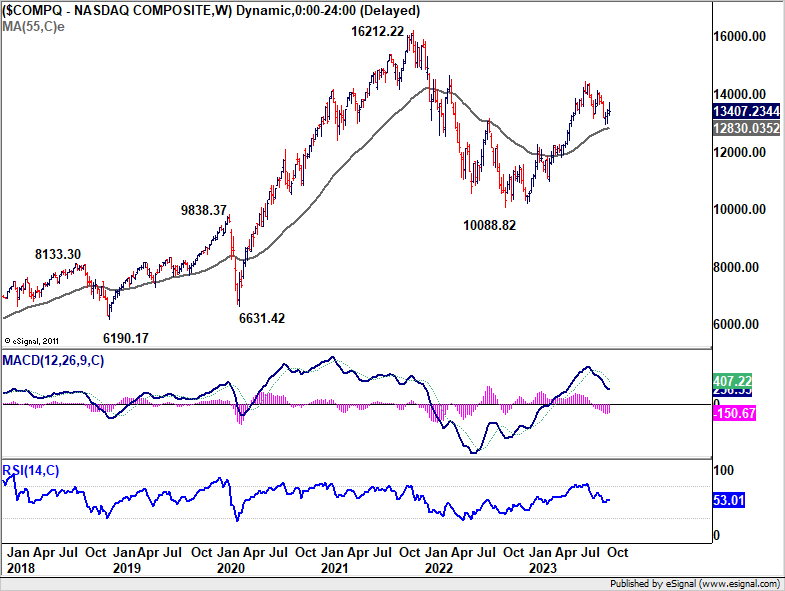
NASDAQ reversed after climbing to 13714.13 last week to close the week slightly down at 13407.23. As the index is still staying well inside the near term falling channel, corrective fall from 14465.55 might still extend lower. But in that case, strong support could be seen from 38.2% retracement of 10088.82 to 14446.55 at 12781.89 to contain downside to complete the correction. Break above 13714.13 will resume the near term rise to retest 14446.55 high.
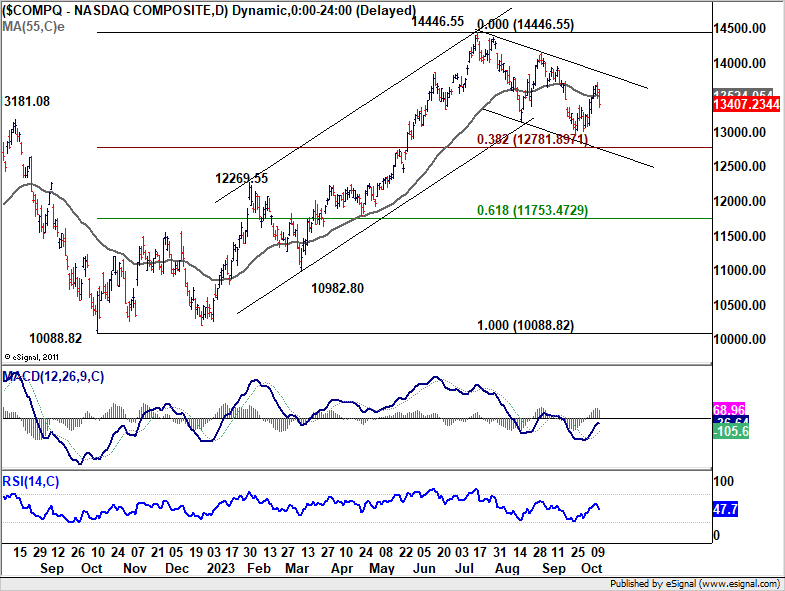
However, sustained trading below 12781.9 will argue that whole rise from 10088.82 has finished, and bring deeper fall to 61.8% retracement of 11753.47 and below , as the third leg of the pattern from 16212.22 (2020 high).
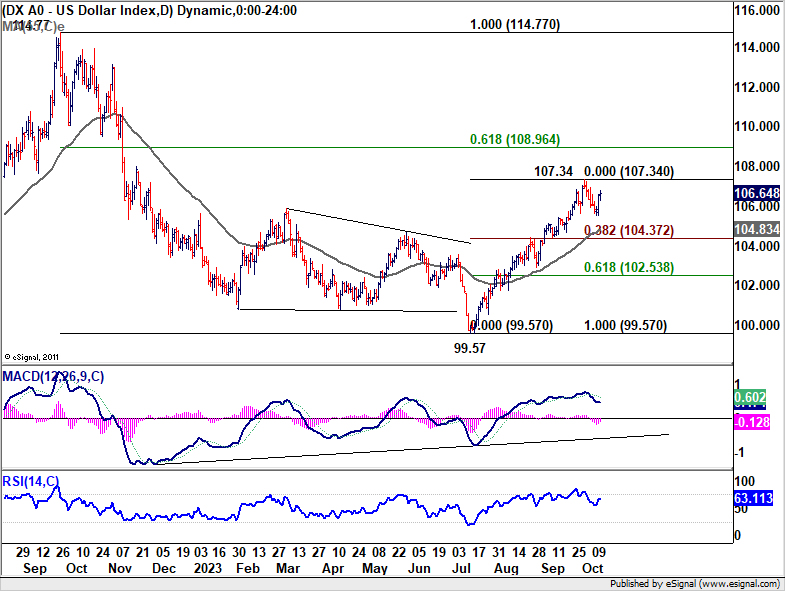
Dollar Index rebounded after breaching 105.65 support briefly. Even so, a short term top is likely formed at 107.34, and more corrective trading could be seen in the near term In case of another fall, down side should be contained by 38.2% retracement of 99.57 to 107.34 at 104.37 to bring rebound. On the other hand, above 107.34 will resume the rise from 99.57 to 61.8% retracement of 114.77 to 99.57 at 108.96.
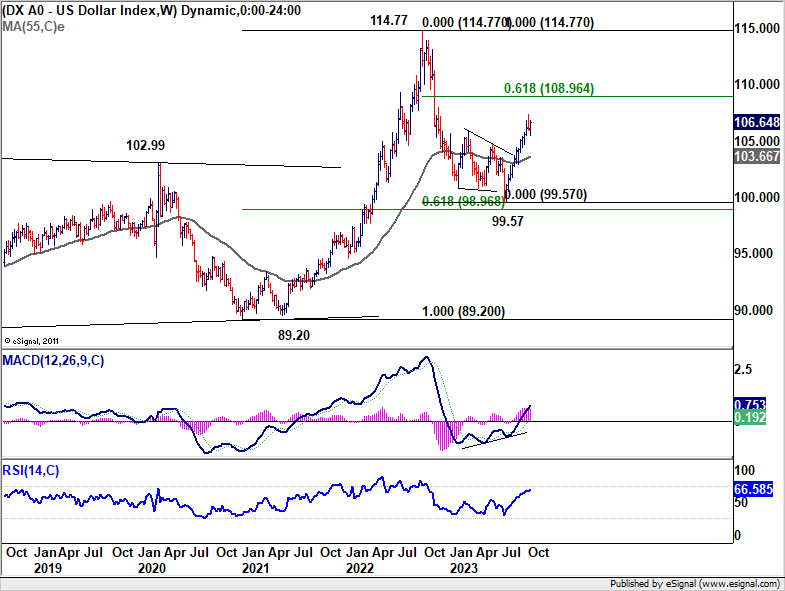
To reiterate the previous view, rise from 99.57 is seen as reversing the whole down trend from 114.77. However, to have Dollar Index breaking through to 108.96 decisively and have enough momentum to challenge 114.77, extended stock market selloff or rise in benchmark yields, or even both together, would be needed.
AUD/USD Weekly Report
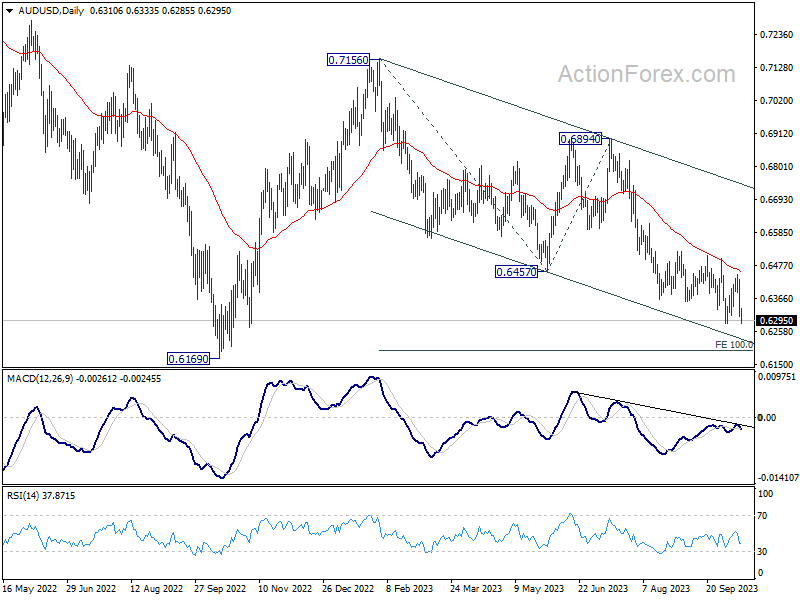
With the late decline last week, AUD/USD's recovery from 0.6284 should have completed at 0.6444 already. Decisive break of 0.6284 this week will resume whole fall from 0.7156. Next target is 100% projection of 0.7156 to 0.6457 from 0.6894 at 0.6195, which is close to 0.6169 medium term support. For now, outlook will stay bearish as long as 0.6444 resistance holds, in case of recovery.
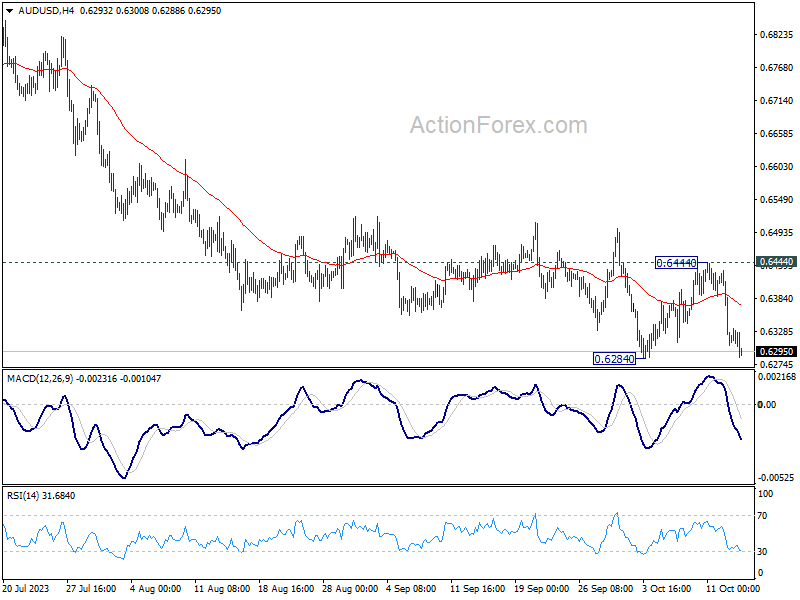
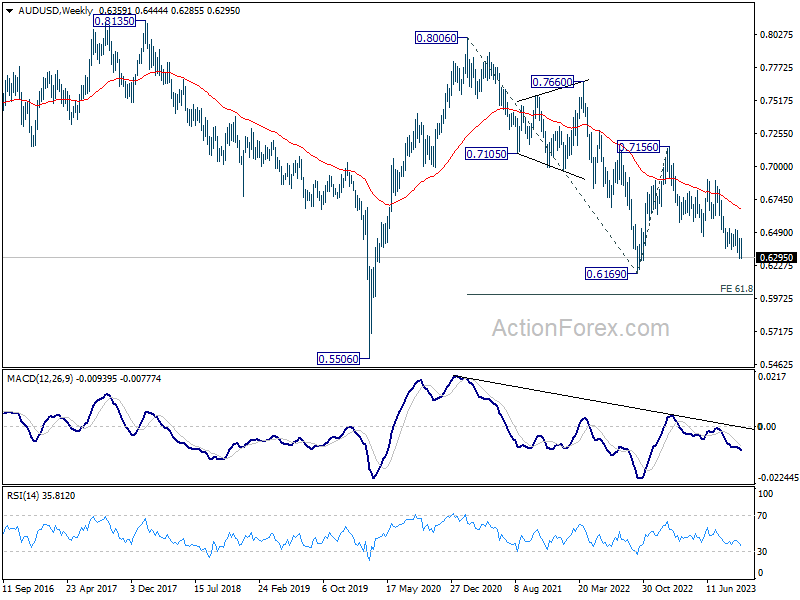
In the bigger picture, down trend from 0.8006 (2021 high) is possibly still in progress. Decisive break of 0.6169 will target 61.8% projection of 0.8006 to 0.6169 to 0.7156 at 0.6021. This will now remain the favored case as long as 0.6894, in case of strong rebound.
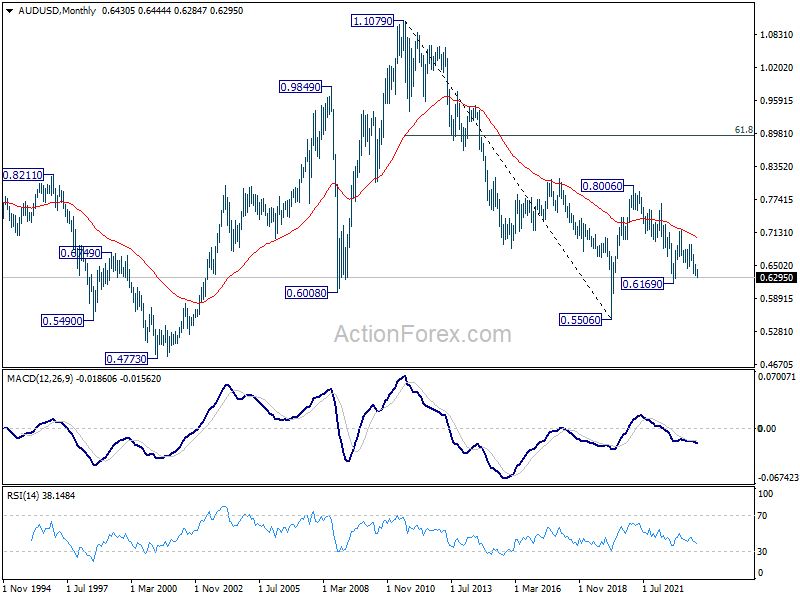
In the long term picture, while fall from 0.8006 might extend lower, the structure argues that it's merely a correction to rise from 0.5506 (2020 low). In case of downside extension, strong support should emerge above 0.5506 to bring reversal. But still, momentum of the next move will be monitored to adjust the assessment.
EUR/USD Weekly Outlook
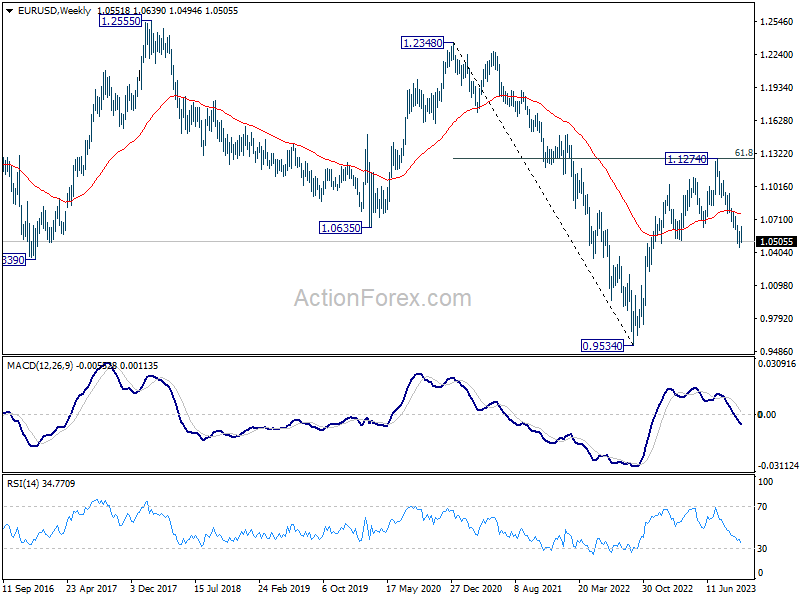
EUR/USD's recovery from 1.0447 finished at 1.0639 last week after rejection by near term falling trend line. Initial bias is mildly on the downside this week for 1.0447 support. Firm break there will resume whole fall from 1.1274 and target 1.0199 fibonacci level. On the upside, above 1.0557 minor resistance will turn intraday bias neutral first. But risk will stay on the downside as long as 1.0639 resistance holds.
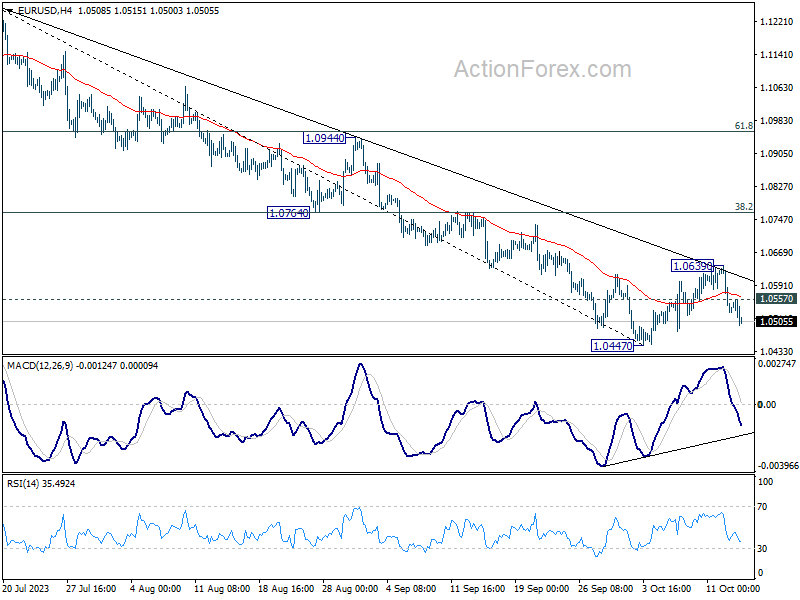
In the bigger picture, fall from 1.1274 medium term top could still be a correction to rise from 0.9534 (2022 low). But chance of a complete trend reversal is rising. In either case, current fall should target 61.8% retracement of 0.9534 to 1.1274 at 1.0199 next. For now, risk will stay on the downside as long as 55 D EMA (now at 1.0708) holds, in case of rebound.
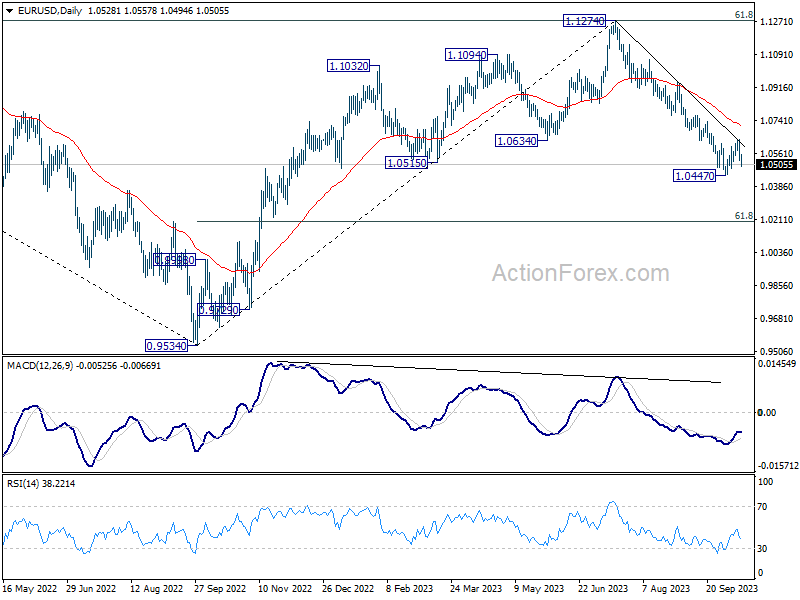
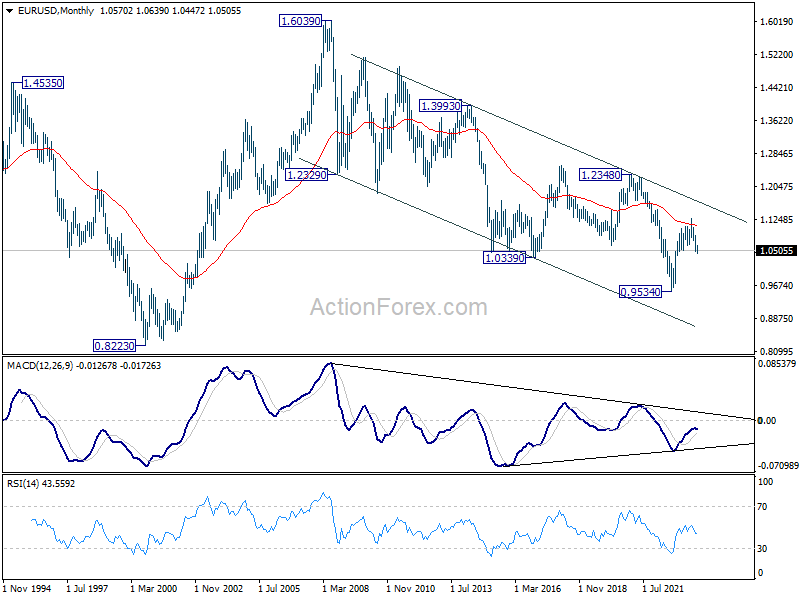
In the long term picture, there is no clear sign of trend reversal yet. That is, down trend from 1.6039 (2008 high) might still be in progress. Rejection by 55 M EMA (now at 1.1087) will retain long term bearishness, for another fall through 0.9534 at a later stage.