Sample Category Title
USD/CHF Mid-Day Outlook
Daily Pivots: (S1) 0.9019; (P) 0.9053; (R1) 0.9120; More....
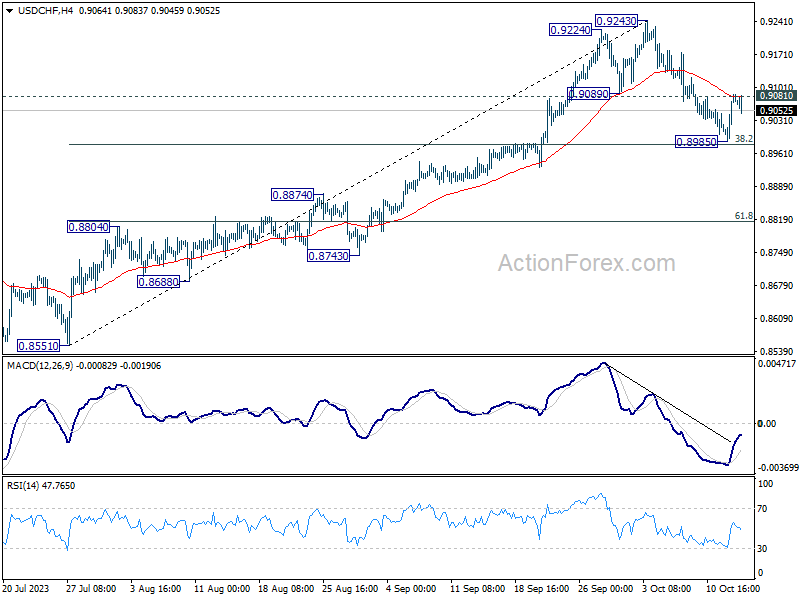
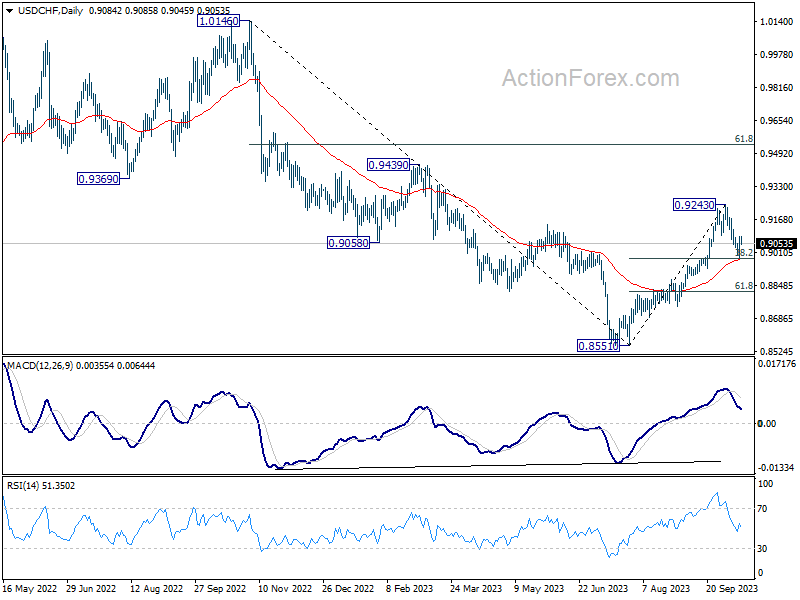
Focus stays on 0.9081 resistance in USD/CHF. Firm break there will suggest that pull back from 0.9243 has completed at 0.8985, after drawing support from 38.2% retracement of 0.8551 to 0.9243 at 0.8979. Intraday bias will then be back on the upside for retesting 0.9243 high. Nevertheless, sustained break of 0.8979 will argue that deeper fall is under way to 61.8% retracement at 0.8815.
In the bigger picture, current development indicates that rise from 0.8551 is reversing whole down trend from 1.0146. Further rally would then be seen to 61.8% retracement at 0.9537 and above. For now, this will be the favored case as long as 55 D EMA (now at 0.8971) holds, even in case of deep pullback.
EUR/USD Mid-Day Outlook
Daily Pivots: (S1) 1.0489; (P) 1.0565; (R1) 1.0603; More...
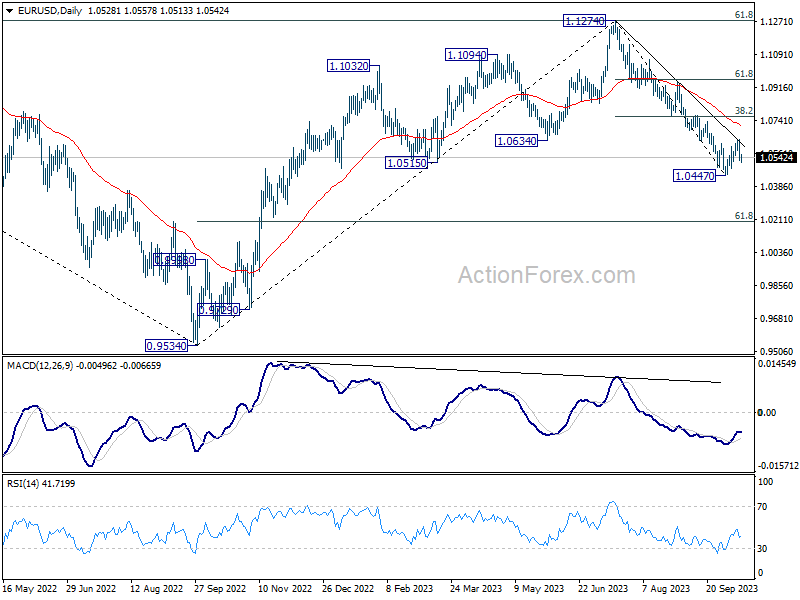
Focus stays on 1.0518 minor support in EUR/USD. Firm break there will confirm that corrective recovery from 1.0447 has completed at 1.0639, after hitting near term falling trend line. Larger decline from 1.1274 should then be resumed through 1.0447 to 1.0119 fibonacci level. On the upside, though, above 1.0639 will resume the recovery to 1.0764 resistance.
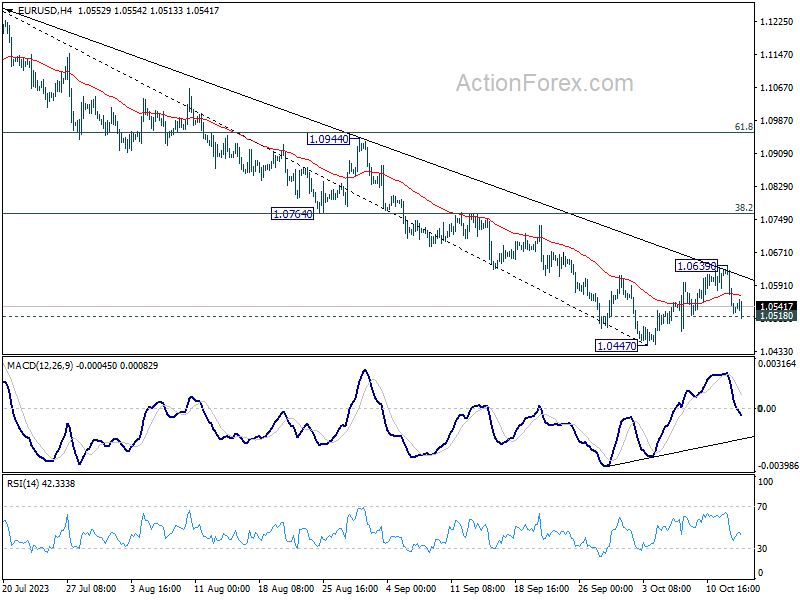
In the bigger picture, fall from 1.1274 medium term top could still be a correction to rise from 0.9534 (2022 low). But chance of a complete trend reversal is rising. In either case, current fall should target 61.8% retracement of 0.9534 to 1.1274 at 1.0199 next. For now, risk will stay on the downside as long as 55 D EMA (now at 1.0709) holds, in case of rebound.
GBP/USD Mid-Day Outlook
Daily Pivots: (S1) 1.2121; (P) 1.2226; (R1) 1.2281; More
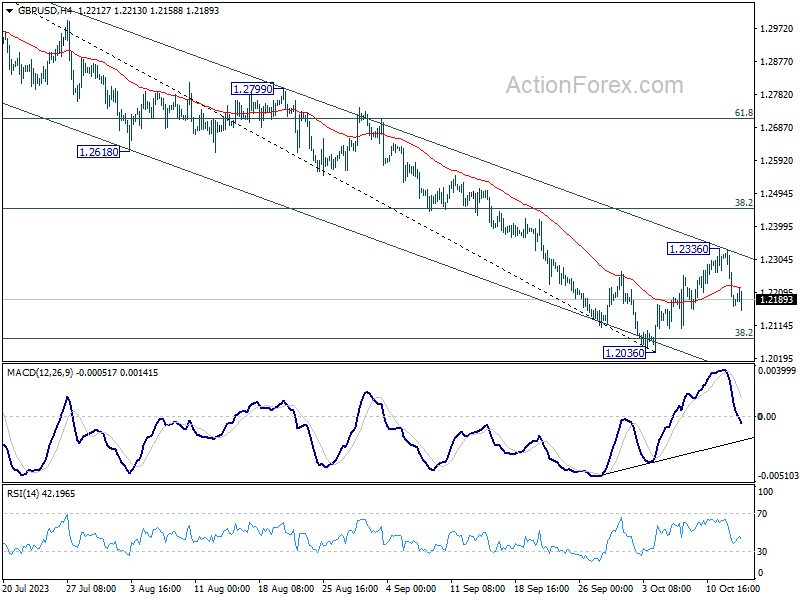
Intraday bias in GBP/USD remains mildly on the downside at this point. Recovery from 1.2035 should have completed at 1.2336, after hitting falling channel resistance. Deeper decline would be seen to retest 1.2036 low. Decisive break there will resume larger fall from 1.3141. On the upside, above 1.2336 minor resistance will resume the rebound instead.
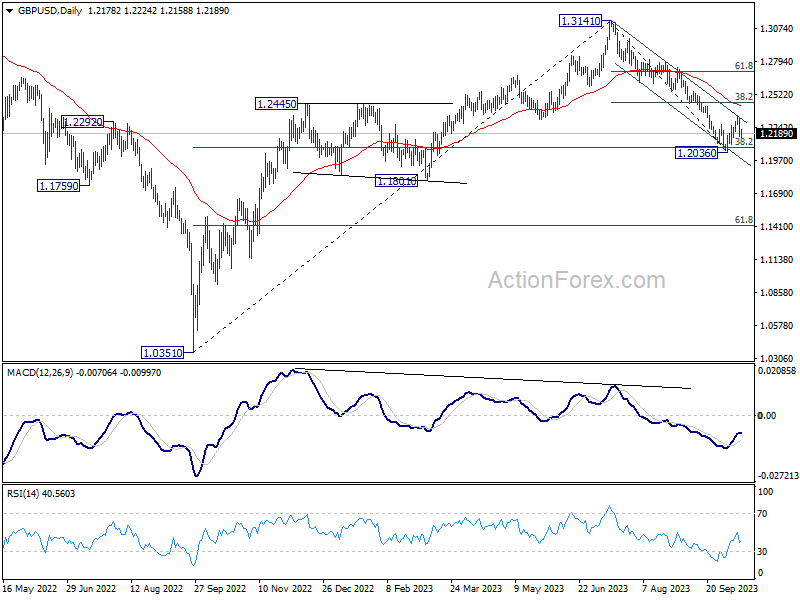
In the bigger picture, fall from 1.3141 medium term top could still be a correction to up trend from 1.0351 (2022 low) only. But risk of complete trend reversal is rising. Sustained break of 38.2% retracement of 1.0351 to 1.3141 at 1.2075 will pave the way to 61.8% retracement at 1.1417. For now, risk will stay on the downside as long as 55 D EMA (now at 1.2420) holds, in case of rebound.
Middle East Tensions Spark Safe-Haven Rush as Gold Approaches 1900
As Middle East tensions escalate again ahead of the weekend, global financial markets are exhibiting a pronounced shift towards risk aversion. The news of Israel urging all civilians in Gaza City to evacuate, in anticipation of a ground invasion following a severe attack by Hamas, has sent shockwaves through the markets. Both Oil and Gold Prices are rising, with Gold edging closer to the significant 1900 mark.
Remarkably, the bullish momentum in gold hasn't undermined Dollar; the US currency remains generally robust. However, Swiss Franc, a traditional safe-haven asset, has outperformed the greenback amidst the current geopolitical unrest. The Canadian Dollar also maintains its ground, buoyed by rising oil prices.
A weekly assessment suggests Swiss Franc is on track to be the week's top performer, with Dollar and Canadian Dollar following suit. On the other end, New Zealand Dollar trails as the weakest, with Australian Dollar and Euro not faring much better. British Pound has displayed some softness too, whereas Japanese Yen remains relatively neutral.
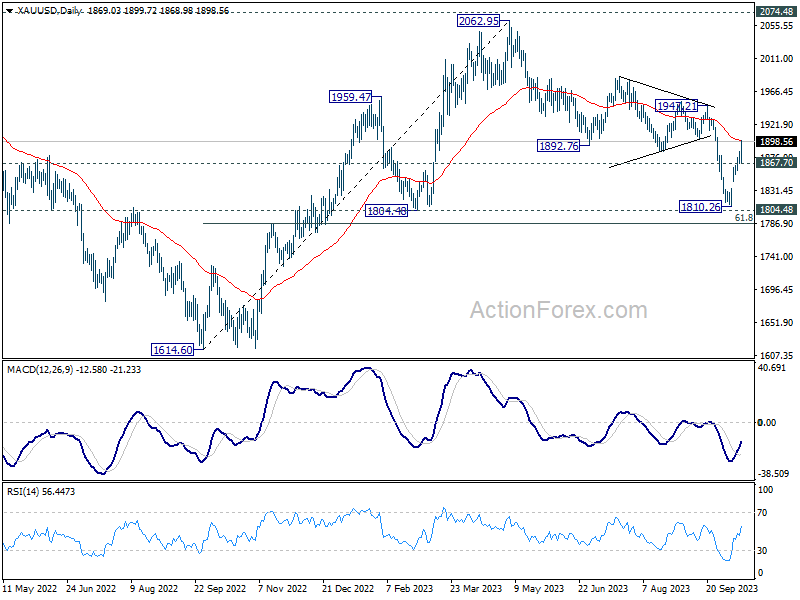
On the technical front, immediate focus in Gold is now on 55 D EMA (now at 1899.03), or simply put 1900 handle. Sustained break there will argue that fall from 2062.95 has completed with three waves down to 1810.26, just ahead of 1804.48 support. The corrective structure argues that larger rally from 1614.60 might be ready to resume. In this case, 1947.21 resistance will be the next target. Decisive break there will add to this bullish case and set up another bullish run towards 2062.95 high.
In Europe, at the time of writing, FTSE is down -0.38%. DAX is down -0.86%. CAC is down -0.83%. Germany 10-year yield is down -0.0635 at 2.727. Earlier in Asia, Nikkei dropped -0.55%. Hong Kong HSI dropped -2.33%. China Shanghai SSE dropped -0.64%. Singapore Strait Times dropped -1.02%. Japan 10-year yield rose 0.0036 to 0.759.
BoE's Bailey: Monetary decisions to go on to be tight
During his recent speech at IMF's annual meeting in Marrakech, BoE Governor Andrew Bailey reflected on previous month's decision to maintain interest rates at 5.25%. He characterized the decision as "a tight one", added that "they're going to go on being tight ones".
The MPC's narrow 5-4 vote to pause its series of consecutive rate hikes in September underscores the divided opinions within the bank regarding the best path forward.
Highlighting the bank's recent efforts, Bailey commented, "We have made, I think, particularly in the last few months, solid progress in terms of showing signs that inflation is being tackled."
However, he cautioned against overconfidence, adding, "let's not get carried away because there's an awful lot still to do."
The "last mile" of inflation management, according to Bailey, will considerably depend on "restrictive policy."
Industrial production in Eurozone and EU up 0.6% mom in Aug
Eurozone industrial production rose 0.6% mom in August, well above expectation of 0.1% mom. Production of durable consumer goods grew by 1.2% mom, non-durable consumer goods by 0.5% mom and capital goods by 0.3% mom, while production of intermediate goods fell by -0.3% mom and energy by 0.9% mom.
EU industrial production rose 0.6% mom. Among Member States for which data are available, the highest monthly increases were registered in Ireland (+6.1%), Slovakia (+4.5%) and Lithuania (+3.7%). The largest decreases were observed in Hungary (-2.4%), Croatia (-2.2%) and Belgium (-1.8%).
New Zealand BNZ PMI falls to 45.3, entrenched manufacturing downturn deepens
New Zealand manufacturing sector has further sunk into troubled waters, as evidenced by the continued and deepening contraction observed in recent data.
BusinessNZ Performance of Manufacturing Index for September highlighted this slowdown by dropping to 45.3, down from 46.1 the previous month. This marks its most dismal performance for a month unaffected by COVID-19 since May 2009 and sits notably below the long-term average activity rate of 52.9.
Delving into the specifics, there's a discernible decline across most metrics. While production saw a slight uptick, moving from 43.8 to 44.6, other areas weren't as fortunate. Employment indicators slid from 47.7 to 45.2, and new orders also receded from 46.6 to 44.9. Meanwhile, finished stocks dwindled, albeit marginally, from 52.0 to 51.6, and deliveries plunged from 47.8 to 44.3.
Catherine Beard, BusinessNZ's Director of Advocacy, highlighted the sustained downturn, pointing out that the sector "has now been in contraction for seven consecutive months, with little sign it is showing any improvement."
On the economic front, BNZ Senior Economist Doug Steel provided a bleak perspective, remarking, "the trend remains firmly downward." He also touched upon the challenges in discerning the exact causes of any PMI result but cited "falling sales, rising costs, and election uncertainty" as significant factors currently impacting the sector..
China's export slump persists but softens; imports shrink further as CPI stalls
China's trade figures for September revealed a continued, albeit moderating, decline in exports, marking the fifth consecutive month of contraction. Exports dropped by -6.2% yoy to USD 229.1B, an improvement from the -8.8% yoy decline recorded in the previous month. Despite this easing contraction, prolonged declines in shipments to major trade partners underscore the persisting challenges in the external sector.
A breakdown of the data shows exports to ASEAN countries contracted by -15.8% yoy, hitting USD 55B. The US, amidst a 14-month streak of declines, saw a -9.3% yoy contraction in goods from China, totaling USD 46B. European Union imports from China also fell by -11.6% yoy. In contrast, Russia exhibited a robust appetite for Chinese goods, with exports soaring by 20.6% yoy.
On the import front, China's inbound shipments contracted by -6.2% yoy to USD 221.4B, marking the seventh consecutive monthly decline but showing a slower pace compared to August's -7.3% yoy contraction. Consequently, trade surplus widened to USD 77.7B, outperforming market expectations.
Inflation dynamics within the country presented another layer of economic intricacies. China's CPI stagnated at 0.0% yoy in September, pulled down by a -3.2% yoy decline in food prices, and falling short of the anticipated 0.2% yoy increase. The National Bureau of Statistics cited a high base of comparison with last year and abundant food supply ahead of the Golden Week holiday as key factors behind the subdued inflation.
Simultaneously, PPI showed a -2.5% yoy decline, extending the 12-month streak of contraction yet revealing an easing trend from August's -3.0% yoy drop.
GBP/USD Mid-Day Outlook
Daily Pivots: (S1) 1.2121; (P) 1.2226; (R1) 1.2281; More
Intraday bias in GBP/USD remains mildly on the downside at this point. Recovery from 1.2035 should have completed at 1.2336, after hitting falling channel resistance. Deeper decline would be seen to retest 1.2036 low. Decisive break there will resume larger fall from 1.3141. On the upside, above 1.2336 minor resistance will resume the rebound instead.
In the bigger picture, fall from 1.3141 medium term top could still be a correction to up trend from 1.0351 (2022 low) only. But risk of complete trend reversal is rising. Sustained break of 38.2% retracement of 1.0351 to 1.3141 at 1.2075 will pave the way to 61.8% retracement at 1.1417. For now, risk will stay on the downside as long as 55 D EMA (now at 1.2420) holds, in case of rebound.
Economic Indicators Update
| GMT | Ccy | Events | Actual | Forecast | Previous | Revised |
|---|---|---|---|---|---|---|
| 21:30 | NZD | Business NZ PMI Sep | 45.3 | 46.1 | ||
| 23:50 | JPY | Money Supply M2+CD Y/Y Sep | 2.40% | 2.40% | 2.50% | |
| 01:30 | CNY | CPI Y/Y Sep | 0.00% | 0.20% | 0.10% | |
| 01:30 | CNY | PPI Y/Y Sep | -2.50% | -2.40% | -3.00% | |
| 03:00 | CNY | Trade Balance (USD) Sep | 77.7B | 73.7B | 68.4B | |
| 06:30 | CHF | Producer and Import Prices M/M Sep | -0.10% | 0.20% | -0.20% | |
| 06:30 | CHF | Producer and Import Prices Y/Y Sep | -1.00% | -0.80% | ||
| 09:00 | EUR | Eurozone Industrial Production M/M Aug | 0.60% | 0.10% | -1.10% | -1.30% |
| 12:30 | USD | Import Price Index M/M Sep | 0.10% | 0.60% | 0.50% | |
| 14:00 | USD | Michigan Consumer Sentiment Index Oct P | 68 | 68.1 |
Aussie Stabilizes after Sliding on US Inflation
- China inflation dips to 0.0%
- Australian dollar sinks after US inflation and employment data
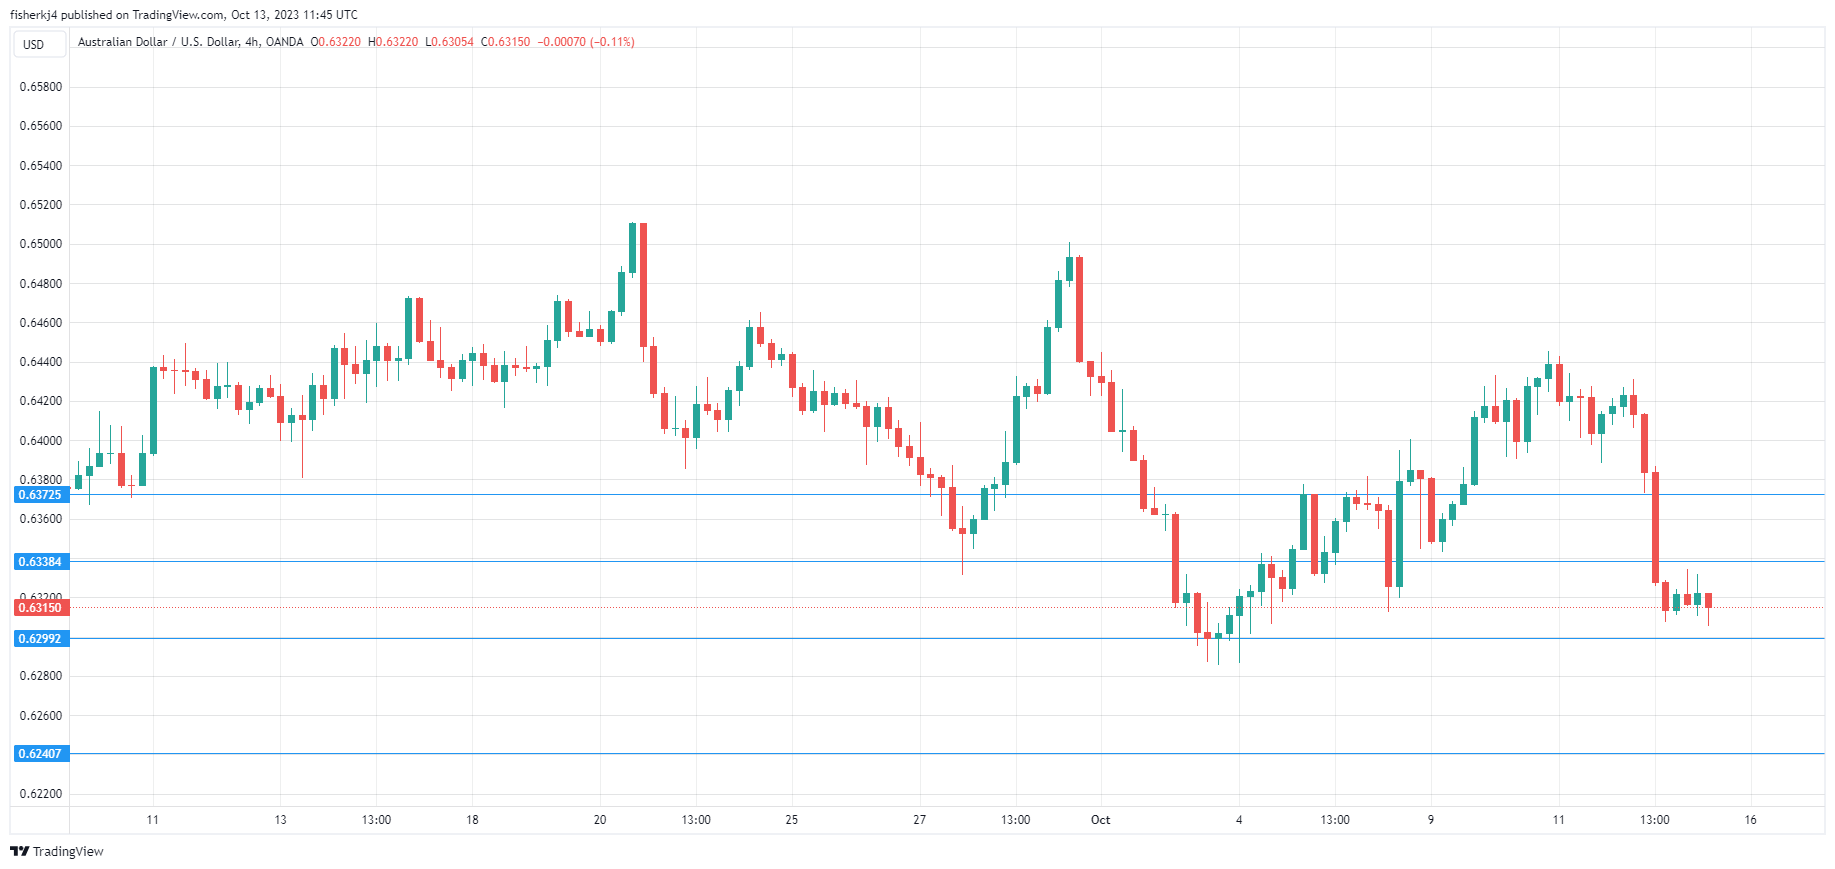
The Australian dollar is unchanged on Friday, trading at 0.6312. The Aussie was roughed up by the US dollar a day earlier and plummeted 1.56%, its largest one-day decline since August.
The sharp downswing was driven by US inflation and unemployment reports on Thursday. Inflation remained unchanged at 3.7% in September, but this disappointed the markets as the consensus estimate stood at 3.6%. Unemployment claims were unchanged at 209,000, as the US labour market remains at historically tight levels. The strong US numbers gave the US dollar a significant boost against the major currencies and risk currencies like the Australian dollar were particularly hit hard.
The data points to strength in the US economy, which could result in the Fed being forced to maintain elevated rates, perhaps even raising rates one final time before the end of the year. The Fed rate odds stand at 29.5% for a quarter-point increase before year’s end, which means that the markets are expecting the Fed to hold rates into 2024 but have not ruled out a hike before then.
China’s inflation falls to 0.0%
Another headache for the Australian dollar is the economic slowdown in China, which is Australia’s largest trading partner. China’s inflation was 0% y/y in September, following 0.1% in August and missing the market consensus of 0.2%. China continues to grapple with deflationary pressures and expectations for a strong recovery after the Covid restrictions were scrapped have not materialized. The slowdown in the world’s number two economy could trigger a global recession and is bad news for Australia’s export sector and for the Australian dollar. Since August 1st, AUD/USD has declined 400 basis points and the outlook for the Aussie remains challenging.
AUD/USD Technical
- AUD/USD is putting pressure on resistance at 0.6338. Above, there is resistance at 0.6372
- 0.6299 and 0.6240 are providing support
EURUSD Analysis: New Test for Support Level of 1.0500
Yesterday, another indicator of inflation in the United States was published — the CPI (Consumer Price Index). Like the PPI (Producer Price Index), the values of which were published on Wednesday, the CPI index indicated that inflation in the US remains stable (actual = 3.7%, forecast = 3.6%, a month earlier = 3.7%, two months earlier = 3.2%), however, this time, the reaction of market participants was sharper:
→ the stock market declined;
→ gold fell in price (although buyers in the Asian session on Friday contributed to the recovery);
→ the dollar index rose sharply.
Before the publication of news about inflation, the probability of a rate hike at the December Fed meeting was at 28%, but now it is 40%. The thesis “higher rates for a longer time” has returned to relevance.
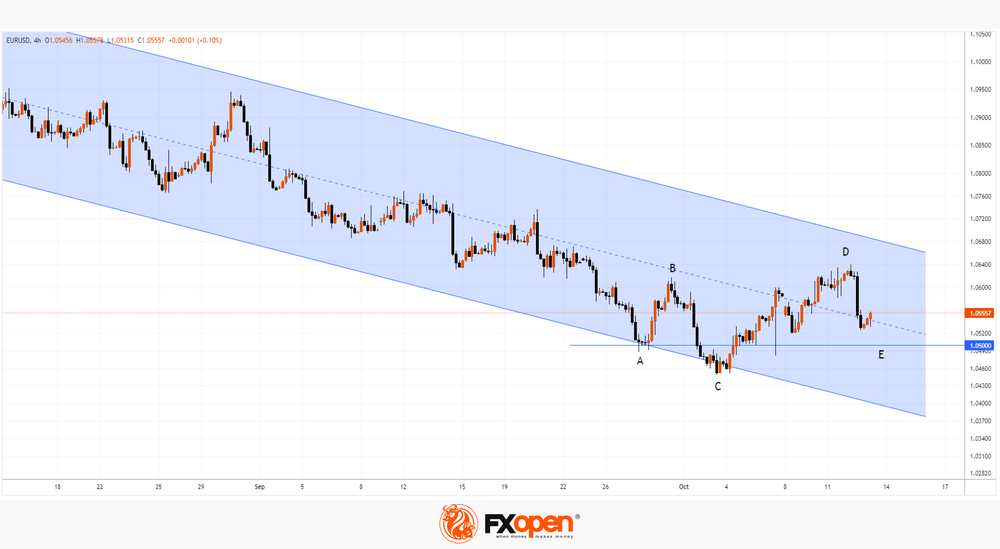
For a technical analyst, changes in sentiment and spikes in volatility provide a new piece of valuable information. Let's take the EUR/USD chart for example.
Yesterday's news reversed the course from top to bottom, with the price of the euro falling towards the important level of 1.0500:
→ it is a round level, so it has a psychological effect;
→ at the end of September (A), level 1.05 served as a support for a rebound to top B;
→ after a slight dip below the 1.05 level in October, which can be interpreted as a false bearish breakout, the bulls demonstrated the ability to form a C→D rally — quite stable for the current downward channel (shown in blue).
The bearish impulse that appeared after yesterday's news created intrigue — will the level of 1.05 be able to resist? If yes, we can see the inverted head-and-shoulders pattern as the basis for an upward exit from a protracted bearish trend.
This article represents the opinion of the Companies operating under the FXOpen brand only. It is not to be construed as an offer, solicitation, or recommendation with respect to products and services provided by the Companies operating under the FXOpen brand, nor is it to be considered financial advice.
Probability of Oil Prices Rising to $100 Is Increasing
This week, Saudi energy minister Prince Abdulaziz bin Salman visited Moscow to discuss plans for oil production in the context of the Israeli-Palestinian conflict. The Russian president announced that Saudi Arabia and Russia's production cuts are "likely" to continue.
Meanwhile, Magid Shenouda, deputy chief executive of commodities trading giant Mercuria, told the industry conference in the UAE that oil prices could reach USD 100 a barrel if the situation in the Middle East worsens.
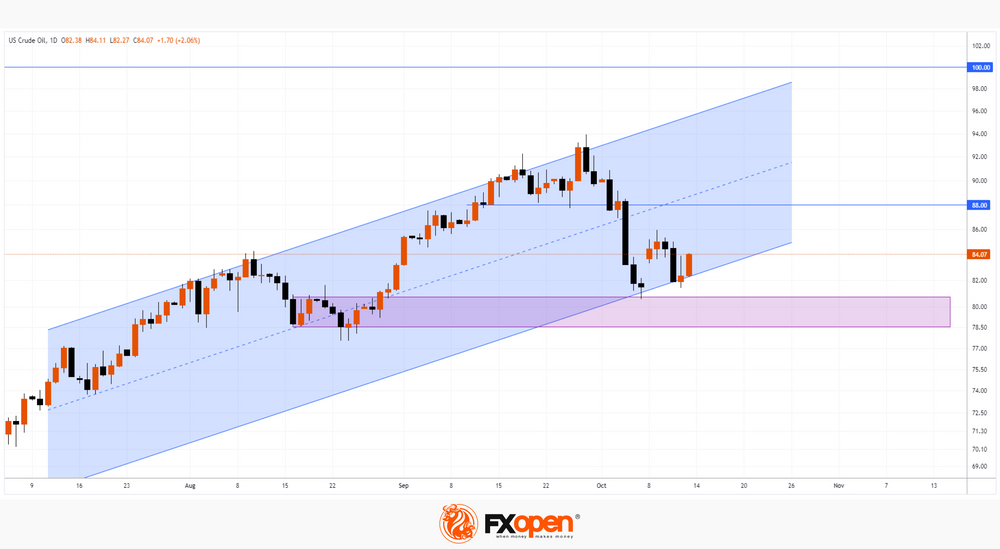
The chart shows that USD 100 a barrel has become more likely due to price action:
→ in August, a range was formed (shown in purple), from which the price moved up, indicating that demand had gained dominance over supply. And it looks like this zone may provide support to the bulls;
→ bulls can also count on support from the lower border of the parallel channel (shown in blue) and events this week show that this line provides significant support;
→ the price closed the bullish gap of Monday – from the point of view of technical analysis, the chances of growth have increased.
The weekend is approaching. If the coming days also bring an escalation in Israel, it is possible that this will give a new impetus to the price towards the psychological mark of USD 100 per barrel.
This article represents the opinion of the Companies operating under the FXOpen brand only. It is not to be construed as an offer, solicitation, or recommendation with respect to products and services provided by the Companies operating under the FXOpen brand, nor is it to be considered financial advice.
XAU/USD: Gold Rises Further and on Track for Biggest Weekly Gains in Over Six Months
Gold price rose to the highest in more than two weeks on Friday, as bulls regained control after pausing on Thursday, following short-lived drop, inspired by higher than expected US inflation in September.
Prevailing view that Fed’s tightening cycle is near its end offset potential stronger impact from elevated Sep consumer prices, offering fresh support to bullion, already underpinned by increased safe haven demand on growing uncertainty over the latest crisis in the Middle East.
Fresh extension of recovery leg from $1810 (Oct 6 low) retraced over 50% of $1947/$1810 bear-leg), exposing key barriers at $1895/$1900 (Fibo 61.8% / psychological) and increasing the prospects for further gains on break.
Bullishly aligned daily studies also support recovery, while this week’s action (the biggest weekly gain since mid-March) is about to form a large weekly bullish candle and form reversal pattern on weekly chart, contributing to initial positive signal from last week’s bear-trap under 200WMA.
Broken Fibo 50% and 20DMA ($1878/76) should keep the downside protected.
Res: 1890; 1895; 1900; 1915.
Sup: 1878; 1869; 1862; 1853.
USD/JPY Heads Closer to 150 after US Inflation Report
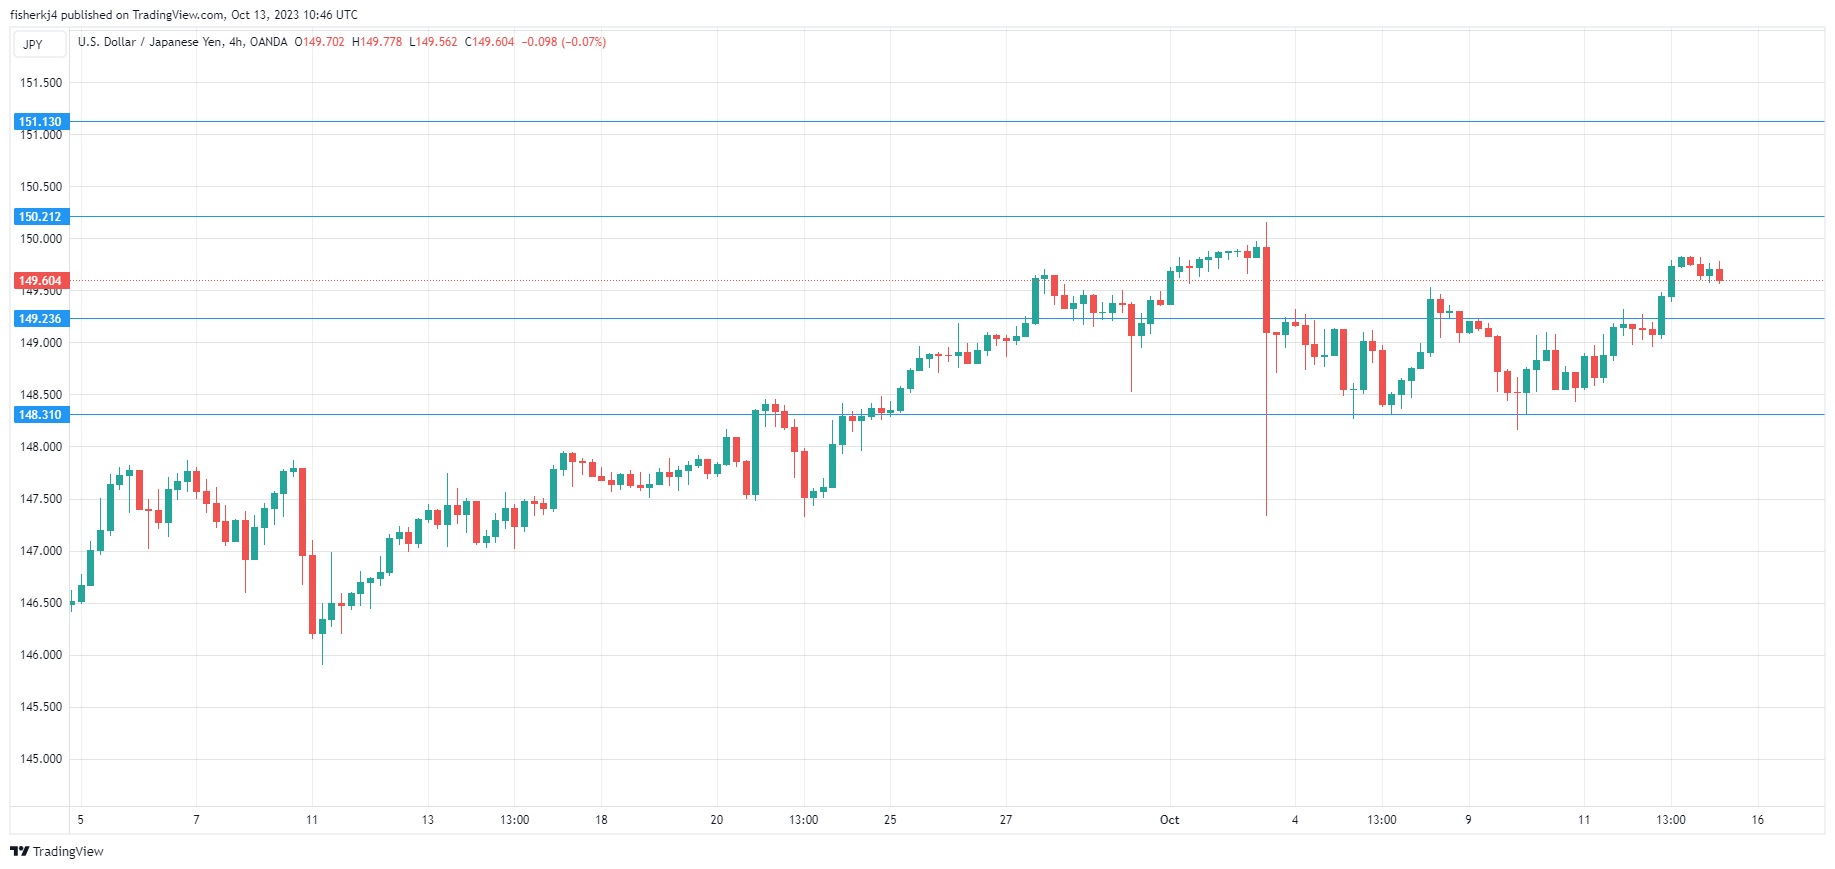
The Japanese yen is slightly lower on Friday. In the European session, USD/JPY is trading at 149.63, down 0.12%.
The US inflation report for September was unchanged at 3.7% y/y, but this was higher than the market estimate of 3.6% y/y and the market reaction sent the US dollar higher against all the major currencies. USD/JPY rose 0.43% on Thursday, hitting a high of 149.82. The yen has recovered slightly but the critical 150 line remains within striking distance.
Will the yen breach 150?
Earlier in the month, the yen spiked higher after breaching 150 and the markets were abuzz with speculation that the Ministry of Finance (MOF) had intervened to prop up the yen. The MoF kept the markets guessing, as it likes to do, but the central bank’s money market data indicated that it likely did not intervene. Still, the 150 line remains a psychologically important level and another breach could trigger volatility from the Japanese currency.
The markets responded to the higher-than-expected US inflation release, as expectations increased that the Fed would be forced to continue its “higher for longer” rate policy and could even raise rates one final time before the end of the year. Overshadowed by all the talk about the hot CPI was the fact that the core rate dropped from 4.3% to 4.1%, matching expectations. This should encourage the Fed, which pays more attention to the core rate, as it is considered a better gauge of inflation trends.
US unemployment claims pointed to a resilient labor market that has cracks but refuses to break. For the week ending October 7th, unemployment claims were unchanged at 209,000, below the estimate of 210,000. This is further evidence that the labour market remains very tight, which is complicating the Fed’s efforts to bring inflation back down to the 2% target.
USD/JPY Technical
- 150.21 and 151.13 are the next resistance lines
- 149.23 and 148.31 are providing support
New Zealand Dollar Extends Losses after Plunge
- US headline CPI higher than expected
- US jobless claims remain low
- New Zealand Manufacturing Index declines
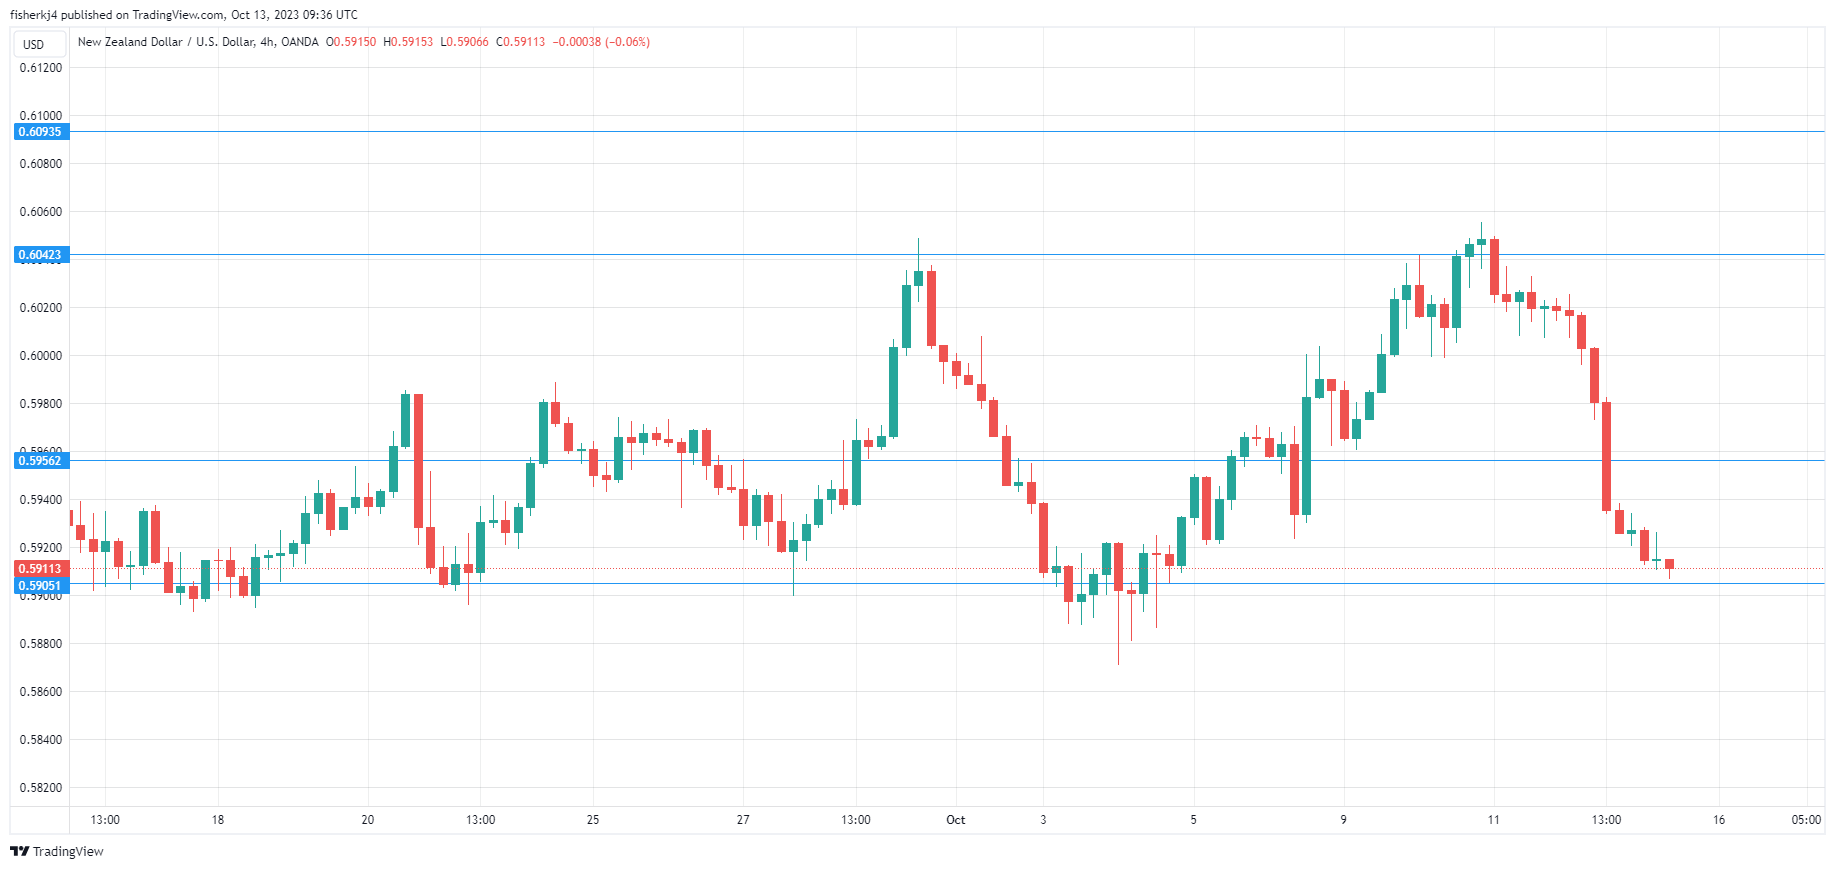
The New Zealand dollar is lower on Friday after a massive plunge a day earlier. In the European session, NZD/USD is trading at 0.5911, down 0.25%.
The US inflation report was stronger than expected, and the US dollar responded with sharp gains against the major currencies. Risk currencies were hit hard, and the New Zealand dollar plunged 1.56%, its worst one-day performance since May.
US inflation and employment reports on Thursday indicated that the economy remains resilient, despite elevated interest rates. US CPI was unchanged in September at 3.7% y/y, higher than the market estimate of 3.6% y/y. Core CPI fell from 4.3% to 4.1% y/y, matching the estimate. Although the core rate is a better gauge of inflation, investors focused on the headline reading, which raised concerns that the Fed will continue its “higher for longer” stance.
US unemployment claims pointed to a resilient labor market that has cracks but refuses to break. For the week ending October 7th, unemployment claims were unchanged at 209,000, below the estimate of 210,000. This is further evidence that the labour market remains very tight and provides further support for the Fed to remain hawkish and possibly raise rates before the end of the year.
The markets are leaning towards the Fed holding rates for the rest of the year but haven’t ruled out one more hike. The probability of a hike before the end of the year jumped to 38% after the inflation report but has fallen to 30%, according to the CME FedWatch Tool.
In New Zealand, the manufacturing sector can’t find its footing. The Business NZ Manufacturing Index contracted to 45.3 in September, down from 46.1 in September. This was a seventh straight decline and was the lowest reading since August 2021. A reading below the 50 level indicates contraction.
NZD/USD Technical
- NZD/USD is testing support at 0.5956. The next support level is 0.5905
- There is resistance at 0.6042 and 0.6093