Sample Category Title
USD/CHF Mid-Day Outlook
Daily Pivots: (S1) 0.8986; (P) 0.9039; (R1) 0.9077; More....
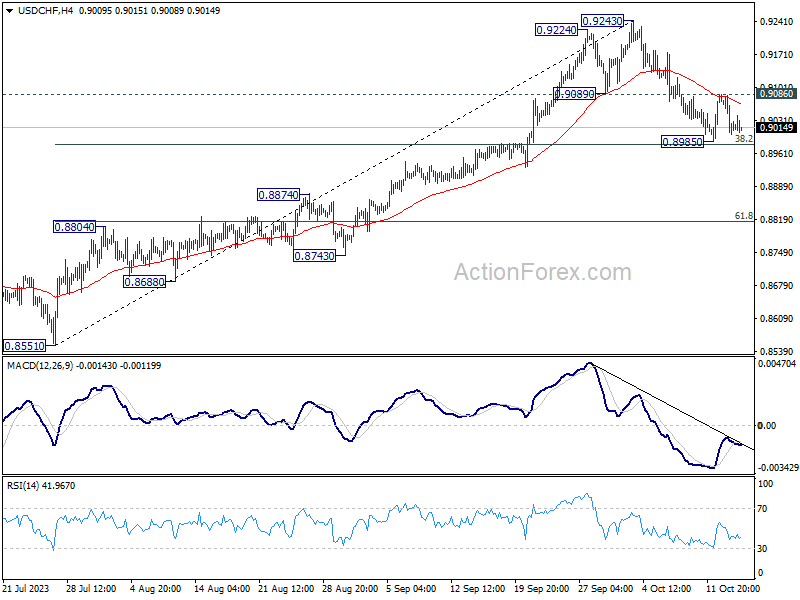
Range trading continues in USD/CHF and intraday bias stays neutral. On the upside, break of 0.9086 resistance will indicate that pull back from 0.9243 has completed, and turn bias to the upside for retesting this high. However, sustained break of 38.2% retracement of 0.8551 to 0.9243 at 0.8979 will argue that deeper fall is under way to 61.8% retracement at 0.8815.
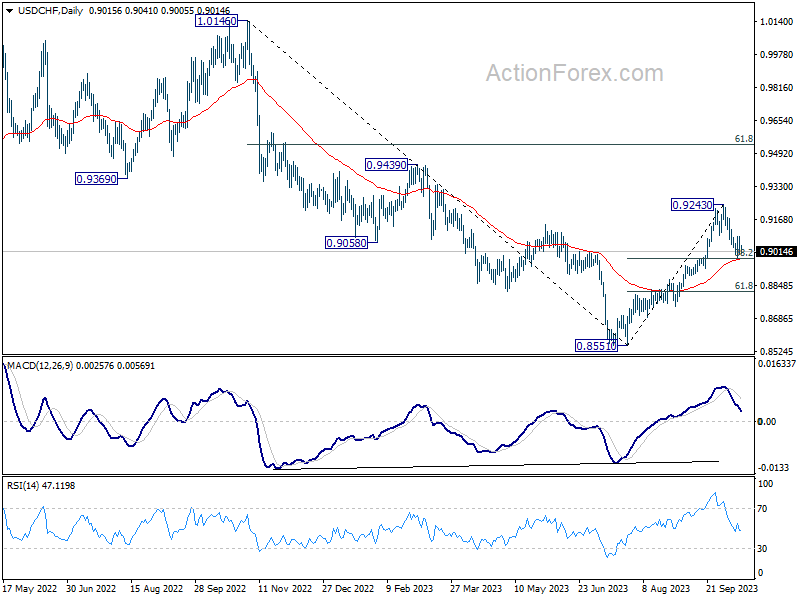
In the bigger picture, as long as 55 D EMA (now at 0.8976) holds rise from 0.8551 is viewed as reversing whole down trend from 1.0146 (2022 high). On resumption, further rise should be seen to 61.8% retracement of 1.0146 to 0.8551 at 0.9537 and above. However, sustained break of 55 D EMA will revive medium term bearishness, for retesting 0.8551 low at a later stage.
Global Markets Hesitate; AUD/NZD Might Display Some Volatility
A quiet yet tense atmosphere pervades the financial markets today, as traders' anticipation builds, eyes keenly focused on unfolding developments in the Israel-Hamas conflicts. Such geopolitical uncertainties are casting a shadow over most major trading hubs, prompting cautious moves among investors.
In the European markets, major indexes are painting a mixed image. FTSE is registering a modest ascent, a contrast to the stable stance of its counterparts. Across the pond, DOW futures hint at a bullish open, yet questions linger on the longevity of this buying momentum. In the energy market, oil prices are on a modest upward incline, though bereft of significant momentum. Gold, in the meantime, is in a phase of consolidation, holding firm to the gains achieved in the preceding week.
In the realm of forex, a similar pattern emerges. Major currency pairs and crosses are ensnared within the trading ranges established last Friday. Dollar, Yen, and Swiss Franc are trending softer. Contrarily, Kiwi and Aussie are faring stronger, joined by Sterling and Euro. The prevailing sentiment, however, hovers in a neutral zone, susceptible to rapid shifts should geopolitical events take an unexpected turn.
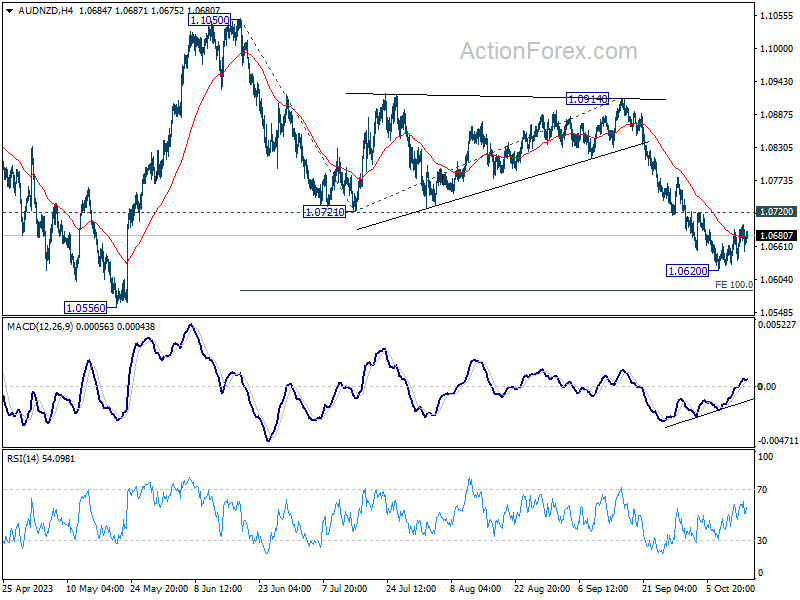
In the upcoming Asian session, the spotlight shifts to New Zealand's CPI data and release of RBA minutes. That makes AUD/NZD an interesting one to watch. Technically, the cross recovered after falling to 1.0620 a week ago. Price actions from there are still clearly corrective. Near term outlook will stay bearish as long as 1.0720 resistance holds. Fall from 1.1050 is still in favor continue to 100% projection of 1.1050 to 1.0721 from 1.0914 at 1.0585 next.
In Europe, at the time of writing, FTSE is up 0.43%. DAX is up 0.02%. CAC is up 0.13%. Germany 10-year yield is up 0.042 at 2.779. Earlier in Asia, Nikkei fell -2.03%. Hong Kong HSI fell -0.97%. China Shanghai SSE fell -0.46%. Singapore Strait Times fell -0.69%. Japan 10-year JGB yield dropped -0.0036 to 0.755.
Canada manufacturing sales up 0.7% mom, but down -0.7% mom in real terms
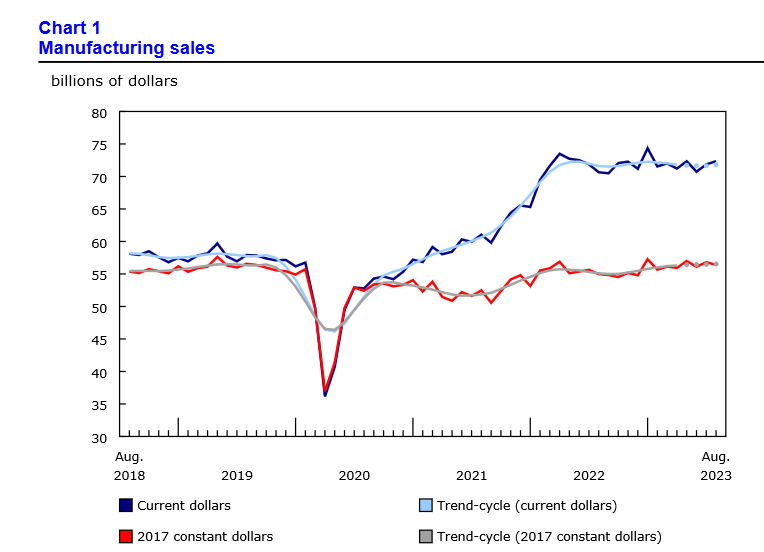
Canadian manufacturing sales rose 0.7% mom to CAD 72.4B in August, below expectation of 1.1% mom. Sales were higher in 9 of 21 sectors, led by the petroleum and coal (+10.5%), food (+1.5%) and machinery (+2.4%) subsectors. Sales of fabricated metals (-3.5%) and miscellaneous (-9.4%) declined the most.
Sales in real terms, however, decreased -0.7% mom.
BoE's Pill highlights incomplete inflation journey amidst falling headline rates
Speaking at a forum today, BoE Chief Economist Huw Pill asserted, "We still have some work to do in order to get back to 2%."
"And we probably have some work to do to ensure that when we get it back to 2%, we do so in a way that is sustainable," he added.
Pill voiced concerns over interpreting the recent decline in headline inflation as a success. He pointed out that the declining rate is "certainly not sufficient" to claim that their inflationary objectives have been met.
Emphasizing the need for a consistent strategy, he said, "If we have a persistent component of inflation, it seems natural to me that we have a persistent monetary response to it."
"It is important that we do not declare victory prematurely just because movements which are relatively mechanical in headline inflation are working their way through."
Eurozone goods exports down -3.9% yoy, imports down -24.6% yoy
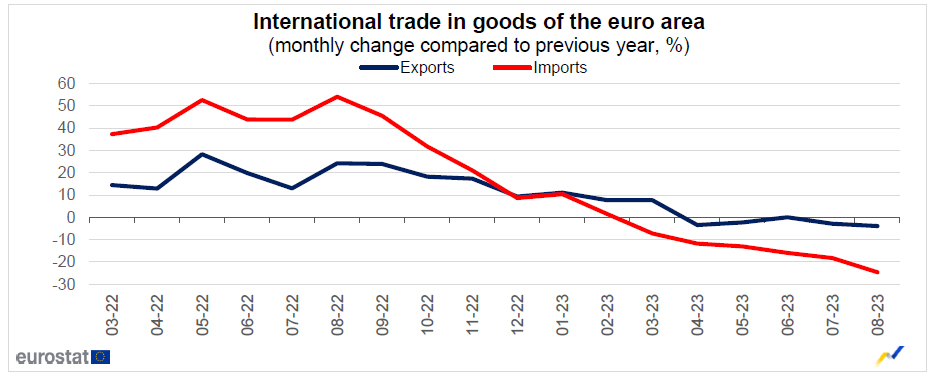
Eurozone goods expects dropped -3.9% yoy to EUR 221.6B in August. Goods imports fell -24.6% yoy to EUR 214.9B. Trade surplus came in at EUR 6.7B. Intra-Eurozone trade fell -13.2% yoy to EUR 189.3B.
In seasonally adjusted term, goods exports rose 1.6% mom to EUR 236.0B. Goods imports dropped -2.0% mom to EUR 223.1B. Trade surplus widened to EUR 11.9B, above expectation of EUR 5.4B. Intra-Eurozone trade fell from EUR 217.2B to 216.9B.
New Zealand BNZ service rose to 50.7, yet uncertainties linger
New Zealand's service sector showed signs of recovery in September, with BusinessNZ Performance of Services Index rising to 50.7, up from 47.7 in August. This improvement marks an end to the three consecutive months of contraction, though the index is still languishing below the long-term average of 53.5.
Among the key components, activity/sales witnessed a notable rise, moving up to 50.9 from 44.9. Meanwhile, employment indicators slightly dipped from 51.0 to 50.6. New orders/business experienced a healthy increase, reaching 53.9 from 48.5. However, stocks/inventories decreased to 47.9 from 51.4, while supplier deliveries inched up to 49.6 from 49.2.
Addressing the sentiment, BusinessNZ's Chief Executive, Kirk Hope, pointed out that negative sentiments remained prevalent, with 61.8% in September, only slightly lower than 63.9% in August. A significant portion of these concerns was attributed to uncertainties surrounding the General Election and rising cost of living.
USD/CHF Mid-Day Outlook
Daily Pivots: (S1) 0.8986; (P) 0.9039; (R1) 0.9077; More....
Range trading continues in USD/CHF and intraday bias stays neutral. On the upside, break of 0.9086 resistance will indicate that pull back from 0.9243 has completed, and turn bias to the upside for retesting this high. However, sustained break of 38.2% retracement of 0.8551 to 0.9243 at 0.8979 will argue that deeper fall is under way to 61.8% retracement at 0.8815.
In the bigger picture, as long as 55 D EMA (now at 0.8976) holds rise from 0.8551 is viewed as reversing whole down trend from 1.0146 (2022 high). On resumption, further rise should be seen to 61.8% retracement of 1.0146 to 0.8551 at 0.9537 and above. However, sustained break of 55 D EMA will revive medium term bearishness, for retesting 0.8551 low at a later stage.
Economic Indicators Update
| GMT | Ccy | Events | Actual | Forecast | Previous | Revised |
|---|---|---|---|---|---|---|
| 21:30 | NZD | Business NZ PSI Sep | 50.7 | 47.1 | 47.7 | |
| 23:01 | GBP | Rightmove House Price Index M/M Oct | 0.50% | 0.40% | ||
| 04:30 | JPY | Industrial Production M/M Aug F | -0.70% | 0.00% | 0.00% | |
| 09:00 | EUR | Eurozone Trade Balance (EUR) Aug | 11.9B | 5.4B | 2.9B | 3.5B |
| 12:30 | CAD | Manufacturing Sales M/M Aug | 0.70% | 1.10% | 1.60% | |
| 12:30 | CAD | Wholesale Sales M/M Aug | 2.30% | 2.50% | 0.20% | 0.00% |
| 12:30 | USD | Empire State Manufacturing Index Oct | -4.6 | -4.5 | 1.9 | |
| 14:30 | CAD | BoC Business Outlook Survey |
Canada manufacturing sales up 0.7% mom, but down -0.7% mom in real terms
Canadian manufacturing sales rose 0.7% mom to CAD 72.4B in August, below expectation of 1.1% mom. Sales were higher in 9 of 21 sectors, led by the petroleum and coal (+10.5%), food (+1.5%) and machinery (+2.4%) subsectors. Sales of fabricated metals (-3.5%) and miscellaneous (-9.4%) declined the most.
Sales in real terms, however, decreased -0.7% mom.
NIKKEI (NKD_F) Found Buyers After Elliott Wave Double Three Pattern
Hello fellow traders. In this technical article we’re going to take a look at the Elliott Wave charts charts of NIKKEI Futures published in members area of the website. As our members know NIKKEI Futures has recently made pull back that has unfolded as Elliott Wave Double Three Pattern. It made clear 7 swings from the June 16th peak and completed correction right at the Equal Legs zone( Blue Box Area) . In further text we’re going to explain the Elliott Wave pattern and forecast
Elliott Wave Double Three Pattern
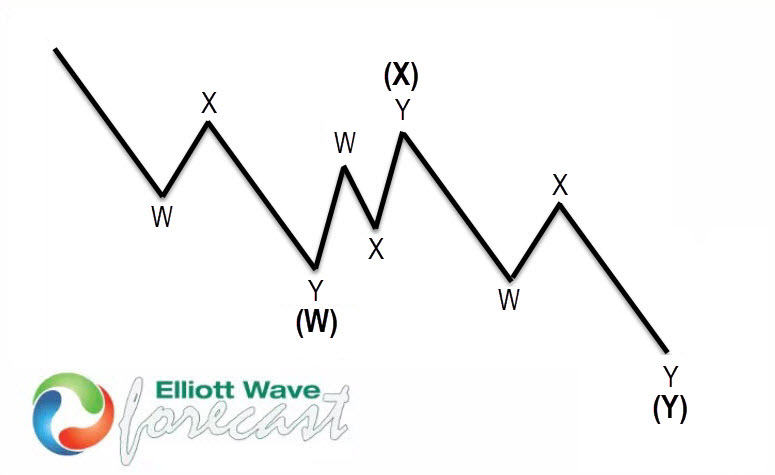
Double three is the common pattern in the market , also known as 7 swing structure. It’s a reliable pattern which is giving us good trading entries with clearly defined invalidation levels.
The picture below presents what Elliott Wave Double Three pattern looks like. It has (W),(X),(Y) labeling and 3,3,3 inner structure, which means all of these 3 legs are corrective sequences. Each (W) and (Y) are made of 3 swings , they’re having A,B,C structure in lower degree, or alternatively they can have W,X,Y labeling.
NIKKEI Elliott Wave 4 Hour Chart 10.05.2023
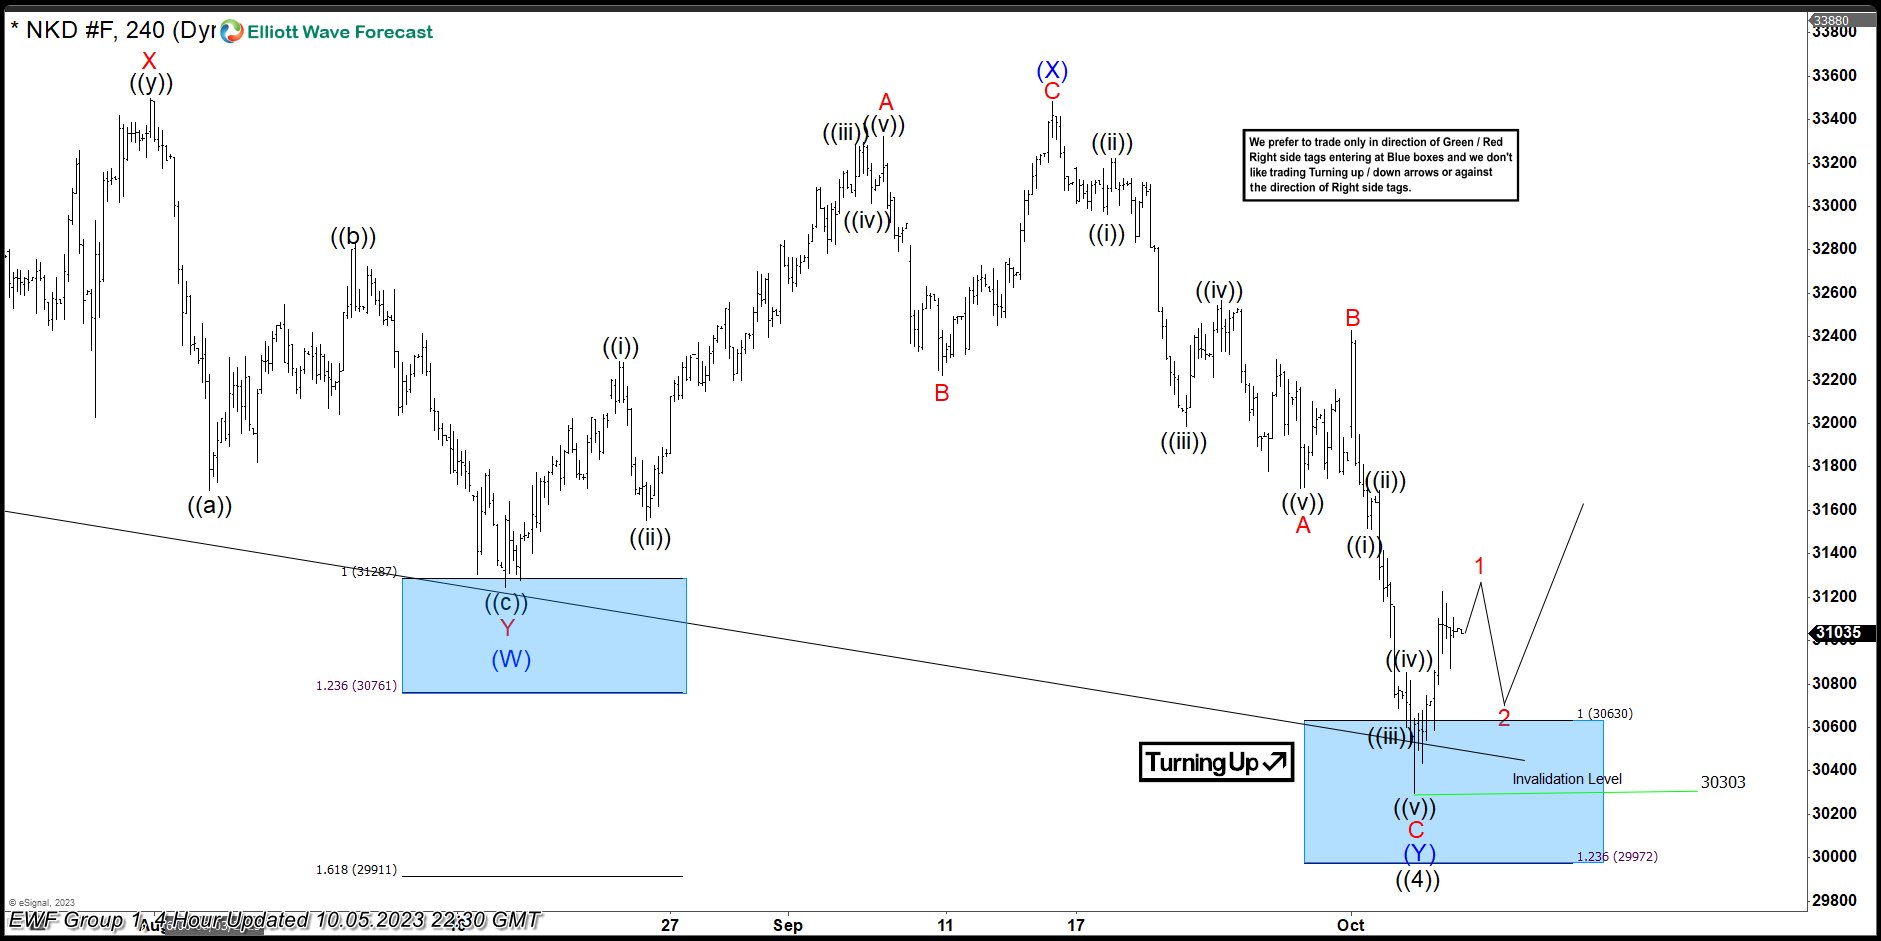
NIKKEI made correction that unfolded as a 7 swings pattern. Pull back has (W)(X)(Y) blue labeling. First leg (W) is having Double Three structure – 3 waves WXY red, while (Y) leg is ABC Zig Zag Pattern. The price reached extreme area at 30630-29972 blue box ( buying zone). There is already enough number of swings to call structure complete at 30303 low. However, we would like to see further separation from the low to confirm. We expect NIKKEI to make a rally toward new highs or in 3 waves bounce alternatively.
NIKKEI Elliott Wave 4 Hour Chart 10.14.2023
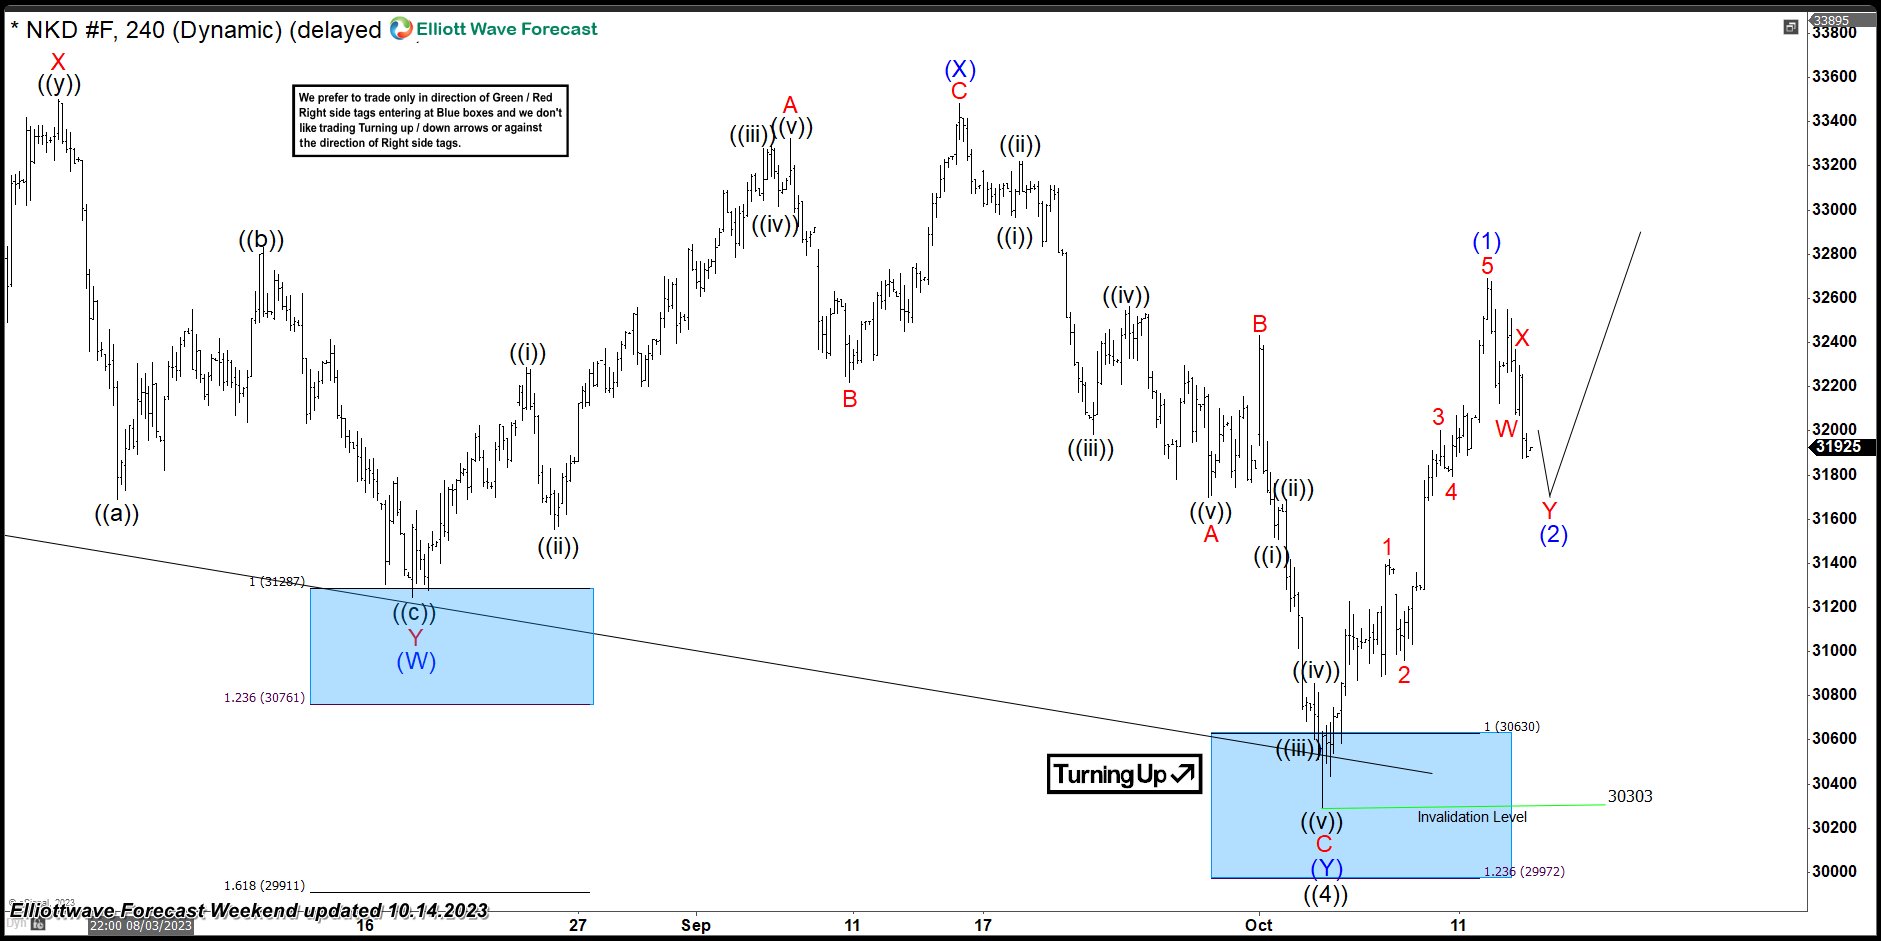
NIKKEI found buyers as expected. The futures made further rally from the Blue Box and made 5 waves up from the 30303 low. Bounce already reached 50 fibs against the (X) blue connector which confirms cycle from the peak is done for sure. Consequently, any long positions from the equal legs area should be risk free by now. We call wave ((4)) completed at the 30303 low. Once NIKKEI make a break of June 16th high, it will confirm next leg up is in progress.
Bitcoin Locked in a Vice
Market Picture
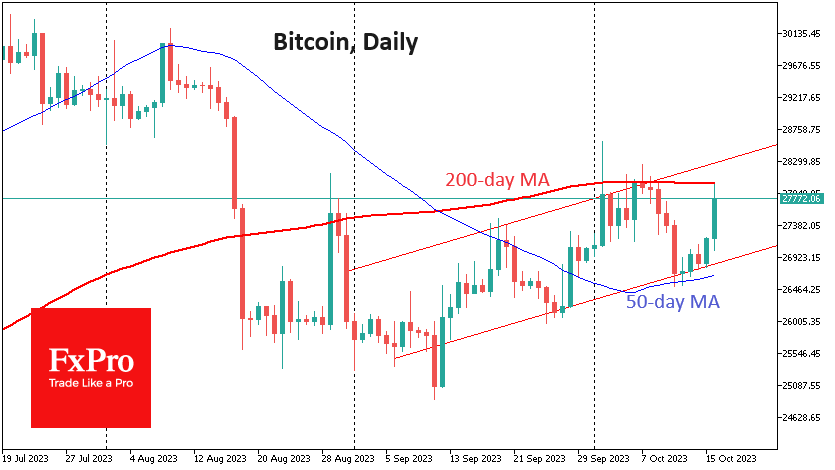
From above, Bitcoin was subjected to a sell-off on the rise to its 200-week average and 200-day average but received new buyers on a dip to its 50-day average last week. Now, all eyes are on the ability to develop gains on rallies above $28K. Bitcoin seems to be sandwiched between two important moving averages. Our eyes are now on its momentum near those curves, and we are closely watching the behaviour near $28K.
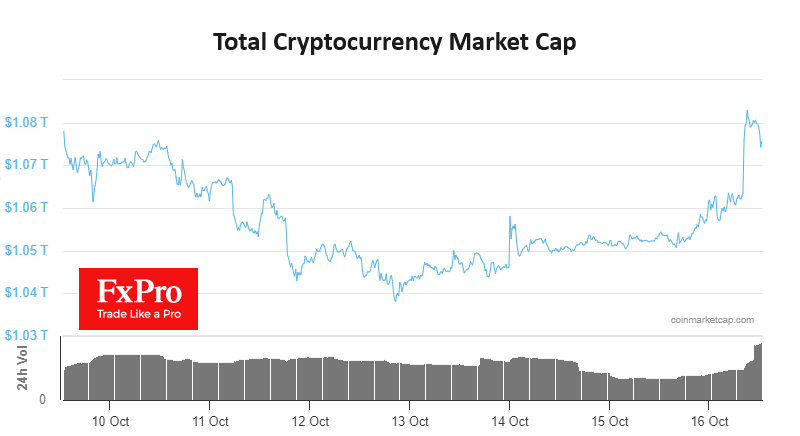
An additional bullish signal is that the crypto market’s volumes are growing along with the price, i.e., significant purchases are taking place. As a rule, such purchases confirmed by volumes can often be followed by a continuation of growth.
News background
The U.S. Securities and Exchange Commission (SEC) will not appeal the court ruling that found the SEC’s refusal to convert Grayscale Bitcoin Trust (GBTC) into a spot bitcoin-ETF unlawful. The appeals court ordered the SEC to reconsider its decision.
G20 countries agreed and approved a roadmap to regulate the crypto industry at the representatives meeting in Marrakesh, Marocco. The goal is to mitigate macroeconomic and financial stability risks associated with digital assets.
CFTC spokeswoman Christine Johnson criticised crypto broker Voyager Digital, which is going through bankruptcy proceedings, for making mistakes that led to the loss of billions of dollars in customer funds.
The New York Times reported that US-based Chinese mining companies have raised national security concerns, citing US government officials.
Italian sports car maker Ferrari has started accepting cryptocurrency payments from US customers and is ready to provide the same service to European customers.
BoE’s Pill highlights incomplete inflation journey amidst falling headline rates
Speaking at a forum today, BoE Chief Economist Huw Pill asserted, "We still have some work to do in order to get back to 2%."
"And we probably have some work to do to ensure that when we get it back to 2%, we do so in a way that is sustainable," he added.
Pill voiced concerns over interpreting the recent decline in headline inflation as a success. He pointed out that the declining rate is "certainly not sufficient" to claim that their inflationary objectives have been met.
Emphasizing the need for a consistent strategy, he said, "If we have a persistent component of inflation, it seems natural to me that we have a persistent monetary response to it."
"It is important that we do not declare victory prematurely just because movements which are relatively mechanical in headline inflation are working their way through."
Eurozone goods exports down -3.9% yoy, imports down -24.6% yoy
Eurozone goods exports dropped -3.9% yoy to EUR 221.6B in August. Goods imports fell -24.6% yoy to EUR 214.9B. Trade surplus came in at EUR 6.7B. Intra-Eurozone trade fell -13.2% yoy to EUR 189.3B.
In seasonally adjusted term, goods exports rose 1.6% mom to EUR 236.0B. Goods imports dropped -2.0% mom to EUR 223.1B. Trade surplus widened to EUR 11.9B, above expectation of EUR 5.4B. Intra-Eurozone trade fell from EUR 217.2B to 216.9B.
WTI Oil Technical: Eying for a Potential Bullish Breakout Above 20-day MA
- Last Monday’s Asia session (9 October) gap up in price actions seen in WTI crude oil has been filled at the US$83.20 support on Thursday, 12 October.
- A positive follow-through was seen on last Friday, 13 October where its price actions ended with a daily bullish “Marubozu” reversal candlestick pattern.
- Watch the intermediate resistance at US$88.60 which also confluences with the 20-day moving average.
A volatile week for oil prices on the backdrop of escalating geopolitical tensions in the ongoing Israel-Hamas conflict that can potentially spill over to the rest of the Middle East region.
The initial gap up in price actions of around +3% in WTI crude oil futures that ignited during the start of last Monday, 9 October Asian session managed to fill the gap on Thursday, 12 October at the US$83.20 support level before it staged a bullish reversal on Friday, 13 October.
Revival of medium-term bullish momentum
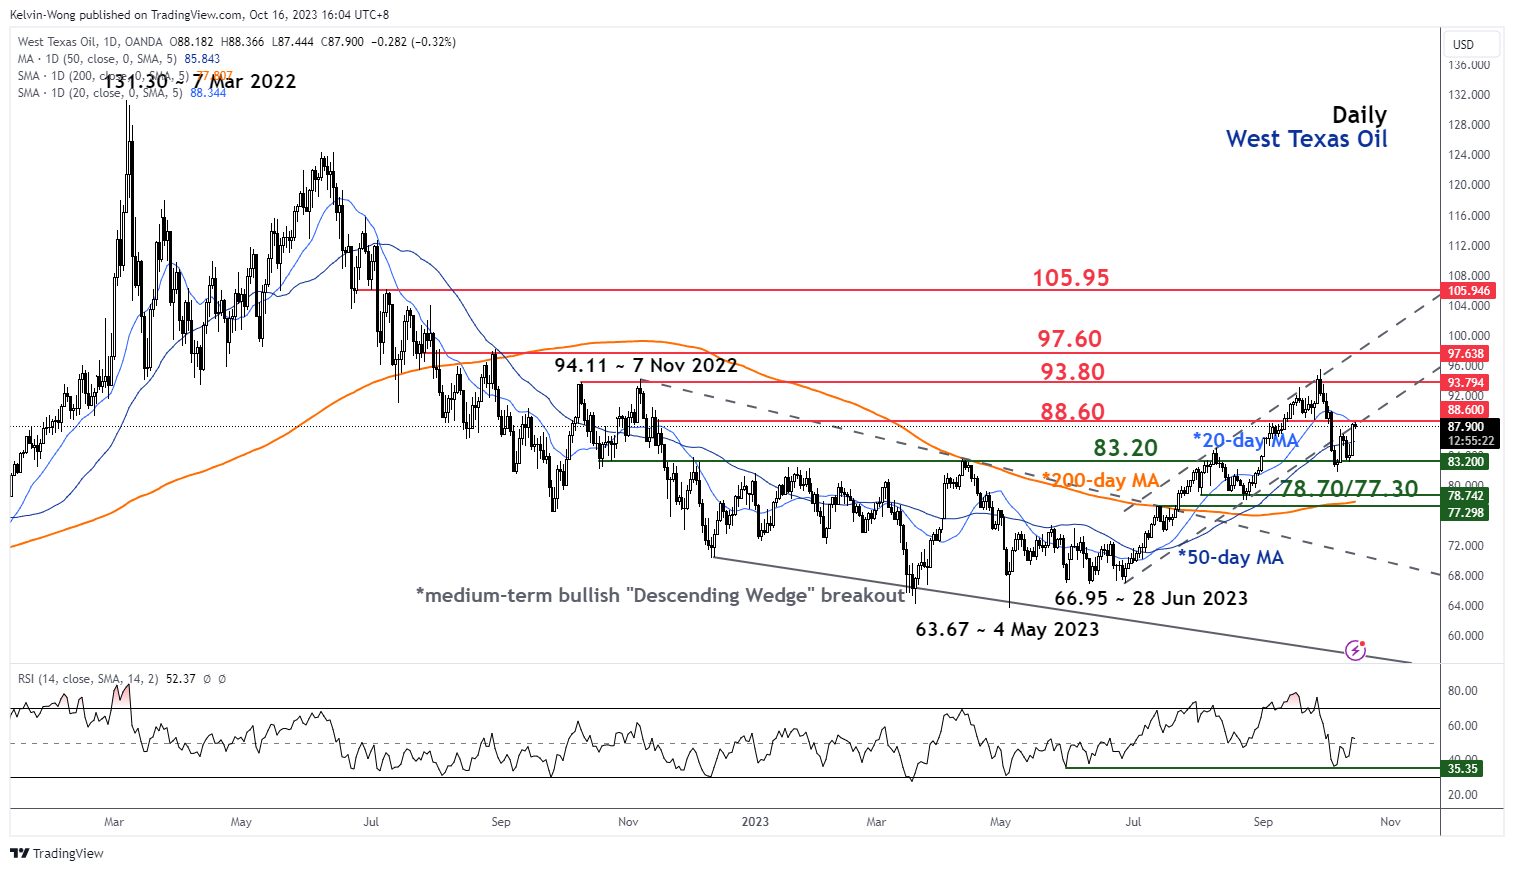
Fig 1: West Texas Oil medium-term trend as of 16 Oct 2023 (Source: TradingView, click to enlarge chart)
Throughout last Friday, 13 October session, the price actions of West Texas Oil (a proxy of WTI crude oil futures) remained on a bullish tone and ended the day with a daily bullish “Marubozu” reversal candlestick pattern.
In addition, the daily RSI momentum indicator has managed to tick higher above its 50 level which suggests a potential revival of medium-term bullish momentum.
May see a minor pull-back at this juncture before a new up move
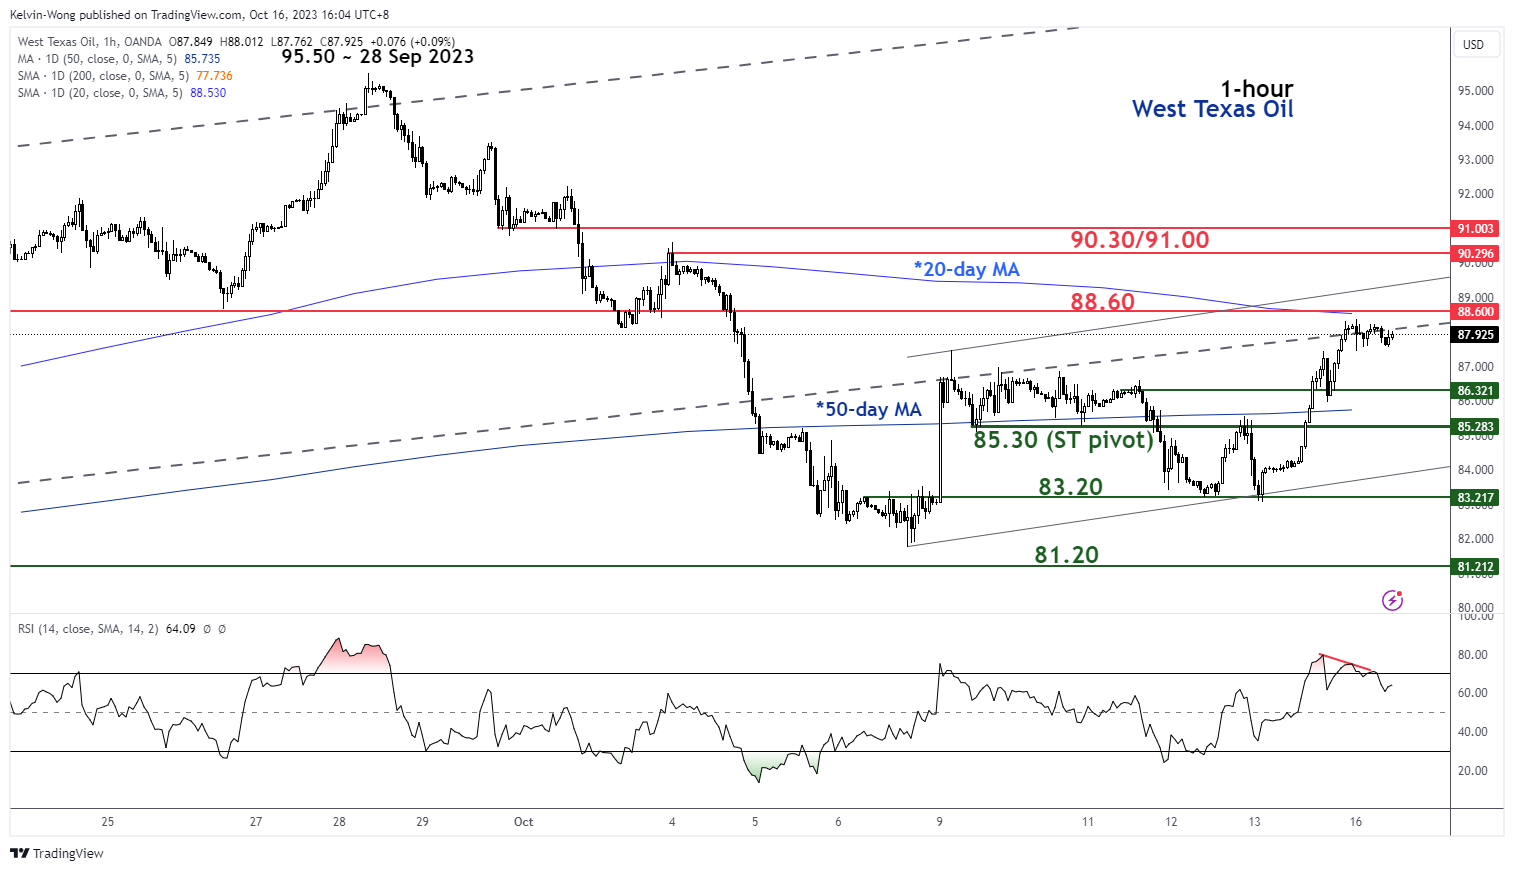
In the lens of technical analysis, price actions of highly tradable instruments do not move in a vertical fashion but rather oscillate within a trend.
Last Friday’s strong upward movement has given rise to a short-term uptrend phase for West Texas Oil in place since the 6 October 2023 low of US$81.77/barrel.
However, the minor burst up in price actions has been overstretched and the hourly RSI oscillator has flashed out a bearish divergence condition right at the overbought region which suggests that West Texas Oil may see a pull-back first to retrace a certain portion of its up move from last Thursday, 12 October low of US$83.20/barrel to Friday, 13 October high of US$88.37/barrel before a new potential up move materializes.
Watch the US$85.30 key short-term support (also the 50-day moving average & the 61.8% Fibonacci retracement of the up move from the 12 October 2023 low to the 13 October 2023 high). A clearance above US$88.60 (20-day moving average) adds impetus for a further potential upside towards the next intermediate resistance of US$90.30/US$91.00 in the first step.
On the other hand, a break below US$85.30 negates the bullish tone for a deeper slide to retest US$83.20.
NZD/USD Rises on Strong Services PMI
In New Zealand:
- New Zealand dollar rebounds after awful week
- Services PMI crawls into expansion territory
- Inflation expected to almost double in third quarter
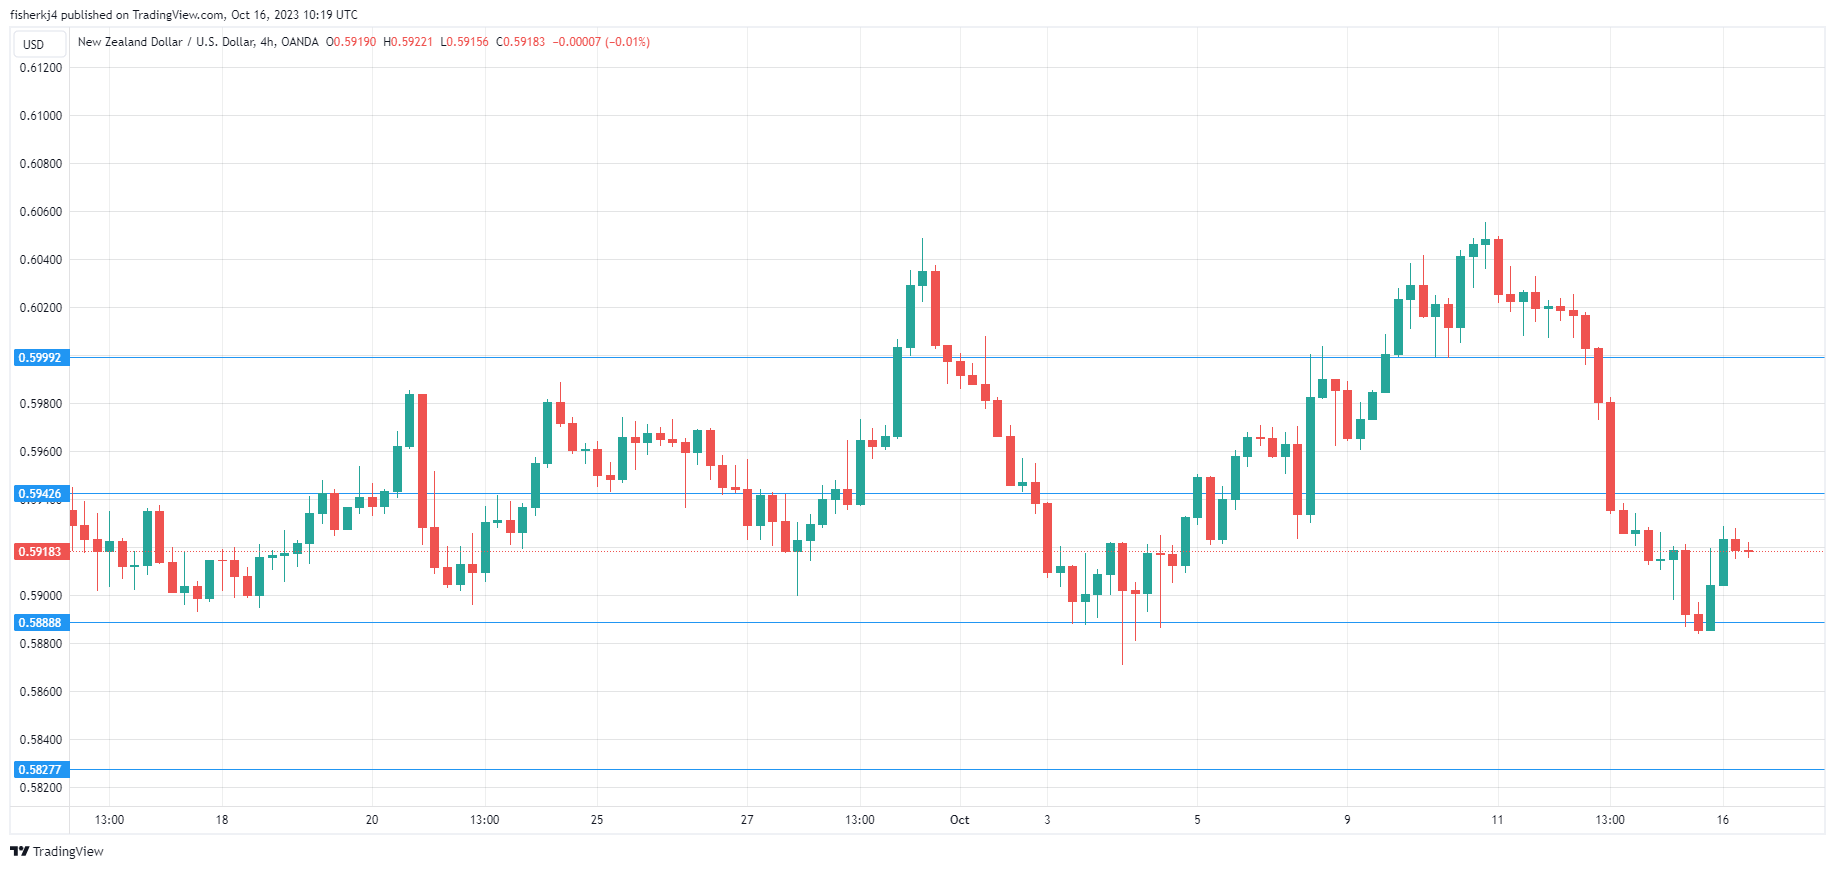
The New Zealand dollar has started the week with strong gains. In the European session, NZD/USD is trading at 0.5919, up 0.55%. It was a miserable week for the News Zealand dollar, which fell 1.74%, its worst weekly performance since August.
The driver for today’s gains was the New Zealand Services PMI, which rose to 50.7 in September, up from 47. 7 in August. This reading is barely in expansion territory, but it indicates a welcome rebound after three straight declines – the 50 level separates contraction from expansion.
As is the case with most major economies, the services sector is in better shape than manufacturing. Last week’s Manufacturing PMI weakened to 45.3 in September, down from 46.1 a month earlier. This marked a seventh straight decline and was the lowest reading since August 2021.
Inflation is still on everyone’s mind and continues to have a strong impact on the currency markets. This was reiterated last week with last Thursday’s US inflation report, which remained unchanged at 3.7% and was just above the market estimate of 3.6%. The release unnerved investors and sent risk appetite and risk currencies tumbling. The New Zealand dollar was steamrolled, sliding 1.54% on Thursday.
New Zealand will release third-quarter inflation on Tuesday. The market estimate stands at 2.0% q/q, which would be a sharp rise from the 1.1% gain in the second quarter. The sharp rise in gasoline prices is expected to boost inflation. Core CPI, which excludes energy prices, will be closely watched by the central bank and policy makers will be looking for a decline on Tuesday. If that doesn’t happen, expectations of a rate hike in November will likely rise.
NZD/USD Technical
- NZD/USD put pressure on resistance at 0.5942 earlier. The next resistance line is 0.5999
- There is support at 0.5888 and 0.5827
Dollar (Safe-Haven) Can Jump to 108 If Geopolitical Tensions Will Expand
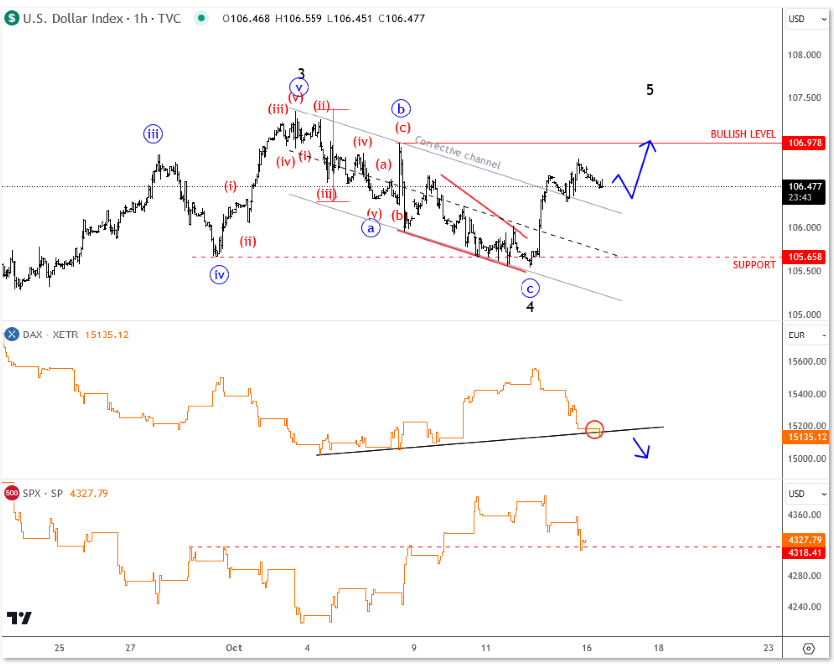
Dollar remains strong, likely looking for more upside after the broken channel. Ideally, the fifth wave will lift price back to October highs while stocks in US are sideways, and even bearish in Europe, with DAX pointing back to the lows. Keep in mind that drop on DXY hourly chart has been clear in three wavs, and now price is also recovering above the channel resistance, so that's a bullish pattern in Elliott wave terms, so looks like investors may stay continue to look for safe-havens, like USD, in line with higher gold, and crude due to geopplitical tensions. These moves can even extend and become more volatile if war expands with Iran joining the war.