

Sample Category Title
EUR/USD Daily Outlook
Daily Pivots: (S1) 1.0526; (P) 1.0544; (R1) 1.0578; More...
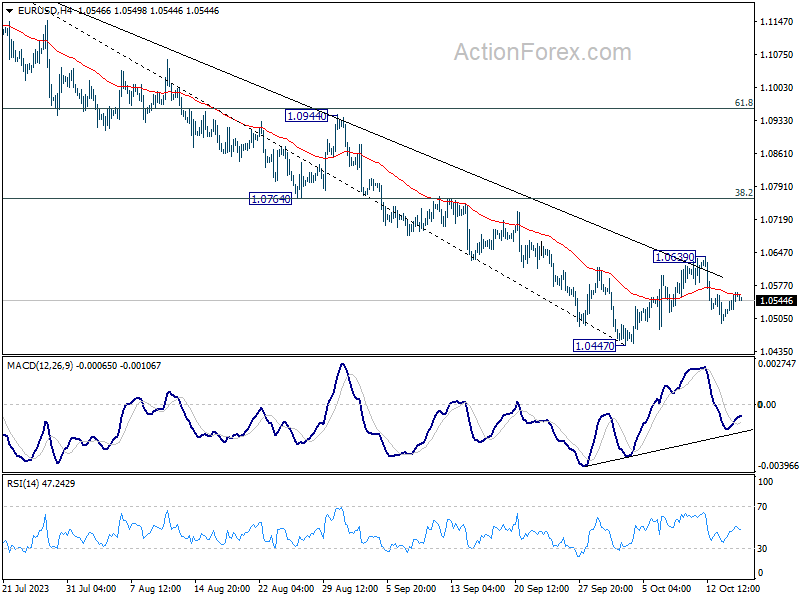
Intraday bias in EUR/USD is turned neutral with 4H MACD crossed above signal line. Near term outlook remains bearish with 1.0639 resistance intact. On the downside, firm break of 1.0447 will resume whole fall from 1.1274 and target 1.0199 fibonacci level. On the upside, however, break of 1.0639 will resume the rebound from 1.0447 to 55 D EMA (now at 1.0697).
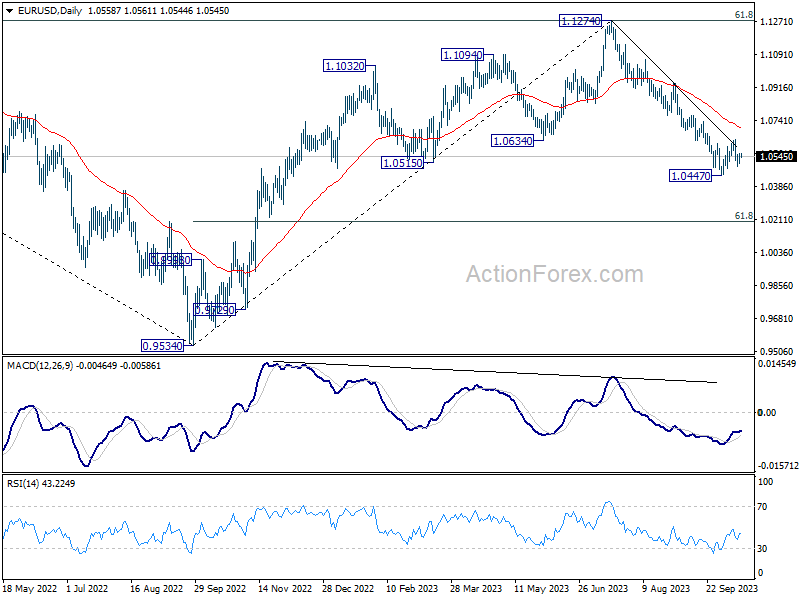
In the bigger picture, fall from 1.1274 medium term top could still be a correction to rise from 0.9534 (2022 low). But chance of a complete trend reversal is rising. In either case, current fall should target 61.8% retracement of 0.9534 to 1.1274 at 1.0199 next. For now, risk will stay on the downside as long as 55 D EMA (now at 1.0697) holds, in case of rebound.
GBP/USD Daily Outlook
Daily Pivots: (S1) 1.2161; (P) 1.2190; (R1) 1.2247; More
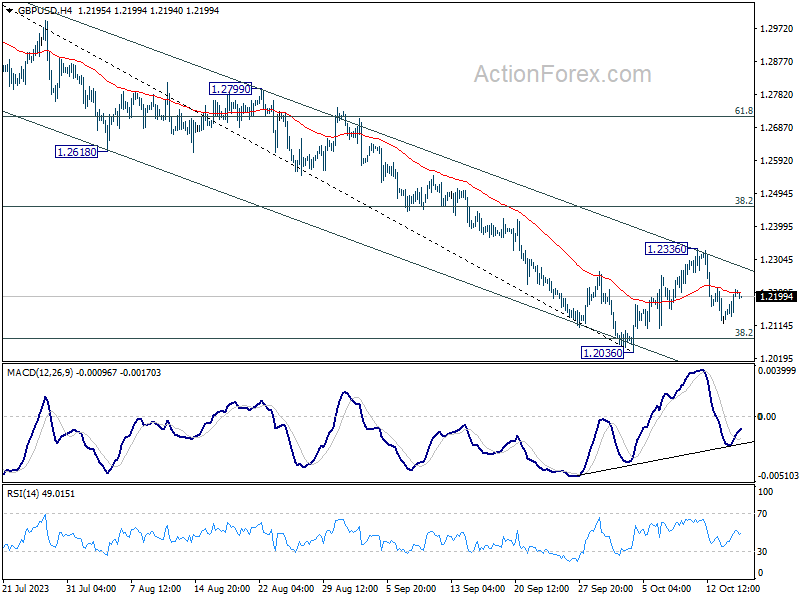
Intraday bias in GBP/USD is turned neutral again with 4H MACD crossed above signal line. Near term outlook stays bearish with 1.2336 resistance intact. On the downside, decisive break of 1.2036 will resume whole decline from 1.3141 for 1.1801 support next. However, break of 1.2336 will resume the rebound from 1.2036 to 55 D EMA (now at 1.2410).
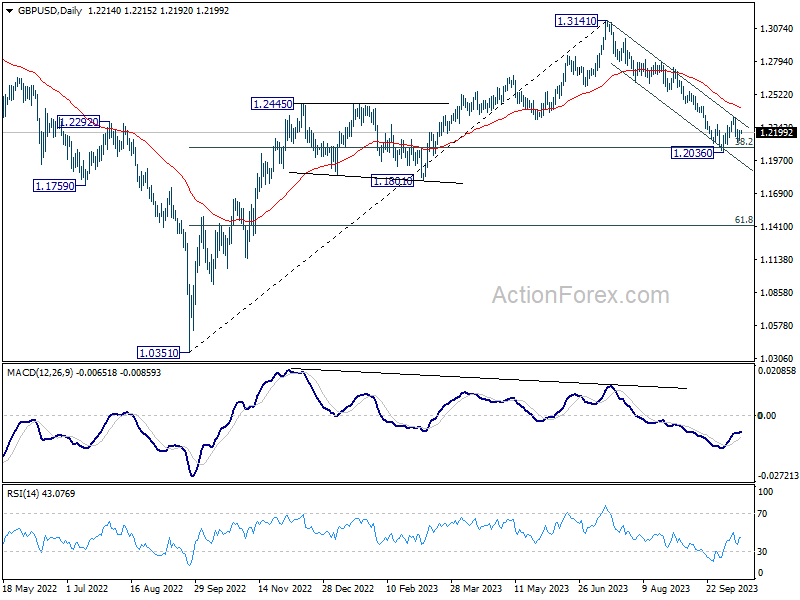
In the bigger picture, fall from 1.3141 medium term top could still be a correction to up trend from 1.0351 (2022 low) only. But risk of complete trend reversal is rising. Sustained break of 38.2% retracement of 1.0351 to 1.3141 at 1.2075 will pave the way to 61.8% retracement at 1.1417. For now, risk will stay on the downside as long as 55 D EMA (now at 1.2410) holds, in case of rebound.
USD/CHF Daily Outlook
Daily Pivots: (S1) 0.8984; (P) 0.9014; (R1) 0.9031; More....
Intraday bias in USD/CHF remains neutral for the moment as range trading continues. On the upside, break of 0.9086 resistance will indicate that pull back from 0.9243 has completed, and turn bias to the upside for retesting this high. However, sustained break of 38.2% retracement of 0.8551 to 0.9243 at 0.8979 will argue that deeper fall is under way to 61.8% retracement at 0.8815.
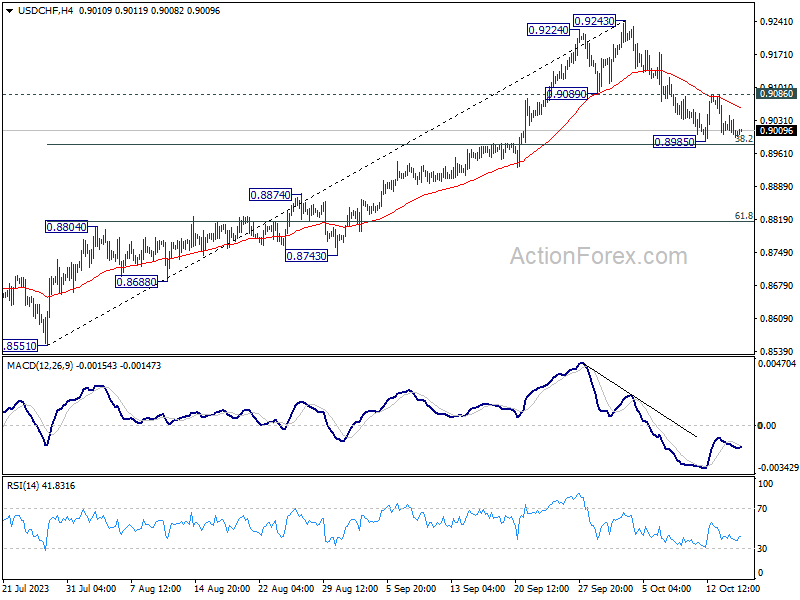
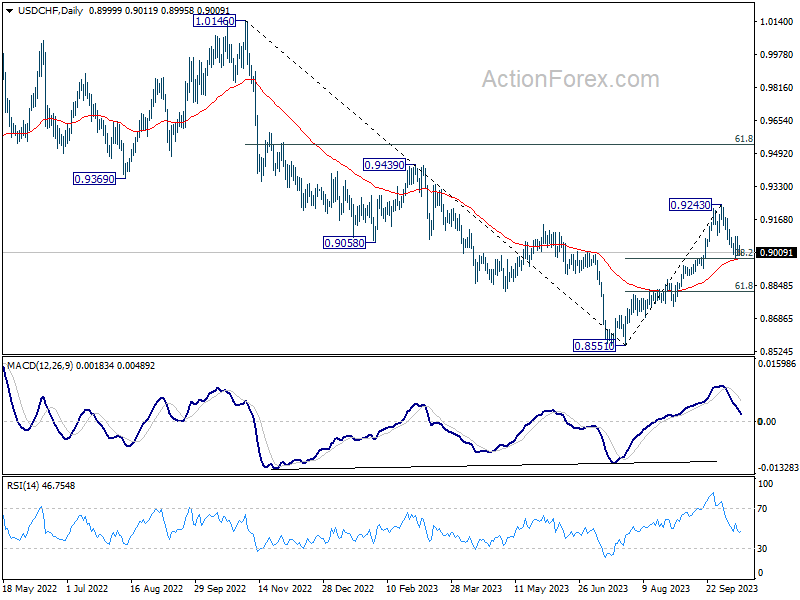
In the bigger picture, as long as 55 D EMA (now at 0.8976) holds rise from 0.8551 is viewed as reversing whole down trend from 1.0146 (2022 high). On resumption, further rise should be seen to 61.8% retracement of 1.0146 to 0.8551 at 0.9537 and above. However, sustained break of 55 D EMA will revive medium term bearishness, for retesting 0.8551 low at a later stage.
USD/JPY Daily Outlook
Daily Pivots: (S1) 149.33; (P) 149.54; (R1) 149.74; More...
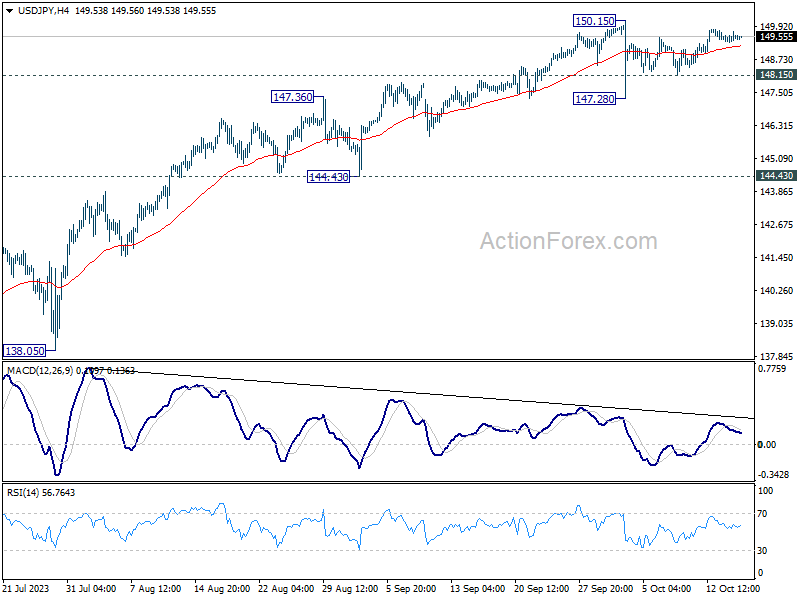
USD/JPY is extending the consolidation from 150.15 and intraday bias stays neutral at this point. On the downside, below 148.24 minor support will turn bias to the downside for another down leg through 147.28. On the upside, firm break of 150.15 will resume larger up trend to test 151.93 high.
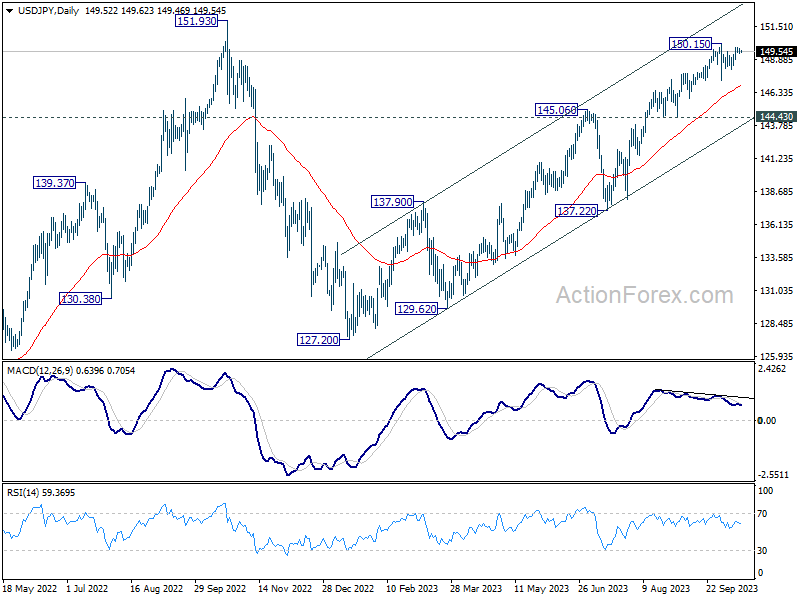
In the bigger picture, while rise from 127.20 is strong, it could still be seen as the second leg of the corrective pattern from 151.93 (2022 high). Rejection by 151.93, followed by sustained break of 145.06 resistance turned support will be the first sign that the third leg of the pattern has started. However, sustained break of 151.93 will confirm resumption of long term up trend.
AUD/USD Daily Report
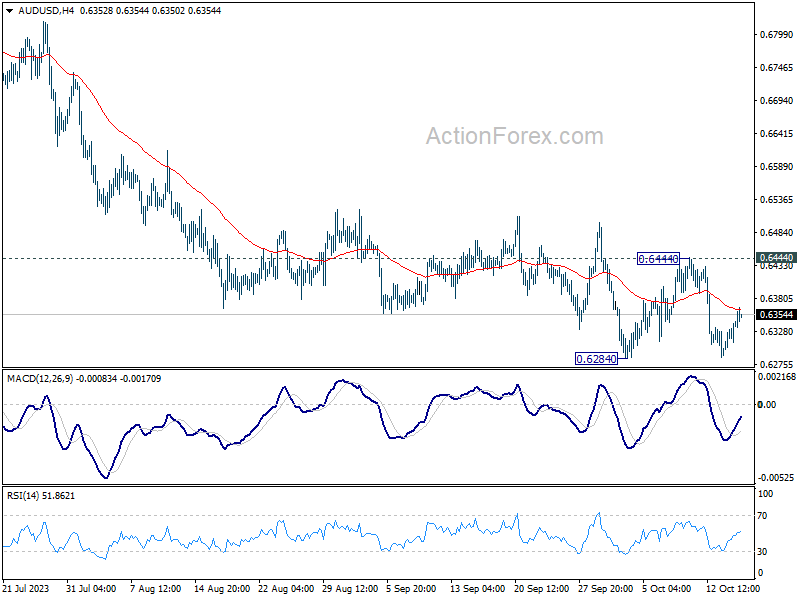
Daily Pivots: (S1) 0.6314; (P) 0.6330; (R1) 0.6358; More...
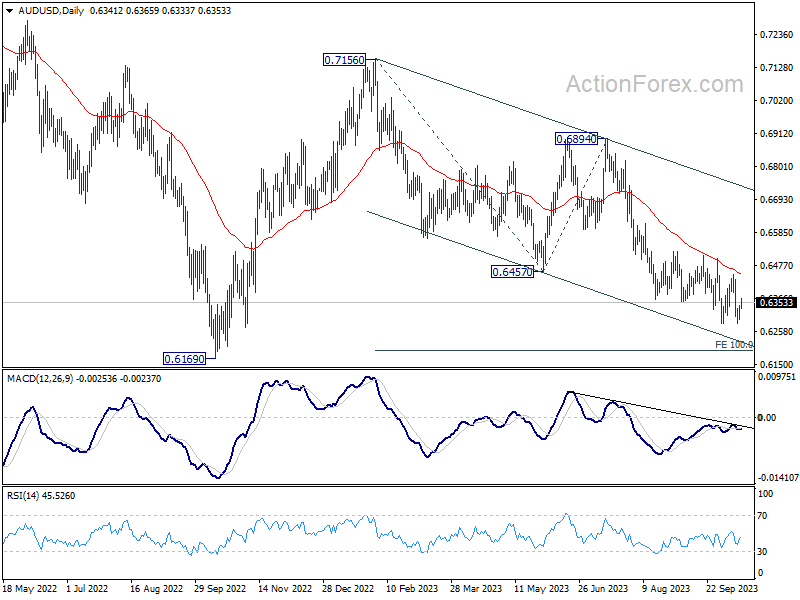
Intraday bias in AUD/USD remains neutral as range trading continues. Outlook remains bearish with 0.6444 resistance intact. On the downside, decisive break of 0.6284 will confirm resumption of whole decline from 0.7156. Next target is 100% projection of 0.7156 to 0.6457 from 0.6894 at 0.6195, which is close to 0.6169 medium term support. Nevertheless, firm break of 0.6444 will confirm short term bottoming, and turn bias to the upside for stronger rebound.
In the bigger picture, down trend from 0.8006 (2021 high) is possibly still in progress. Decisive break of 0.6169 will target 61.8% projection of 0.8006 to 0.6169 to 0.7156 at 0.6021. This will now remain the favored case as long as 0.6894, in case of strong rebound.
Technical Outlook and Review
DXY:
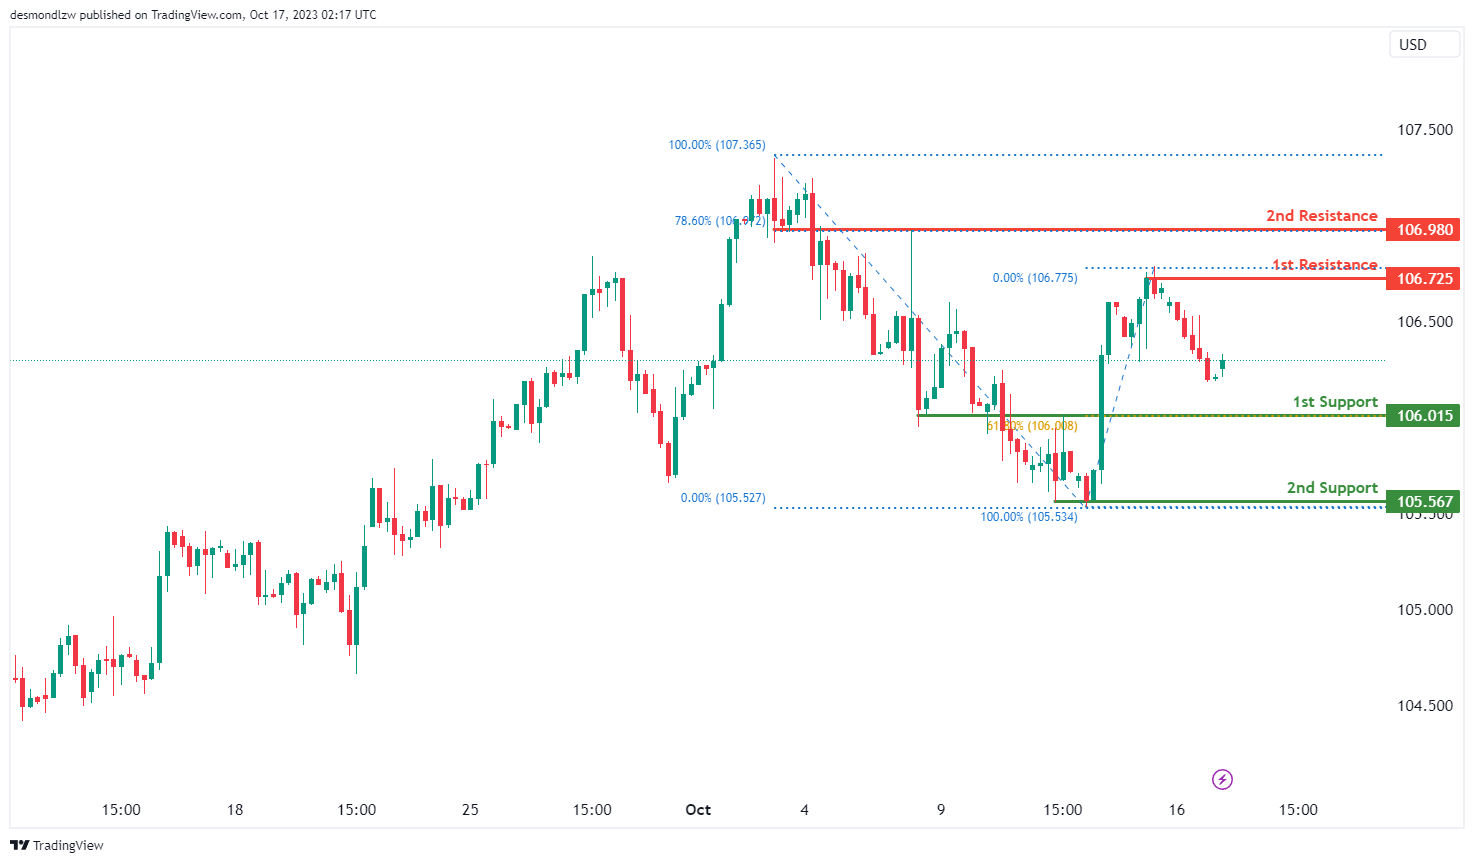
The DXY chart currently exhibits a bullish momentum, suggesting the potential for a bullish bounce off the 1st support level and a move towards the 1st resistance.
The 1st support at 106.01 is considered significant as it aligns with a pullback support level and coincides with the 61.80% Fibonacci Retracement level. This confluence of technical factors makes it a strong potential support zone. Additionally, the 2nd support at 105.56 is identified as a multi-swing low support level, further reinforcing its credibility as a potential support area.
On the resistance side, the 1st resistance at 106.72 is characterized as a swing high resistance, which could potentially act as a barrier to the bullish momentum. Beyond this, the 2nd resistance at 106.98 is identified as an overlap resistance level and coincides with the 78.60% Fibonacci Retracement level.
EUR/USD:
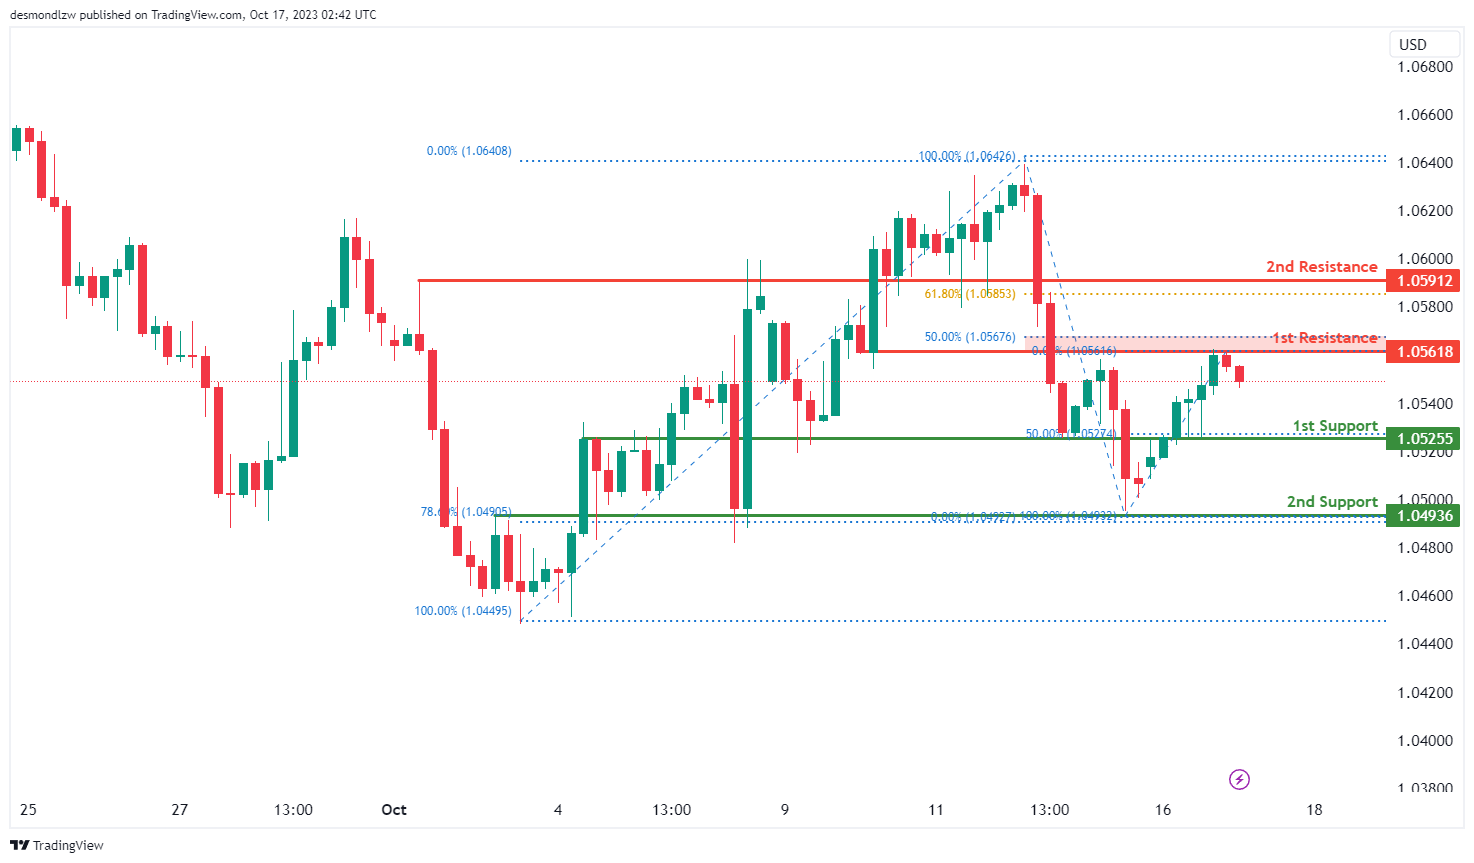
The EUR/USD chart currently exhibits a bearish momentum, suggesting the potential for a bearish continuation towards the 1st support level.
The 1st support at 1.0525 is considered significant as it aligns with an overlap support level and coincides with the 50% Fibonacci Retracement level, providing strong potential support. Additionally, the 2nd support at 1.0493 is identified as another overlap support level and aligns with the 78.60% Fibonacci Retracement level, further reinforcing its credibility as a potential support area.
On the resistance side, the 1st resistance at 1.0561 is characterized as an overlap resistance level and aligns with the 50% Fibonacci Retracement level. This level could potentially act as a barrier to the bearish momentum. Beyond this, the 2nd resistance at 1.0591 is identified as a pullback resistance and coincides with the 61.80% Fibonacci Retracement level.
EUR/JPY:
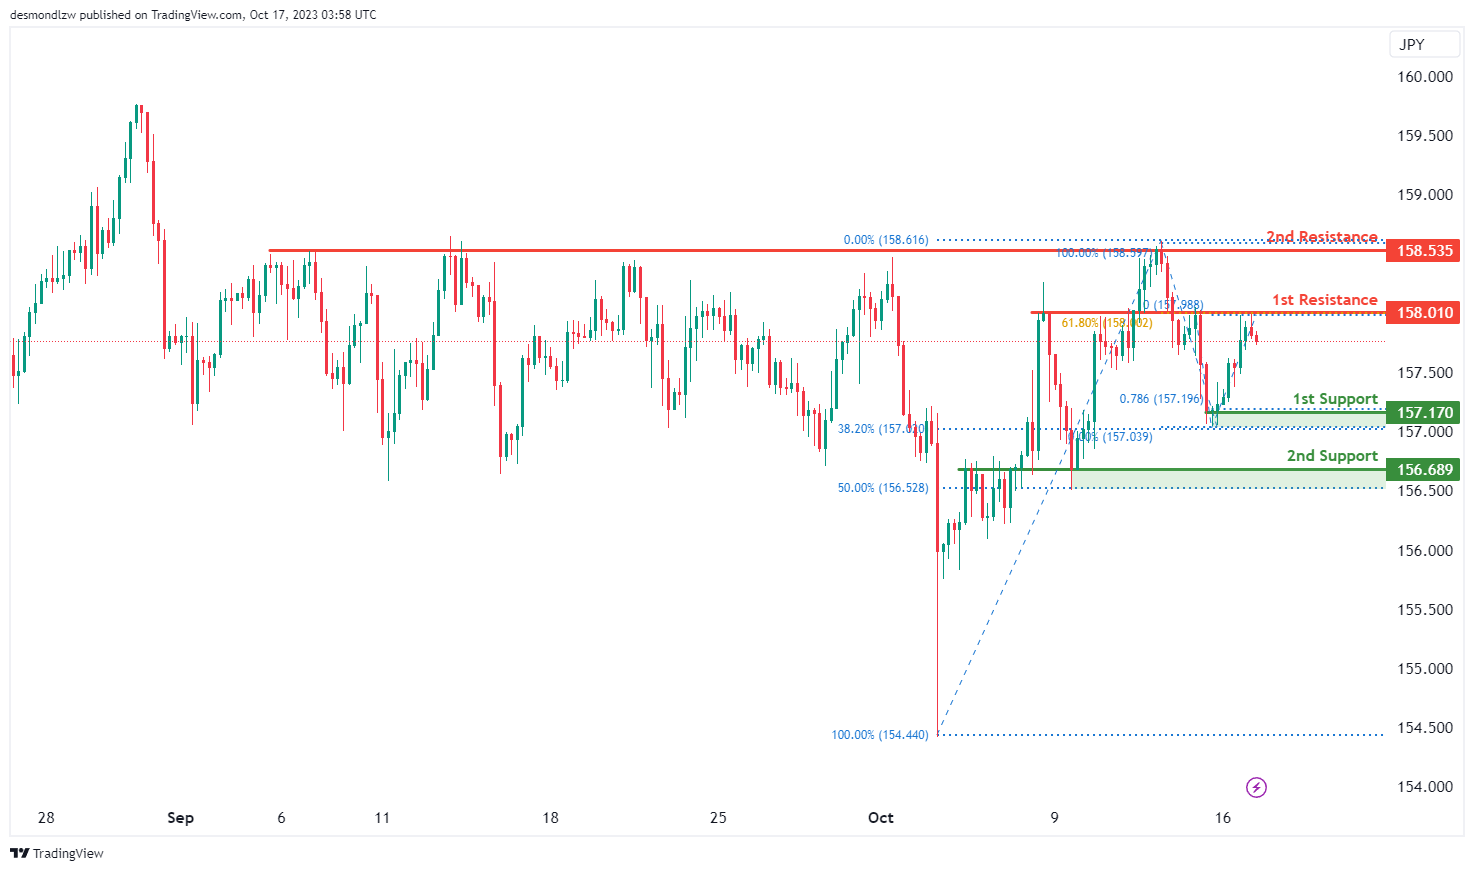
The instrument being analyzed is EUR/JPY, and the current overall momentum of its chart is bearish.
There is a potential scenario where the price could make a bearish continuation towards the 1st support level, which is at 157.17.
The 1st support at 157.17 is considered significant for several reasons. It serves as a swing low support and coincides with both a 78.60% Fibonacci Projection and a 38.20% Fibonacci Retracement, indicating a strong confluence of Fibonacci levels. This suggests that 157.17 is a robust level of potential price support.
In addition, there is a 2nd support level at 156.68, which is also valuable because it acts as an overlap support and corresponds to a 50% Fibonacci Retracement. This reinforces its significance as a potential area of support in the analysis.
On the resistance side, the 1st resistance level at 158.01 is considered important because it represents an overlap resistance and aligns with a 61.80% Fibonacci Retracement. This level may act as a barrier to further price increases.
Moreover, there is a 2nd resistance level at 158.53, which is also significant as it represents a multi-swing high resistance. This resistance level may present a challenge to the price moving higher.
EUR/GBP:
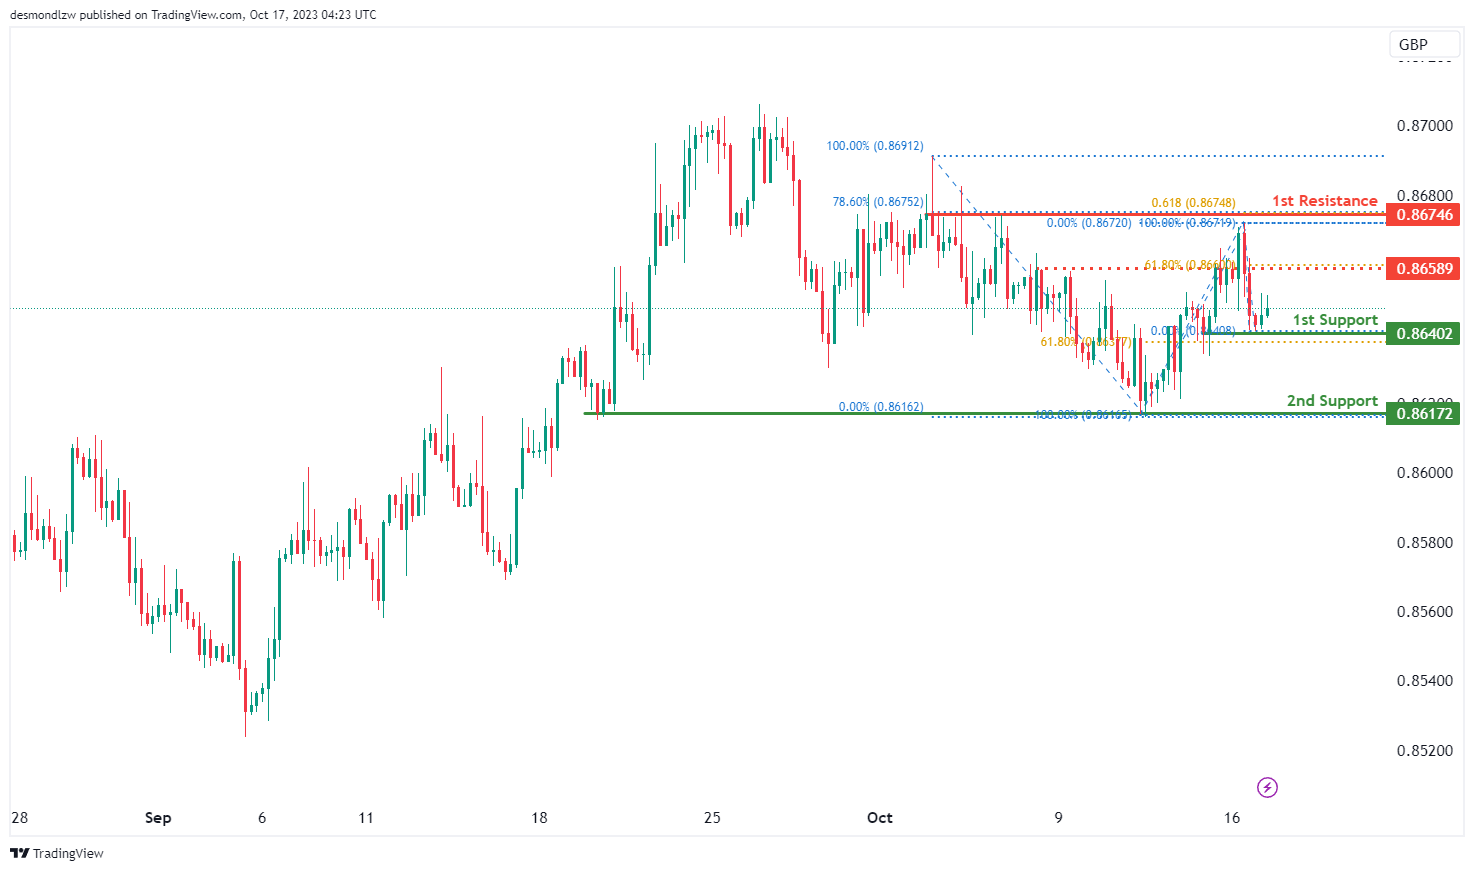
The instrument being analyzed is EUR/GBP, and the current overall momentum of its chart is bullish.
There is a potential scenario where the price could make a bullish bounce off the 1st support level, which is at 0.8640, and head towards the 1st resistance level.
The 1st support at 0.8640 is considered significant for several reasons. It serves as a multi-swing low support and aligns with a 61.80% Fibonacci Retracement, indicating a strong confluence of technical factors that make it a potential area of price support.
Additionally, there is a 2nd support level at 0.8617, which also functions as a multi-swing low support, further adding to the potential areas of support in the analysis.
On the resistance side, the 1st resistance level at 0.8674 is considered important due to several factors. It represents a multi-swing high resistance and aligns with a 78.60% Fibonacci Retracement and a 61.80% Fibonacci Projection. This confluence of Fibonacci levels and resistance factors indicates that 0.8674 may pose a significant barrier to further price increases.
In addition, there is an intermediate resistance level at 0.8658, which is significant as it aligns with a 61.80% Fibonacci Retracement, further enhancing its importance in the chart analysis.
GBP/USD:
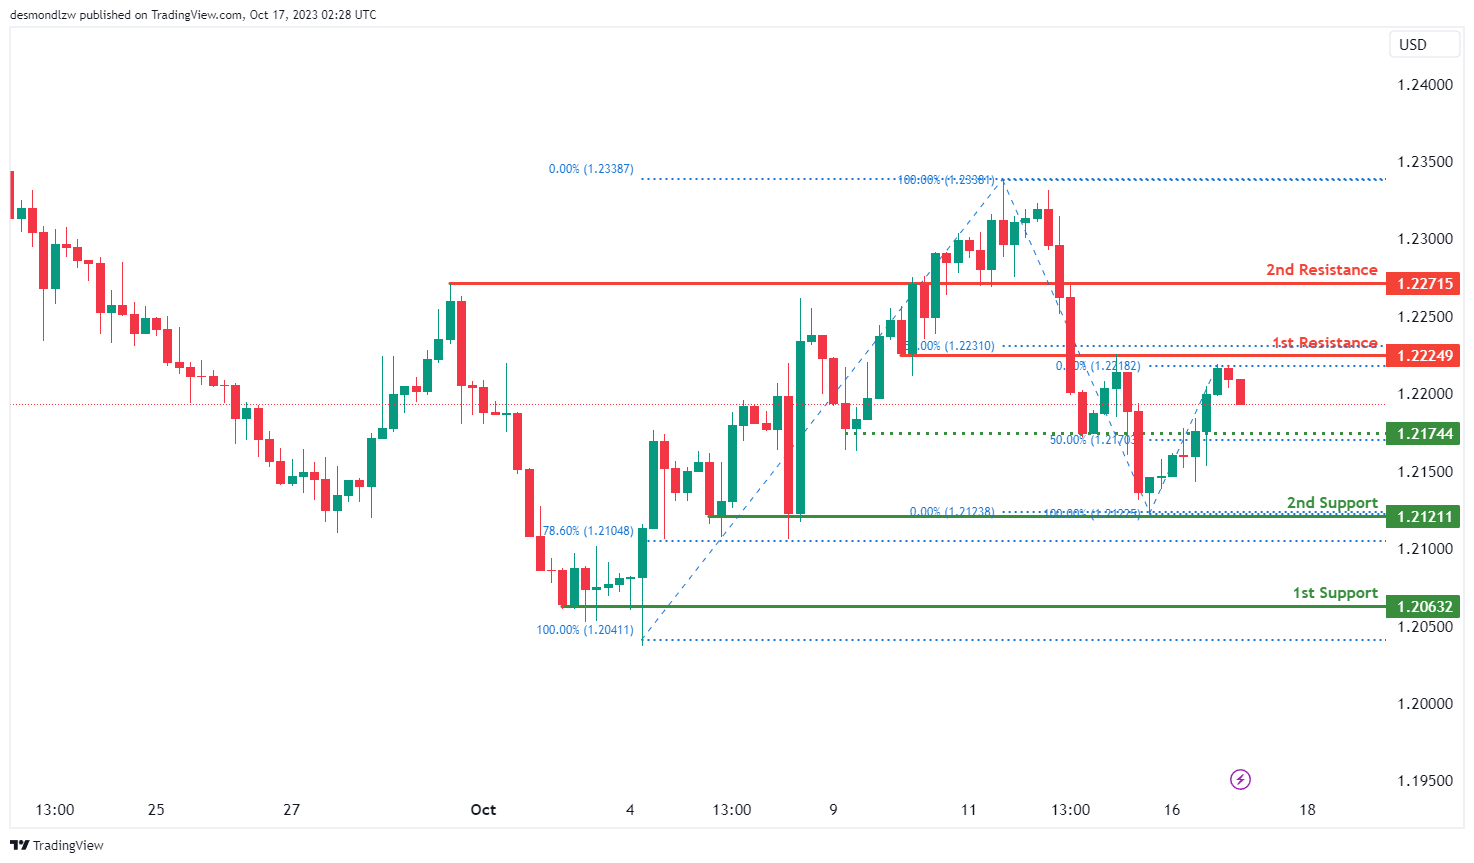
The GBP/USD chart currently exhibits bearish momentum, indicating the potential for a bearish continuation towards the 1st support level.
The 1st support at 1.2121 is considered significant as it aligns with a swing low support level and coincides with the 78.60% Fibonacci Retracement level, providing strong potential support for the price. Additionally, the 2nd support at 1.2063 is identified as a multi-swing low support, further reinforcing its credibility as a potential support area.
On the resistance side, the 1st resistance at 1.2224 is characterized as an overlap resistance level and aligns with the 50% Fibonacci Retracement level. This level could potentially act as a barrier to the bearish momentum. Similarly, the 2nd resistance at 1.2227 is identified as an overlap resistance.
Intermediate support is also noted at 1.2174, which is described as a pullback support level and aligns with the 50% Fibonacci Retracement level.
GBP/JPY:
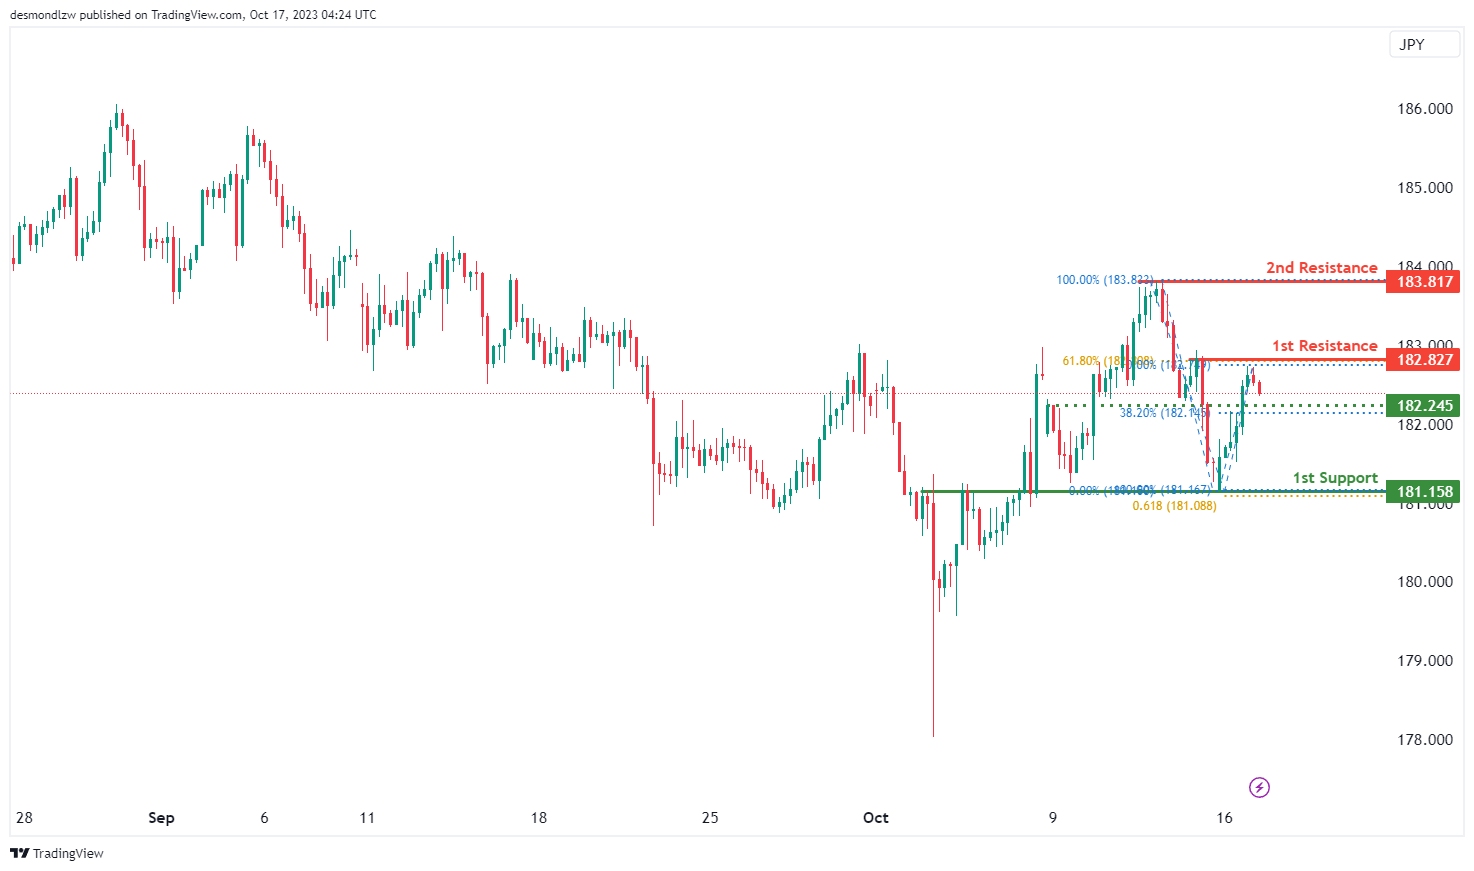
The instrument being analyzed is GBP/JPY, and the current overall momentum of its chart is bearish.
In this analysis, there is a potential scenario where the price could make a bearish continuation towards the 1st support level, which is at 181.15.
The 1st support at 181.15 is considered significant for several reasons. It acts as an overlap support and aligns with a 61.80% Fibonacci Projection, indicating a strong technical confluence that makes it a notable area of potential price support.
Additionally, there is an intermediate support level at 182.24. This level is important because it serves as a pullback support and coincides with a 38.20% Fibonacci Retracement, enhancing its significance as a potential support level in the analysis.
On the resistance side, the 1st resistance level at 182.82 is considered important due to several factors. It represents a swing high resistance and aligns with a 61.80% Fibonacci Retracement, which may act as a barrier to further price increases.
Moreover, there is a 2nd resistance level at 183.81, which is significant as it serves as a swing high resistance, indicating a potential challenge for the price moving higher.
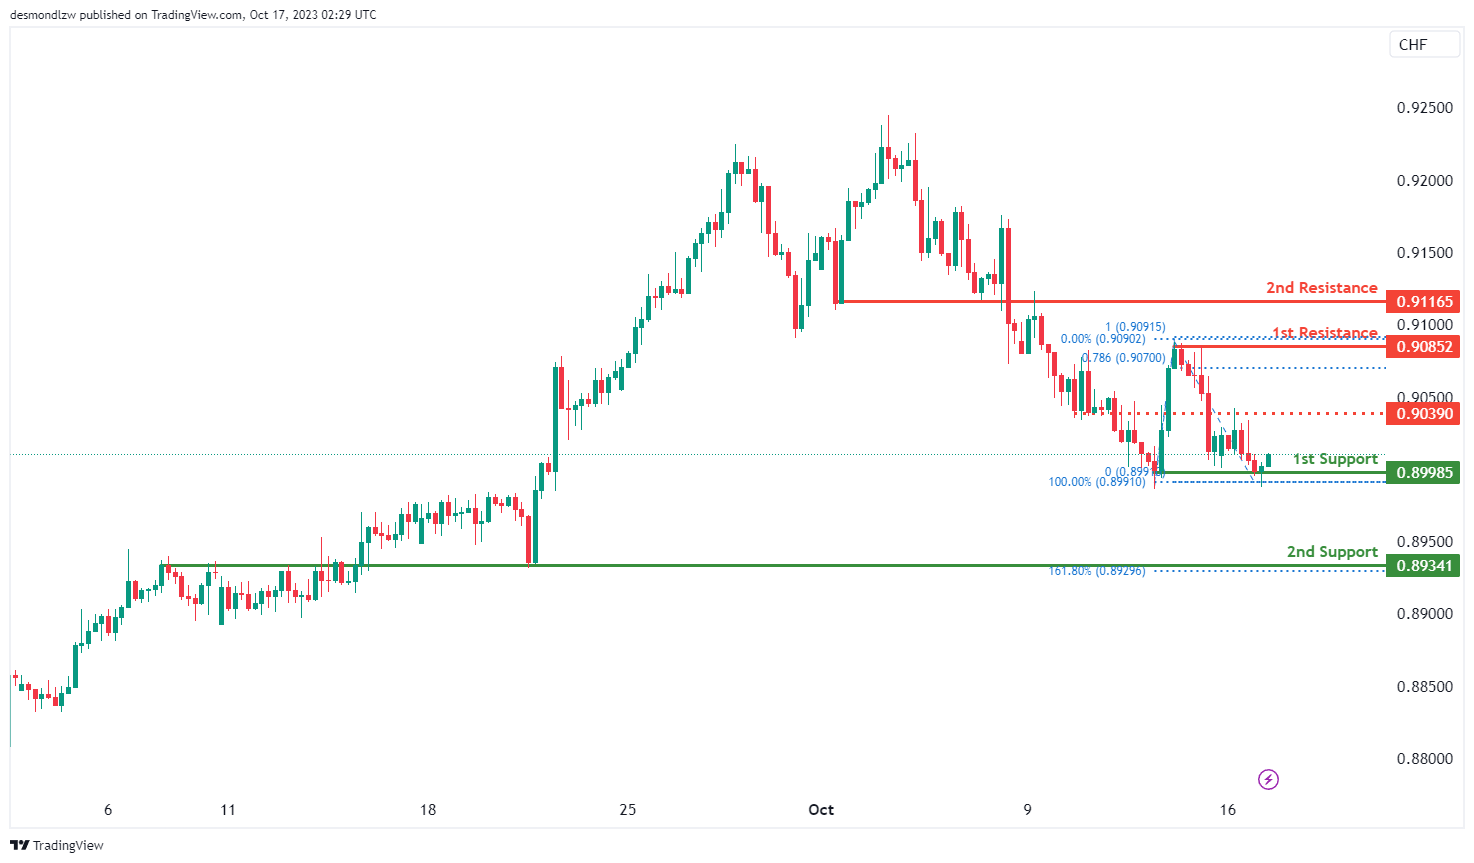
USD/CHF:
The USD/CHF chart currently exhibits bullish momentum, with the potential scenario of a bullish bounce off the 1st support level towards the 1st resistance.
The 1st support at 0.8998 is considered significant as it aligns with a swing low support level. Additionally, the 2nd support at 0.8934 is identified as an overlap support and coincides with the 161.80% Fibonacci Retracement level, providing a strong foundation of potential support.
On the resistance side, the 1st resistance at 0.9085 is characterized as a multi-swing high resistance level, and beyond this, the 2nd resistance at 0.9116 is identified as an overlap resistance. An intermediate resistance at 0.9039 is also noted as an overlap resistance.
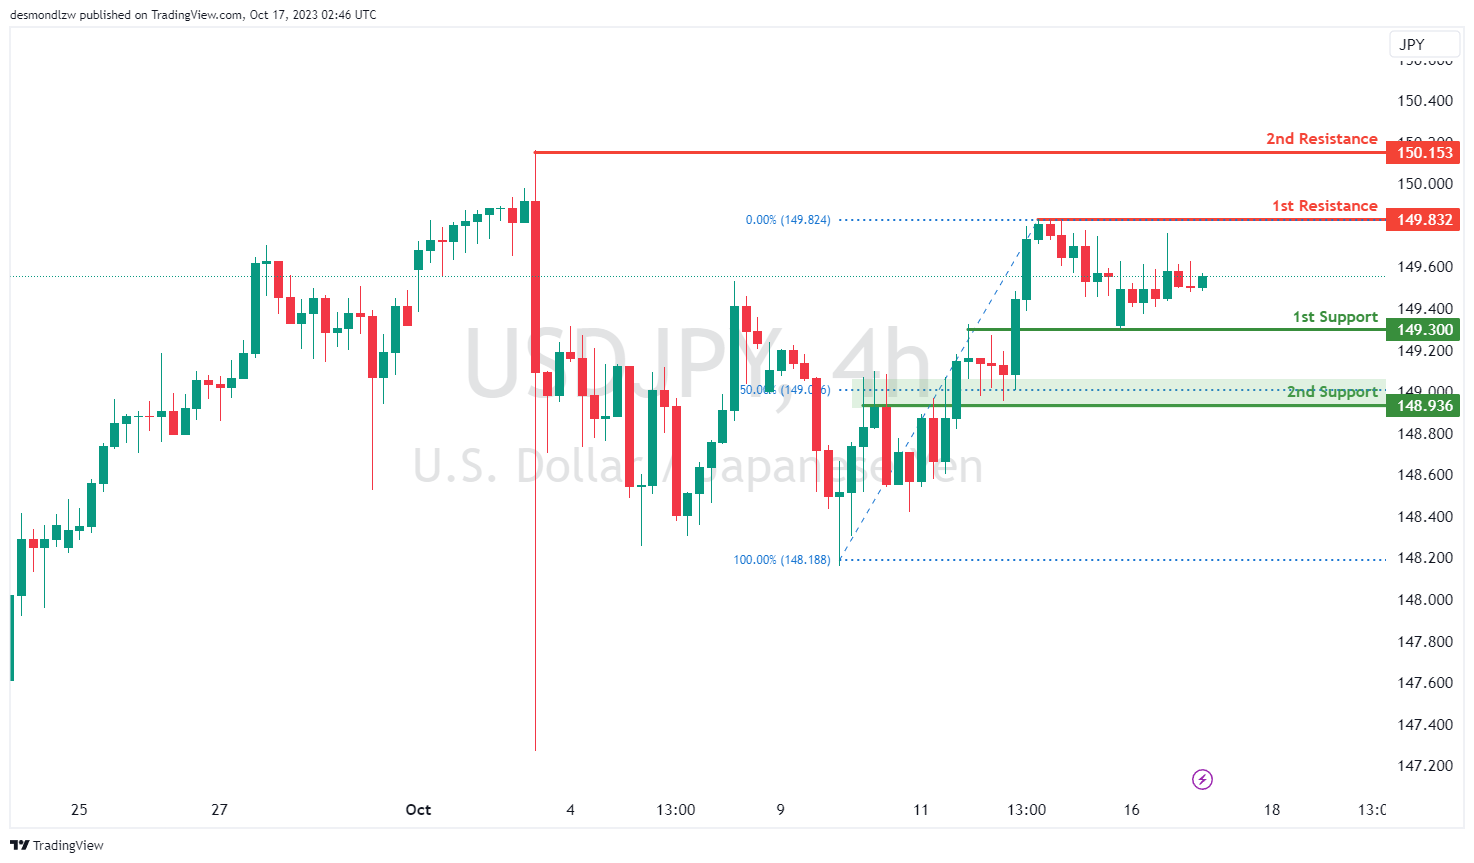
USD/JPY:
The USD/JPY chart currently displays bullish momentum, with the potential scenario of a bullish continuation towards the 1st resistance level.
The 1st support at 149.30 is considered significant, as it aligns with an overlap support level. Additionally, the 2nd support at 148.93 is identified as an overlap support and coincides with the 50% Fibonacci Retracement level, providing a strong foundation of potential support.
On the resistance side, the 1st resistance at 149.83 is characterized as a multi-swing high resistance level. Beyond this, the 2nd resistance at 150.15 is noted as a swing high resistance.
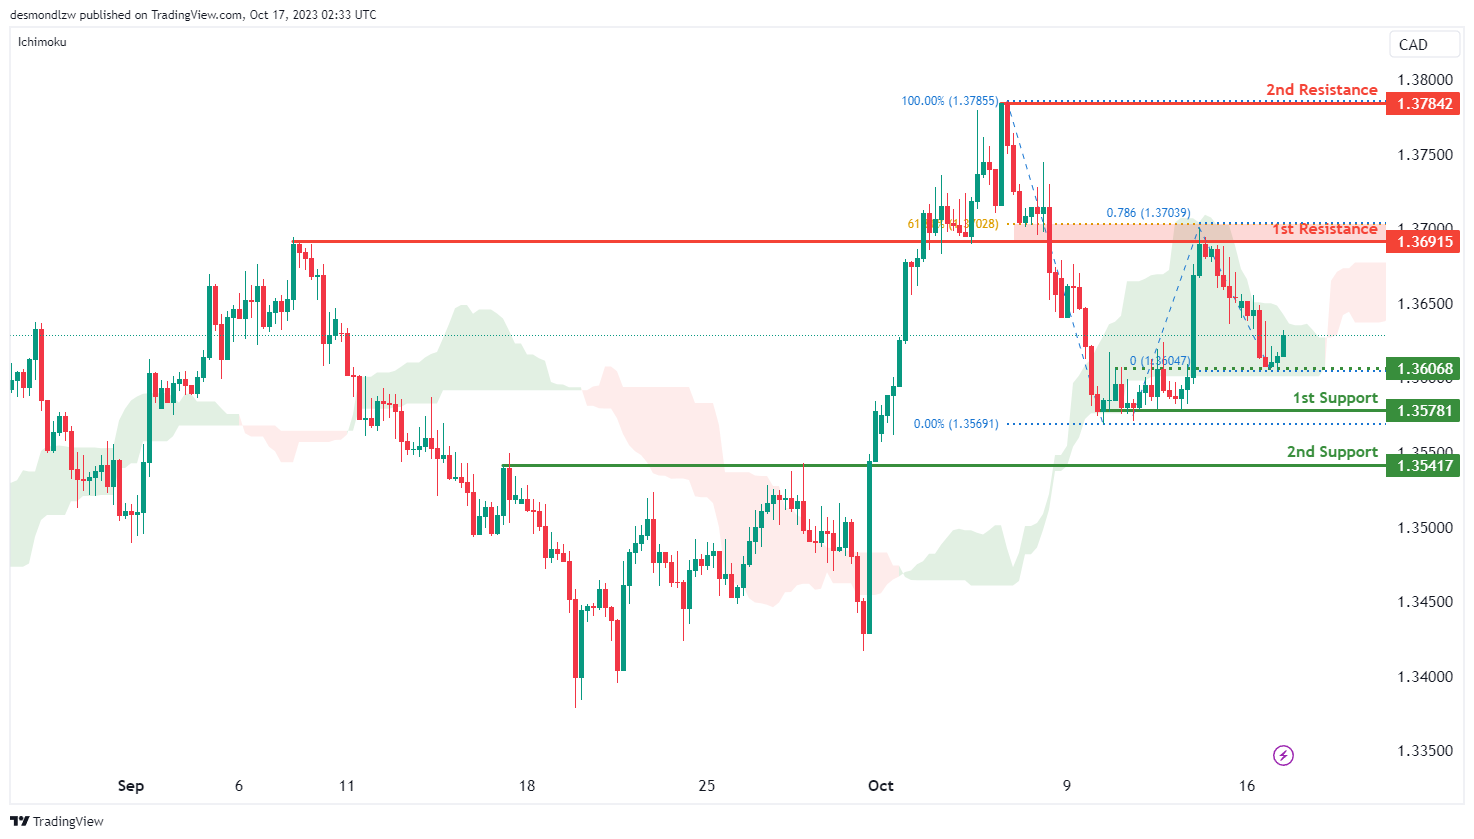
USD/CAD:
The USD/CAD chart currently exhibits a bullish momentum, with price finding support within the bullish Ichimoku cloud. There is a potential scenario for price to make a bullish continuation towards the 1st resistance level.
The 1st resistance level at 1.3692 is identified as an overlap resistance that aligns with a confluence of Fibonacci levels i.e. the 61.80% retracement and the 78.60% projection levels. Higher up, the 2nd resistance level at 1.3784 is noted as a swing-high resistance, potentially acting as a barrier to further bullish advances.
To the downside, the intermediate support level at 1.3607 is identified as an overlap support while the 1st support level at 1.3578 is marked as a pullback support. Additionally, the 2nd support level at 1.3542 is also noted as a pullback support, adding to its significance as a potential support zone.
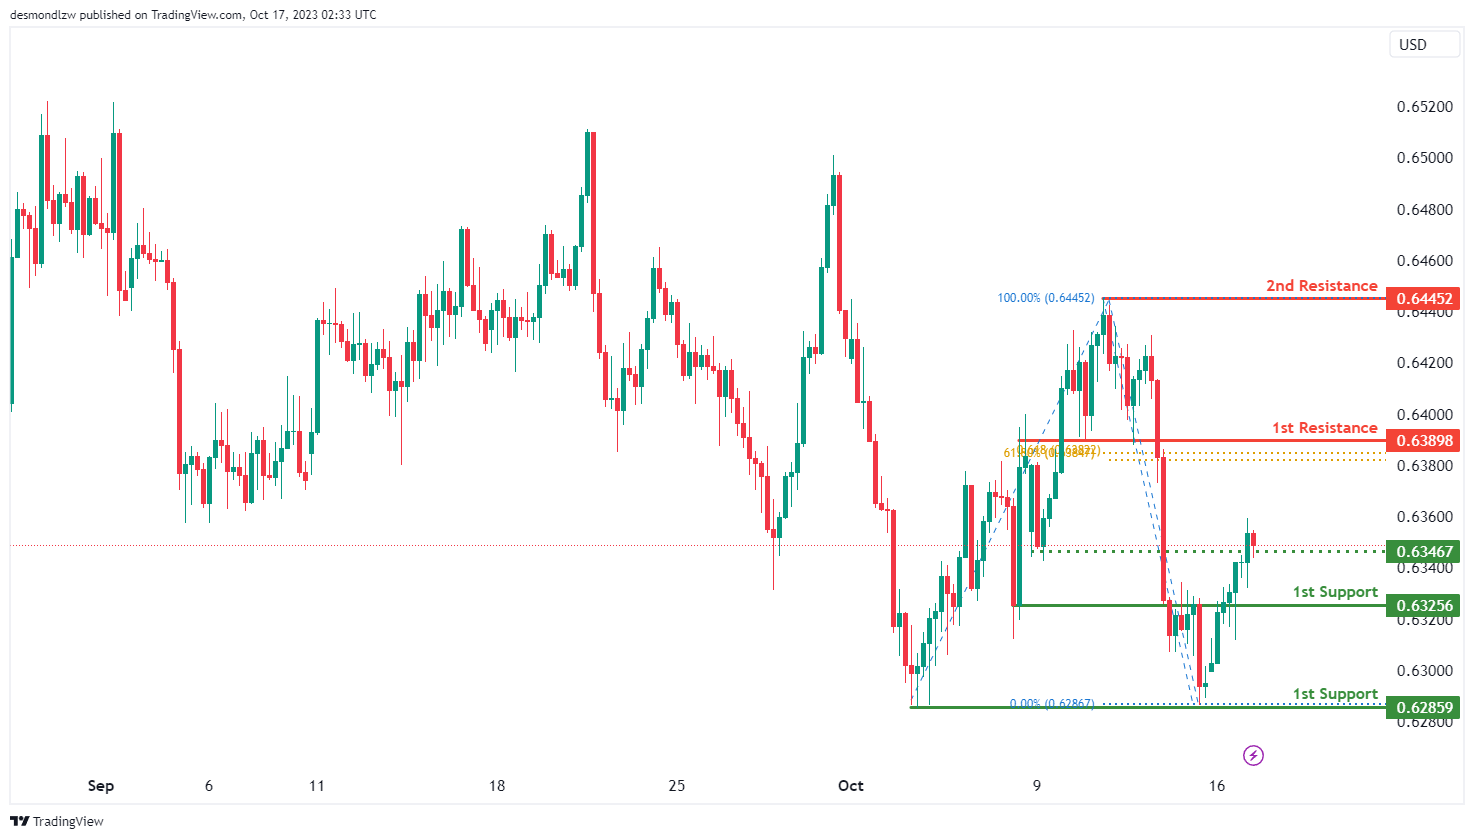
AUD/USD:
The AUD/USD chart currently exhibits a bullish momentum, indicating a potential scenario of a bullish continuation towards the 1st resistance level.
The 1st resistance level at 0.6389 is identified as an overlap resistance that aligns with a confluence of Fibonacci levels i.e. the 61.80% retracement and the 61.80% projection levels. Beyond this, the 2nd resistance level at 0.6445 is noted as a swing-high resistance, making it a potentially strong resistance level.
To the downside, the intermediate support level at 0.6347 is identified as a pullback support while the 1st support level at 0.6326 is noted as an overlap support. Additionally, the 2nd support level at 0.6286 is marked as a multi-swing-low support, further reinforcing its importance as a potential support area.
NZD/USD
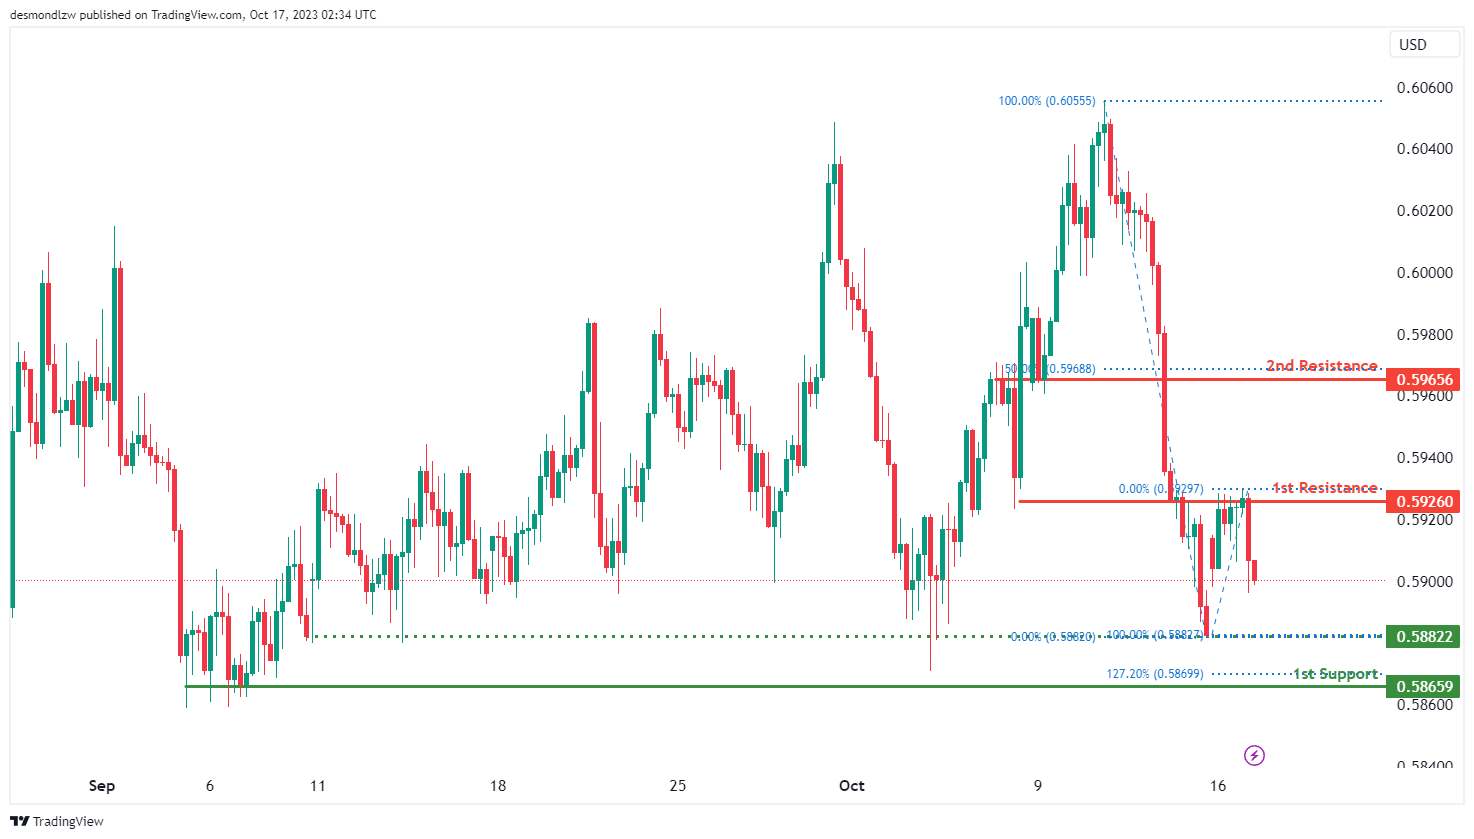
The NZD/USD chart currently exhibits a bearish momentum, suggesting a potential scenario for price to make a bearish continuation towards the 1st support level should price break under the intermediate support.
The intermediate support level at 0.5882 is identified as a pullback support while the 1st support level at 0.5866 is also noted as pullback support that aligns close to the 127.20% Fibonacci extension level, indicating a potential support zone.
To the upside, the 1st resistance level at 0.5926 is identified as an overlap resistance. Beyond this, the 2nd resistance level at 0.5966 is also marked as an overlap resistance that aligns with the 50.00% Fibonacci retracement level, making it a potentially strong resistance level.
DJ30:
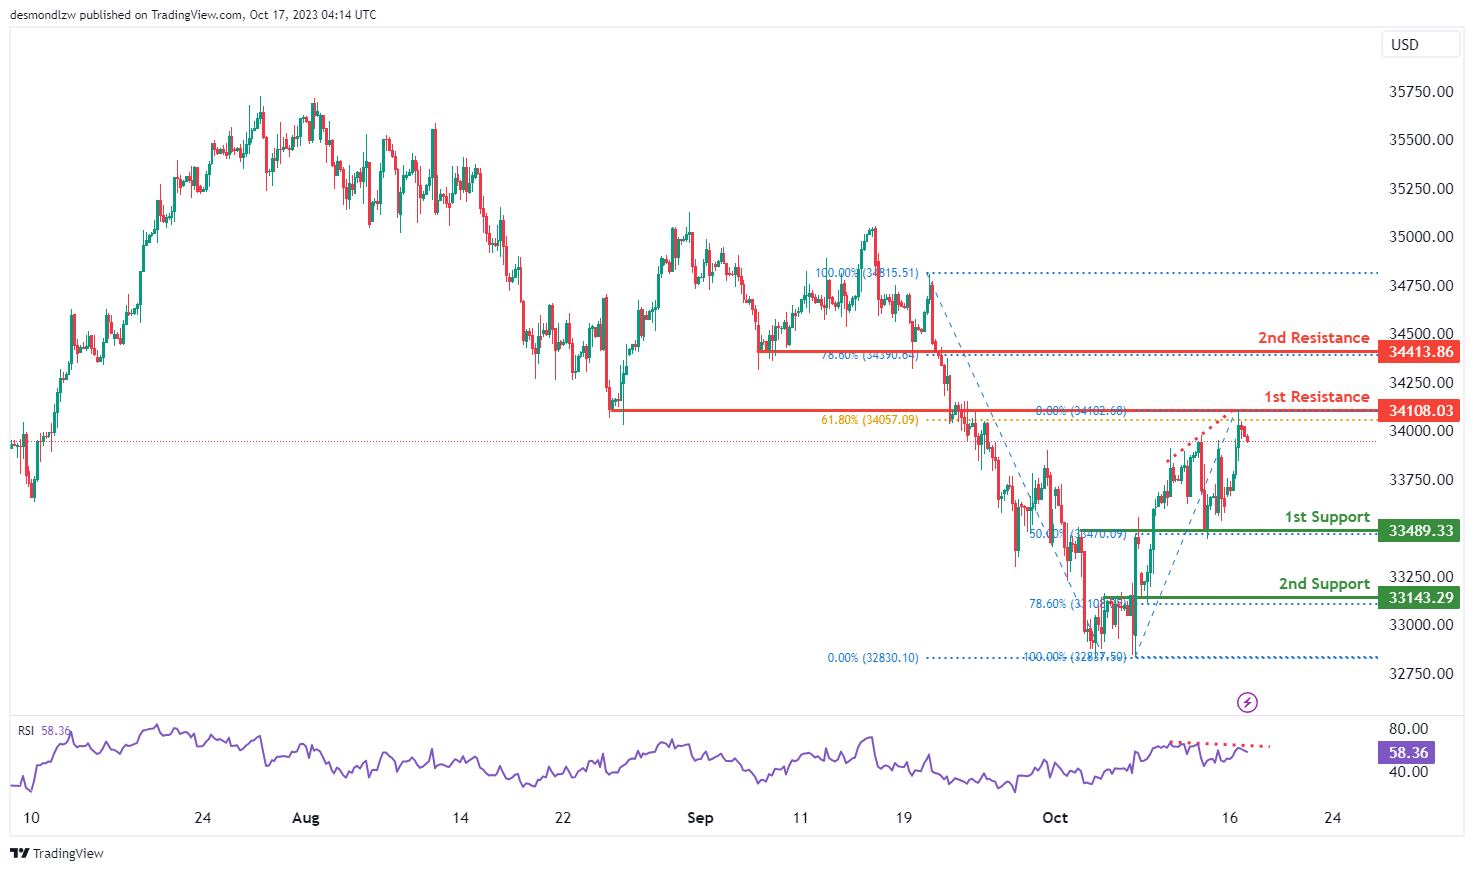
The instrument under analysis is DJ30, and the current overall momentum of its chart is bearish.
There is a potential scenario where the price could experience a bearish continuation towards the 1st support level, which is at 33489.33. This level is significant because it serves as an overlap support and corresponds to a 50% Fibonacci Retracement level, indicating a potential area of price support.
Additionally, there is a 2nd support level at 33143.29, which is also valuable as it functions as an overlap support and aligns with a 78.60% Fibonacci Retracement. This further enhances its significance in the analysis.
On the resistance side, the 1st resistance level at 34108.03 is considered important because it represents an overlap resistance and aligns with a 61.80% Fibonacci Retracement. This level may act as a barrier to further price increases.
Furthermore, there is a 2nd resistance level at 34413.86, which holds significance as it represents a pullback resistance and coincides with a 78.60% Fibonacci Retracement, potentially adding to its significance in the chart analysis.
Additionally, the Relative Strength Index (RSI) is displaying a bearish divergence versus the price. This divergence suggests that there is a discrepancy between the RSI’s behavior and the price movement, indicating a possible rapid decline in price. This bearish divergence adds to the overall bearish sentiment and suggests that the price may continue its downward trajectory.
GER40:
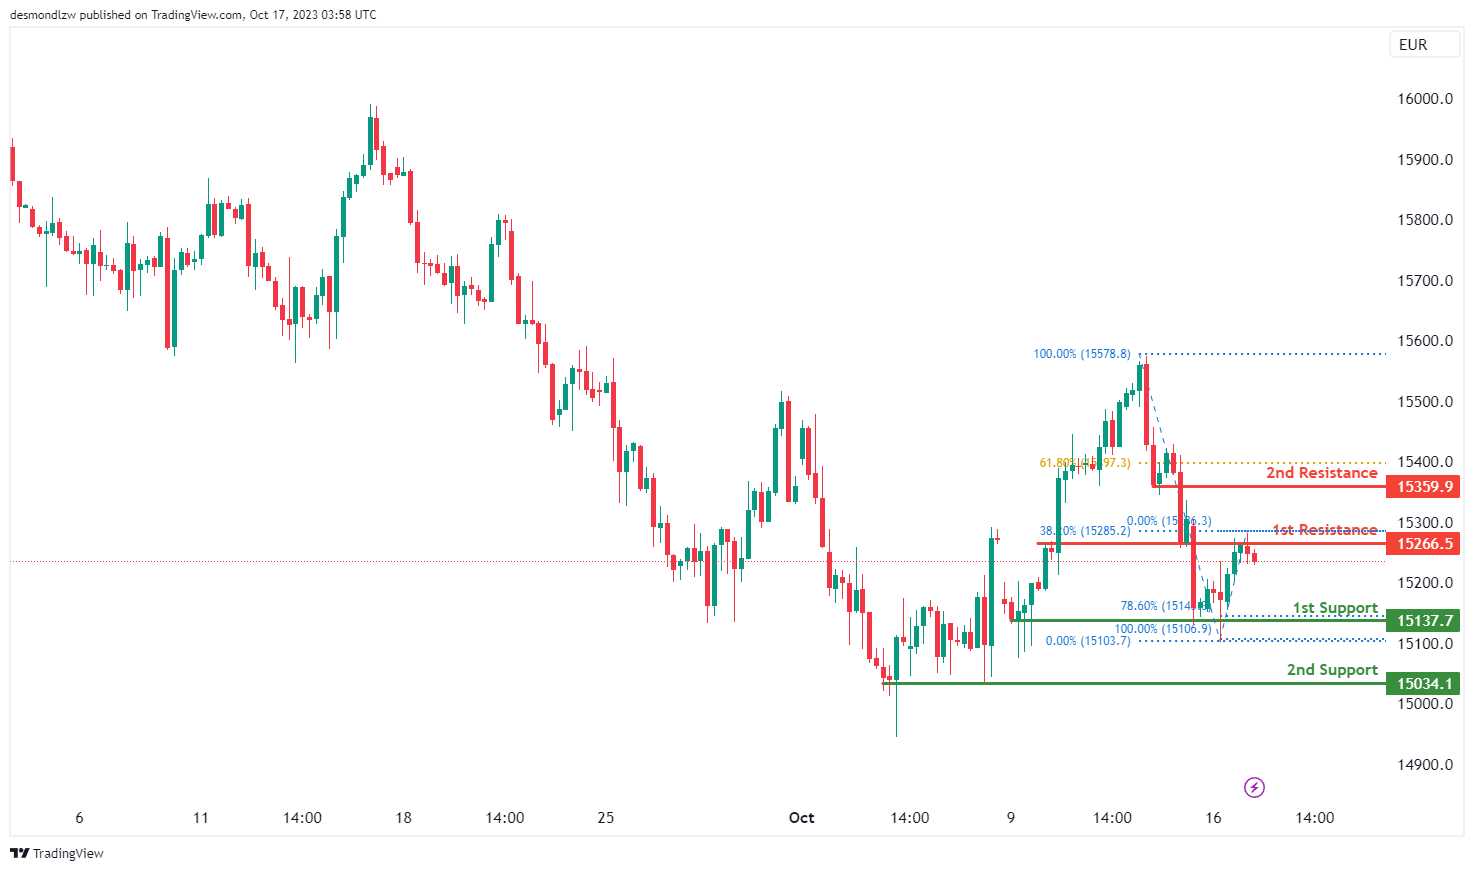
The instrument being analyzed is GER40, and the current overall momentum of its chart is bearish.
There is a potential scenario where the price could make a bearish continuation towards the 1st support level, which is at 15137.70.
The 1st support at 15137.70 is considered significant because it represents a multi-swing low support and aligns with a 78.60% Fibonacci Retracement. This level provides a potential area of support for the price.
Additionally, there is a 2nd support level at 15034.10, which is also valuable as it functions as a multi-swing low support. This support level adds to the potential areas of price support.
On the resistance side, the 1st resistance level at 15266.50 is considered important because it represents an overlap resistance. This level coincides with a 38.20% Fibonacci Retracement, indicating that it might act as a barrier to further price increases.
Furthermore, there is a 2nd resistance level at 15359.90, which is also significant as it represents a pullback resistance. This resistance level aligns with a 61.80% Fibonacci Retracement, potentially adding to its significance in the chart analysis.
US500
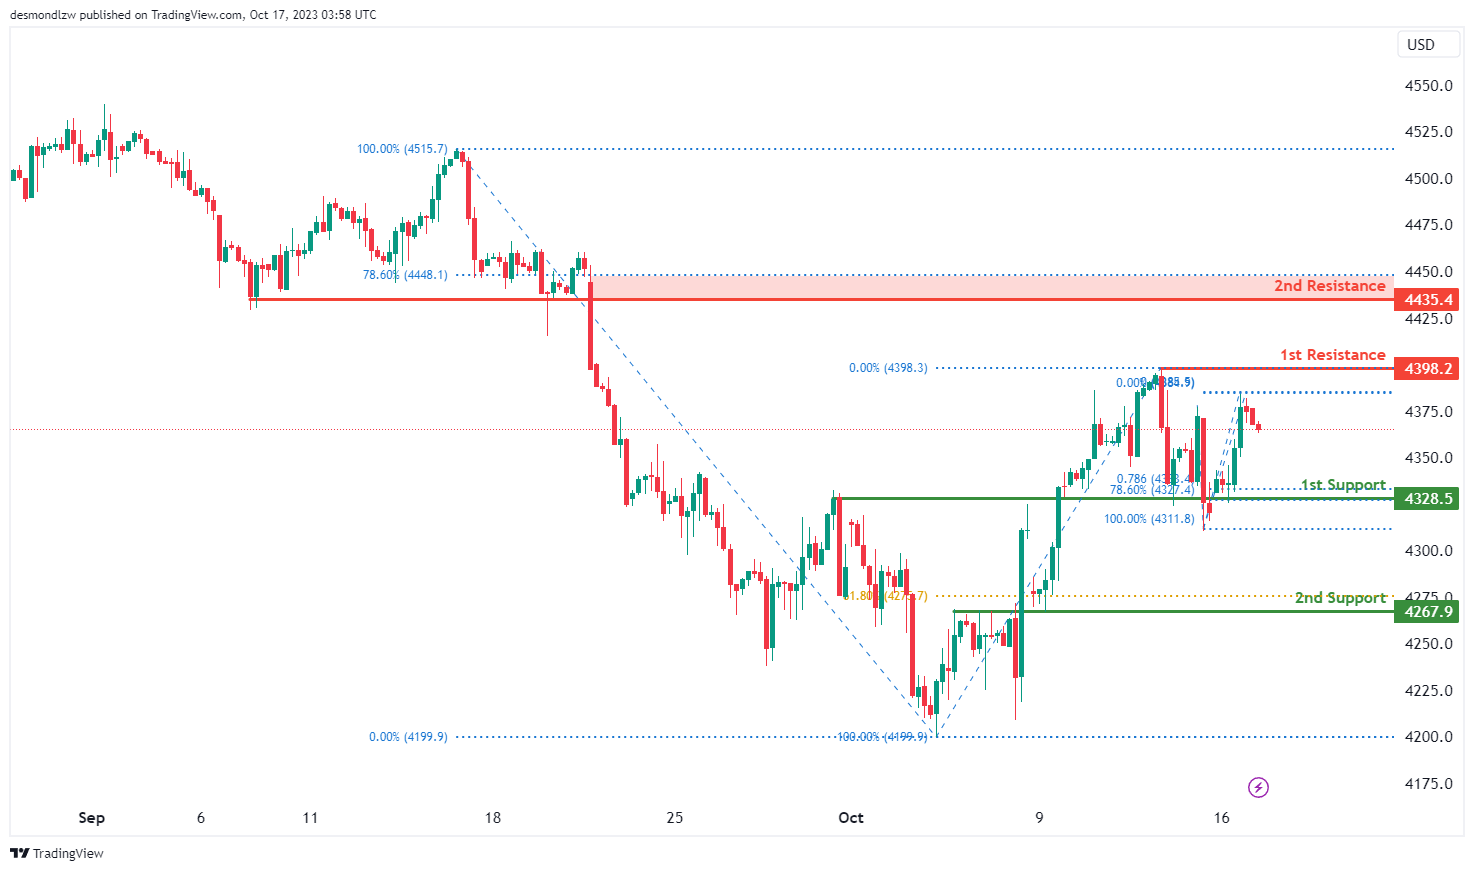
The instrument being analyzed is US500, and the current overall momentum of its chart is bearish.
There is a potential scenario where the price could make a bearish continuation towards the 1st support level, which is at 4328.5.
The 1st support at 4328.5 is considered significant for several reasons. It acts as an overlap support, and, notably, it coincides with both a 78.60% Fibonacci Retracement and a 78.60% Fibonacci Projection. This confluence of Fibonacci levels adds to its significance in the analysis and indicates a strong potential area of price support.
In addition, there is a 2nd support level at 4267.9, which is also valuable as it functions as an overlap support and aligns with a 61.80% Fibonacci Retracement. This further enhances its importance in the analysis as a potential support level.
On the resistance side, the 1st resistance level at 4398.2 is considered important because it represents a swing high resistance, indicating a potential area where the price might encounter resistance.
Moreover, there is a 2nd resistance level at 4435.4, which is also significant as it represents a pullback resistance. This level aligns with a 78.60% Fibonacci Retracement, adding to its significance in the chart analysis.
BTC/USD:
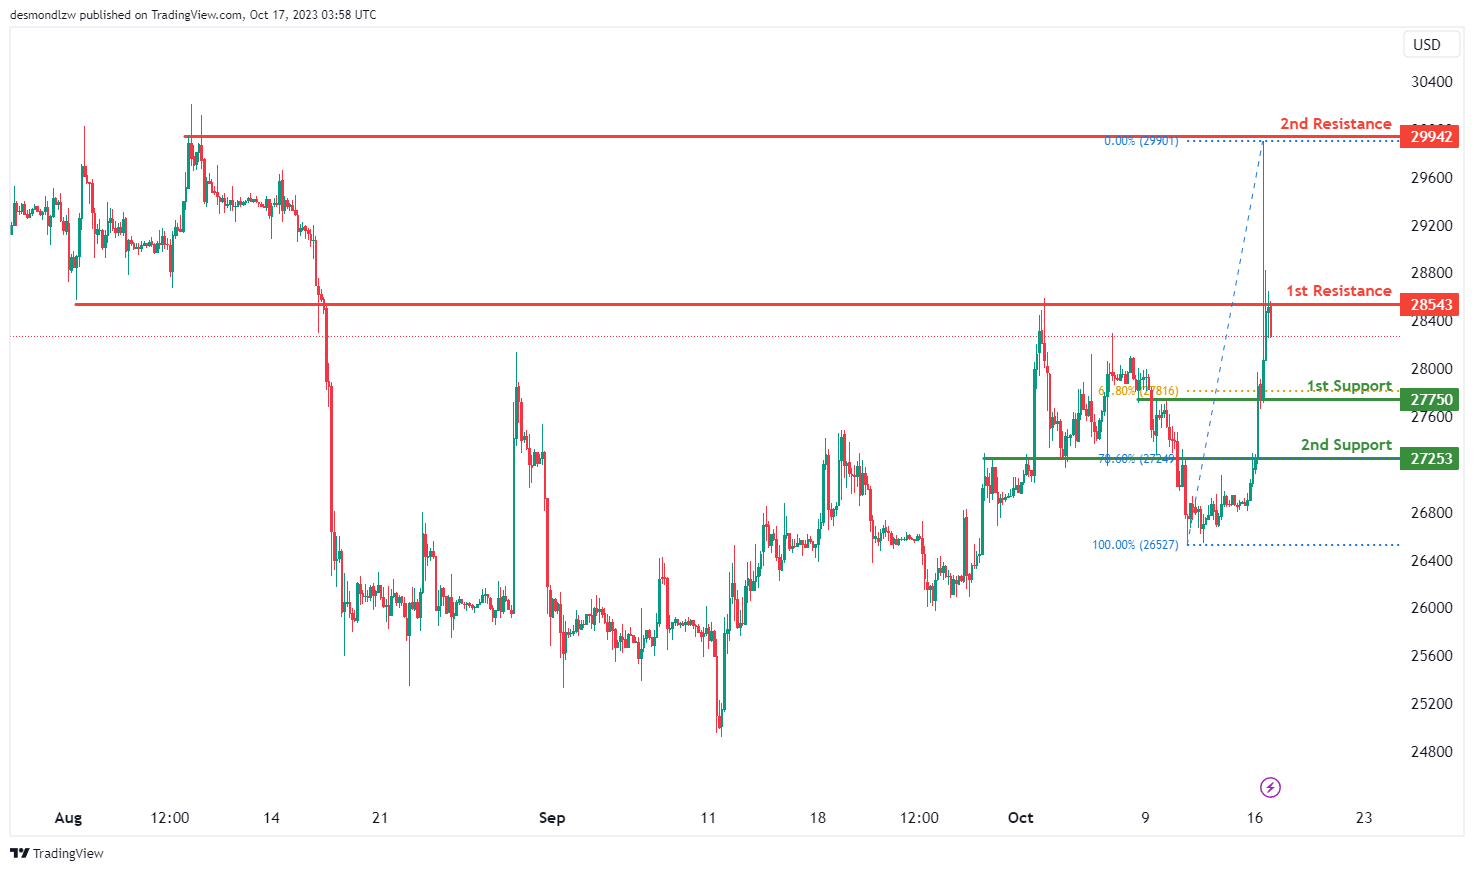
The instrument being analyzed is BTC/USD, and the current overall momentum of its chart is bearish.
There is a potential scenario where the price could make a bearish continuation towards the 1st support level, which is at 27750.
The 1st support at 27750 is considered significant because it acts as an overlap support and coincides with a 61.80% Fibonacci Retracement level, providing a potential level of price support.
In addition, there is a 2nd support level at 27253, which is also valuable because it functions as a pullback support and aligns with a 78.60% Fibonacci Retracement. This further enhances its significance in the analysis.
On the resistance side, the 1st resistance level at 28543 is considered important because it represents an overlap resistance, indicating a potential area where the price might encounter resistance.
Moreover, there is a 2nd resistance level at 29942, which is also significant as it represents a multi-swing high resistance in the chart analysis. This level may act as an additional barrier to price increases, contributing to the overall bearish outlook.
ETH/USD:
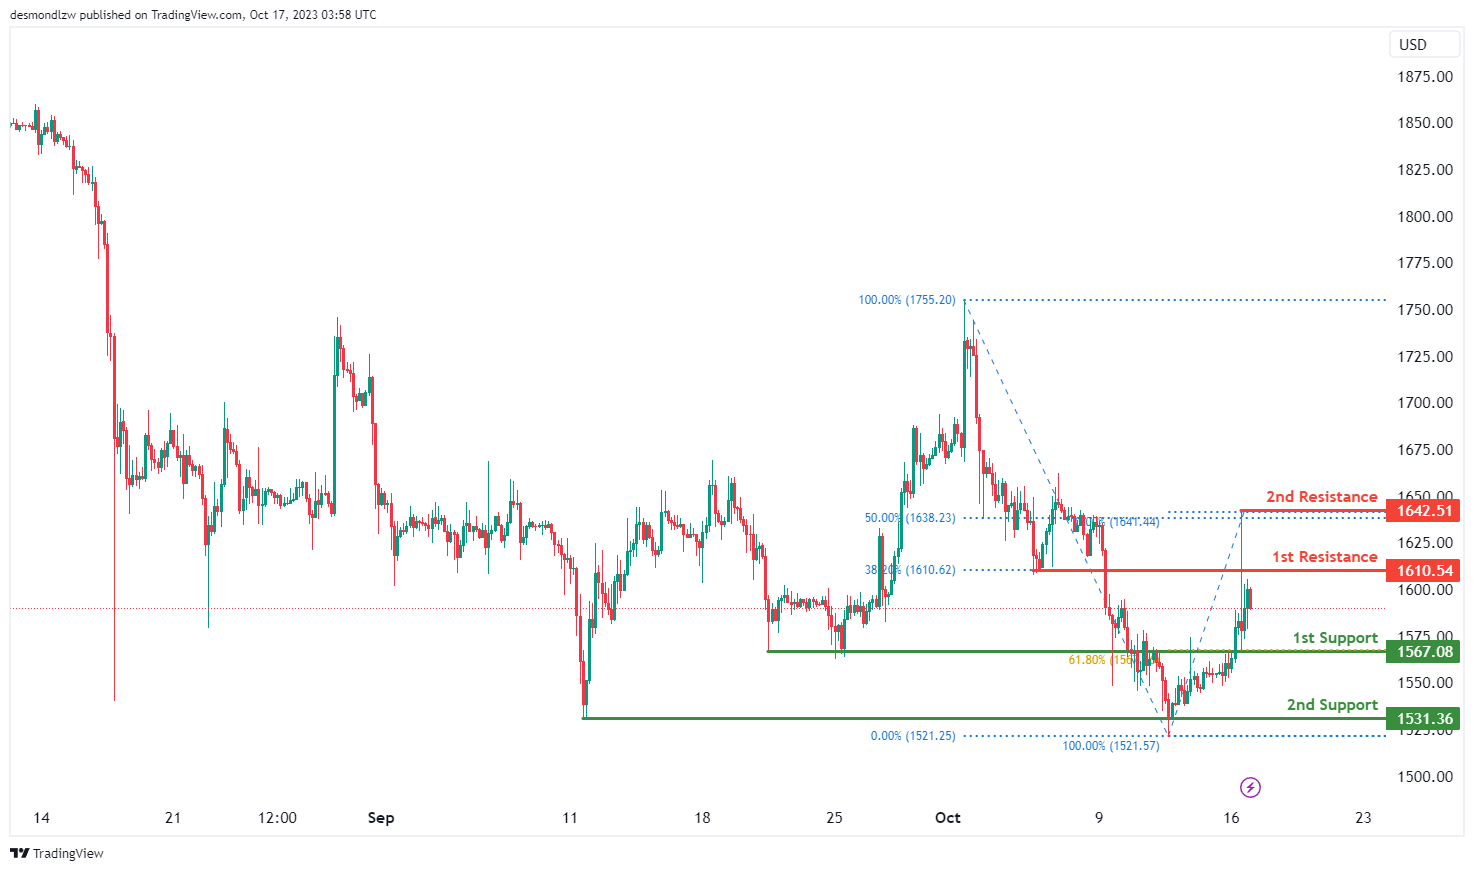
The instrument being analyzed is ETH/USD, and the current overall momentum of its chart is bearish.
There is a potential scenario where the price could make a bearish continuation towards the 1st support level, which is at 1567.08.
The 1st support at 1567.08 is considered significant because it acts as an overlap support and corresponds to a 61.80% Fibonacci Retracement level, providing a potential level of price support.
In addition, there is a 2nd support level at 1531.36, which is also valuable as it functions as a multi-swing low support. This level can provide additional support for the price in its bearish movement.
On the resistance side, the 1st resistance level at 1610.54 is considered important because it represents an overlap resistance. This level may act as a barrier to further price increases.
Moreover, there is a 2nd resistance level at 1642.51, which is also significant as it represents a swing high resistance and aligns with a 50% Fibonacci Retracement, potentially adding to its significance in the chart analysis.
WTI/USD:
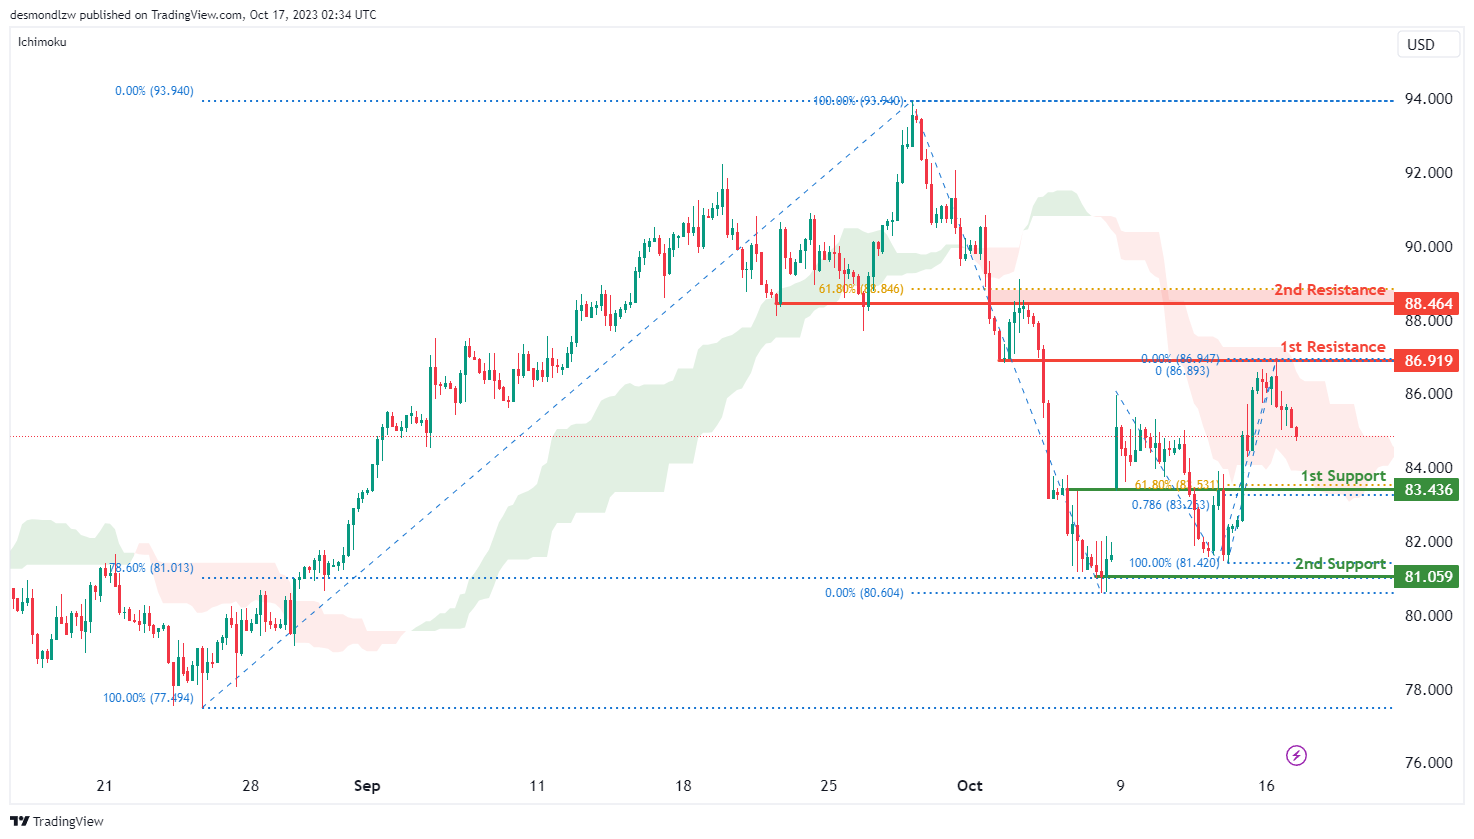
The WTI chart currently shows a bearish momentum with price running into resistance within the bearish Ichimoku cloud, indicating a potential scenario for price to make a bearish continuation towards the 1st support.
The 1st support level at 83.44 is identified as an overlap support level that aligns with a confluence of Fibonacci levels i.e. the 61.80% retracement and the 78.60% projection levels. Additionally, the 2nd support level at 81.06 is noted as pullback support that aligns with the 78.60% Fibonacci retracement level, further reinforcing its credibility as a potential support area.
To the upside, the 1st resistance level at 86.92 is identified as an overlap resistance. Beyond this, the 2nd resistance level at 88.46 is also marked as an overlap resistance level that aligns close to the 61.80% Fibonacci retracement level.
XAU/USD (GOLD):
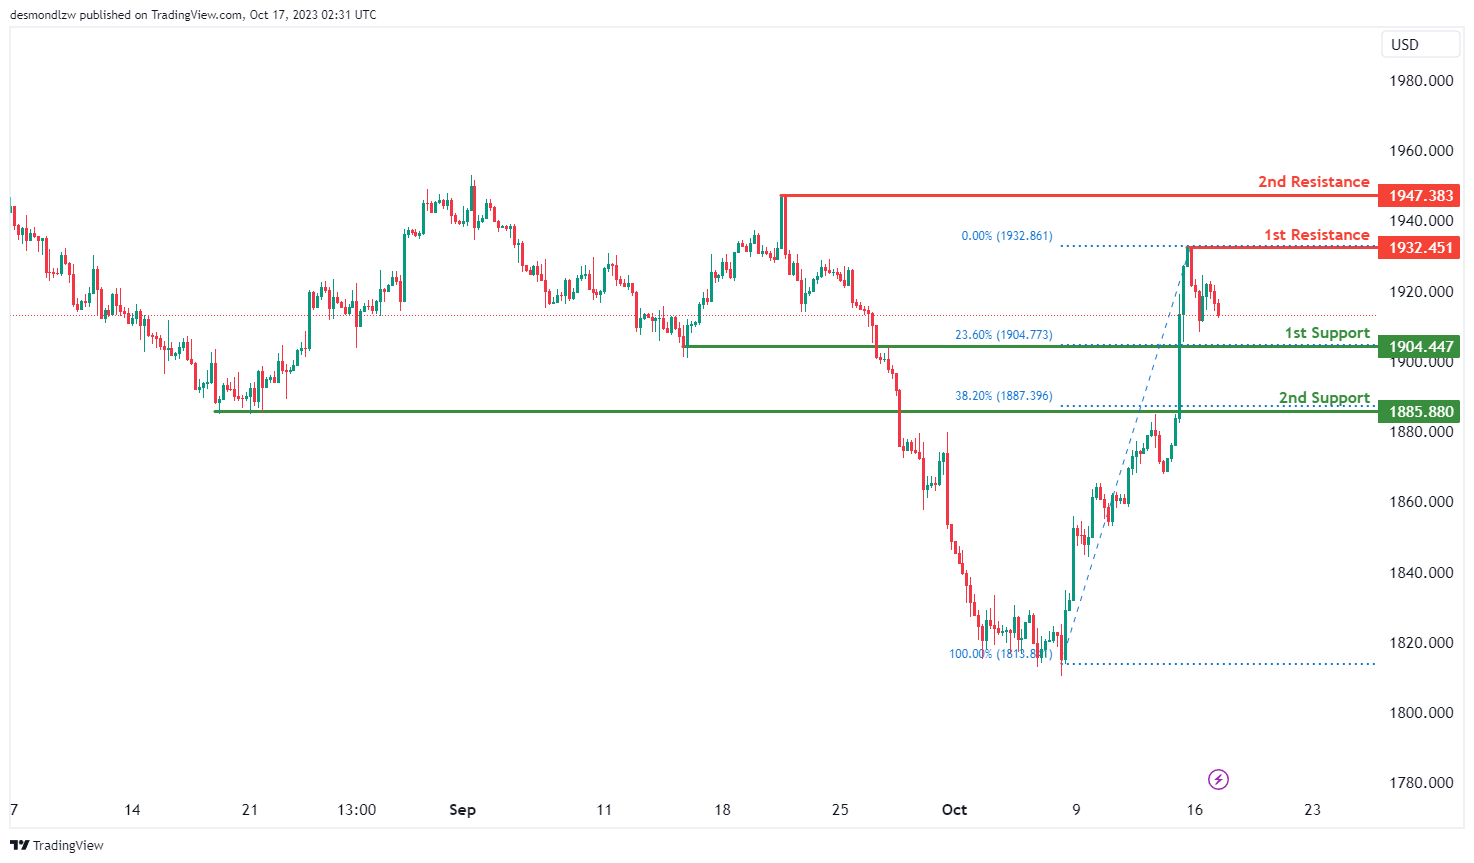
The XAU/USD chart currently indicates bearish momentum, with the potential scenario of a bearish continuation towards the 1st support level.
The 1st support at 1904.44 is considered significant as it aligns with a pullback support level and corresponds to the 23.60% Fibonacci Retracement level. Additionally, the 2nd support at 1885.88 is identified as a pullback support and coincides with the 38.20% Fibonacci Retracement level, providing a strong foundation of potential support.
On the resistance side, the 1st resistance at 1932.45 is characterized as a swing high resistance level. Beyond this, the 2nd resistance at 1947.38 is noted as another swing high resistance.
USD/CAD Daily Outlook
Daily Pivots: (S1) 1.3589; (P) 1.3627; (R1) 1.3648; More....
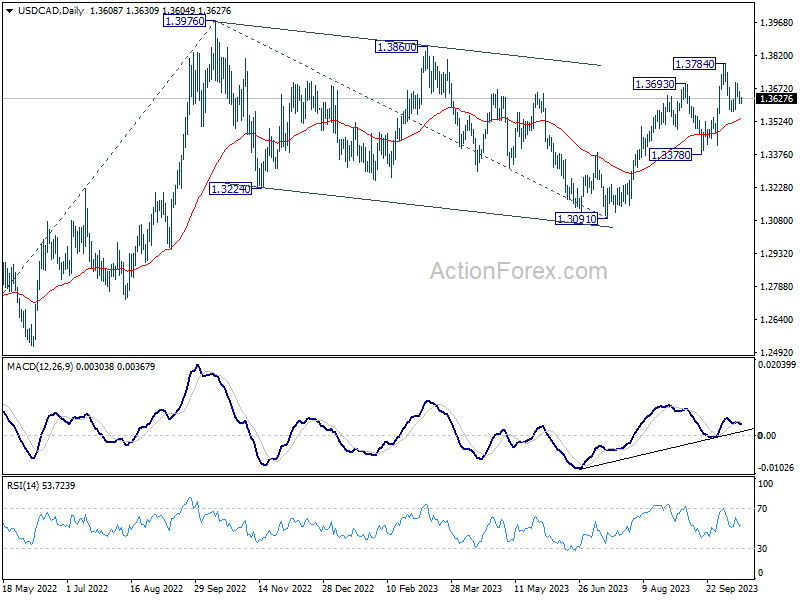
Intraday bias in USD/CAD remains neutral at this point as range trading continues. On the upside, above 1.43699 will target 1.3784 first. Break there will will resume larger rise from 1.3091 to retest 1.3976 high. On the downside, below 1.3568 will bring another falling leg to extend the near term corrective pattern from 1.3784 instead.
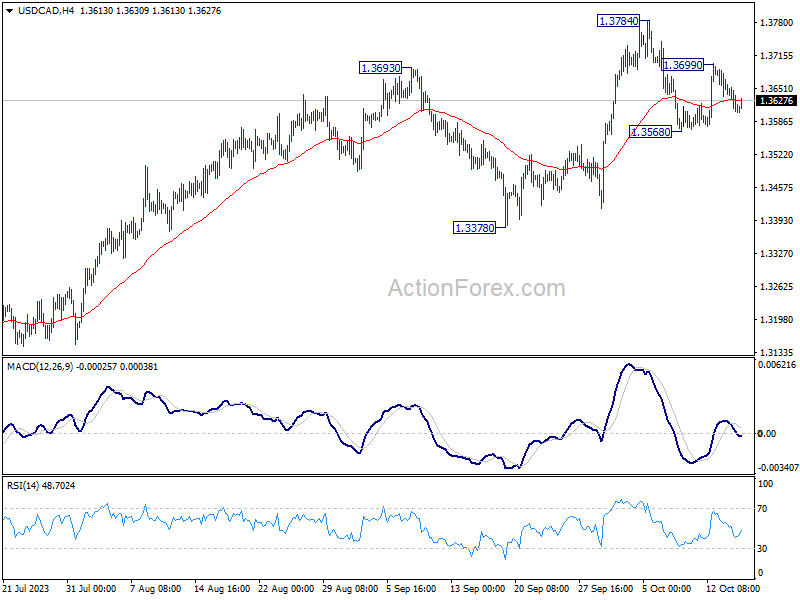
In the bigger picture, current development revives the case that corrective pattern from 1.3976 (2022 high) has completed with three waves down to 1.3091. Decisive break of 1.3976 high will confirm resumption of up trend from 1.2005 (2021 low). Next target will be 61.8% projection of 1.2401 to 1.3976 from 1.3091 at 1.4064. This will now remain the favored case as long as 1.3378 support holds.
Asian Session Sees Antipodean Currency Waves, Sterling and Canadian Braced for Movement Next
The currencies from the Southern Hemisphere, Australian and New Zealand Dollars, saw notable volatility in Asian session today. Aussie is gaining traction following release of RBA minutes, highlighting a low tolerance for inflation surprises and opening the door for another rate hike next month. In contrast, Kiwi is facing downward pressure after disappointing CPI data dampened the prospects of further RBNZ tightening. These developments have placed the two currencies at opposite ends of the daily performance spectrum.
On a wider scale, Dollar is having a mild recovery following retreat in the previous session, though its overall direction remains ambiguous. A sense of stability has returned to the risk environment, with US stock indexes and treasury yields both climbing. The Swiss Franc finds itself not far behind Dollar, positioning itself as the third strongest. Meanwhile, Canadian Dollar mirrors the downtrend of its New Zealand counterpart, emerging as the second weakest, closely followed by British Pound. Euro and Yen currently display mixed dynamics.
A slew of significant economic data is slated for release today, including UK employment figures, German ZEW economic sentiment, Canadian CPI, and US retail sales. The spotlight will be on UK wage growth and Canadian inflation data, pivotal in shaping expectations around the continuation of the tightening cycles by BoE and BoC. The volatility post these data releases might parallel the dramatic moves seen in Aussie and Kiwi during Asian session.
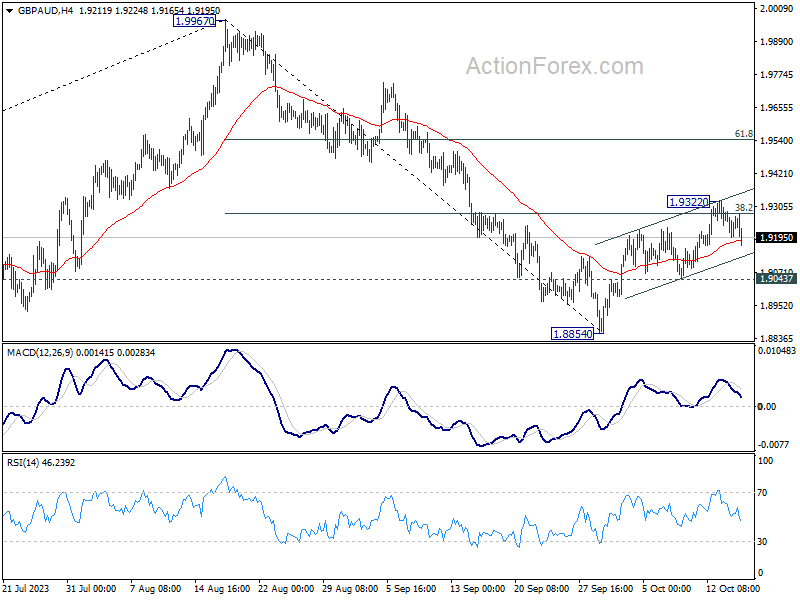
On the technical front, GBP/AUD's retreat from 1.9322 extends lower today, but it's trying to draw support from 55 4H EMA. For now, further rise is in favor as long as 1.9043 support holds. Break of 1.9322 will pave the way to 61.8% retracement of 1.9967 to 1.8854 at 1.9542, even as a corrective move. On the downside, break of 1.9043 will suggest that recovery from 1.8854 has completed, and bring retest of this low.
In Asia, at the time of writing, Nikkei is up 1.12%. Hong Kong HSI is up 0.70%. China Shanghai SSE is up 0.26%. Singapore Strait Times is up 0.31%. Japan 10-year JGB yield is up 0.023 at 0.778. Overnight, DOW rose 0.93%. S&P 500 rose 1.06%. NASDAQ rose 1.20%. 10-year yield rose 0.083 to 4.712.
RBA minutes reveal hawkish tilt, another hike in Nov?
Minutes of RBA's October meeting surprised market participants with a more hawkish tone than anticipated. The board seriously contemplated a rate hike at the meeting, but opted to hold due to a lack of "sufficient new information.
Additionally, the central bank underscored its "low tolerance" for a delayed return of inflation to target. It suggested that "some further tightening" might be imminent if inflation proves to be more persistent than current expectations.
As RBA steers ahead, its forthcoming November meeting is expected to be crucial. The board will be equipped with additional economic data on factors such as inflation, labour market dynamics, and overall economic activity. Additionally, they will have at their disposal revised staff forecasts
The minutes highlighted, "members considered two options for monetary policy at this meeting: raising the cash rate target by a further 25 basis points; or holding the cash rate target steady." However, the decision to maintain the status quo was reached as "members agreed that the case to leave the cash rate target unchanged at this meeting was the stronger one." This consensus was influenced by the absence of "sufficient new information over the preceding month from economic data or financial markets to necessitate an adjustment in the stance of monetary policy."
However, the upcoming November meeting might paint a different picture. The board is set to receive "additional data on economic activity, inflation and the labour market, as well as a set of revised staff forecasts."
"In reaching their decision, members noted that some further tightening of policy may be required should inflation prove more persistent than expected. The Board has a low tolerance for a slower return of inflation to target than currently expected," the minutes detailed.
New Zealand CPI slowed to 5.6% yoy in Q3, dimming prospects of RBNZ hike
New Zealand's CPI recorded a decline in its annual inflation rate, dropping from 6.0% yoy to 5.6% yoy in Q3. This figure not only fell short of the anticipated 5.9% yoy but was also well below RBNZ's own forecast of 6.0% yoy for the quarter. Such a deceleration would curb the likelihood of another interest rate hike in November.
A breakdown of the inflation contributors indicates that food prices played a dominant role in driving the annual inflation rate. Following closely were the costs associated with housing and household utilities, with the inflation in this sector being attributed to escalating expenses of construction and rental services.
Nicola Growden, the senior manager of consumer prices, stated, "Prices are still increasing, but are increasing at rates lower than we have seen in the previous few quarters."
On a quarterly perspective, Q3 CPI reflected a growth of 1.8% qoq, marking an upturn from Q2's 1.1% qoq. However, it missed the estimated rise of 1.9% qoq. An analysis of sector-wise performance shows that the transport sector experienced significant inflationary pressures. Specifically, the costs of petrol and new motor vehicles surged by 16.5% and 4.6%, respectively.
AUD/NZD soars amidst diverging predictions for RBA and RBNZ moves
AUD/NZD surges sharply in Asian session, buoyed by the combined effects of more hawkish RBA minutes and the disappointing New Zealand inflation numbers. This series of events has led to heightened speculation of another interest rate hike by RBA come November, while RBNZ is more likely opt to hold their stance.
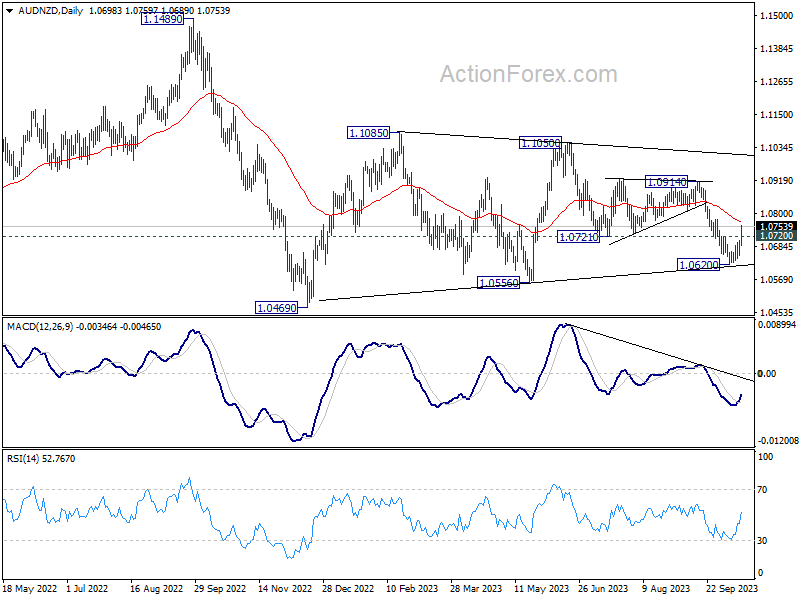
The strong break of 1.0720 resistance confirms short term bottoming in AUD/NZD . More importantly, fall from 1.1050 could have completed with three waves down to 1.0620 too. Immediate focus is on 55 D EMA (now at 1.0773). Sustained trading above there will strengthen this case and target 1.0914 resistance and above. In case of retreat, risk will now stay on the upside as long as 1.0620 support holds.
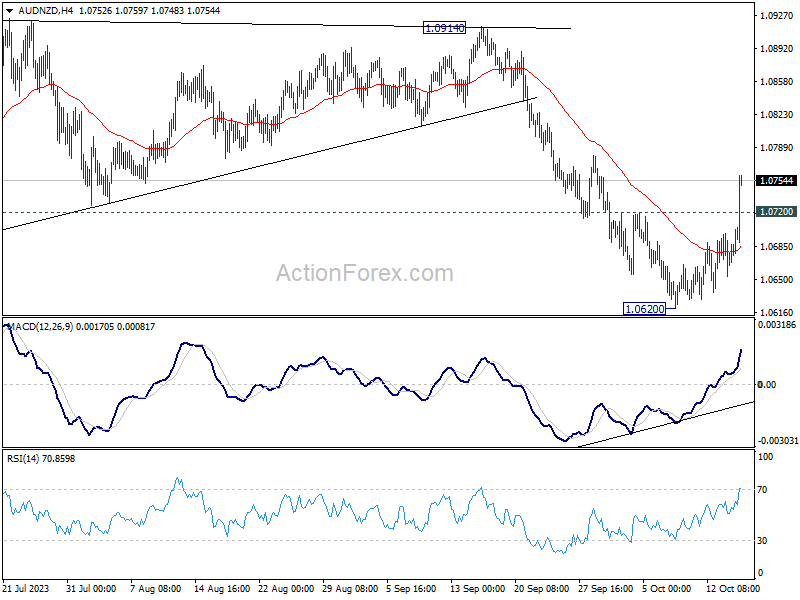
In the bigger picture, price actions from 1.0469 (2022 low) could still be interpreted as consolidation to the down trend from 1.1489 (2022 high). Thus, strong resistance could be seen in AUD/NZD as it enters into resistance zone of 1.0914/1.1050.
ECB's Lane emphasizes long road ahead before rate cuts
In an interview with Het Financieele Dagblad, ECB Chief Economist Philip Lane stressed the European Central Bank's stance on the prevailing inflationary conditions. Highlighting the central bank's efforts, Lane remarked, "Because inflation is too high, we're trying to deliver interest rates that are significantly above the neutral range." He affirmed the bank's commitment to maintaining this position, stating, "We will keep interest rates high for as long as necessary."
Lane also opened the door to potential policy adjustments, emphasizing that, "If we have inflation shocks that are sufficiently large or sufficiently persistent, we have to be open to doing more."
He projected that inflation would return to ECB's target of 2% by 2025. However, he also signaled that the journey to this target is not short-term. "Only when we are sufficiently confident of reaching that target, we can normalize policy," he said, adding, "But this is quite some distance from where we are now."
Delving into what he perceives as necessary to gain more clarity, Lane expressed a personal need for "more information about the wage settlements for 2024." He highlighted that a considerable amount of time would elapse before gaining confidence in the inflation trajectory, noting, "we will have to wait until spring next year before many countries release that information."
He said, "So it's going to be some time before we can have a high degree of confidence that inflation is on its way back to 2%."
Fed's Harker advocates for rate pause amid struggles of small businesses
As Fed grapples with the consequences of its tightening monetary policy, Philadelphia Fed President Patrick Harker voiced concerns regarding the implications for small businesses. In a virtual event, Harker underscored the challenges small firms are facing due to limited access to capital, and suggested Fed should refrain from contemplating additional interest rate hikes
"Small firms are really struggling with access to capital," Harker pointed out, echoing the sentiments of bankers who are wary that their business models may not withstand further hikes.
"Some of the bankers I've talked to are concerned that their business plans just aren't going to be able to make it at the higher rates. I heard that warning a lot over the summer," Harker elaborated.
In light of these concerns, Harker advocated for a pause in rate adjustments to evaluate the full impact of the existing policy on small businesses. By holding rates steady, Fed can provide a reprieve for struggling firms and assess the broader economy before making further moves.
"This is why we should hold rates steady, we should not at this point be thinking about any increases, because if that's true — and it is true — then we should let that ride out," Harker asserted.
Looking ahead
UK employment and Germany ZEW economic sentiment will be release in European session. Later in the day, Canada CPI and US retail sales will take center stage.
USD/CAD Daily Outlook
Daily Pivots: (S1) 1.3589; (P) 1.3627; (R1) 1.3648; More....
Intraday bias in USD/CAD remains neutral at this point as range trading continues. On the upside, above 1.43699 will target 1.3784 first. Break there will will resume larger rise from 1.3091 to retest 1.3976 high. On the downside, below 1.3568 will bring another falling leg to extend the near term corrective pattern from 1.3784 instead.
In the bigger picture, current development revives the case that corrective pattern from 1.3976 (2022 high) has completed with three waves down to 1.3091. Decisive break of 1.3976 high will confirm resumption of up trend from 1.2005 (2021 low). Next target will be 61.8% projection of 1.2401 to 1.3976 from 1.3091 at 1.4064. This will now remain the favored case as long as 1.3378 support holds.
Economic Indicators Update
| GMT | Ccy | Events | Actual | Forecast | Previous | Revised |
|---|---|---|---|---|---|---|
| 21:45 | NZD | CPI Q/Q Q3 | 1.80% | 1.90% | 1.10% | |
| 00:30 | AUD | RBA Minutes | ||||
| 06:00 | GBP | Claimant Count Change Sep | 2.3K | 0.9K | ||
| 06:00 | GBP | ILO Unemployment Rate (3M) Aug | 4.30% | 4.30% | ||
| 06:00 | GBP | Average Earnings Including Bonus 3M/Y Aug | 8.30% | 8.50% | ||
| 06:00 | GBP | Average Earnings Excluding Bonus 3M/Y Aug | 7.80% | 7.80% | ||
| 09:00 | EUR | Germany ZEW Economic Sentiment Oct | -9.5 | -11.4 | ||
| 09:00 | EUR | Germany ZEW Current Situation Oct | -80.5 | -79.4 | ||
| 09:00 | EUR | Eurozone ZEW Economic Sentiment Oct | -8 | -8.9 | ||
| 12:15 | CAD | Housing Starts Sep | 250K | 253K | ||
| 12:30 | CAD | CPI M/M Sep | 0.10% | 0.40% | ||
| 12:30 | CAD | CPI Y/Y Sep | 4.00% | 4.00% | ||
| 12:30 | CAD | CPI Median Y/Y Sep | 4.00% | 4.10% | ||
| 12:30 | CAD | CPI Common Y/Y Sep | 3.80% | 3.90% | ||
| 12:30 | CAD | CPI Trimmed Y/Y Sep | 4.70% | 4.80% | ||
| 12:30 | USD | Retail Sales M/M Sep | 0.30% | 0.60% | ||
| 12:30 | USD | Retail Sales ex Autos M/M Sep | 0.20% | 0.60% | ||
| 13:15 | USD | Industrial Production M/M Sep | -0.10% | 0.40% | ||
| 13:15 | USD | Capacity Utilization Sep | 79.60% | 79.70% | ||
| 14:00 | USD | Business Inventories Aug | 0.30% | 0.00% | ||
| 14:00 | USD | NAHB Housing Market Index Oct | 45 | 45 |
RBA Minutes: A Low Tolerance for Upside Surprises
Further rate increases not completely off the table, but only if the inflation outlook changes materially from here.
The RBA Board again considered both the case for a rate increase and the case for leaving rates unchanged at its October meeting. But without much new information in the month, it concluded that there was no need to move.
The wording changes this month imply that the Board is willing to raise rates again if there is a material upside surprise to the medium-term inflation outlook. But if things keep on turning out broadly in line with the sequence of staff forecasts over this year, the Board is content to hold rates steady.
Particularly noteworthy was the change to the last paragraph, adding the sentence, “The Board has a low tolerance for a slower return of inflation to target than currently expected.” This signals their willingness to act if the outlook changes. The wording change in the next sentence, “Whether or not a further increase in interest rates is required…” is also significant. It reads as a deliberate pointer to the Board’s assessment that it would only need to tighten further in the event of an upside surprise.
The Board’s increased willingness to spell out that no surprises means no further moves probably stems from some of the shifts in their assessment of the data and risks from prior months. Some of the points that stood out included that inflation had “abated from its peak” and the labour market had reached a turning point. The minutes went into quite some detail about the various labour indicators in support of this assessment. The discussion on wages also seemed a lot more sanguine than earlier in the year, despite worries about productivity.
Against these more sanguine comments, it is notable that the Board did discuss the potential upside risks coming from the recovery in the established housing market and the lower exchange rate. However, the Board seems to have concluded that these did not warrant a response at this time.
On the housing market, the continued recovery in prices does mean that the wealth effects on household consumption could be stronger than previously expected. However, this must be set against the overall weak picture for spending. The squeeze on household incomes from inflation, a rising tax take and higher interest rates is the more important driver of consumption outcomes. The outlook for household spending remains weak in the face of these headwinds.
On the exchange rate, the minutes highlighted that it is the trade-weighted index (TWI), not the exchange rate to the US dollar that matters, and that the TWI is little changed from the start of the year. This rather pointed educational comment links to the commentary on China. The latest monthly data for China was seen as being a bit more positive and the minutes highlighted how resilient Chinese demand for steel has been. But the overall outlook there remains weak. Negative news out of China normally results in markets selling off the Australian dollar against the US dollar – but not against the renminbi. So the change in the trade-weighted index is smaller.
Next month’s meeting will have the benefit of the full September quarter CPI result and updated staff forecasts. The October meeting also took place before Hamas’ attacks on Israel and the resulting lift in oil prices and market volatility. Near-term forecasts for headline inflation will probably need to be revised up because of this, but we judge that this will not be enough to tilt the Board’s hand. A significant upside surprise in the September quarter CPI release, along with further evidence that the real economy is proving more resilient than expected, might be enough to change their view and thus their decision. But this is not our central case at present. The Governor, Michele Bullock, is likely to provide further colour on her thinking about these risks when she speaks tomorrow.
GBP/USD Could Struggle As US Dollar Regains Strength
Key Highlights
- GBP/USD is signaling more downsides below 1.2050.
- Gold prices struggled to continue higher above the $1,935 resistance.
- Bitcoin price saw wild moves after fake news of spot ETF approval.
- Israeli strikes on Gaza intensify as crisis deepens.
GBP/USD Technical Analysis
The British Pound started another decline from the 1.2340 resistance against the US dollar. GBP/USD declined below 1.2200 and remains at a risk of a drop to 1.2000. It seems like the Israeli-Hamas crisis deepened as strikes on Gaza intensified amid reports of over 195 people being abducted by Hamas.
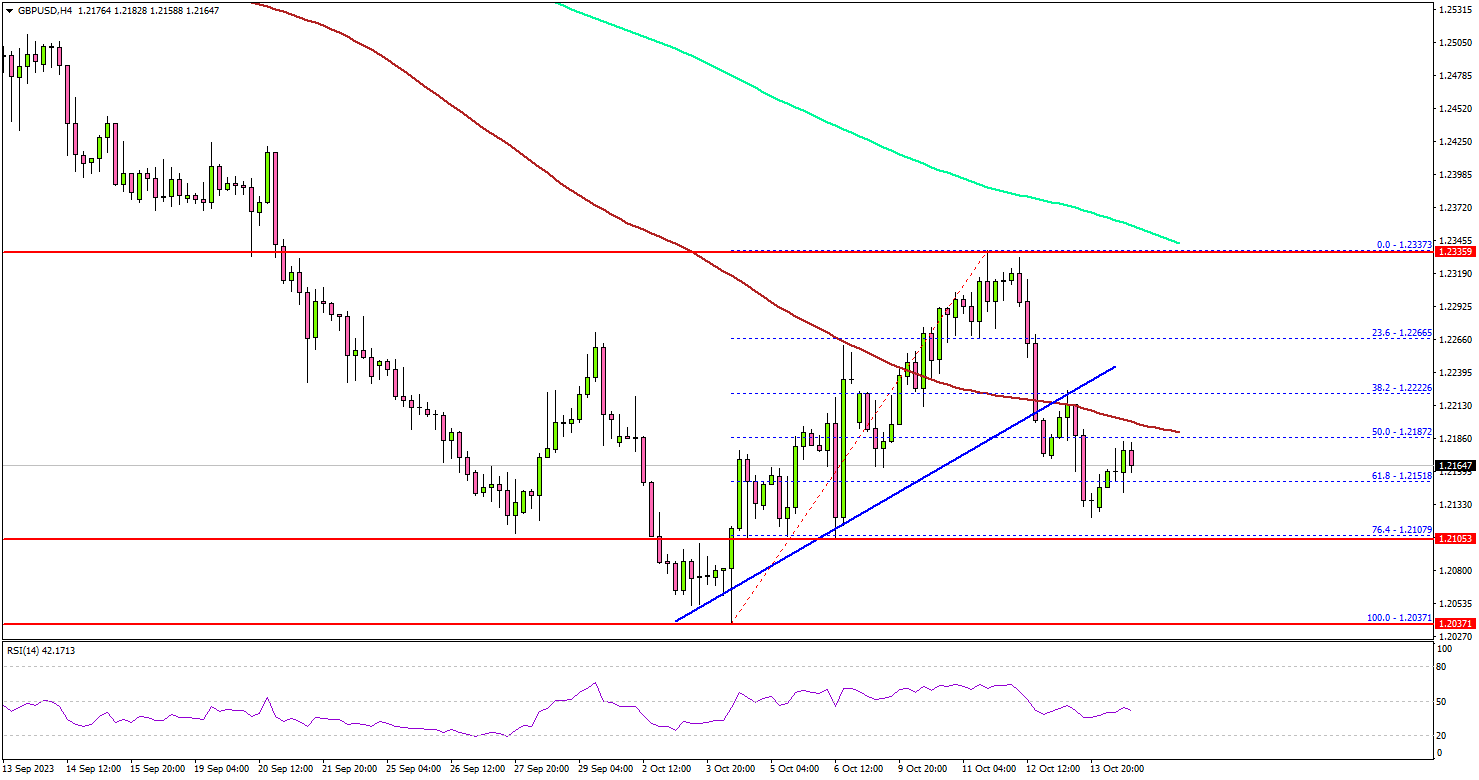
Looking at the 4-hour chart of GBP/USD, the pair declined below the 1.2250 support zone. There was a break below a key bullish trend line with support near 1.2210. The pair even settled below the 1.2200 level, the 100 simple moving average (red, 4 hours), and the 200 simple moving average (green, 4 hours).
It also spiked below the 1.2150 level and the 61.8% Fib retracement level of the upward move from the 1.2037 swing low to the 1.2337 high.
If the bears remain in action, the pair could slide below 1.2125. The next key support is seen near the 1.2050 level, below which it could test 1.2000. Any more losses might send the pair toward the 1.1920 level.
On the upside, the pair might struggle to clear the 1.2185 resistance and the 100 simple moving average (red, 4 hours). The next key resistance is near 1.2220, above which the pair could rise toward the 1.2265 level. The next major stop for the bulls could be 1.2320.
Looking at Bitcoin, the price saw a nasty spike toward the $30,000 level after fake news hit the market about spot ETF approval.
Economic Releases
- US Retail Sales for Sep 2023 (MoM) – Forecast +0.3%, versus +0.6% previous.
- Canadian Consumer Price Index for Sep 2023 (MoM) – Forecast +0.1%, versus +0.4% previous.
- Canadian Consumer Price Index for Sep 2023 (YoY) – Forecast +4%, versus +4% previous.