

Sample Category Title
Retail Sales Lifts Dollar Higher; Canadian Faces Headwinds After CPI
Today's economic data releases are steering the markets, though it is uncertain how sustained their influence will be. Dollar emerges as the day's strongest performer, buoyed by robust retail sales figures. Australian Dollar trails as the initial lift from RBA minutes dissipates, leaving it in the second spot. Euro is firmer after German economic sentiment data showed Eurozone has passed the lowest point.
Meanwhile, Yen experienced a brief surge following reports suggesting an upward revision of inflation forecasts by BoJ. Despite the initial excitement, the currency's climb receded once it became evident that this was not fresh news. Nonetheless, Yen still retains a portion of its gains, displaying a mixed performance.
Conversely, New Zealand Dollar plummeted earlier in Asia following the release of softer-than-anticipated inflation figures. Sterling faced pressure due to uninspiring wage growth data, and Canadian Dollar was not spared either, experiencing a downturn due to a faster cooling in inflation than anticipated. These statistics bolster the argument for the central banks of these nations to hit the pause button again on any imminent policy shifts.
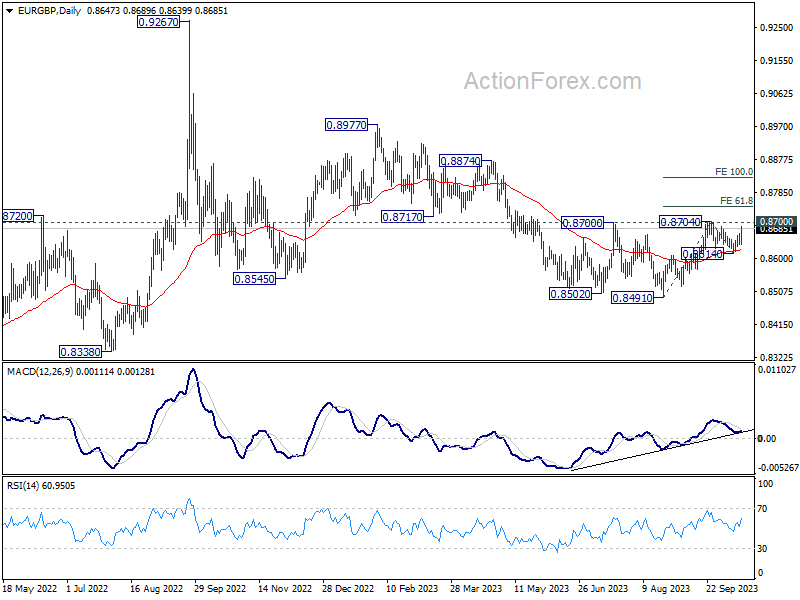
In the technical arena, all eyes are on EUR/GBP over the next 24 hours, especially with the release of UK CPI data looming. Prior strong rebound from 55 D EMA affirms near term bullishness. Firm break of 0.8700/4 resistance zone will resume the rebound from 0.8491. More importantly, that would strengthen the case the it's reversing whole down trend from 0.9267. Next near term target will be 61.8% projection of 0.8491 to 0.8704 from 0.8614 at 0.8746.
In Europe, at the time of writing, FTSE is up 0.32%. DAX is down -0.53%. CAC is down -0.41%. Germany 10-year yield is up 0.0782 at 2.867. Earlier in Asia, Nikkei rose 1.20%. Hong Kong HSI rose 0.75%. China Shanghai SSE rose 0.32%. Singapore Strait Times rose 0.25%. Japan 10-year JGB yield rose 0.0295 to 0.785.
US retail sales rose 0.7% mom in Sep, ex-auto sales up 0.6% mom
US retail sales rose 0.7% mom to USD 704.9B in September, above expectation of 0.3% mom. Ex-auto sales rose 0.6% mom to USD 469.7B, above expectation of 0.2% mom. Ex-gasoline sales rose 0.7% mom to USD 648.2B. Ex-auto, gasoline sales rose 0.7% mom to USD 513.0B.
Total sales for July through September period were up 3.1% from the same period a year ago.
Canada's inflation cools more than expected in Sep
In September, Canada's CPI deceleration surpassed expectations. The annual inflation rate receded to 3.8% yoy, falling short of the anticipated 4.0% and marking a downtick from August's 4.0% yoy. Gasoline prices, affected by the base-year effect, showed an escalation, recording a 7.5% yoy ascent compared to August's 0.8% yoy . Nevertheless, when gasoline was excluded, CPI realized a slowdown to 3.7% yoy from the previous month's 4.1% yoy.
On a monthly basis, CPI was down by -0.1% mom, contradicting the expected 0.1% mom incline. A -1.3% monthly decline in gasoline prices significantly influenced this downturn.
In the examination of the core inflation measures, which BoC meticulously observes, all three - CPI median, CPI common, and CPI trimmed - fell short of expectations. CPI median receded from 4.1% to 3.8% yoy, against the projected 4.0% yoy. CPI common retreated from 3.9% yoy to 3.7% yoy, not meeting 3.8% yoy expectation. Similarly, CPI trimmed dwindled from 4.8% yoy to 4.4% yoy, undermining the anticipated 4.7% yoy rate.
German ZEW rose to -1.1, passed the lowest points
German and Eurozone economic sentiments are seeing a revival, as indicated by the notable improvement in ZEW Economic Sentiment Indicators for October. In Germany, Economic Sentiment rose significantly from -11.4 to -1.1, outperforming the anticipated -9.5. Despite this uplift in sentiment, Current Situation Index experienced a minor decline, moving from -79.4 to -79.9, although it still exceeded the expected -80.5.
Eurozone isn't lagging, either. The region's ZEW Economic Sentiment rebounded from negative terrain, ascending from -8.9 to 2.3 and surpassing -8 forecast. Concurrently, Current Situation Index experienced a dip of -9.8 points, resting at -52.4.
ZEW President Professor Achim Wambach expressed optimism, indicating a potential turnaround in economic sentiment. "It seems that we have passed the lowest point," Wambach noted, highlighting a positive shift in expectations, driven partly by anticipation of declining inflation rates.
More than three-quarters of survey participants expect short-term interest rates in Eurozone to stabilize, reinforcing optimistic economic outlook. Despite concerns related to negative factors influencing growth forecasts, such as the Israel conflict, their impact appears limited, ensuring the overall economic perspective remains tilted towards optimism.
UK regular pay growth matches expectations at 7.8%
UK's annual growth in regular pay, excluding bonuses, stood in line with market expectations, clocking in at 7.8% in the three months to August. However, when accounting for bonuses, the total pay's annual growth was slightly tepid at 8.1%, missing the market forecast of 8.3%.
When adjusted for inflation using CPI including owner occupiers' housing costs (CPIH) - the real terms annual growth showcased a rise of 1.3% for total pay from June to August. Similarly, the regular pay's real terms annual growth registered a 1.1% increase.
A sector-wise dissection revealed that finance and business services led the pack with the most robust annual regular growth rate at 9.6%. Manufacturing sector followed closely with an impressive 8.0% growth rate. This surge in the manufacturing sector's pay growth is noteworthy, marking one of its highest annual regular growth rates since the inception of comparable records in 2001.
RBA minutes reveal hawkish tilt, another hike in Nov?
Minutes of RBA's October meeting surprised market participants with a more hawkish tone than anticipated. The board seriously contemplated a rate hike at the meeting, but opted to hold due to a lack of "sufficient new information.
Additionally, the central bank underscored its "low tolerance" for a delayed return of inflation to target. It suggested that "some further tightening" might be imminent if inflation proves to be more persistent than current expectations.
As RBA steers ahead, its forthcoming November meeting is expected to be crucial. The board will be equipped with additional economic data on factors such as inflation, labour market dynamics, and overall economic activity. Additionally, they will have at their disposal revised staff forecasts
The minutes highlighted, "members considered two options for monetary policy at this meeting: raising the cash rate target by a further 25 basis points; or holding the cash rate target steady." However, the decision to maintain the status quo was reached as "members agreed that the case to leave the cash rate target unchanged at this meeting was the stronger one." This consensus was influenced by the absence of "sufficient new information over the preceding month from economic data or financial markets to necessitate an adjustment in the stance of monetary policy."
However, the upcoming November meeting might paint a different picture. The board is set to receive "additional data on economic activity, inflation and the labour market, as well as a set of revised staff forecasts."
"In reaching their decision, members noted that some further tightening of policy may be required should inflation prove more persistent than expected. The Board has a low tolerance for a slower return of inflation to target than currently expected," the minutes detailed.
New Zealand CPI slowed to 5.6% yoy in Q3, dimming prospects of RBNZ hike
New Zealand's CPI recorded a decline in its annual inflation rate, dropping from 6.0% yoy to 5.6% yoy in Q3. This figure not only fell short of the anticipated 5.9% yoy but was also well below RBNZ's own forecast of 6.0% yoy for the quarter. Such a deceleration would curb the likelihood of another interest rate hike in November.
A breakdown of the inflation contributors indicates that food prices played a dominant role in driving the annual inflation rate. Following closely were the costs associated with housing and household utilities, with the inflation in this sector being attributed to escalating expenses of construction and rental services.
Nicola Growden, the senior manager of consumer prices, stated, "Prices are still increasing, but are increasing at rates lower than we have seen in the previous few quarters."
On a quarterly perspective, Q3 CPI reflected a growth of 1.8% qoq, marking an upturn from Q2's 1.1% qoq. However, it missed the estimated rise of 1.9% qoq. An analysis of sector-wise performance shows that the transport sector experienced significant inflationary pressures. Specifically, the costs of petrol and new motor vehicles surged by 16.5% and 4.6%, respectively.
USD/CAD Mid-Day Outlook
Daily Pivots: (S1) 1.3589; (P) 1.3627; (R1) 1.3648; More....
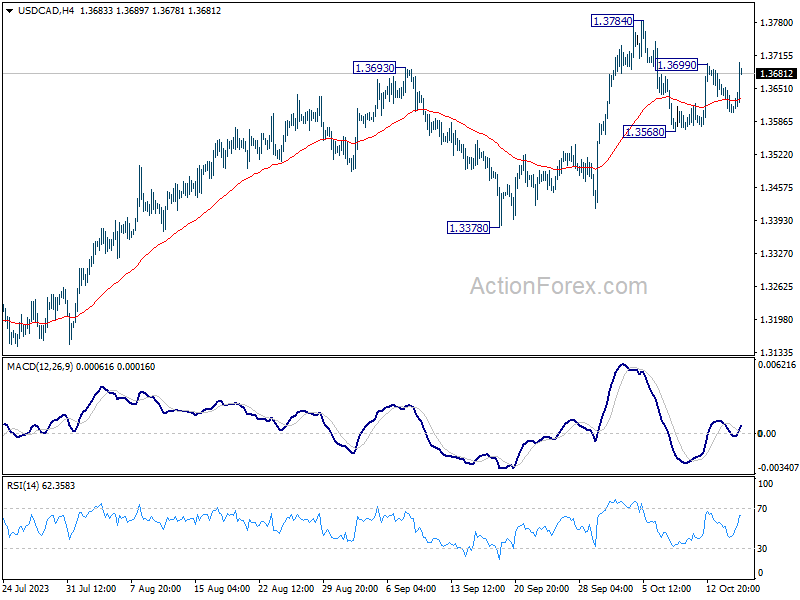
USD/CAD rebounds notably today and focus is back on 1.3699 resistance. Firm break there will target 1.3784 first. Break there will resume larger rise from 1.3091 to retest 1.3976 high. On the downside, below 1.3568 will bring another falling leg to extend the near term corrective pattern from 1.3784 instead.
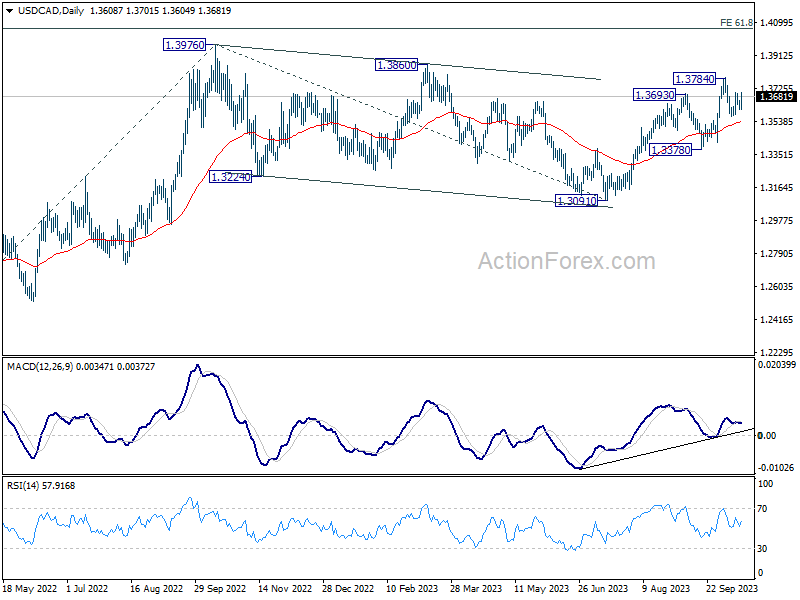
In the bigger picture, current development revives the case that corrective pattern from 1.3976 (2022 high) has completed with three waves down to 1.3091. Decisive break of 1.3976 high will confirm resumption of up trend from 1.2005 (2021 low). Next target will be 61.8% projection of 1.2401 to 1.3976 from 1.3091 at 1.4064. This will now remain the favored case as long as 1.3378 support holds.
Economic Indicators Update
| GMT | Ccy | Events | Actual | Forecast | Previous | Revised |
|---|---|---|---|---|---|---|
| 21:45 | NZD | CPI Q/Q Q3 | 1.80% | 1.90% | 1.10% | |
| 00:30 | AUD | RBA Minutes | ||||
| 06:00 | GBP | Average Earnings Including Bonus 3M/Y Aug | 8.10% | 8.30% | 8.50% | |
| 06:00 | GBP | Average Earnings Excluding Bonus 3M/Y Aug | 7.80% | 7.80% | 7.80% | 7.90% |
| 09:00 | EUR | Germany ZEW Economic Sentiment Oct | -1.1 | -9.5 | -11.4 | |
| 09:00 | EUR | Germany ZEW Current Situation Oct | -79.9 | -80.5 | -79.4 | |
| 09:00 | EUR | Eurozone ZEW Economic Sentiment Oct | 2.3 | -8 | -8.9 | |
| 12:30 | CAD | CPI M/M Sep | -0.10% | 0.10% | 0.40% | |
| 12:30 | CAD | CPI Y/Y Sep | 3.80% | 4.00% | 4.00% | |
| 12:30 | CAD | CPI Median Y/Y Sep | 3.80% | 4.00% | 4.10% | |
| 12:30 | CAD | CPI Common Y/Y Sep | 3.70% | 3.80% | 3.90% | |
| 12:30 | CAD | CPI Trimmed Y/Y Sep | 4.40% | 4.70% | 4.80% | |
| 12:30 | USD | Retail Sales M/M Sep | 0.70% | 0.30% | 0.60% | |
| 12:30 | USD | Retail Sales ex Autos M/M Sep | 0.60% | 0.20% | 0.60% | |
| 13:15 | USD | Industrial Production M/M Sep | -0.10% | 0.40% | ||
| 13:15 | USD | Capacity Utilization Sep | 79.60% | 79.70% | ||
| 14:00 | USD | Business Inventories Aug | 0.30% | 0.00% | ||
| 14:00 | USD | NAHB Housing Market Index Oct | 45 | 45 |
US retail sales rose 0.7% mom in Sep, ex-auto sales up 0.6% mom
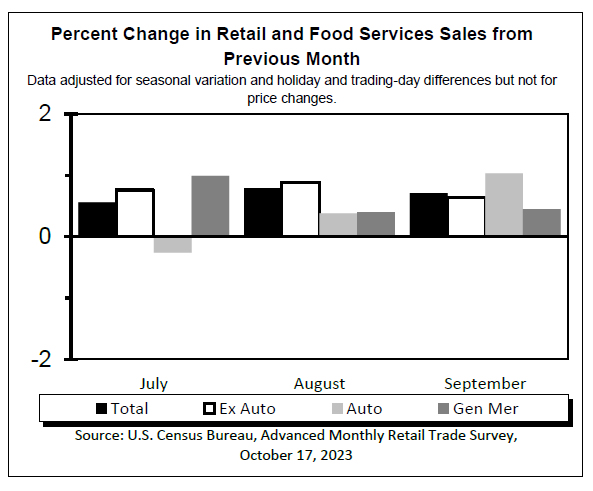
US retail sales rose 0.7% mom to USD 704.9B in September, above expectation of 0.3% mom. Ex-auto sales rose 0.6% mom to USD 469.7B, above expectation of 0.2% mom. Ex-gasoline sales rose 0.7% mom to USD 648.2B. Ex-auto, gasoline sales rose 0.7% mom to USD 513.0B.
Total sales for July through September period were up 3.1% from the same period a year ago.
Canada’s inflation cools more than expected in Sep
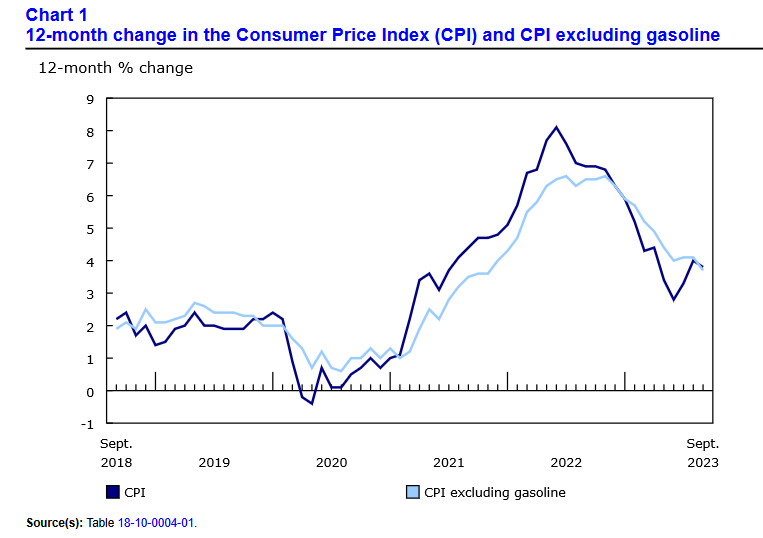
In September, Canada's CPI deceleration surpassed expectations. The annual inflation rate receded to 3.8% yoy, falling short of the anticipated 4.0% and marking a downtick from August's 4.0% yoy.
Gasoline prices, affected by the base-year effect, showed an escalation, recording a 7.5% yoy ascent compared to August's 0.8% yoy . Nevertheless, when gasoline was excluded, CPI realized a slowdown to 3.7% yoy from the previous month's 4.1% yoy.
On a monthly basis, CPI was down by -0.1% mom, contradicting the expected 0.1% mom incline. A -1.3% monthly decline in gasoline prices significantly influenced this downturn.
In the examination of the core inflation measures, which BoC meticulously observes, all three - CPI median, CPI common, and CPI trimmed - fell short of expectations.
CPI median receded from 4.1% to 3.8% yoy, against the projected 4.0% yoy. CPI common retreated from 3.9% yoy to 3.7% yoy, not meeting 3.8% yoy expectation. Similarly, CPI trimmed dwindled from 4.8% yoy to 4.4% yoy, undermining the anticipated 4.7% yoy rate.
GBP/USD: Cable Weakens on Downbeat UK Earnings Data, Inflation Report in Focus
Cable pulls back in European trading on Tuesday, erasing a good part of Monday’s 0.65% jump, pressured by weaker than expected UK pay growth data, which increases pressure on those advocating for another BoE rate hike.
Markets await release of UK Sep inflation report on Wednesday (6.5%y/y f/c vs 6.7% Aug and core 6.0% f/c vs 6.2% Aug),
September figure in line or below expectations will weigh further on hawkish rate view and keep sterling at the back foot.
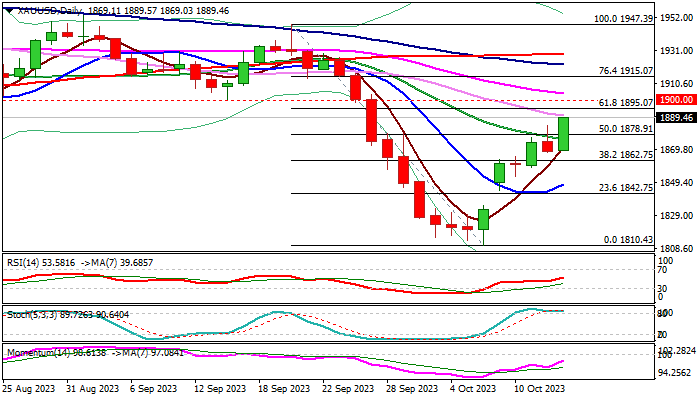
Fresh weakness pressures initial support at 1.2141 (bull-trendline off 1.2037 low) ahead of pivotal point at 1.2122 (Friday’s low), loss of which would signal further weakness and risk retest of Oct 4 low at 1.2037.
Converged 10/20DMA’s 1.2200/13) mark pivotal barrier, with sustained break here to sideline immediate downside threats and open way for fresh recovery.
Res: 1.2200; 1.2213; 1.2271; 1.2308.
Sup: 1.2141; 1.2122; 1.2100; 1.2037.
Australian Dollar Calm after RBA Minutes
- RBA releases minutes
- Investors eye Israel-Hamas war
The Australian dollar has extended its gains on Tuesday. AUD/USD is trading at 0.6353 in Europe, up 0.18%.
It has been a rough patch for the Australian dollar lately. The Aussie hasn’t managed a winning week since September and dropped close to a one-year low last week. The Australian dollar has rebounded this week, gaining close to 1%, as the US dollar has lost some steam.
We’ve been hearing a lot about the Fed’s “higher for longer” stance and the markets are less confident that the Fed is done with the current tightening cycle than they were a few months ago. The fighting in the Middle East has created a new “higher for longer” in terms of uncertainty, which could result in elevated volatility in the currency markets.
The US dollar, a trusted safe-haven asset, has not benefited from the latest turmoil in the Middle East, at least not yet. There is widespread concern that the Israel-Hamas war could spread to Lebanon and even to Iran. The US is determined to halt any contagion and has dispatched aircraft carriers to the region.
The Reserve Bank of Australia released the minutes of this month’s meeting earlier today. The central bank held rates at 4.10% for a fourth straight time, but the minutes showed that there was consideration to raise rates by a quarter-point.
The board members noted that inflation was well above the 2%-3% target and “was expected to do so for some time”, with rising fuel prices adding to headline inflation. The minutes noted that the current tightening cycle continued to filter through the economy and the full effects were yet to be felt.
The RBA meets next on November 3rd and members will have plenty of data to chew on ahead of the rate decision. Australia releases an employment report on Thursday, inflation next week and economic forecasts prior to the meeting. The RBA has said that rate decisions will be data-dependent, and these releases will determine whether the RBA extends its pause phase or delivers a rate hike.
AUD/USD Technical
With the Australian dollar showing limited movement, the support and resistance levels are unchanged from Monday:
- AUD/USD continues to test resistance at 0.6343. Above, there is resistance at 0.6399
- 0.6240 and 0.6184 are providing support
German ZEW rose to -1.1, passed the lowest points
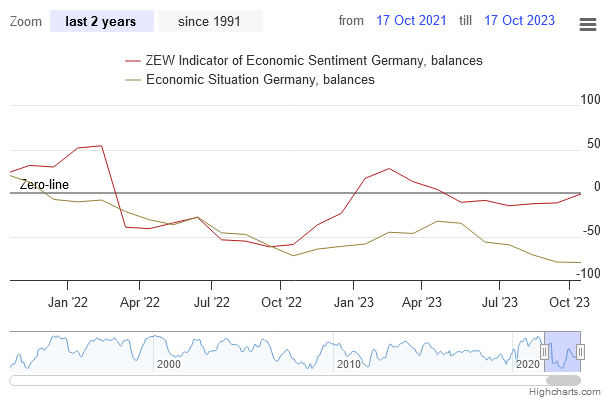
German and Eurozone economic sentiments are seeing a revival, as indicated by the notable improvement in ZEW Economic Sentiment Indicators for October. In Germany, Economic Sentiment rose significantly from -11.4 to -1.1, outperforming the anticipated -9.5. Despite this uplift in sentiment, Current Situation Index experienced a minor decline, moving from -79.4 to -79.9, although it still exceeded the expected -80.5.
Eurozone isn't lagging, either. The region's ZEW Economic Sentiment rebounded from negative terrain, ascending from -8.9 to 2.3 and surpassing -8 forecast. Concurrently, Current Situation Index experienced a dip of -9.8 points, resting at -52.4.
ZEW President Professor Achim Wambach expressed optimism, indicating a potential turnaround in economic sentiment. "It seems that we have passed the lowest point," Wambach noted, highlighting a positive shift in expectations, driven partly by anticipation of declining inflation rates.
More than three-quarters of survey participants expect short-term interest rates in Eurozone to stabilize, reinforcing optimistic economic outlook. Despite concerns related to negative factors influencing growth forecasts, such as the Israel conflict, their impact appears limited, ensuring the overall economic perspective remains tilted towards optimism.
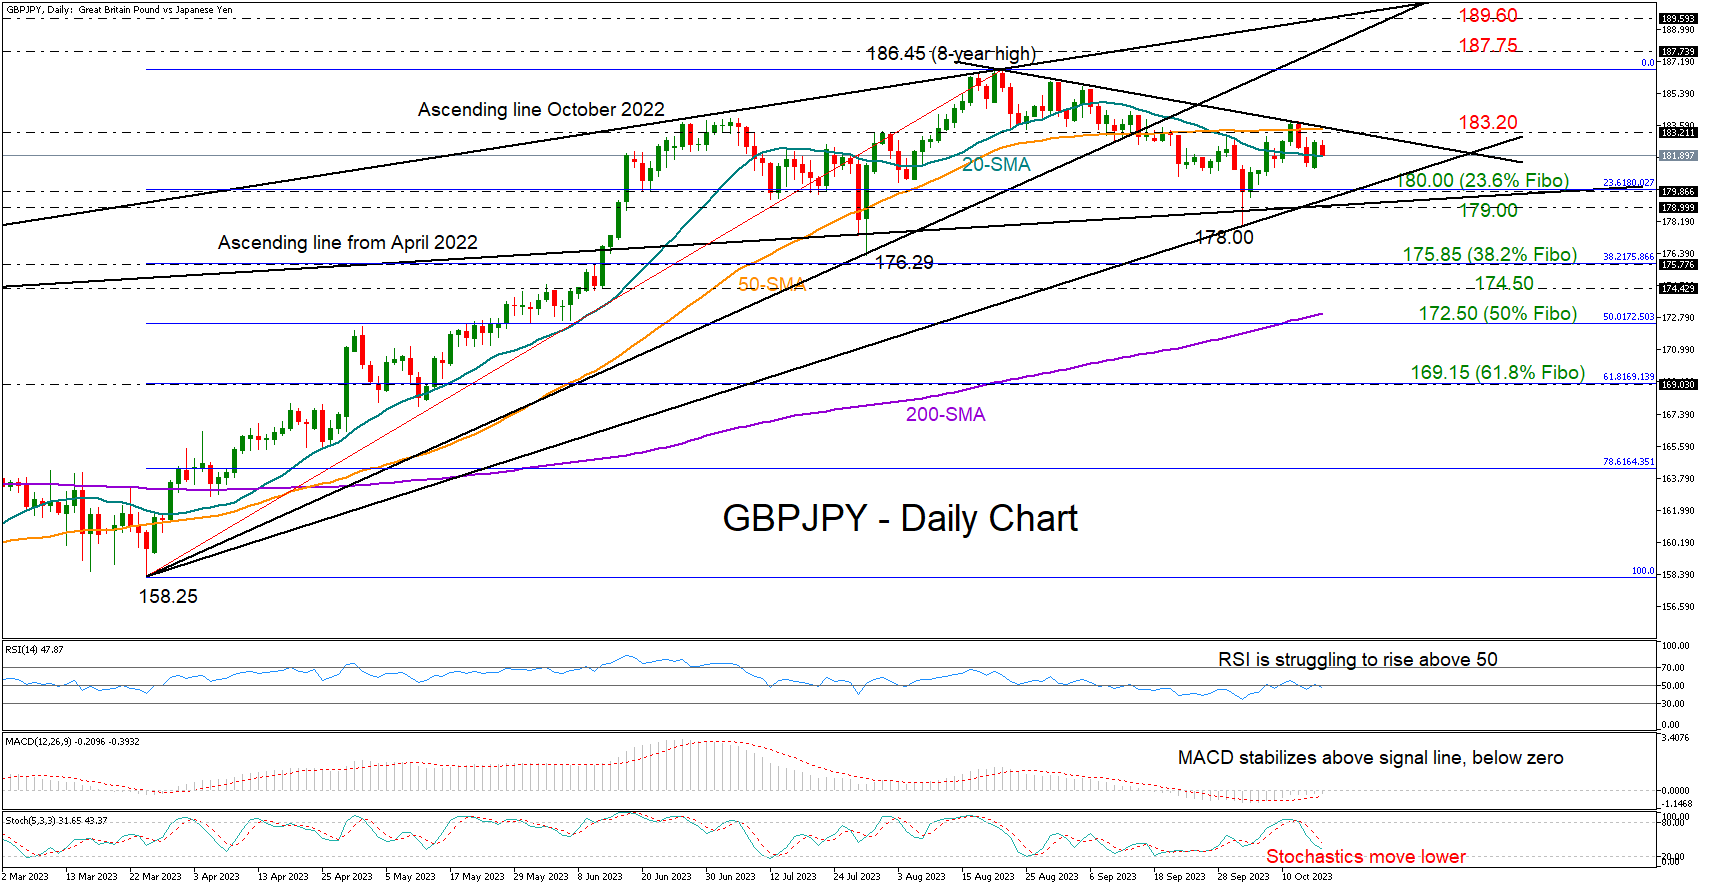
GBPJPY Powerless Near Key Border
GBPJPY has been steadily declining since its peak at 186.45, hitting a low of 178.00 earlier this month before rising back above 180.00.
The resistance trendline from August’s peak came to cancel last week’s bullish action at 183.80, with the technical indicators currently raising doubts as to whether the pair will find enough buyers to rotate higher again. The RSI is not making much progress around 50, and the stochastic oscillator is still going down. The MACD provides little hope for a rebound as well, as it’s losing steam despite fluctuating above its red signal line in the negative area.
In trend signals, the bearish cross within 20- and 50-day simple moving averages (SMAs) is clouding the short-term picture.
The base scenario is for sellers to stay on the sidelines until the price closes below the 179.00-180.00 support region, where the 23.6% Fibonacci retracement of the previous uptrend and two key constraining lines are positioned. If that bearish case unfolds, the price could seek shelter somewhere between the 38.2% Fibonacci level of 175.85 and the former barrier of 174.50 last seen in June. The 200-day simple moving average (SMA) and the 50% Fibonacci could next buffer downside forces near 172.50. A break below that floor would neutralize the medium-term picture, likely causing a freefall towards the 61.8% Fibonacci of 169.13.
Otherwise, the bulls could again fight the nearby resistance trendline and the 50-day SMA at 183.20. A victory there could see an exponential increase towards the eight-year high of 186.45 or slightly higher to 187.75. Yet, what could create new buying is a durable extension above the October 2022 ascending line at 189.60.
In short, GBPJPY is holding a neutral profile, trading below a resistance trendline at 183.20 and above the key support area of 179.00-180.00. A violation of one of those borders could direct the market accordingly.
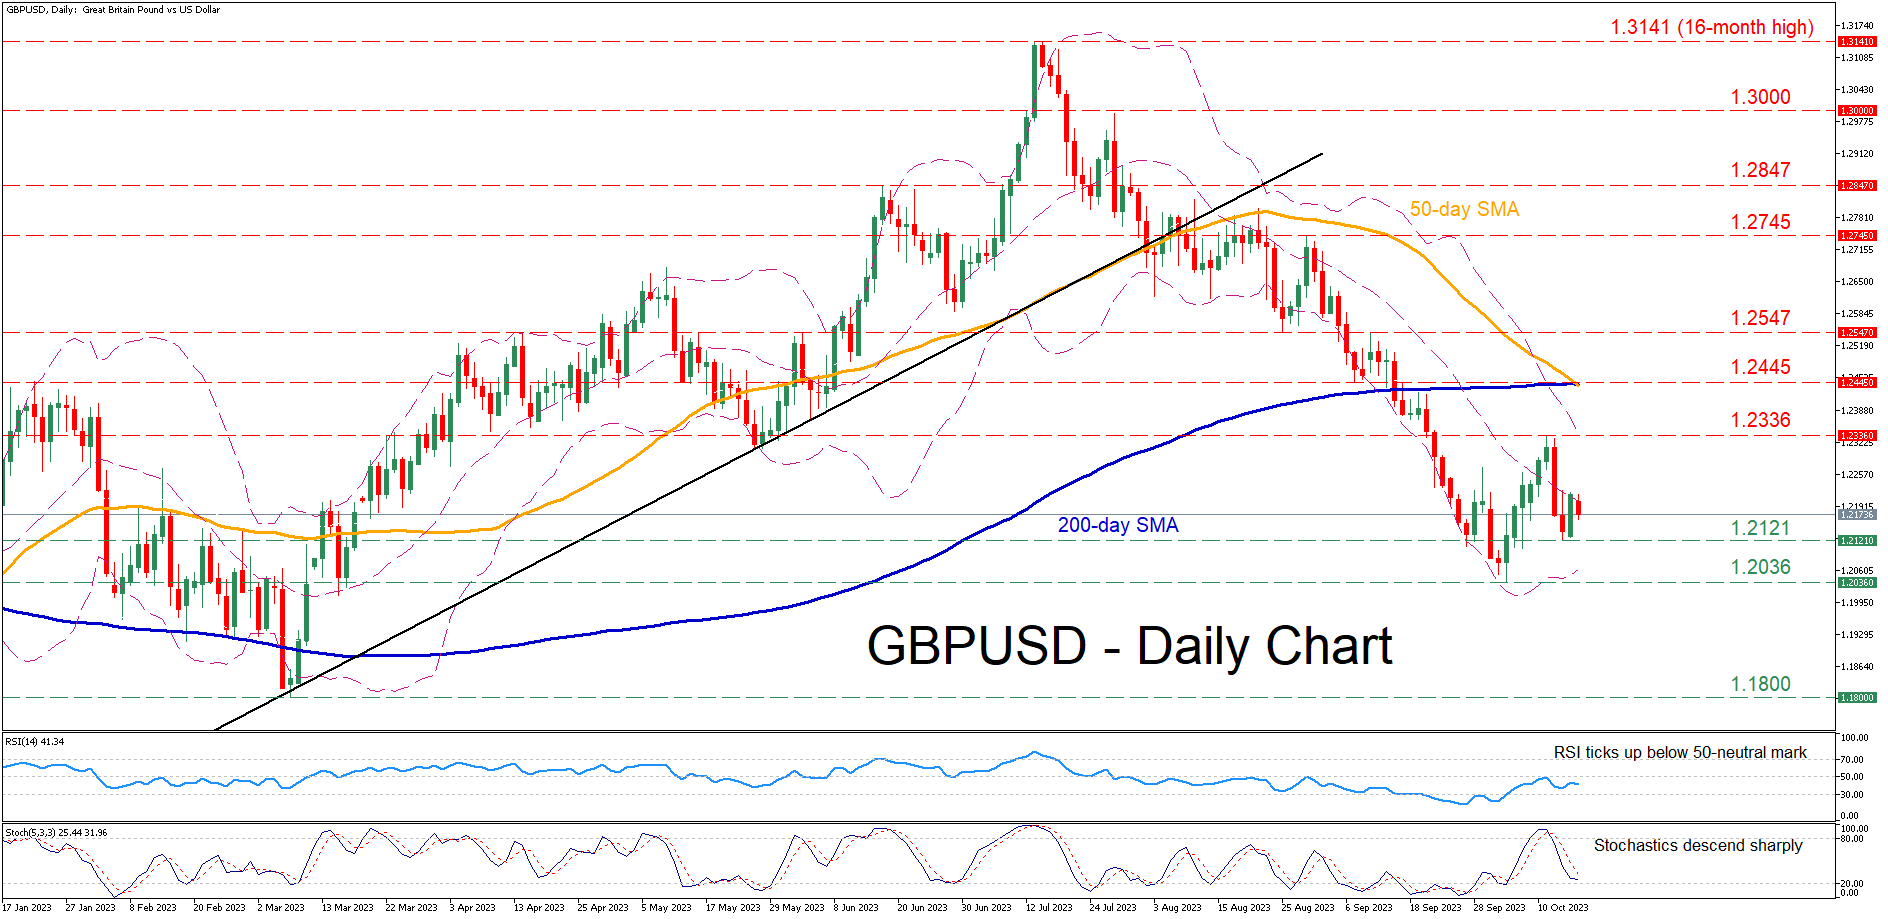
GBPUSD Struggling to Stage a Rebound
- GBPUSD stuck in a steep decline since mid-July
- Bounces off seven-month low but fails to post a moderate recovery
- Completion of death cross could induce downside pressures
GBPUSD has been forming a structure of lower highs and lower lows since its 16-month peak of 1.3141. Meanwhile, in the near term, both the RSI and the stochastic oscillator are tilted to the bearish side, shattering the bulls' hopes for a sustained rebound.
Should the downtrend resume, the price may initially face the recent support of 1.2121. A violation of that floor could pave the way for the seven-month bottom of 1.2036. Failing to halt there, the pair could descend towards the March low of 1.1800.
Alternatively, if the bulls re-emerge and push the price higher, the pair could ascend towards the recent rejection region of 1.2336. Breaking above that zone, the pair could test the December-January resistance zone of 1.2445, which coincides with both the 50- and 200-day simple moving averages (SMAs). Further advances might then cease at the April resistance of 1.2547 that also acted as support in August.
In brief, GBPUSD attempted to halt its relentless decline, but its rebound quickly faltered. Can the bulls strike back?
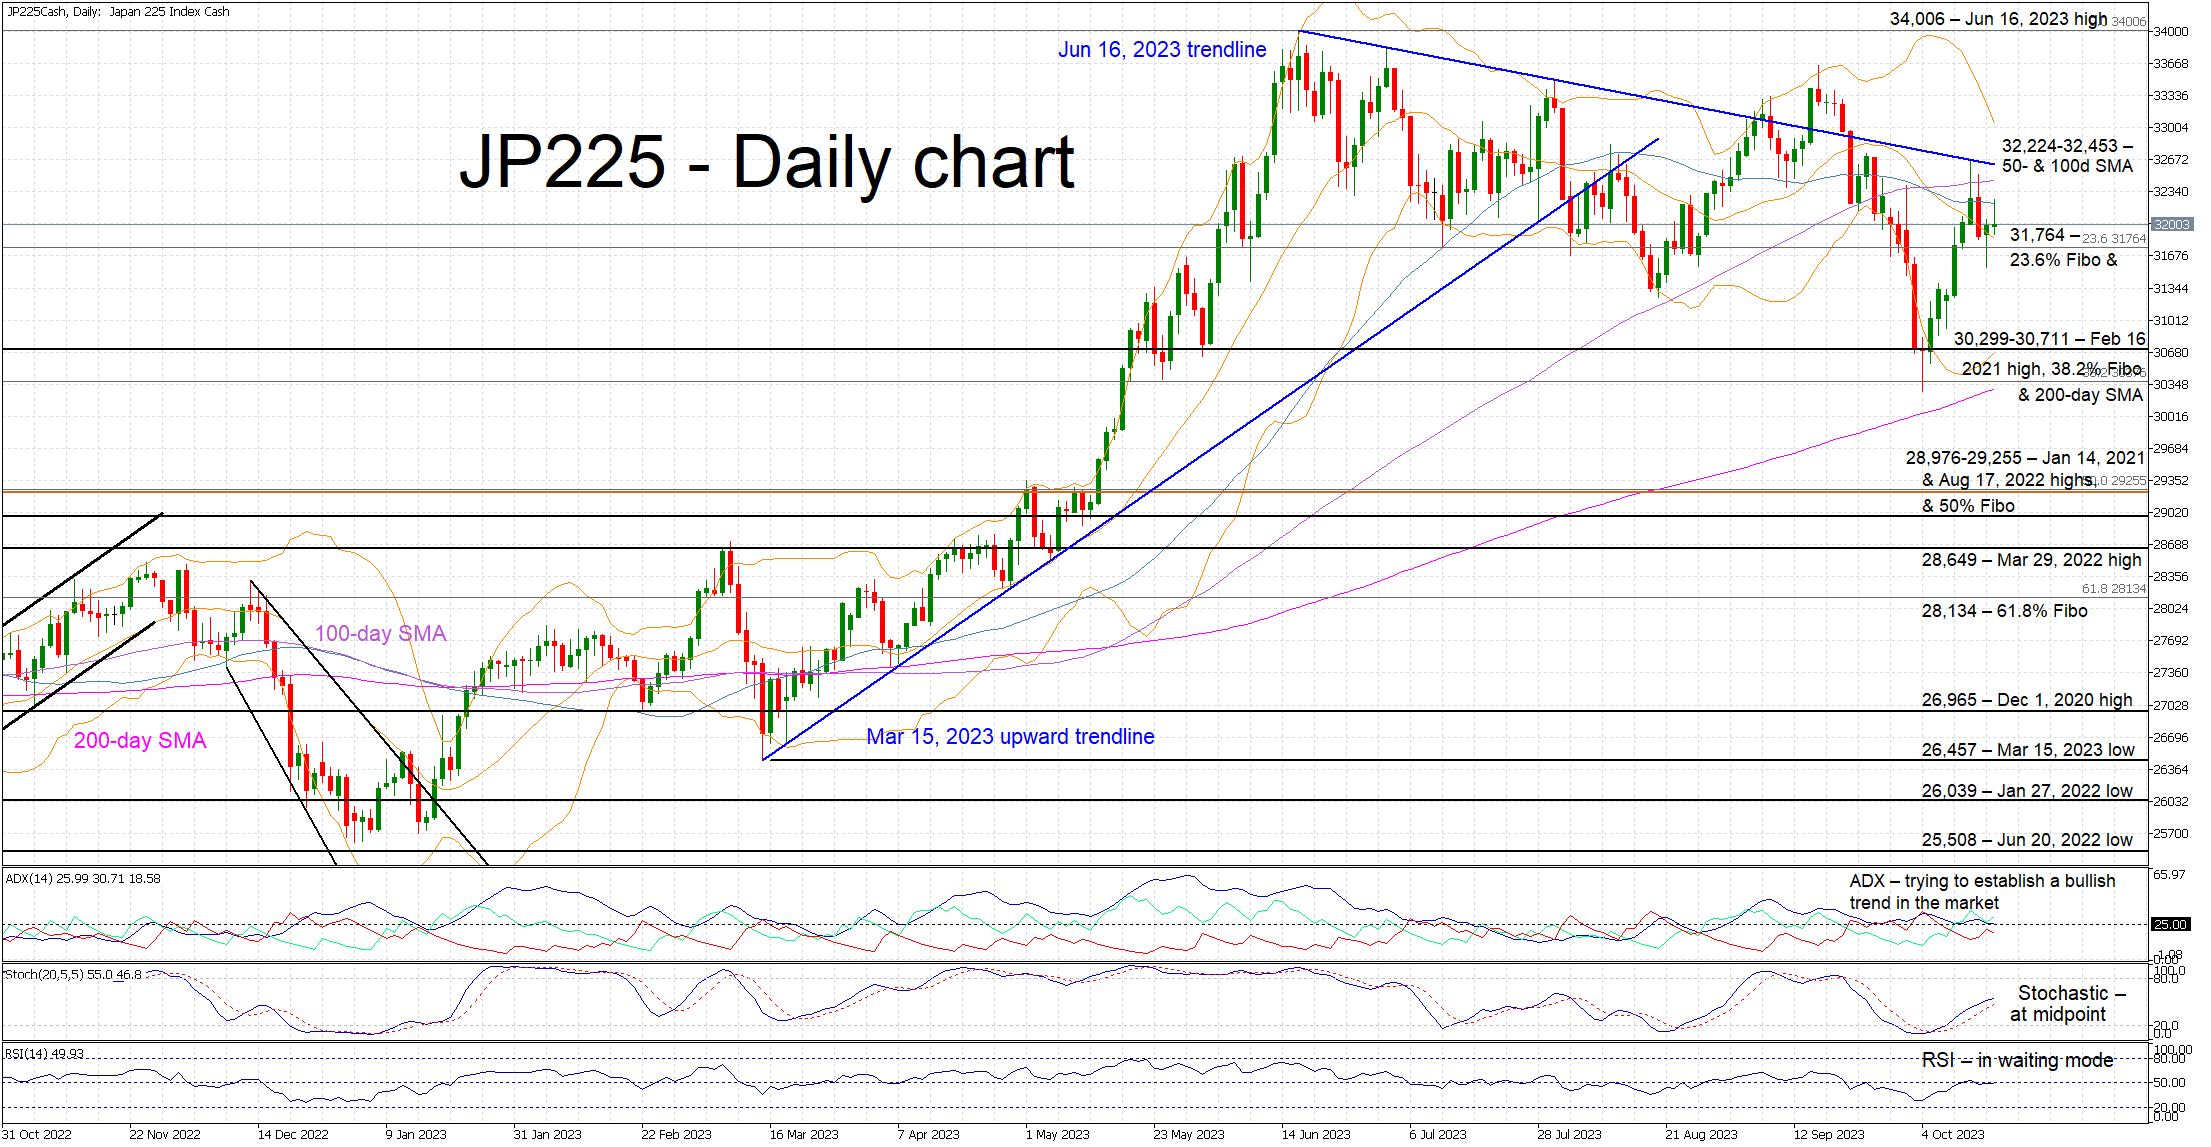
JP225 Cash Index Bulls’ Appetite Dented by External Factors
- JP225 cash index hovers below the 50-day SMA
- Geopolitical developments continue to affect sentiment
- Momentum indicators on the fence at this juncture
The JP225 cash index is trading higher today with the bulls interested in canceling out last Friday’s sizable red candle. It has been a strong short-term upleg from the October 4 low at 30,273, but the bulls need a new peak, above the September 15 high at 33,649, in order to stop the developing bearish pattern of lower lows and lower highs.
In the meantime, the momentum indicators are still undecided on the direction of the next leg in the JP225 index. The RSI is moving sideways, very close to its midpoint, and the Average Directional Movement Index (ADX) is trying to edge above its 25-threshold but the move lacks vigor. More interestingly, the stochastic oscillator jumped higher and above its moving average. However, it now appears to be slowing down, potentially reflecting that the current move higher might not have legs.
Should the bulls remain committed to continuing the rally, they would try to break above the 32,224-32,453 area, which is populated by the 50- and 100-day simple moving averages (SMAs), and the June 16, 2023 downward sloping trendline. If successful, they would then have the chance to make a higher high and potentially test the June 16, 2023 high at 34,006.
On the other hand, the bears are trying to build upon last Friday’s move. They could try to defend the June 16, 2023 trendline and then push the JP225 cash index below the 23.6% Fibonacci retracement level of the March 8, 2022 – June 16, 2023 uptrend at 31,764. Even lower, the busy 30.299-30,711 range could test the bears’ resolve again.
To sum up, the JP225 index bulls are trying to record a higher high but they are now facing a key resistance area without the support of the momentum indicators.
NASDAQ Futures Reacting From Equal Legs Area
In this technical blog, we will look at the past performance of the 1-hour Elliott Wave Charts of NASDAQ futures ticker symbol: $NQ_F. In which, the rally from 27 September 2023 low unfolded as a nest and showed a higher high sequence supported more upside. Therefore, we knew that the structure in NASDAQ is incomplete to the upside & should see more strength. So, we advised members to buy the dips in 3, 7, or 11 swings at the extreme areas. We will explain the structure & forecast below:
NASDAQ Futures 1-Hour Elliott Wave Chart From 10.13.2023
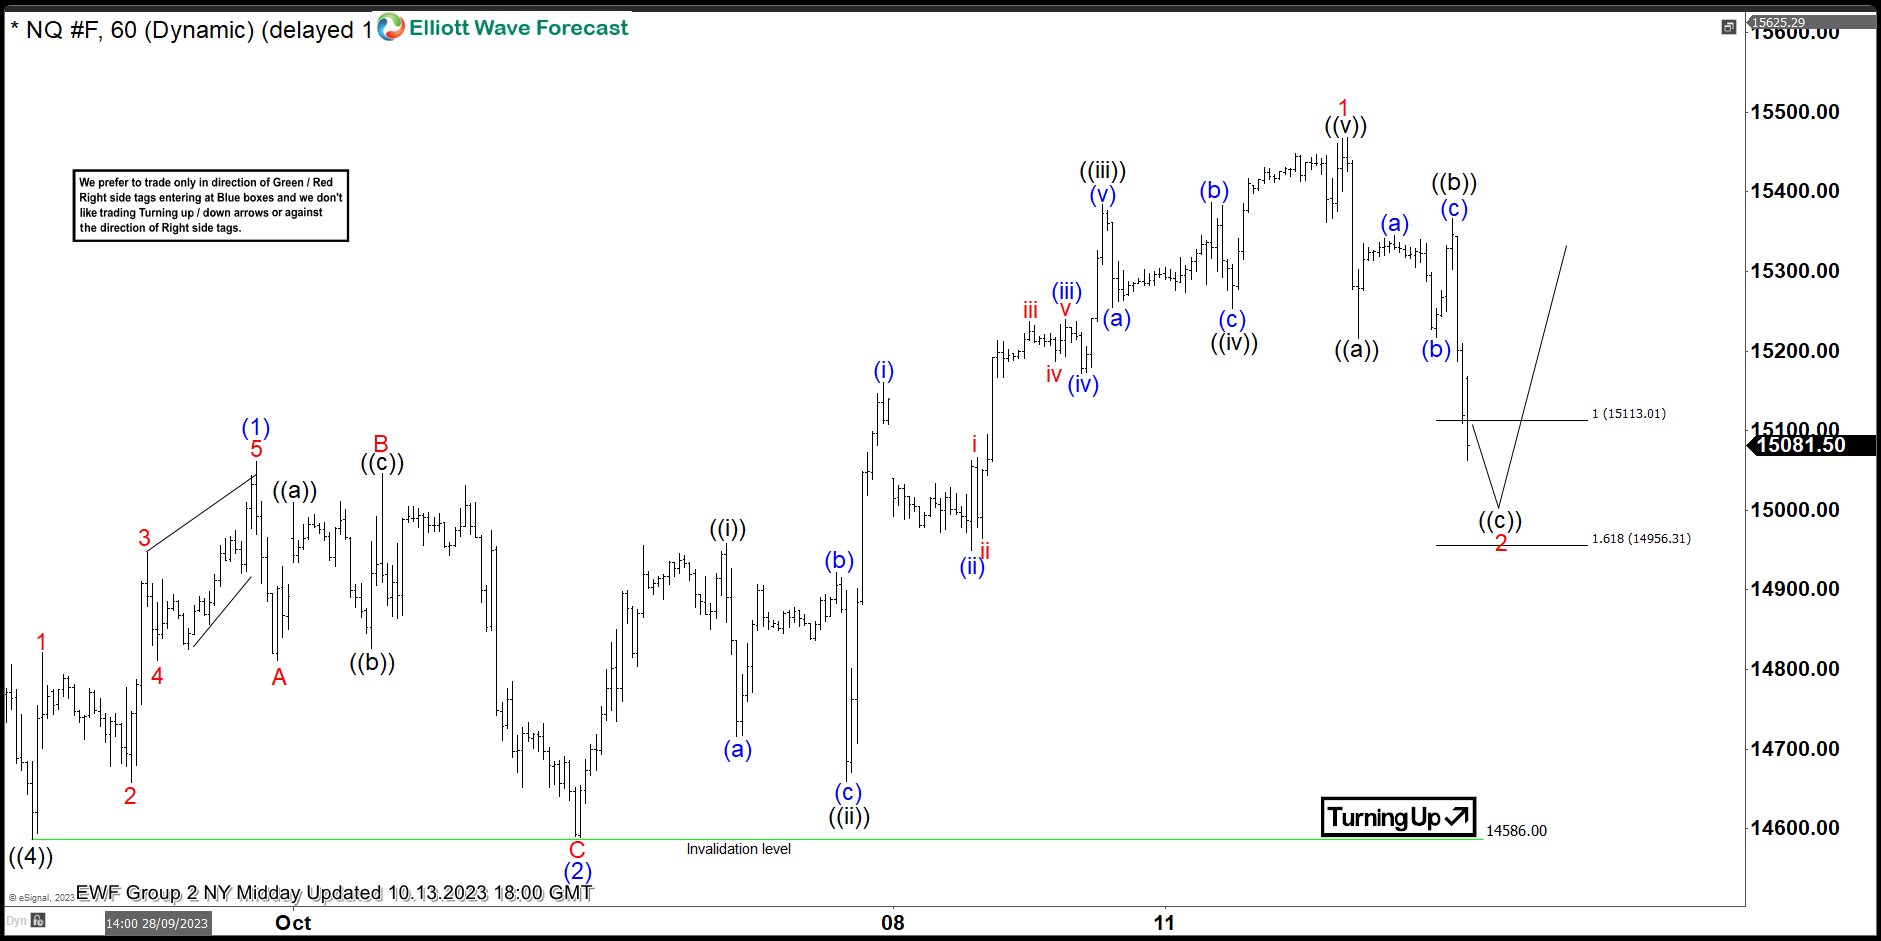
Above is the 1hr Elliott wave chart from the 10/13/2023 Midday update. In which, the rally from the 9/27/2023 low is unfolding as a nest favoring more upside. While the short-term cycle from 10/03/2023 low ended wave 1 at $15468.75 high in a lesser degree 5 waves impulse sequence. Down from there, the index made a pullback in wave 2 to correct that cycle. The internals of that pullback unfolded as a zigzag structure where wave ((a)) ended at $15216.25 low. Wave ((b)) bounce ended at $15366.75 high and wave ((c)) managed to reach the equal legs area of ((a))-((b)) at $15113.01- $14956.31. From there, buyers were expected to appear looking for the next leg higher ideally or for a minimum 3 wave bounce.
NASDAQ Futures Latest 1-Hour Elliott Wave Chart From 10.17.2023
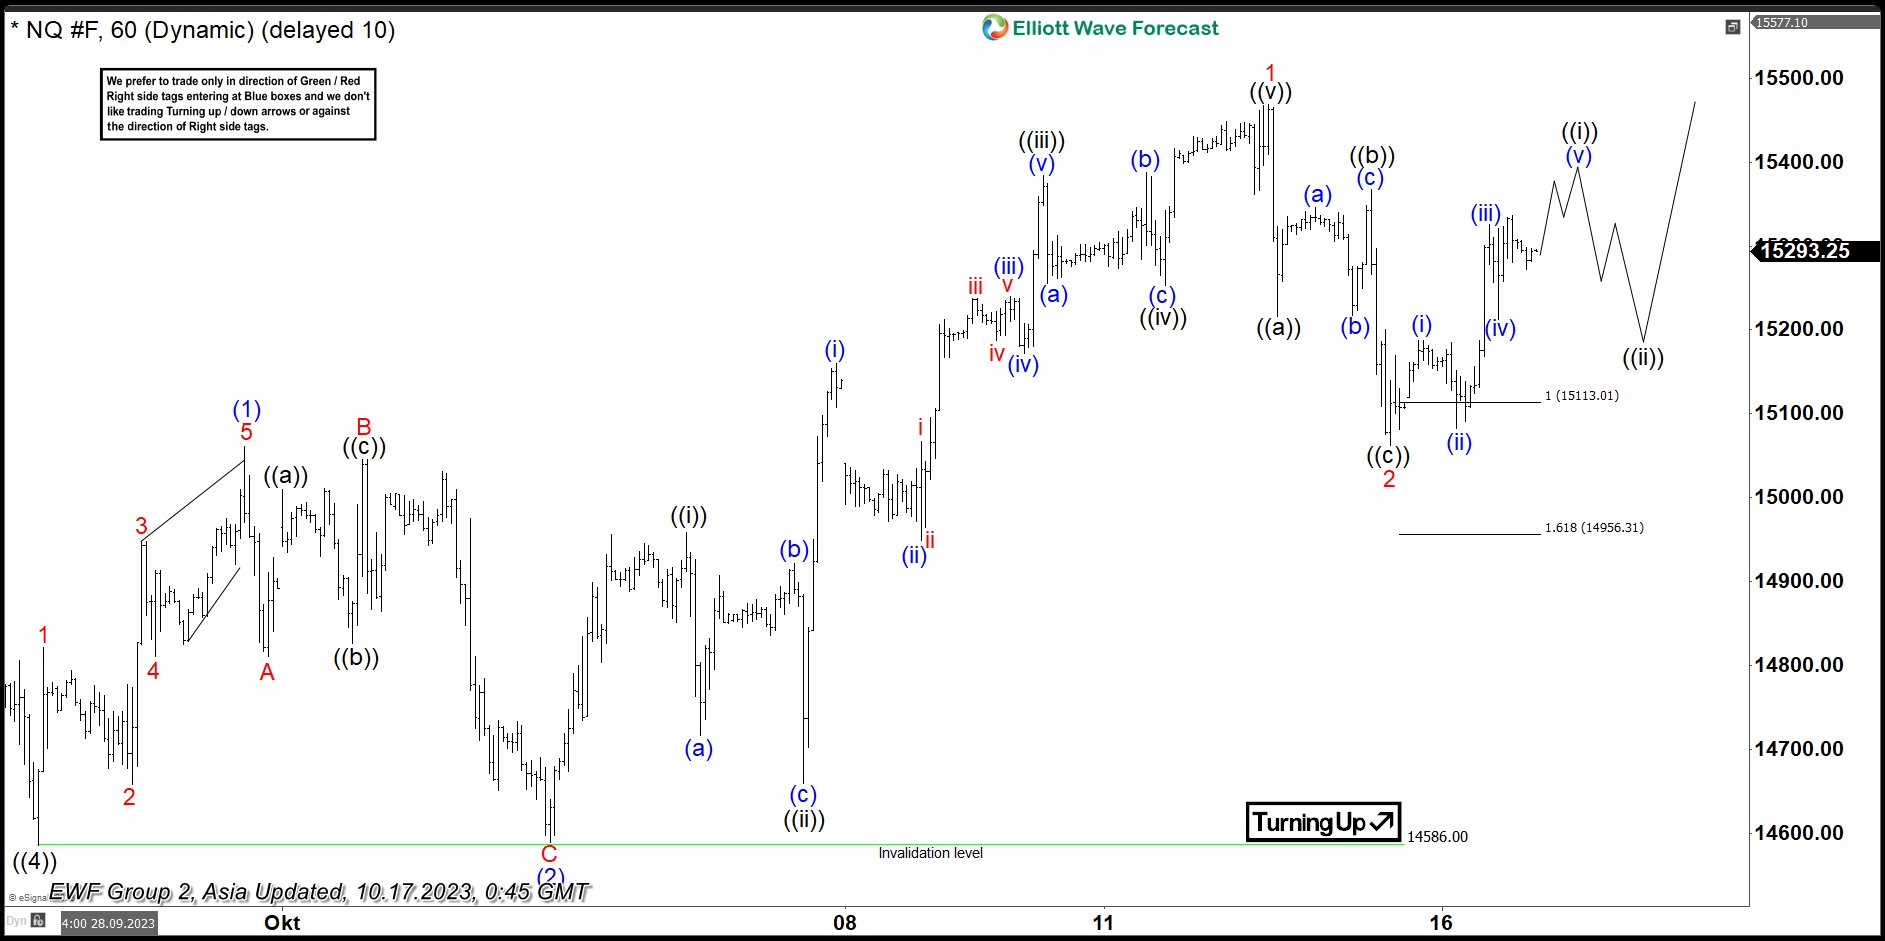
This is the Latest 1hr view from the 10/17/2023 Asia update. In which the index is showing a strong reaction higher taking place from the equal legs area allowing longs to get into a risk-free position shortly after taking the position. However, a break above $15468.75 high is still needed to confirm the next extension higher & avoid a double correction lower.