Sample Category Title
China’s Q3 GDP growth beats expectations; IMF cautions on future prospects
China's economy exhibited resilience in Q3, with GDP growing at 4.9% yoy, outpacing anticipated 4.5% yoy increase. However, this growth rate reflects deceleration from 6.3% yoy expansion observed in Q2. On quarterly basis, the economy grew 1.3% qoq, marking an improvement from revised 0.5% qoq in the preceding quarter and outpacing anticipated 1.0% qoq expansion.
Industrial output in September echoed the positive trend, registering a 4.5% yoy uptick, marginally above 4.3% yoy forecast. Retail sales also followed suit, with 5.5% yoy increase, surpassing expected 4.9% yoy rise. However, fixed asset investments underperformed expectations, with year-to-date growth of 3.1% yoy, slightly below anticipated 3.2%.
Despite these seemingly positive indicators, China's National Bureau of Statistics sounded a note of caution. The NBS underscored the challenges posed by a complicated external environment and lackluster domestic demand, calling for enhanced efforts to fortify the economic recovery's foundation.
Separately, International Monetary Fund adjusted its growth outlook for China downward, citing a "losing steam" recovery impacted significantly by the property sector's frailty. IMF now projects China's economy to grow by 5% in 2023 and 4.2% in 2024, a downward revision from its earlier forecast of 5.2% and 4.5% respectively.
The IMF's report highlighted contraction in manufacturing purchasing managers' indexes from April to August, coupled with additional weaknesses in real estate sector, as pivotal factors behind the revised forecast.
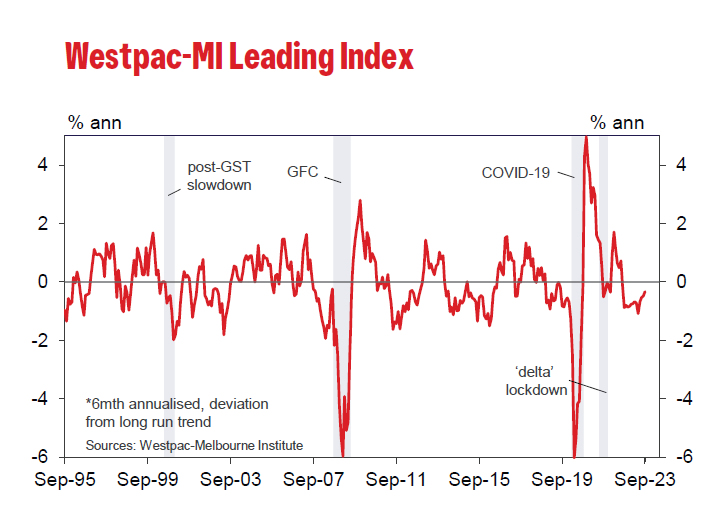
Australia’s Westpac Index reports fourteenth month in red, despite marginal improvement.
Australia's economic outlook remains subdued as indicated by the Westpac Leading Index, which, though it rose slightly from -0.48% to -0.34% in September, continues to signal prolonged weak conditions. Fourteen successive months of subzero readings on the headline index growth rate project that the anaemic sub-trend growth momentum is anticipated to linger into 2024.
Westpac anticipates the nation's GDP growth to decelerate to 1.2% in 2023, maintaining this tepid pace into the initial half of 2024, with an annualized growth rate pegged at 1.1%. This projection is notably beneath the expected population growth, which is projected to hover around 2.3%.
The recent minutes from RBA's October meeting shed light on the central bank's discomfort with the current inflationary environment, revealing its "low tolerance" towards unexpected inflationary spikes.
As the market casts its gaze towards the upcoming RBA meeting slated for November 7, Westpac anticipates revisions in the near-term forecasts for headline inflation. However, adjustments to the central bank's medium-term view, a critical determinant for any further rate hike, are not expected.
However, this anticipation hinges significantly on the unveiling of the September quarter CPI, scheduled for release on October 25. Any significant surprises in this data could recalibrate expectations and potentially prompt the RBA to rethink its stance.
RBA’s Bullock highlights sticky services inflation, housing and job market
RBA Governor Michele Bullock voiced concerns over stickiness in services inflation, rising house prices and tight labor market at an Australian Financial Security Authority event.
"We're seeing a slowdown in consumption," Bullock said, pointing out a decline in per capita consumption. This can be attributed to the central bank's policy measures, as indicated by her remark, "monetary policy is starting to bite." She elaborated that businesses were starting to find it hard to pass on cost increases as demand begins to taper.
However, the stickiness of inflation remains a significant concern. Bullock highlighted a stubborn rise in services inflation, which encompasses various sectors, from restaurants to hairdressers. "That inflation is running at a bit over 4 per cent," she noted, acknowledging it exceeds RBA’s target and mirrors inflationary trends observed globally.
Additionally, housing prices are on the rise again, coupled with a tight employment market, contributing to inflationary pressures. These economic elements, combined with external factors such as the Israel-Gaza conflict escalating fuel costs, suggest that inflation might remain a persistent issue.
Silver Wave Analysis
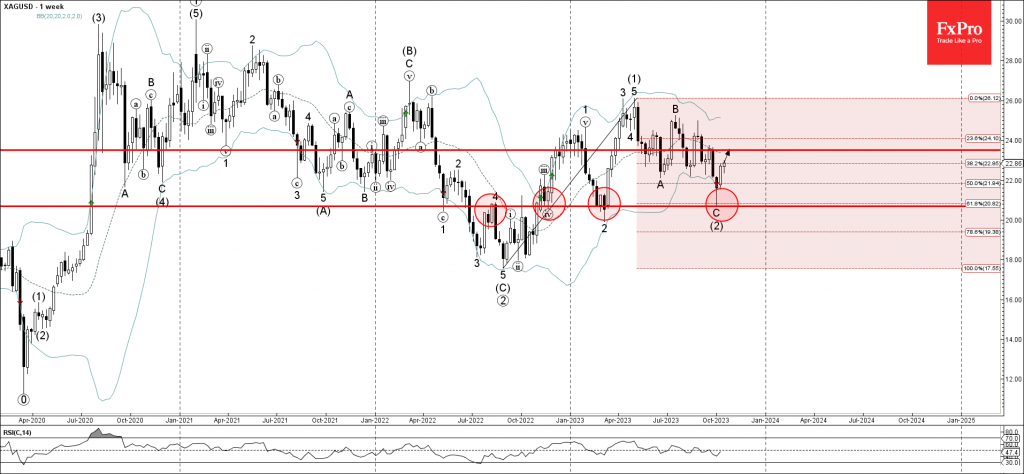
- Silver reversed from support level 20.70
- Likely to rise to resistance level 23.50
Silver recently reversed up with the weekly Hammer from the key support level 20.70 (which has been reversing the pair from the end of 2022 as can be seen below) intersecting with the 61.8% Fibonacci correction of the weekly uptrend from last year.
The upward reversal from the support level 20.70 stopped the previous intermediate ABC correction (2).
Given the strength of the support level 20.70, Silver can be expected to rise further toward the next resistance level 23.50.
EURCHF Wave Analysis
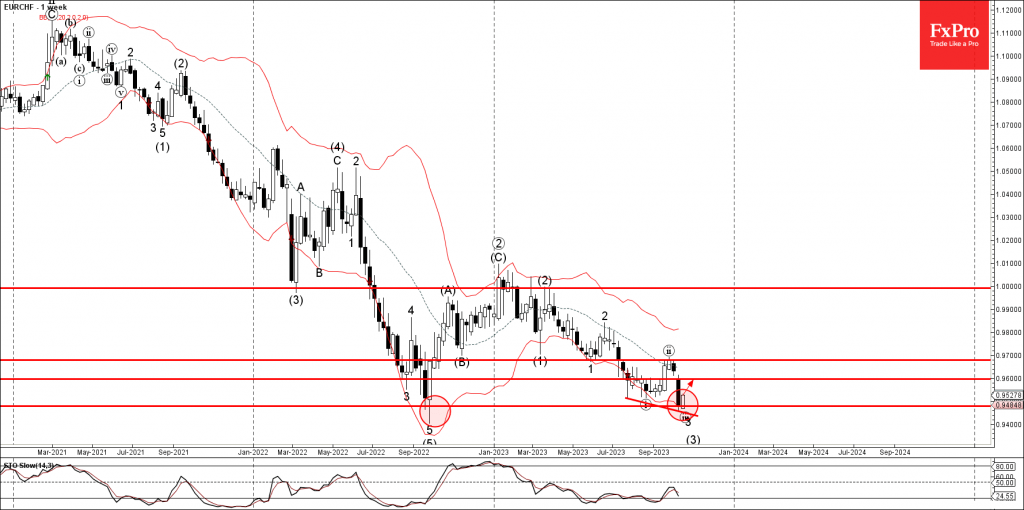
- EURCHF reversed from strong support level 0.9480
- Likely to rise to resistance level 0.9600
EURCHF currency pair recently reversed up from the strong support level 0.9480 (which stopped the weekly downtrend in 2022 as can be seen below) intersecting with the lower weekly Bollinger Band.
The upward reversal from the support level 0.9480 stopped the previous sharp downward impulse waves 3 and (3).
Given the bullish divergence on the weekly Stochastic, EURCHF can be expected to rise further toward the next resistance level 0.9600.
Light Crude Oil (CL) Shows 5 Swing Sequence Favoring More Upside
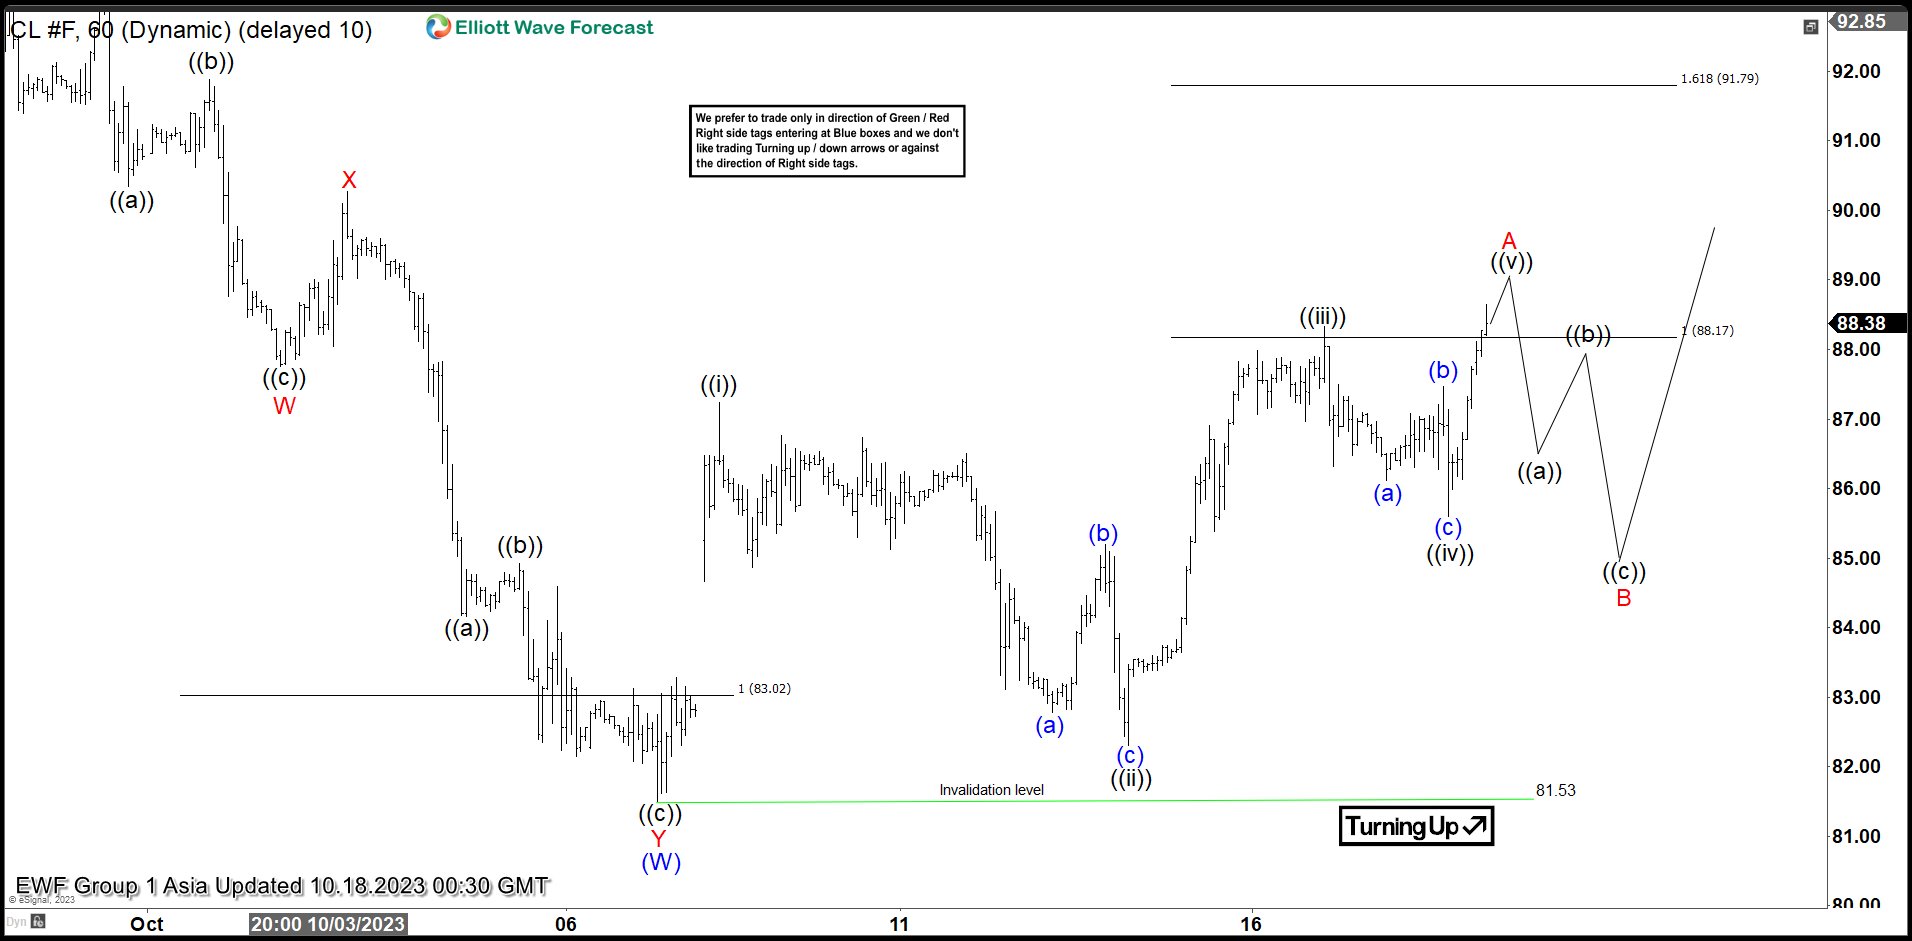
Short Term Elliott Wave in Light Crude Oil (CL) suggests the decline from 9.28.2023 high ended wave (W) at 81.53. Internal subdivision of (W) unfolded in a double three Elliott Wave structure. Down from 9.28.2023 high, wave ((a)) ended at 90.35 and wave ((b)) ended at 91.88. Wave ((c)) lower ended at 87.76 which completed wave W. Rally in wave X ended at 90.27. Oil then resumed lower in wave Y with internal subdivision as a zigzag. Down from wave X, wave ((a)) ended at 84.16 and wave ((b)) ended at 84.92. Final leg wave ((c)) ended at 81.50 which completed wave Y of (W).
Wave (Y) rally is now in progress as a zigzag Elliott Wave structure. Up from wave (W), wave ((i)) ended at 87.24 and wave ((ii)) dips ended at 82.31. Internal subdivision of wave ((ii)) unfolded in zigzag structure. Down from wave ((i)), wave (a) ended at 82.78 and wave (b) ended at 85.2. Wave (c) lower ended at 82.31 which completed wave ((ii)) in higher degree. The instrument then extended higher in wave ((iii)) towards 88.33 and pullback in wave ((iv)) ended at 85.60. Expect wave ((v)) to end soon which should complete wave A. Afterwards, Oil should pullback in wave B to correct cycle from 10.6.2023 low before it resumes higher. Near term, as far as pivot at 81.53 low stays intact, expect pullback to find support in 3, 7, or 11 swing for further upside.
Light Crude Oil (CL) 60 Minutes Elliott Wave Chart
CL Elliott Wave Video
https://www.youtube.com/watch?v=vBQSuikW4NQ
USD/CHF: Two-Year Yield Surges as Risks Grow to US Outlook
- Republican Jim Jordan does not have enough votes to be elected House speaker in the first round of floor voting.
- Risk aversion was the early trade as hot data fueled Fed rate hike bets
- Investors await key Chinese data that could alleviate global growth concerns
USD/CHF been a tough trade over the last week as geopolitical concerns initially sent safe haven flows towards the franc, but resilient economic data prevented risk aversion from running wild. The movement with Treasury yields are driving concerns that financial conditions are about to have a crippling impact on the economy. The 5-year yield rose to the highest levels since 2007. The 2-year Treasury yield also surged above the 5.22%, which is just below the current Fed’s Target range of 5.25%-5.50% .
The USD/CHF daily chart is showing prices tentatively breaking below the 200-day SMA and key support from the bullish trendline that has been in place since August. Wall Street has had a strong start to earnings season, but it seems traders are growing confident that a slowdown is here given how high rates are going. The risks to the US outlook are growing as the risk of more Fed rate hikes remains on the table and as Treasury market liquidity concerns remain a key focal point. If bearish momentum resumes, downside could the 0.8950 region.
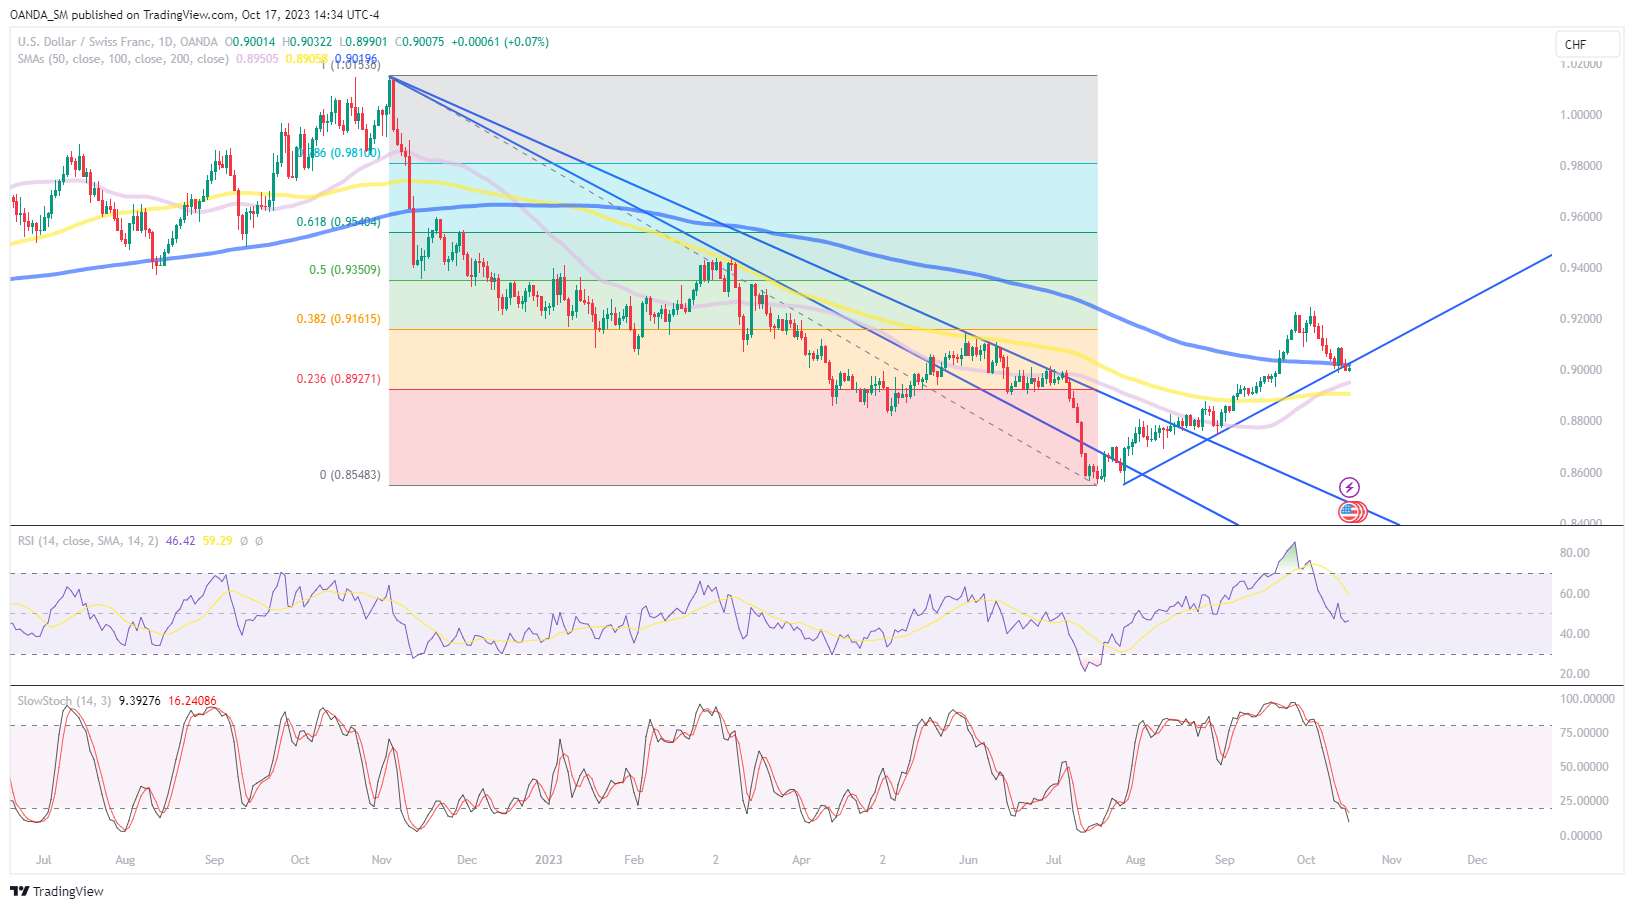
The rest of the week could see risk appetite attempt a comeback if Chinese data impresses. China will have the release of Q3 GDP and September activity data that could show their economic recovery is gaining traction. Too much Fed speak is on the calendar but traders will focus on Thursday’s appearance by Fed Chair Powell. The dollar may fall if he supports the stance that more time is needed to decide if more tightening is needed to tame inflation.
ECB Preview – Keeping a Tightening Bias with Optionality
Next week, ECB is widely set to be on hold in terms of policy rate changes for the first time since June last year. Since the September meeting, inflation and growth data have been broadly in line with expectations and taking into account the clear guidance from ECB, no changes should be expected at the upcoming meeting.
We expect Lagarde to acknowledge a discussion on advancing the PEPP reinvestments during the Q&A part of the press conference, thereby signalling a tightening bias, albeit with some optionality still in its communication.
Markets are pricing ECB policy rates largely unchanged for the coming six months, before a very slow and gradual rate cutting cycle commence from Q2 next year. Rate cuts of 89bp are being priced between April 2024 and April 2025.
GBP/USD Slips on Strong US Retail Sales
- GBP/USD down over half a percent
- US retail sales higher than expected
- UK inflation projected to decline on Wednesday
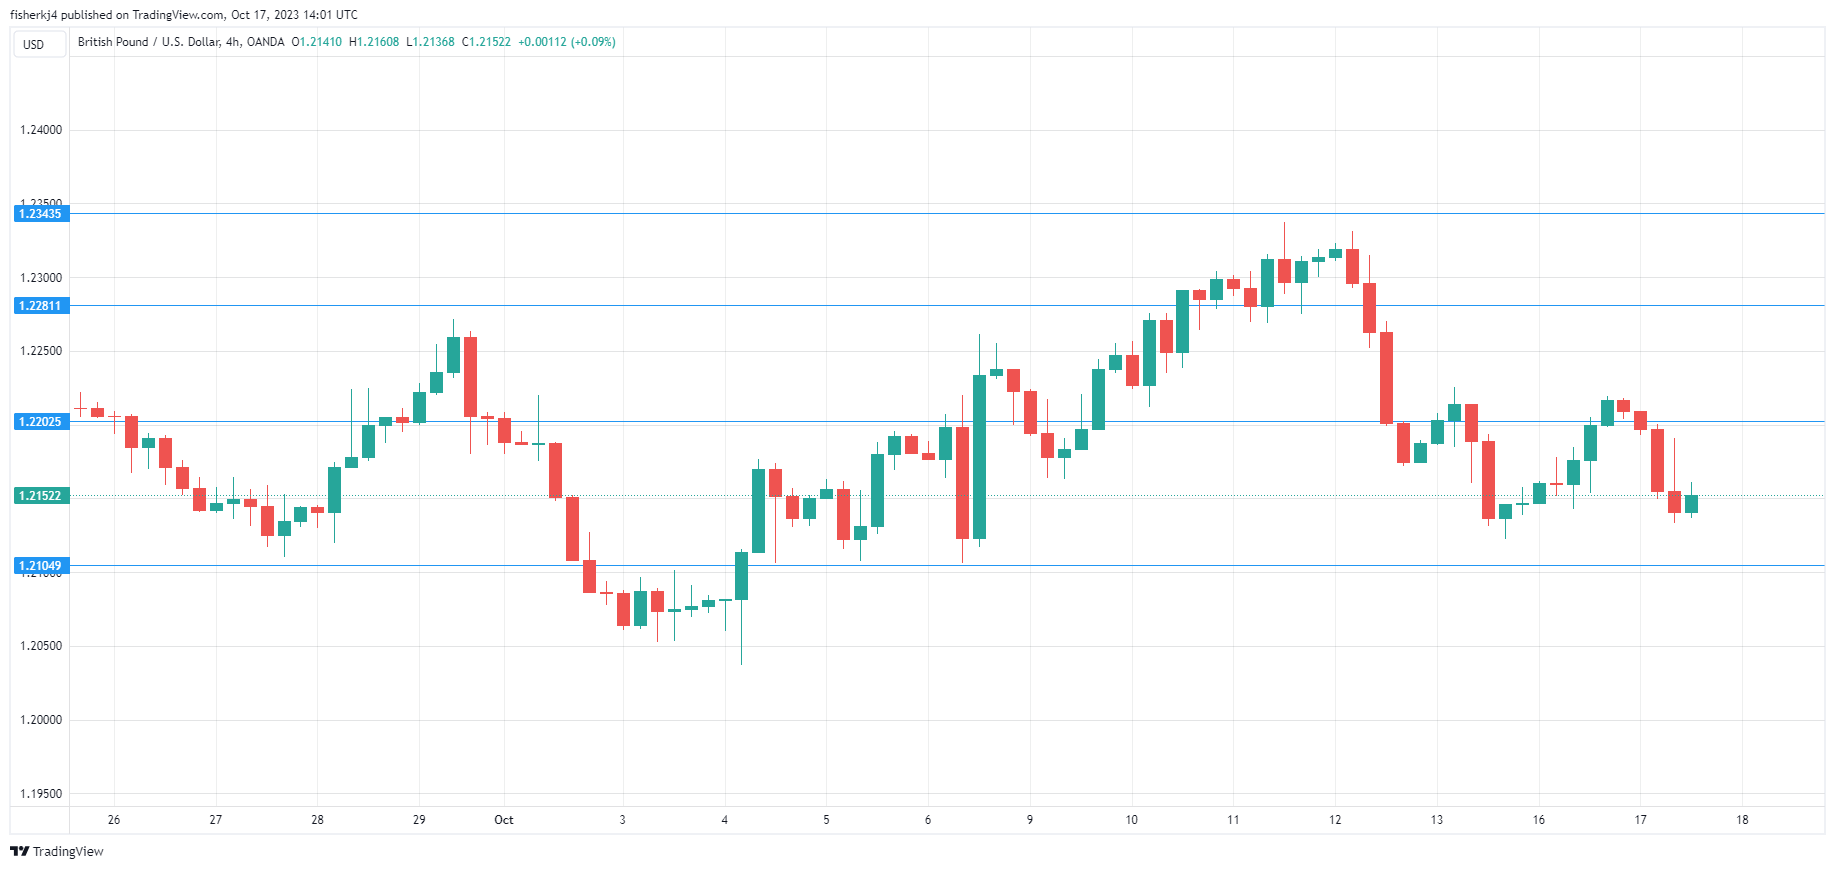
The British pound has declined 0.56% against the US dollar on Wednesday, wiping out yesterday’s gains. In the North American session, GBP/USD is trading at 1.2158, down 0.48%. The pound’s downswing was driven by a higher-than-expected US retail sales report.
US retail sales jump in September
Retail sales in the US surprised on the upside with a gain of 3.8% y/y in September. This beat the upwardly revised 2.9% rise in August and crushed the market estimate of 1.5%. On a monthly basis, retail sales rose 0.7%, compared to an upwardly revised 0.8% in August and well above the market estimate of 0.3%. Core retail sales, which exclude automobiles and gasoline, rose by 0.6% m/m, down from an upwardly revised 0.9% in August but easily beating the market estimate of 0.2%.
The better-than-expected retail sales report indicates that consumer spending remains robust despite the challenging economic picture, which includes high inflation and elevated borrowing costs. Consumer spending likely accelerated in the third quarter and that will be reflected in the consumer spending component of GDP.
The UK releases inflation on Wednesday. September CPI is expected to tick lower to 6.6% after a 6.7% reading in August. Inflation is at its lowest level since February 2022 but remains more than three times above the Bank of England’s 2% target. The core rate, which excludes food and energy is closely monitored by the BoE, is expected to dip to 6.0%, compared to 6.2% in August.
If inflation falls as expected or even further, it will provide support for the BoE to pause for a second straight time at the November 2nd meeting and the pound could react with losses. The Bank’s decision to hold rates at the October meeting was a narrow 5-4 vote and Governor Bailey said yesterday that he expected upcoming rate decisions to be tight as well.
GBP/USD Technical
- GBP/USD has pushed below support at 1.2202. Below, there is support at 1.2104
- There is resistance at 1.2281 and 1.2343