Sample Category Title
Sunset Market Commentary
Markets
UK Gilts outperform German Bunds and US Treasuries today in the wake of an incomplete labour market update. Today’s willingness to react says more about UK/BoE sentiment rather than about the actual data. Wages (ex-bonus) grew bang in line with expectations (7.8% y/y in the three months through August) while early September employment growth missed expectations by the smallest of margins (-11k vs +3k expected with a 7k downward revision to the August number). Daily changes on the UK yield curve range between -1 bp (2-yr) and +5 bps (30-yr). Sterling underperforms with EUR/GBP rising from 0.8640 to 0.8680 and closing in on the key 0.87 resistance area (July & September highs and 200d moving average). Today’s move suggests that anything bar a significant upward surprise in tomorrow’s CPI inflation figures could be sufficient to trigger a test and even a break above this technical resistance given the Bank of England’s tendency to err on the dovish side of the aisle. And if tomorrow’s inflation figures don’t do the trick, there’s still UK retail sales on Friday and the remainder of the labour market update next Tuesday. The BoE meets next on Nov. 2, when it has a new Monetary Policy Report at its disposal.
US Treasuries underperform following in the release of strong(er than expected) September US retail sales. The topline number rose by 0.7% M/M with the August reading being upwardly revised from 0.6% to 0.8%. The retail sales control group – proxy for consumption in GDP calculations and excluding food services, auto dealers, building materials stores and gasoline stations– surged by 0.6% M/M (vs 0.1% expected) and the August figure up at 0.2% from 0.1%. Strong retail sales add to the picture of resilient demand, a tight labour market (consensus-smashing September payrolls) and a disinflationary process proceeding as projected. Just looking at the numbers suggests that the Fed will conduct its final promised rate hike for this year at the November 1 meeting. Blurring this picture are comments that the recent (long term) yield increase substitutes for such a rate hike via tighter financial conditions. The jury remains out even as markets only attach around 10% probability to a November move. This chance rises to 50% by the first policy meeting of next year. Anyway, US yields were already on the rise and received an extra push in the back. They currently add 8.0 bps (2-yr) to 13 bps (10-yr). EUR/USD made an intra-day U-turn giving up small earlier gains to return to the 1.0550 area. The accelerating core bond sell-off leaves its traces on equity markets again, putting all hopes from the high-stakes Biden visit to Israel back to bed. Key European benchmarks suffer losses to the tune of 0.5%-1% with main US indices opening with a similar loss (S&P 500 0.7%, Nasdaq -1.1%).
News & Views
The BoJ is likely to discuss raising its inflation forecasts for the 2023 and 2024 fiscal years at its Oct 31 meeting. News company Bloomberg ran the story citing people familiar with the matter. The BoJ’s preferred gauge (CPI excluding fresh food) is seen closer to 3% for the current fiscal year (through March next year) then the 2.5% projected in July. For FY 2024 starting in April, the officials said the indicator could be adjusted to 2% or more vs 1.9% currently in the books. If that’s the case, it would mean the BoJ is expecting inflation at or above 2% for three consecutive years. But yen bulls better hold their horses still. The people said the 2025 FY forecast would probably remain unchanged around 1.6%, meaning the 2% target wouldn’t be hit sustainably just yet. The BoJ repeatedly tied this to wage growth increasing. USD/JPY briefly slipped to an intraday low of 148.84 before quickly paring losses again. The pair (149.75) is currently still flirting with the symbolically important 150 barrier.
Canadian prices unexpectedly decreased in September. Monthly inflation came in at -0.1%, down from 0.4% in August The yearly figure as a result fell from 4% to 3.8%. Core gauges also showed improvements, with the trimmed CPI easing more than expected from 3.9% to 3.7% and the median indicator dropping from 4.1% to 3.8%. The monthly slowdown was mainly driven by lower m/m prices for gasoline (-1.3%). Shelter eased from 0.8% to 0.5% and food prices for a second month straight dropped by 0.1%. In sector terms, prices of goods fell for the first time since December 2022 (-0.3%) while those for services flatlined. Today’s numbers offer some relief to the BoC. Markets scaled down bets for a 25 bps rate hike (to 5.25%) from 43% yesterday to 20%. USD/CAD rallies from 1.36 to 1.369.
EUR/GBP: Accelerates Higher on Brighter German Investor Morale and Weak UK Pay Growth Data
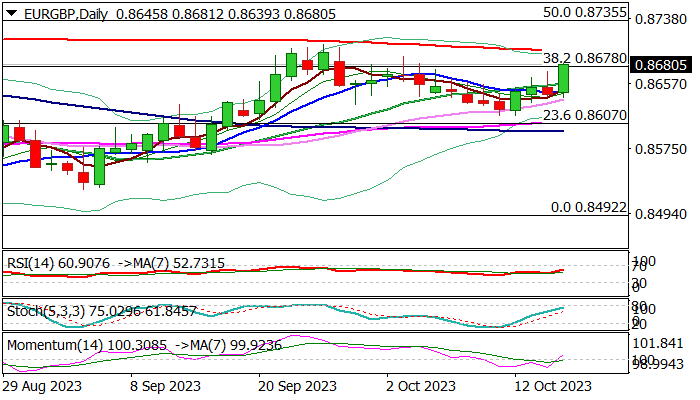
EURGBP jumped almost 0.4% in European session on Tuesday, as pound came under increased pressure on below forecast UK pay growth data, which further decreased bets for BoE rate hike in Nov 2 policy meeting.
On the other hand, German investor morale (ZEW report – Oct -1.1 vs Sep -11.4 and -9.3 f/c) improved well above expectations, providing strong boost to the single currency.
However, caution is still required as markets do not rule out possible stall of fresh advance, as economic situation in Germany remains fragile and economists expect further decline in inflation, which may negatively impact demand for Euro.
Improving conditions on daily chart (14-momentum broke into positive territory and MA’s turned to bullish setup) underpinning fresh advance, though bulls need clear break above cracked Fibo barrier at 0.8678 (38.2% of 0.8978/0.8492 descend, where recent attacks repeatedly failed to register firm break) to open way towards next key levels at 0.8697 (200 DMA) and 0.8705 (Sep 26 high).
Near-term bias is expected to remain with bulls while the action stays above rising 20DMA (0.8657).
Res: 0.8697; 0.8705; 0.8735; 0.8792.
Sup: 0.8657; 0.8639; 0.8616; 0.8607.
The Crypto Market Went Uphill
Market picture
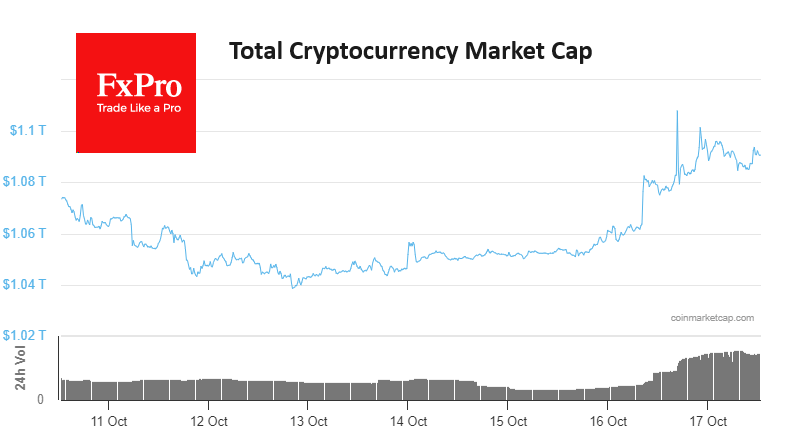
The crypto market cap rose 1.5% over the last 24 hours to $1.091 trillion. Yesterday, the market surged briefly on the false news of Bitcoin spot ETF approval. But interestingly, the ensuing market tide did not derail the short-term upward trend. That said, we continue to see continued elevated trading volumes. We view this as good news, given that the price is not high by historical standards. It is an influx of fresh buyers rather than an active exit from the market.
That said, buyer interest is concentrated around Bitcoin, whose share of total capitalisation is adding in territory above 50%. These are highs since April 2021. This is probably due to the special status of the first cryptocurrency that the SEC is willing to recognise as a commodity while not recognising the rest of the crypto as commodities. But it’s also possible that the remaining coins are under pressure due to reduced developer activity as funding has become more complex.
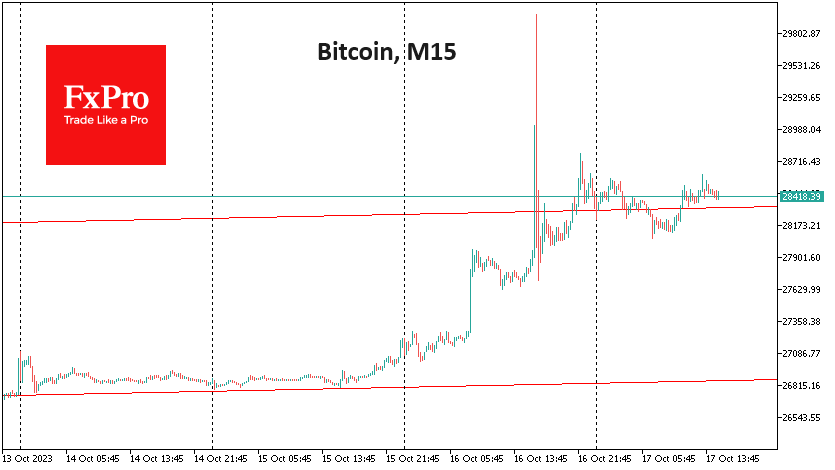
Bitcoin was bouncing towards $30K on Monday, starting at $27.2K. Although we did see a significant pullback, the Bears got busted. BTCUSD closed Monday’s trading above the 200-day average, with the intraday trend gaining momentum. Current positions near $28.5K indicate bullish dominance and confirm the existence of an upward channel since early September with a sequence of more than three higher highs and lows. The market could quickly move to the $29.4K level, recovering from the mid-August sell-off.
News background
According to CoinShares, investments in crypto funds increased by $15 million last week; the inflow of funds continues for the third week. Bitcoin investments were up $16 million, while Ethereum investments were down $7 million. Investments in funds allowing bitcoin shorts were up $1.7 million. Investments in Solana were up $3.7 million, again significantly outperforming all altcoins.
Grayscale Investments (GBTC) bitcoin trust’s discount to net asset value (NAV) narrowed to its lowest since December 2021 at 15.9%. The SEC will not appeal Grayscale’s lawsuit, potentially paving the way for spot ETFs to be approved in the country, CoinShares noted.
Ethereum miners (over 1,000 ETH) have reduced positions by 12 million ETH since the beginning of the year, while bitcoin miners (over 1,000 BTC) have accumulated coins, Cryptoslate noted. Since 2020, large investors have emptied their wallets by 20 million ETH. Swan has encountered many customers who want to exchange Ethereum for Bitcoin.
U.S. authorities have joined the ranks of the largest holders of Bitcoin. Thanks to several significant asset seizures related to the Bitfinex hack and the Silk Road platform, about 200k BTC has been deposited into US federal accounts.
U.S. Retail Sales Post Sixth Straight Month of Growth in September, Defying Expectations
Retail sales rose by 0.7% month-on-month (m/m) in September, down slightly from the upwardly revised 0.8% (previously 0.6%) reading in August. This was notably above the median consensus forecast calling for a more muted gain of 0.3%.
Trade in the auto sector strengthened on the month rising by 1.0% m/m, relative to a 0.4% m/m gain in August. This reflected growth in sales at both automotive parts and accessory stores, which rose 0.3% (erasing a -0.1% decline last month) and at motor vehicle dealers (up 1.1%).
Sales at gasoline stations was much more muted this month. Gas station sales were up 0.9% m/m relative to the 6.7% jump recorded in August. The deceleration largely reflects the pullback in gas prices. The building materials and equipment category declined by -0.2% m/m.
Sales in the retail sales "control group", which excludes the above volatile components (autos, building materials and gas) and is used to estimate personal consumption expenditures (PCE) came in at 0.6% m/m – this was significantly above consensus expectations which called for a flat reading. August's figure was also revised upwards to show an increase of 0.2% instead of the previously reported 0.1%.
- Among the control group, the largest contribution came from sales at miscellaneous stores retailers (+3.0% m/m), non-store retailers (+1.1% m/m) and health and personal care (+0.8% m/m).
- The main categories posting declines were clothing and accessories stores (-0.8% m/m) and furniture and electronics stores (-0.4% m/m).
Food services & drinking places – the only services category in the retail sales report – was up 0.9% m/m.
Key Implications
Despite mounting obstacles facing consumers, retail sales still managed to carve out a gain, finishing the third quarter in positive territory. Monthly sales rose at a relatively fast pace adding to similarly strong gains earlier in the quarter. Sales in the key control group also continued to defy the odds, rebounding from the relatively slower pace of growth in August. All said, with today's numbers, sales for the third quarter were strong at 6.9% annualized – significantly above the 0.4% annualized gain recorded in Q2.
Even so, the strong posting in Q3 retail spending is probably the last hurrah for consumers as growing pressures are likely to constrain spending in Q4. Falling but still above target inflation, tightening credit, resumption of student loan payments and even heightened economic uncertainty due to geopolitical tensions are all likely to weigh on consumers in the months ahead. As such, spending is expected to decelerate for the remainder of the year.
Canada: Inflation Surprises to the Downside, Cooling to 3.8% in September
Consumer price inflation edged down in September to 3.8% on a year-on-year (y/y) basis, down from 4.0% in August. In month-on-month terms, prices fell 0.1%. This month's print registered below consensus expectations.
Food prices continued to track lower, rising 5.8% y/y, led by slowdowns in meat and dairy products. The food component of the Consumer Price Index (CPI) basket has now been overtaken by shelter (+6.0%) as the fastest rising components on an annual basis.
Shelter inflation held flat in September at 6.0% y/y. An increase in rented accommodation (up to 7.1% from 6.4%), was offset by deceleration in owned accommodation (falling to 6.3% from 6.4%).
Gasoline prices retreated by 1.3% on a monthly basis, reversing the large 4.7% gain last month. Year-over-year, gasoline prices are up 7.5% at the national level in September, following a 0.8% increase in August. Notably, September's strong annual price print is buoyed by a soft reference period last year.
The transportation basket rose to 3.2% y/y. The gain was moderated by a substantial decline in air transportation (-21.1%), as airlines increased flight offerings over the last twelve months.
Prices for the purchases of new passenger vehicles (1.7% y/y) helped slow the pace of durable goods price gains, up only 0.4% y/y in September compared to 1.4% y/y in August.
The Bank of Canada's underlying inflation measures also took a step back in September. CPI-trim fell two-tenths to 3.7% y/y from 3.9% y/y in August and CPI-median dropped by three-tenths to 3.8% y/y from 4.1% y/y in August.
Inflation for core goods appears to be behind the deceleration in core inflation measures in September. Core goods inflation fell to 2.4% y/y from 2.9% in August.
Key Implications
Today's inflation print is another small step towards tackling the last leg of the inflation battle. Core inflation measures, in particular, taking a step back are a welcome development after heating up for consecutive months. On a three-month annualized basis, the CPI-trim and median core measures average fell from 4.3% to 3.7%.
Markets have significantly reduced their pricing of the probability of an interest rate hike at next week's meeting. Bond yields also slid by 8 basis points (bps) and 4 bps for the 2 and 10-year yield, respectively. With today's inflation print, the BoC is now equipped with all relevant data before making their policy decision next week. Alongside other measures that have shown momentum is cooling in Canada's economy, we see enough evidence for the BoC to stand on the sidelines next week, holding the policy rate at 5.00%.
EUR/USD Mid-Day Outlook
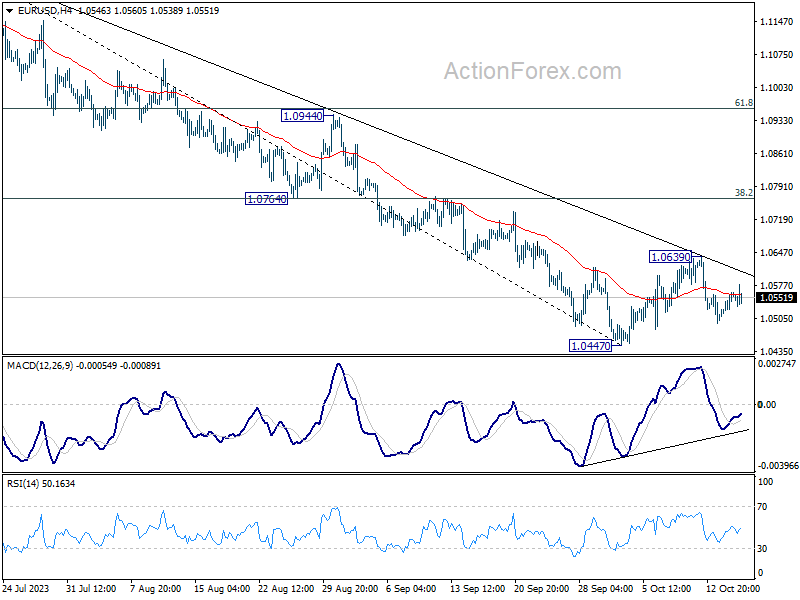
Daily Pivots: (S1) 1.0526; (P) 1.0544; (R1) 1.0578; More...
Intraday bias in EUR/USD stays neutral and outlook remains bearish with 1.0639 resistance intact. On the downside, firm break of 1.0447 will resume whole fall from 1.1274 and target 1.0199 fibonacci level. On the upside, however, break of 1.0639 will resume the rebound from 1.0447 to 55 D EMA (now at 1.0697).
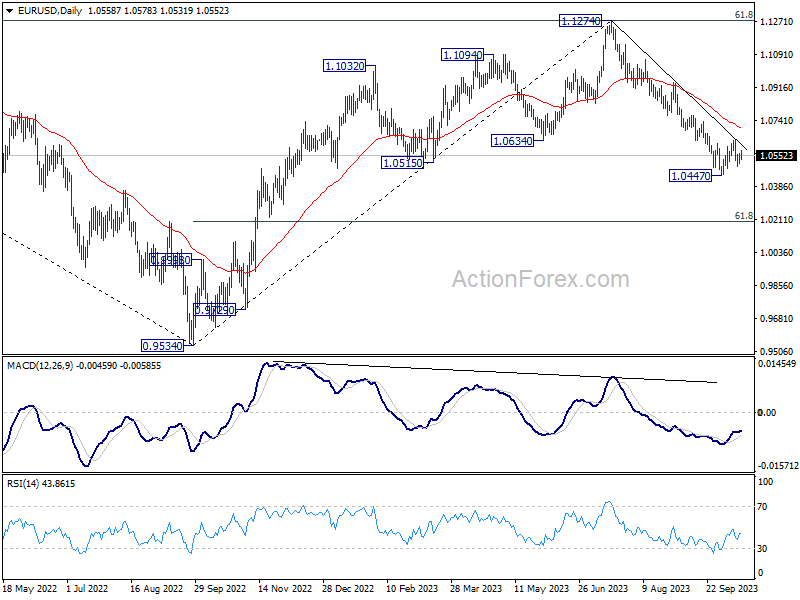
In the bigger picture, fall from 1.1274 medium term top could still be a correction to rise from 0.9534 (2022 low). But chance of a complete trend reversal is rising. In either case, current fall should target 61.8% retracement of 0.9534 to 1.1274 at 1.0199 next. For now, risk will stay on the downside as long as 55 D EMA (now at 1.0697) holds, in case of rebound.
GBP/USD Mid-Day Outlook
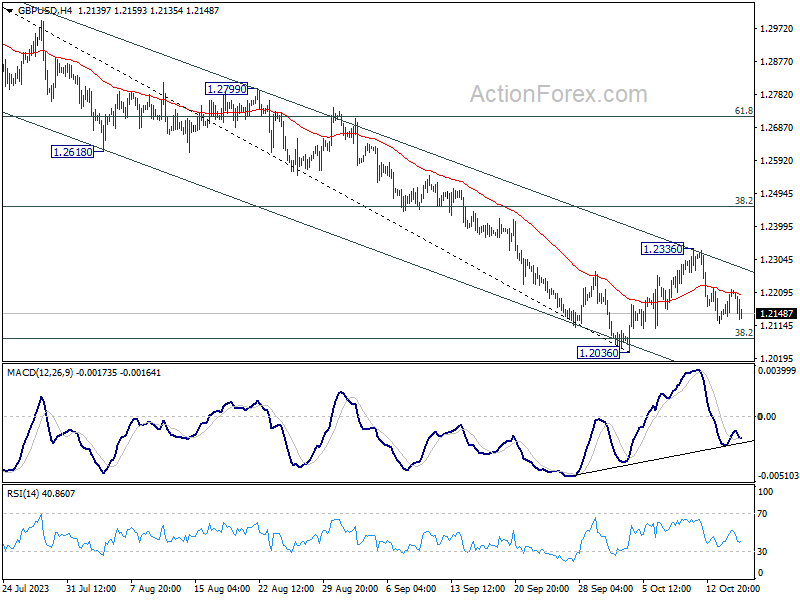
Daily Pivots: (S1) 1.2161; (P) 1.2190; (R1) 1.2247; More
Intraday bias in GBP/USD stays neutral and outlook remains bearish with 1.2336 resistance intact. On the downside, decisive break of 1.2036 will resume whole decline from 1.3141 for 1.1801 support next. However, break of 1.2336 will resume the rebound from 1.2036 to 55 D EMA (now at 1.2410).
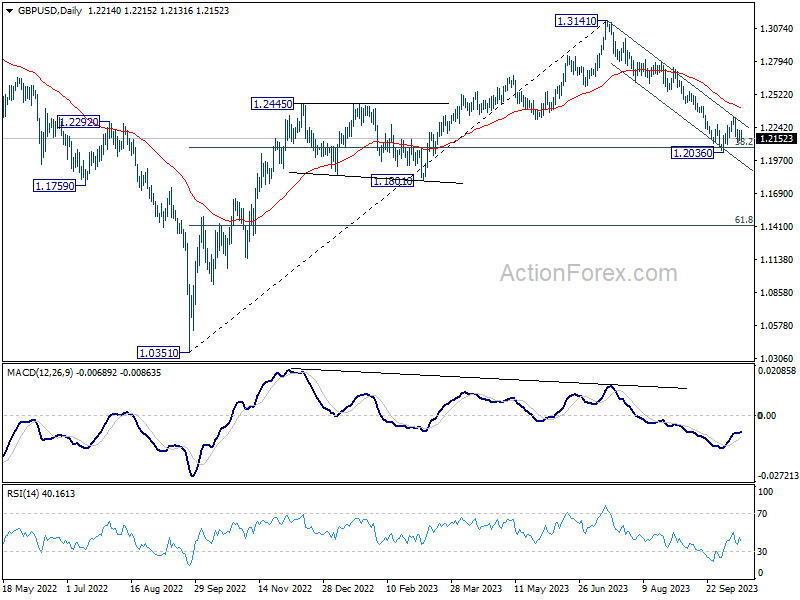
In the bigger picture, fall from 1.3141 medium term top could still be a correction to up trend from 1.0351 (2022 low) only. But risk of complete trend reversal is rising. Sustained break of 38.2% retracement of 1.0351 to 1.3141 at 1.2075 will pave the way to 61.8% retracement at 1.1417. For now, risk will stay on the downside as long as 55 D EMA (now at 1.2410) holds, in case of rebound.
USD/CHF Mid-Day Outlook
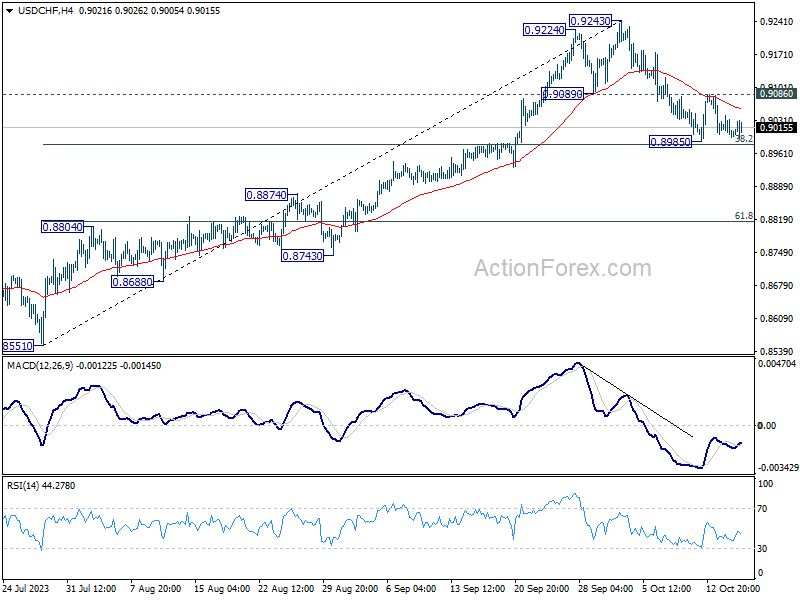
Daily Pivots: (S1) 0.8984; (P) 0.9014; (R1) 0.9031; More....
Intraday bias in USD/CHF remains neutral at this point. More sideway trading could be seen. On the upside, break of 0.9086 resistance will indicate that pull back from 0.9243 has completed, and turn bias to the upside for retesting this high. However, sustained break of 38.2% retracement of 0.8551 to 0.9243 at 0.8979 will argue that deeper fall is under way to 61.8% retracement at 0.8815.
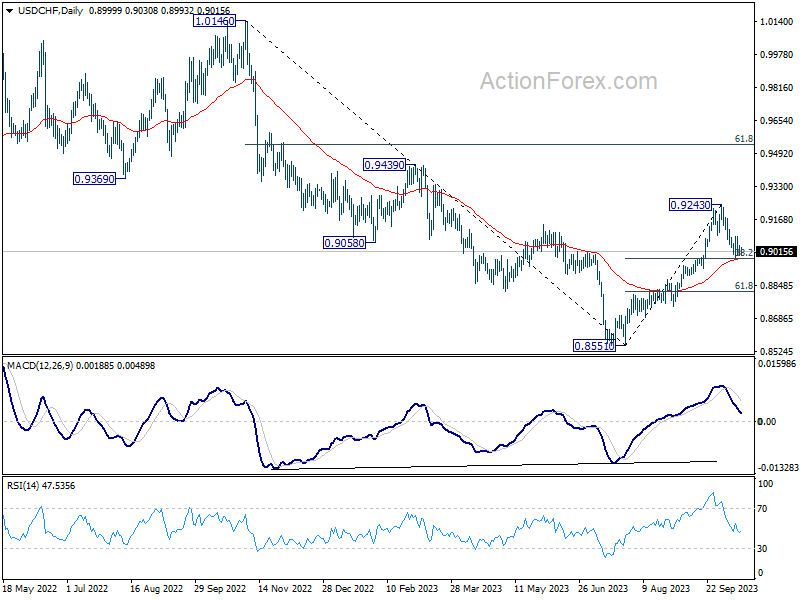
In the bigger picture, as long as 55 D EMA (now at 0.8976) holds rise from 0.8551 is viewed as reversing whole down trend from 1.0146 (2022 high). On resumption, further rise should be seen to 61.8% retracement of 1.0146 to 0.8551 at 0.9537 and above. However, sustained break of 55 D EMA will revive medium term bearishness, for retesting 0.8551 low at a later stage.
USD/JPY Mid-Day Outlook
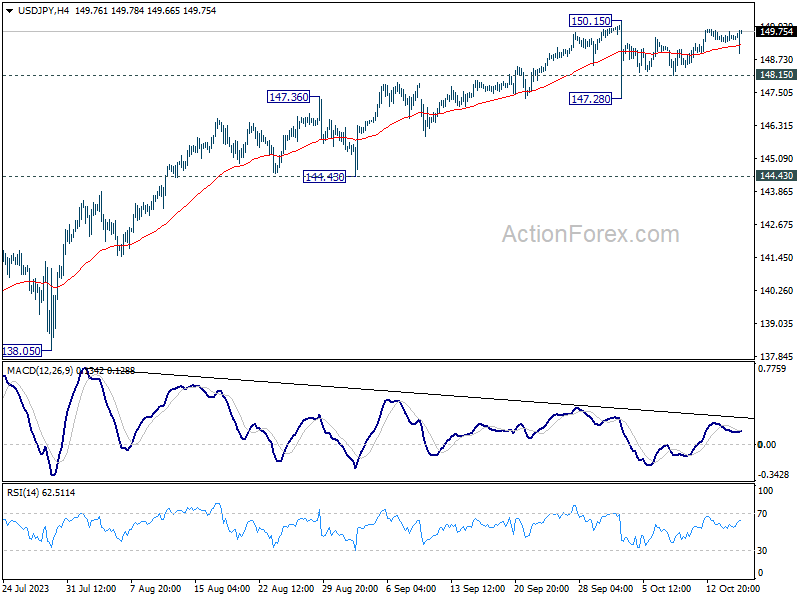
Daily Pivots: (S1) 149.33; (P) 149.54; (R1) 149.74; More...
Despite some volatility, USD/JPY is still staying in range below 150.15. Intraday bias remains neutral for the moment. On the downside, below 148.24 minor support will turn bias to the downside for another down leg through 147.28. On the upside, firm break of 150.15 will resume larger up trend to test 151.93 high.
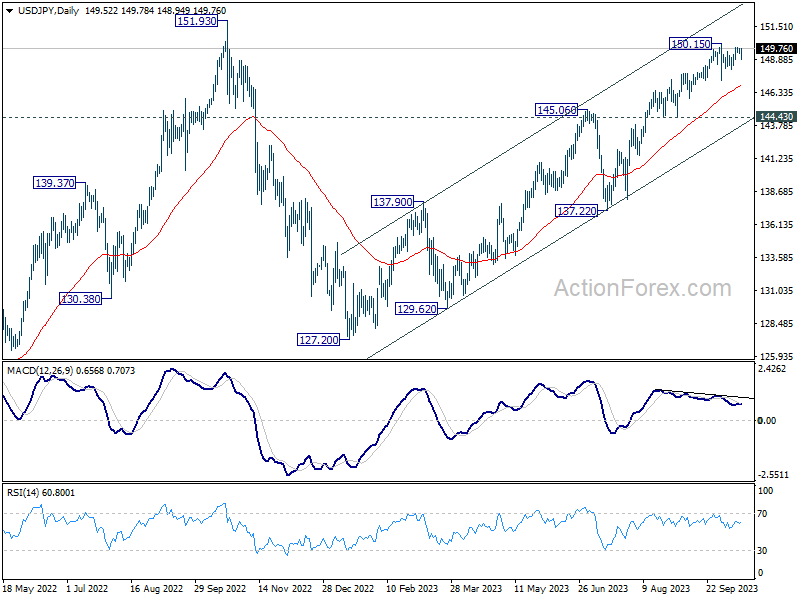
In the bigger picture, while rise from 127.20 is strong, it could still be seen as the second leg of the corrective pattern from 151.93 (2022 high). Rejection by 151.93, followed by sustained break of 145.06 resistance turned support will be the first sign that the third leg of the pattern has started. However, sustained break of 151.93 will confirm resumption of long term up trend.
USD/CAD Mid-Day Outlook
Daily Pivots: (S1) 1.3589; (P) 1.3627; (R1) 1.3648; More....
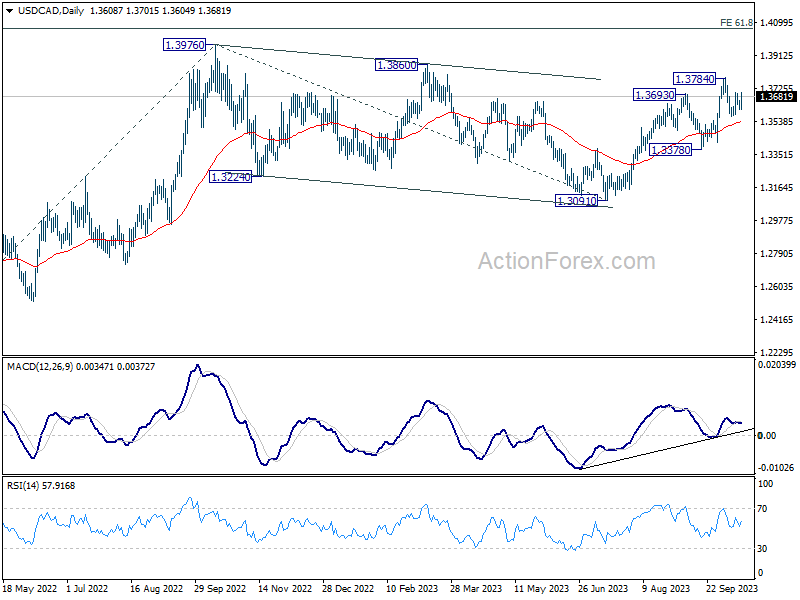
USD/CAD rebounds notably today and focus is back on 1.3699 resistance. Firm break there will target 1.3784 first. Break there will resume larger rise from 1.3091 to retest 1.3976 high. On the downside, below 1.3568 will bring another falling leg to extend the near term corrective pattern from 1.3784 instead.
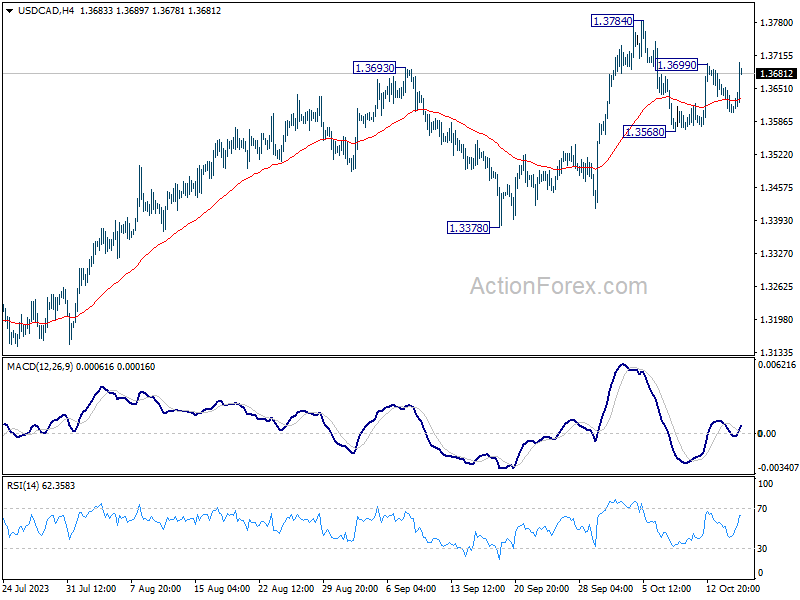
In the bigger picture, current development revives the case that corrective pattern from 1.3976 (2022 high) has completed with three waves down to 1.3091. Decisive break of 1.3976 high will confirm resumption of up trend from 1.2005 (2021 low). Next target will be 61.8% projection of 1.2401 to 1.3976 from 1.3091 at 1.4064. This will now remain the favored case as long as 1.3378 support holds.