

Sample Category Title
Eurozone PMI manufacturing finalized at 43.4, sub-50 reading persists for 15 months
September Eurozone PMI Manufacturing shows a persistent trend of contraction, finalizing at 43.4, a marginal decline from August's 43.5. This marks a continuous 15-month spell where the headline index has been below the 50.0 threshold, indicating contraction.
Excluding Greece, which barely recorded expansion with Manufacturing PMI of 50.3, every other country monitored in the survey showed downturns. A country-wise breakdown ranks Greece at the top, followed by Ireland (49.6), Spain (47.7), Italy (46.8), France (44.2), Netherlands (43.6), Austria (39.6), and Germany (39.6).
Cyrus de la Rubia, the Chief Economist at Hamburg Commercial Bank, painted a clear picture of the current manufacturing scenario. He stated, "We are feeling pretty certain that the recession in manufacturing continued during this period." He also added that a significant pickup might only materialize with the advent of the new year. However, he expressed optimism by highlighting the possibility of reaching the lowest point in the current economic cycle.
Drawing parallels with past recessions, de la Rubia remarked, "With the exception of the great recession in 2008/2009, output prices have never decreased at a pace faster than the current three-month average." He emphasized the rarity of such sharp falls and indicated the likelihood of a rebound.
France and Germany led the downturn, while Spain and Italy showed relative resilience. However, when viewed through the lens of ongoing slowdown duration, Italy emerged as the poorest performer. Its manufacturing sector has been in recession since the latter half of 2022, with Germany joining the downturn in the second quarter of the current year.
"Given our forecast that the global manufacturing sector is bottoming out, these countries may be spared from a downturn lasting longer than two quarters," de la Rubia added, hinting at a silver lining in the looming clouds of economic contraction.
XAG/USD Analysis: Silver Price Quickly Drops by Approximately 7.5%
On Friday, silver was trading at USD 23.5 per ounce, but on Monday morning it dropped below USD 21.7 – a difference of 7.5%.
Fundamental influencing factors are not clearly identified, but it can be assumed that the sharp drop was facilitated by:
→ the fact that a shutdown of US government agencies was avoided, since the authorities reached a budget agreement – albeit a temporary one;
→ high yield on bonds;
→ at the end of the Q3, the long-term portfolios of large market participants were rebalanced.
Factors could put pressure on gold (it also shows a negative trend, falling below USD 1,850 per ounce for the first time since March of this year), and more volatile silver rushed after gold.
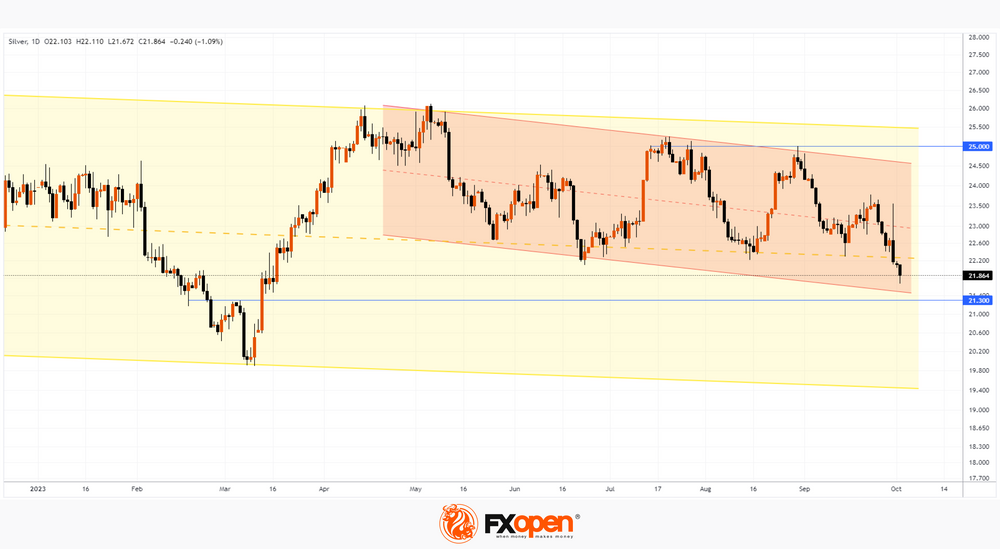
Technical analysis adds more information about the nature of the fall. In mid-July, we wrote that the price of gold had approached the upper limit of the long-term downward channel (shown in yellow), from which resistance could be expected.
However, the strength of demand was exhausted earlier, around the level of USD 25 per ounce, it turned out to be an unbearable barrier for the bulls, which is noticeable in the price action in July and August.
But what next?
Bearish arguments:
→ a long upper shadow on the Friday candle indicates strong selling pressure;
→ the price has dropped below the median line of the long-term yellow channel – now it can act as resistance (after serving as support in September);
→ resistance may also come from the median line of the red channel, where the psychological level of USD 23 per ounce also passes.
Bullish arguments:
→ the psychological level of USD 21 can provide support;
→ also in this area there is the lower border of the red channel;
→ after a sharp drop, the market looks oversold, and if sellers want to take profits, this should bring positivity to the price action.
This article represents the opinion of the Companies operating under the FXOpen brand only. It is not to be construed as an offer, solicitation, or recommendation with respect to products and services provided by the Companies operating under the FXOpen brand, nor is it to be considered financial advice.
GBP/USD Struggles While EUR/GBP Eyes Increase
GBP/USD is struggling below the 1.2235 resistance zone. EUR/GBP is rising and might climb above the 0.8675 resistance.
Important Takeaways for GBP/USD and EUR/GBP Analysis Today
- The British Pound is showing bearish signs below 1.2235 and 1.2270.
- There is a key bullish trend line forming with support near 1.2160 on the hourly chart of GBP/USD at FXOpen.
- EUR/GBP is rising and trading above the 0.8660 zone.
- There is a major bearish trend line forming with resistance near 0.8675 on the hourly chart at FXOpen.
GBP/USD Technical Analysis
On the hourly chart of GBP/USD at FXOpen, the pair attempted a fresh increase above 1.2235. However, the British Pound failed above 1.2270 and started a fresh decline against the US Dollar.
There was a clear move below the 1.2235 support and the 50-hour simple moving average. The pair even traded below the 50% Fib retracement level of the upward move from the 1.2110 swing low to the 1.2271 high.
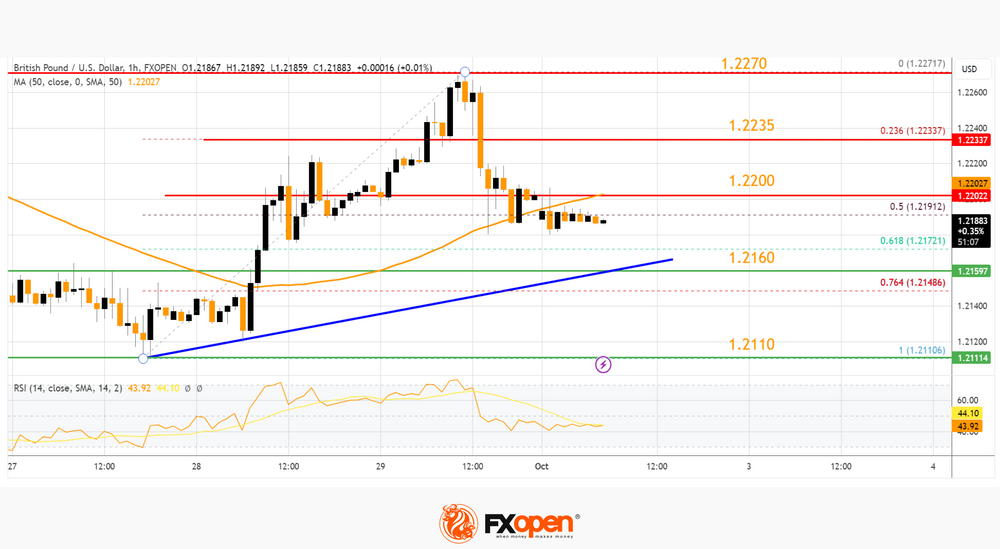
The pair is now showing bearish signs below 1.2200. On the downside, there is a key support forming near 1.2160 or the 76.4% Fib retracement level of the upward move from the 1.2110 swing low to the 1.2271 high.
There is also a key bullish trend line forming with support near 1.2160. If there is a downside break below the 1.2160 support, the pair could accelerate lower.
The next major support is near the 1.2110 zone, below which the pair could test 1.2050. Any more losses could lead the pair toward the 1.2000 support. On the upside, the GBP/USD chart indicates that the pair is facing resistance near the 50-hour simple moving average at 1.2200.
The next major resistance is near 1.2235. A close above the 1.2235 resistance zone could open the doors for a move toward 1.2270. Any more gains might send GBP/USD toward 1.2350.
EUR/GBP Technical Analysis
On the hourly chart of EUR/GBP at FXOpen, the pair started a steady increase from the 0.8630 zone. The Euro traded above the 0.8660 pivot level to enter a positive zone against the British Pound.
The EUR/GBP chart suggests that the pair settled above the 50-hour simple moving average and the 50% Fib retracement level of the last main decline from the 0.8705 swing high to the 0.8629 low. It is now eyeing more upsides.
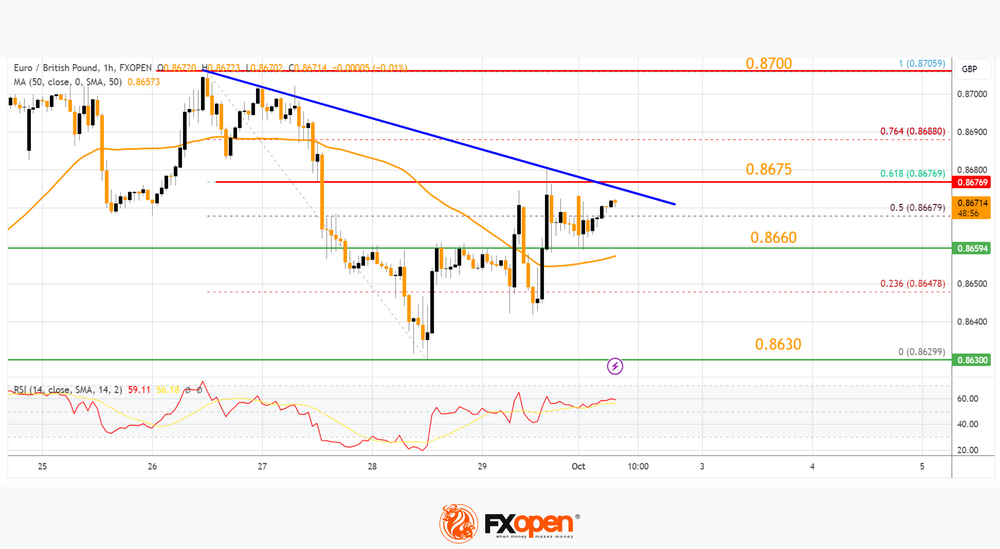
Immediate resistance is near a major bearish trend line at 0.8675. It coincides with the 61.8% Fib retracement level of the last main decline from the 0.8705 swing high to the 0.8629 low.
The next major resistance could be 0.8700. A close above the 0.8700 level might accelerate gains. In the stated case, the bulls may perhaps aim for a test of 0.8750. Any more gains might send the pair toward the 0.8800 level.
Immediate support sits near the 50-hour simple moving average at 0.8660. The next major support is near 0.8630. A downside break below the 0.8630 support might call for more downsides. In the stated case, the pair could drop toward the 0.8600 support level.
This article represents the opinion of the Companies operating under the FXOpen brand only. It is not to be construed as an offer, solicitation, or recommendation with respect to products and services provided by the Companies operating under the FXOpen brand, nor is it to be considered financial advice.
US 500 Cash Index Trades a Tad Above a 2-month Low
- The US 500 cash index is moving sideways again today
- The index bounced off the October 13, 2022 trendline
- The momentum indicators could signal a reversal soon
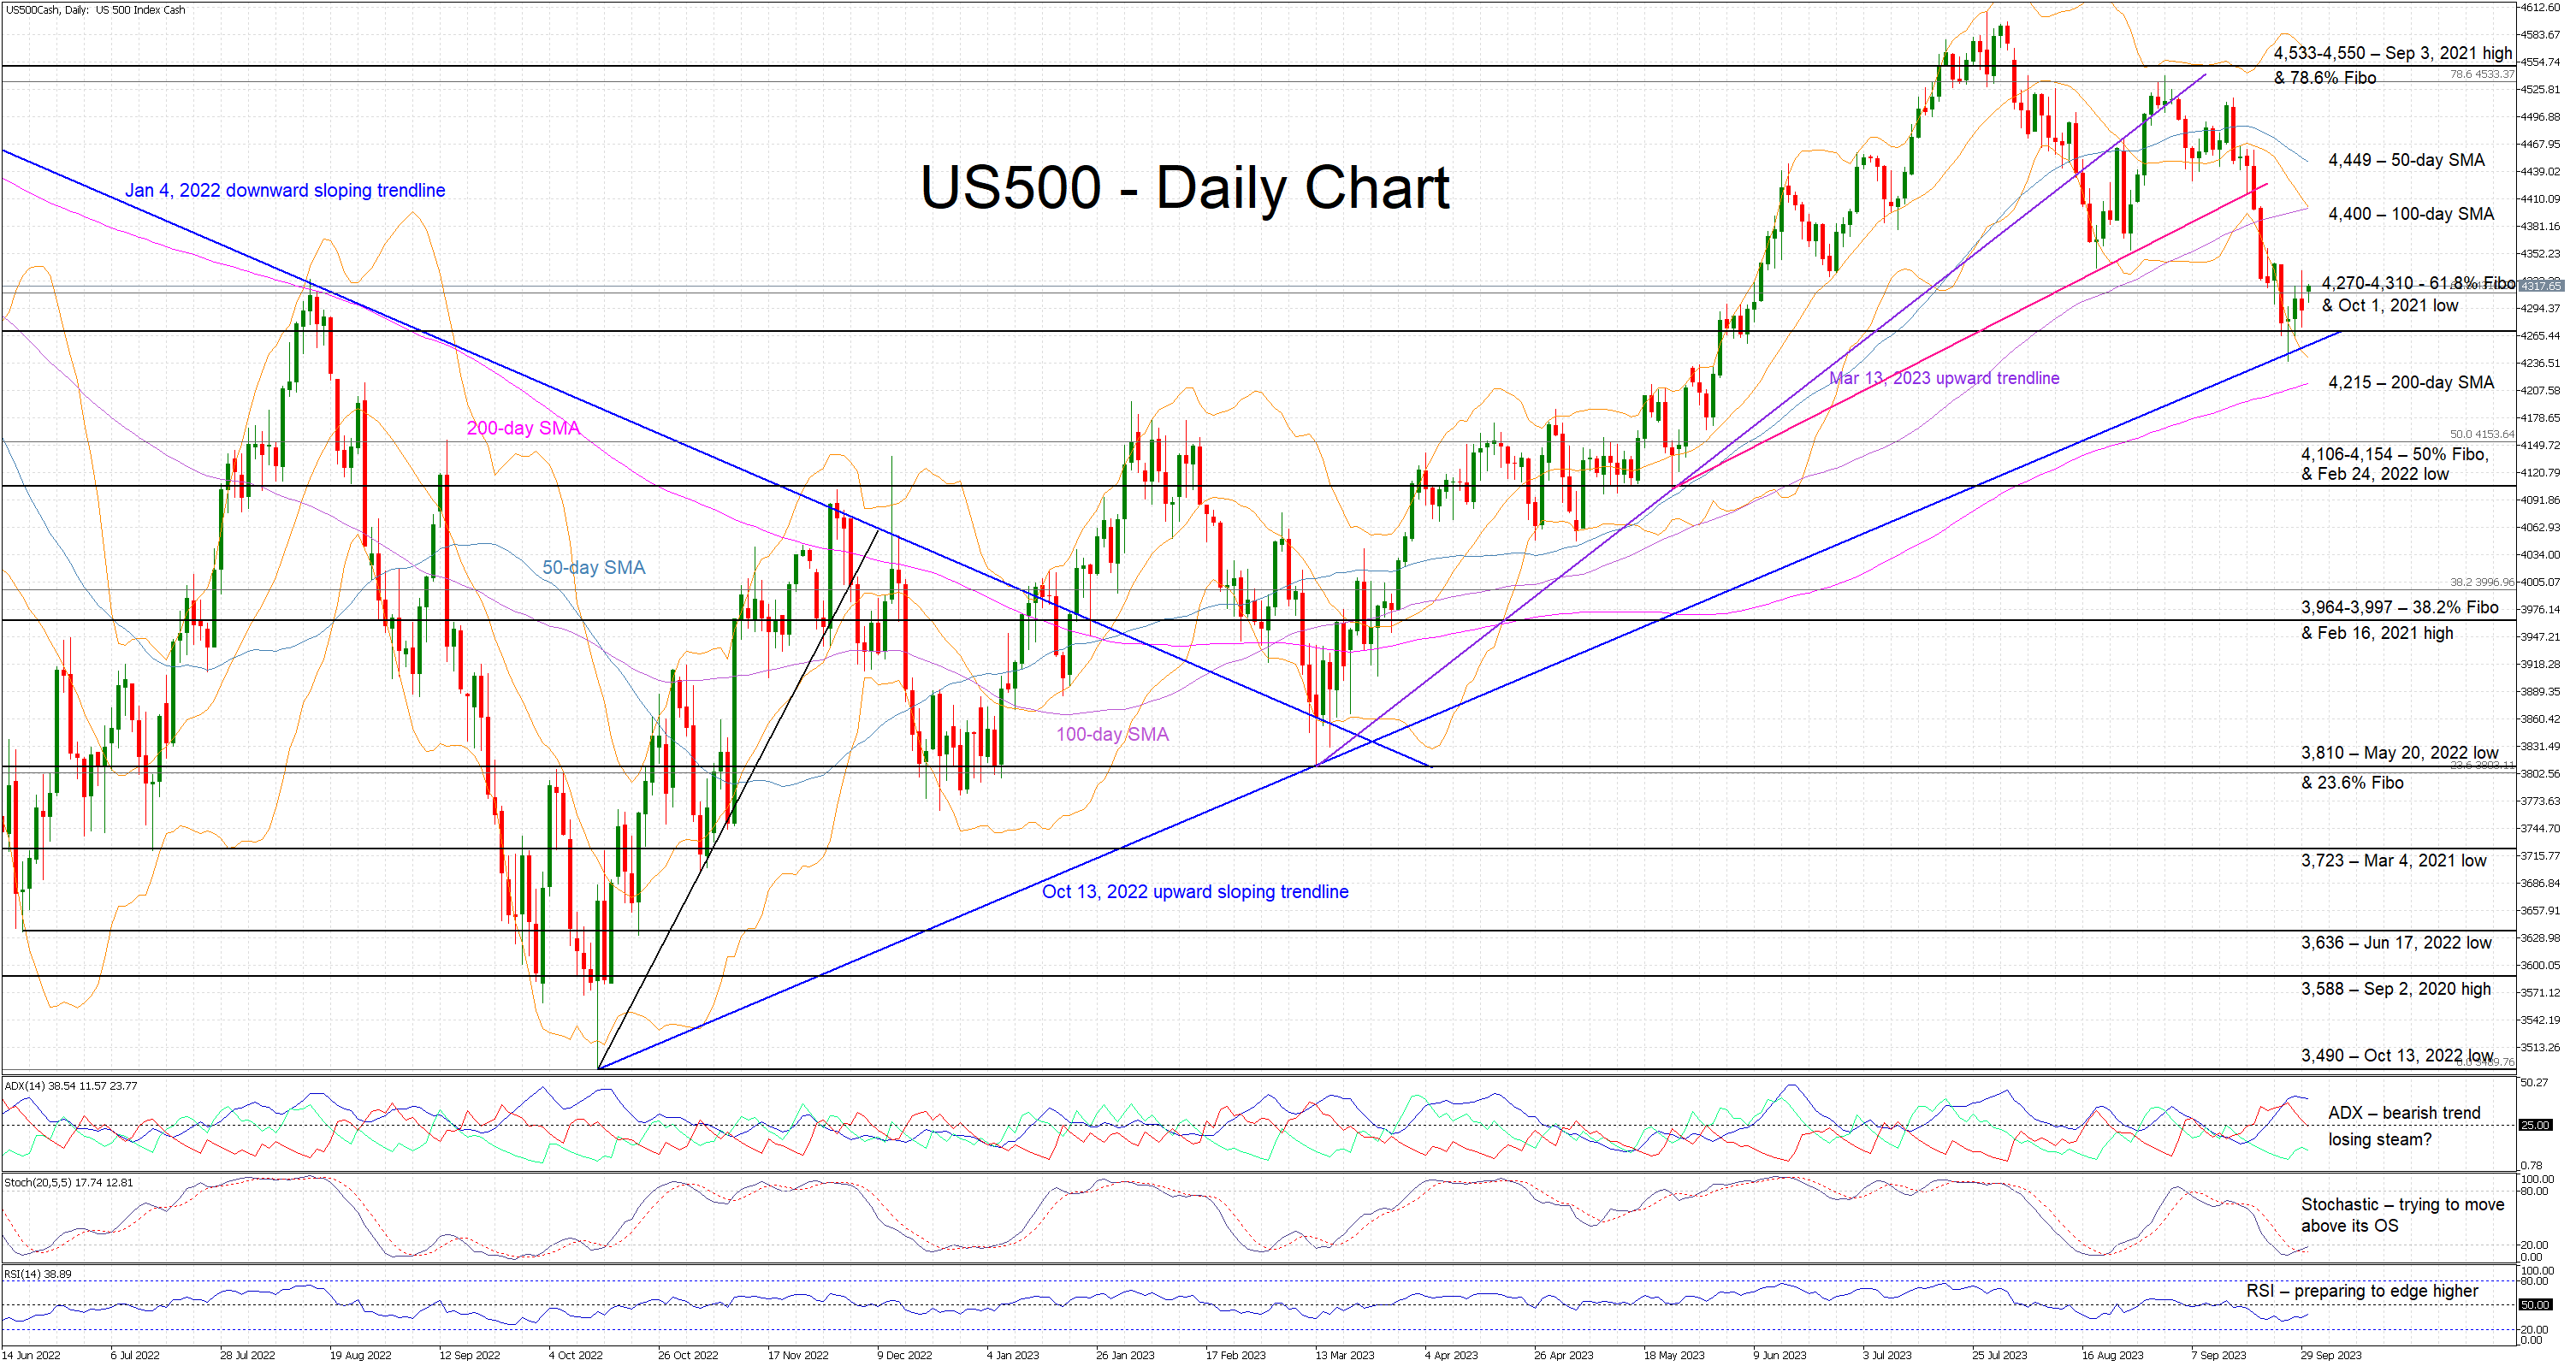
The US 500 cash index is trading sideways today, hovering around the busy 4,270-4,310 area. The current downleg stopped at the long-term October 13, 2022 upward sloping trendline, allowing the bulls to temporarily gain some breathing space. However, the current bearish series of lower lows and lower highs remains intact.
In the meantime, the momentum indicators are showing increasing signs that a reversal could be on the cards soon. The Average Directional Movement Index (ADX) appears to have peaked, and it is potentially ready to start a downward move. Similarly, the RSI is gradually moving towards its midpoint after trading at its lowest level since September 2022. More importantly, the stochastic oscillator has edged above its moving average and now looks determined to move aggressively above its oversold territory.
Should the bears remain confident, they would aim to push the US 500 index below the 4,270-4,310 area, which is populated by the 61.8% Fibonacci retracement level of the January 4, 2022 – October 12, 2022 downtrend and the October 1, 2021 low. They could then come up against the key October 13, 2022 trendline, a tad above the 200-day simple moving average (SMA) at 4,215. Even lower, strong support is expected at the 4,106-4,154 region.
On the flip side, the bulls are keen on stopping the current correction. Should they successfully defend the 4,270-4,310 region, they could try to push the US 500 index above both the 100- and 50-day SMAs at 4,400 and 4,449 levels respectively. Higher, they could retest the 4,533-4,550 range that is defined by the 78.6% Fibonacci retracement level and the September 3, 2021 high.
To conclude, after a sizeable move the US 500 cash index bears’ dominance could be under threat, especially if the momentum indicators show further signs of a bullish reversal.
GBP/JPY Daily Outlook
Daily Pivots: (S1) 181.76; (P) 182.40; (R1) 182.90; More...
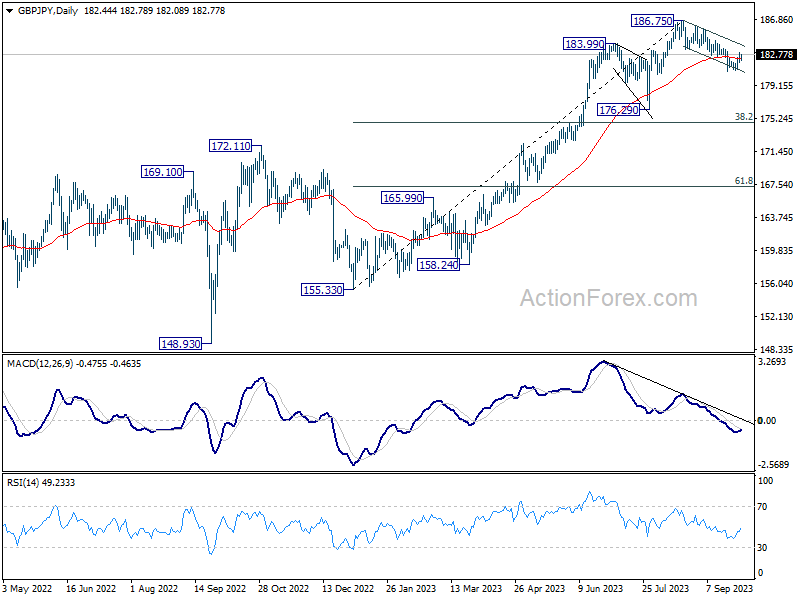
Intraday bias in GBP/JPY remains neutral for the moment. Deeper decline is expected as long as 183.34 resistance holds. On the downside, break of 180.78 will resume the fall from 186.75 to 176.29 support next. Nevertheless, firm break of 183.34 will turn bias back to the upside for retesting 186.75 high.
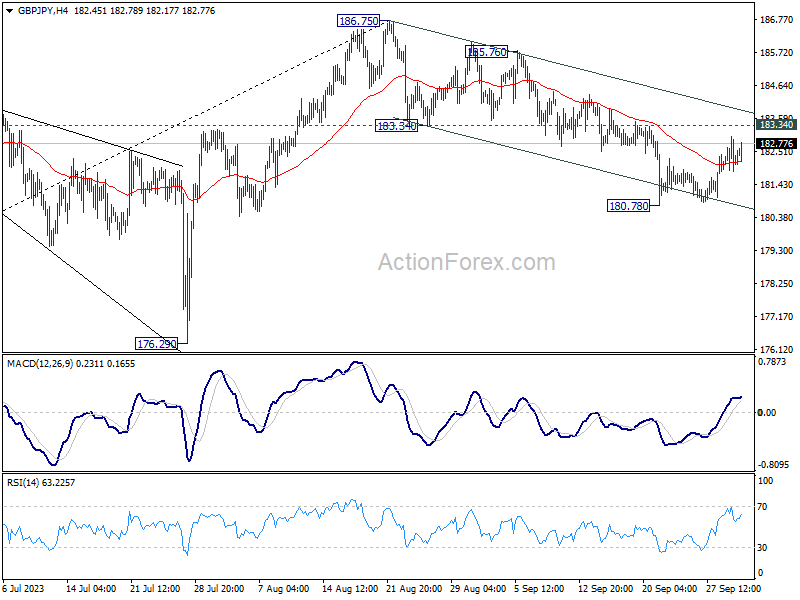
In the bigger picture, fall from 186.75 is currently seen as a corrective move only. As long as 176.29 support holds, larger up trend from 123.94 (202 low) should still be in progress. Break of 186.75 will target 195.86 (2015 high). Nevertheless, firm break of 176.29 will confirm medium term topping, and bring lengthier and deeper consolidations.
EUR/JPY Daily Outlook
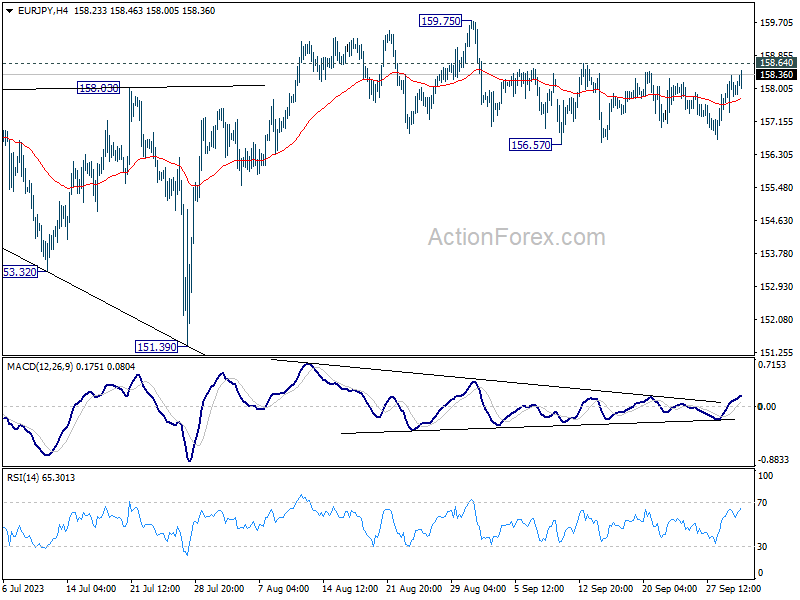
Daily Pivots: (S1) 157.44; (P) 157.89; (R1) 158.38; More....
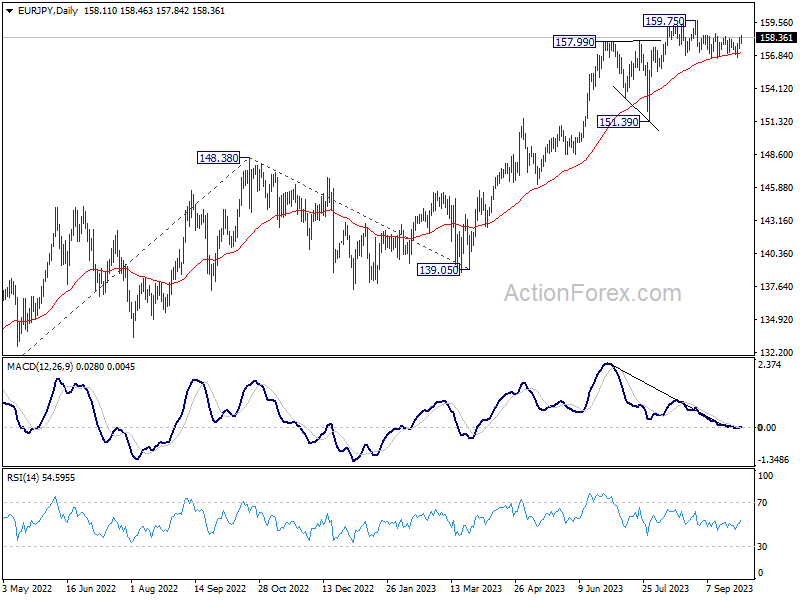
Intraday bias in EUR/JPY remains neutral as range trading continues. Deeper decline will remain in favor as long as 158.64 resistance holds. On the downside, break of 156.57 support, and sustained trading below 55 D EMA (now at 157.02) will argue that fall from 159.75 is a larger scale correction. Deeper decline would be seen back towards 151.39 support. Nevertheless, above 158.64 would bring retest of 159.75 high instead.
In the bigger picture, as long as 151.39 support holds, rise from 114.42 (2020 low) is still expected to continue. Next target is 100% projection of 124.37 to 148.38 from 139.05 at 163.06. Sustained break there will pave the way to retest long term resistance at 169.96.
EUR/GBP Daily Outlook
Daily Pivots: (S1) 0.8645; (P) 0.8662; (R1) 0.8683; More....
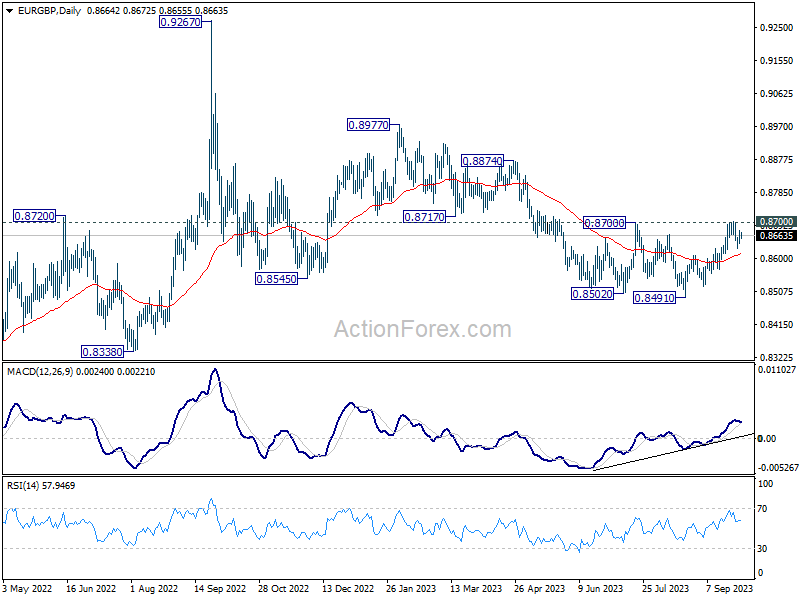
Range trading continues in EUR/GBP and intraday bias stays neutral at this point. On the upside, decisive break of 0.8700 resistance will carry larger bullish implication and bring stronger rally to 0.8874 resistance next. Nevertheless, rejection by this resistance will maintain bearish outlook that larger down trend is not over. Firm break of 0.8629 resistance turned support will turn bias back to the downside for 0.8568 support first.
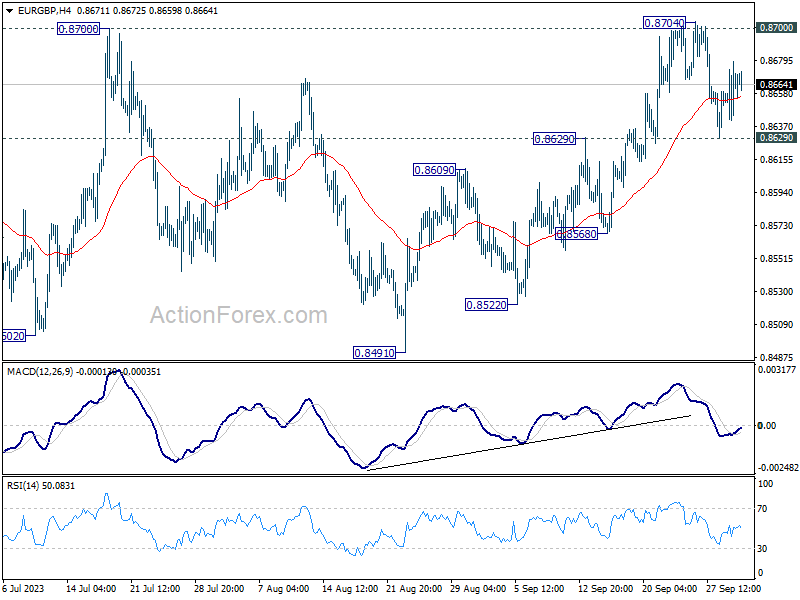
In the bigger picture, the down trend from 0.9267 (2022 high) is seen as part of the long term range pattern from 0.9499 (2020 high). Decisive break of 0.8700 resistance will argue that this decline has completed with three waves down to 0.8491. Rise from 0.8491 could then be another leg inside the pattern and targets 0.8977 and above. However, rejection by 0.8700 will keep the down trend alive for another fall through 0.8491 at a later stage.
EUR/AUD Daily Outlook
Daily Pivots: (S1) 1.6352; (P) 1.6403; (R1) 1.6485; More...
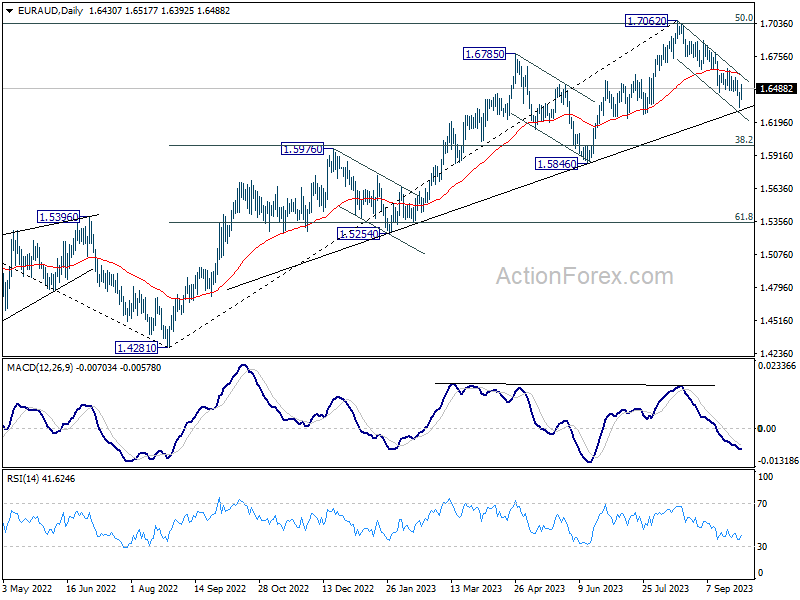
Intraday bias in EUR/AUD is turned neutral with current recovery. But further decline is expected with 1.6650 resistance intact. On the downside, break of 1.6319 will resume the fall from 1.7062, as a larger scale correction, to 1.6000 fibonacci level.
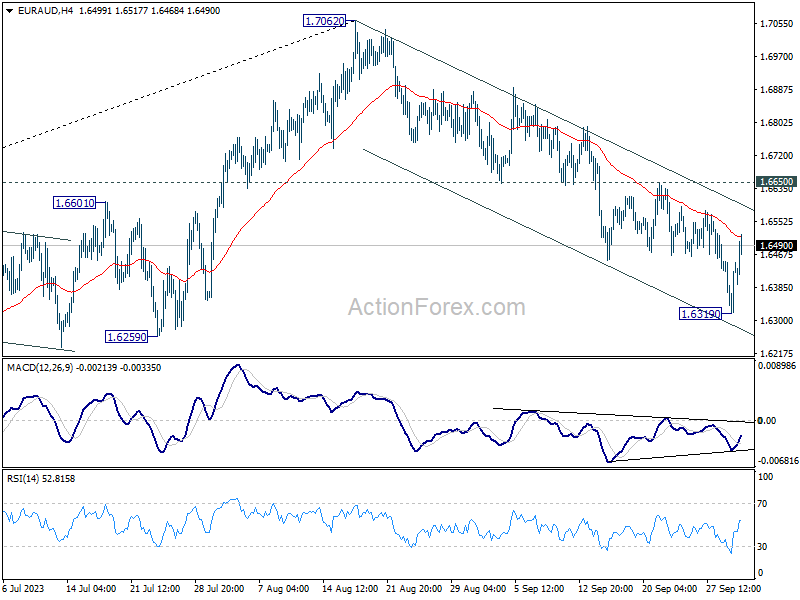
In the bigger picture, fall from 1.7062 is probably correcting whole up trend from 1.4281 (2022 low). Deeper decline would be seen to 38.2% retracement of 1.4281 to 1.7062 at 1.6000. Strong support could be seen there to bring rebound, at least on first attempt. This will remain the favored case as long as 1.6650 resistance holds.
EUR/CHF Daily Outlook
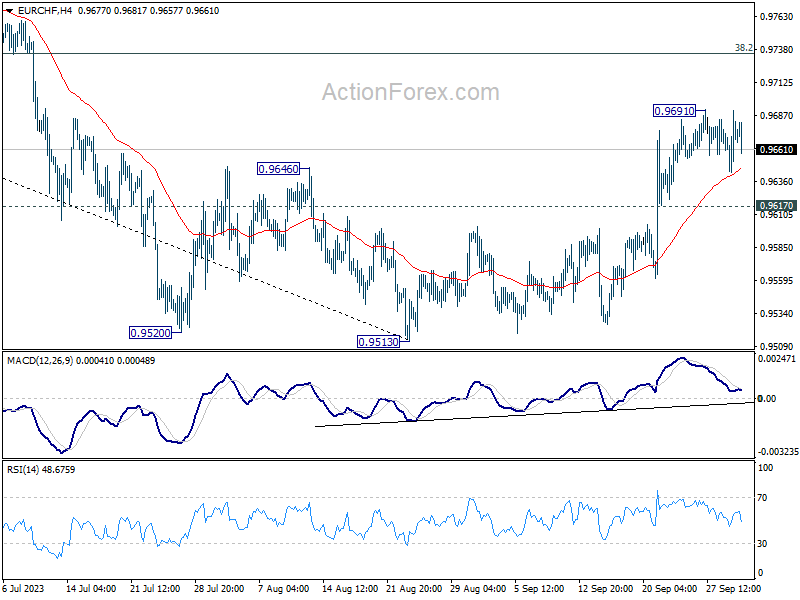
Daily Pivots: (S1) 0.9650; (P) 0.9671; (R1) 0.9698; More...
Intraday bias in EUR/CHF stays neutral as consolidation from 0.9691 is still extending. Further rally is expected as long as 0.9617 support holds. Above 0.9691 will resume the rebound form 0.9513 to 38.2% retracement of 1.0095 to 0.9513 at 0.9735. However, firm break of 0.9617 will turn bias back to the downside for retesting 0.9513 low.
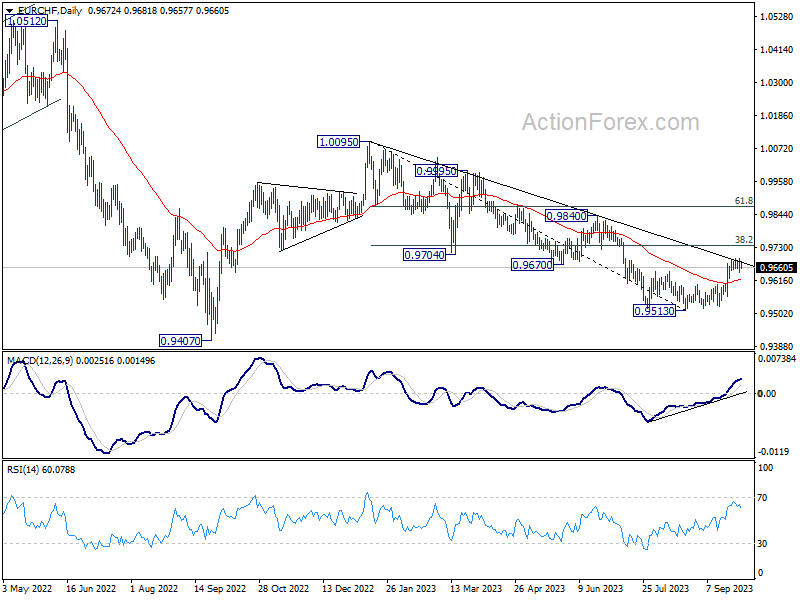
In the bigger picture, medium term outlook will stay bearish as long as the cross is capped well below falling 55 W EMA (now at 0.9804). That is, down trend from 1.2004 (2018 high) could still resume through 0.9407 (2022 low). However, sustained trading above the 55 W EMA will raise the chance that 0.9470 is already a long term bottom. Further rise would then be seen to 1.0095 resistance to indicate bullish trend reversal.
BoJ’s Quarterly Tankan Survey Showed Japanese Firms Turn More Optimistic
Markets
Markets entered a consolidation phase last Friday following exhaustion moves earlier in the week. For core bonds it meant an end to a fierce sell-off with EMU September inflation numbers (0.3% M/M & 4.3% Y/Y for headline; 4.5% Y/Y for core) backing the case for an October skip in the ECB’s rate hike cycle and helping to put a floor below EMU core bonds in the short term. Daily changes on the German yield curve ranged between -5.2 bps (30-yr) and -11.3 bps (5-yr). The belly of the curve outperformed the wings. German Bunds did better than US Treasuries but this was partly due to the fact that those US bonds already rallied during Thursday evening’s US session. US yields lost a more moderate 0.4 bps (30-yr) to 1.5 bps (3-yr). August US PCE deflators (0.4% M/M & 3.5% Y/Y for headline; 0.1% M/M & 3.9% Y/Y for core) also suggest a pause in the bearish bond trend for now. With rates correcting, equity markets got some breathing room. Main European indices ended with gains of around 0.5%, though well off the intraday highs. From a technical point of view, Friday’s action suggests that it will remain a tough climate for riskier assets. US stock markets started on a positive footing, but lost up to 0.5% (Dow Jones) in the close. The dollar’s uptrend since mid-July remains in place despite the correction at the end of last week. The trade-weighted greenback registered an intraday low at 105.66 before closing near unchanged at 106.17. EUR/USD reached an intraday top at 1.0617 before closing at 1.0573.
US Congress avoided a government shutdown, passing legislation with bipartisan backing to extend funding through mid-November. They help a better start in Asia though China is closed for the week. US Treasuries gap open lower. Today’s eco calendar centers around the US manufacturing ISM which kickstarts a data-heavy week which also sees JOLTS job openings, ADP employment, the services ISM, weekly jobless claims and payrolls. Fed Chair Powell participates in a roundtable discussion but it’s unclear whether he’ll touch on monetary policy or note. We start the week with a consolidation view in which core bonds can recover somewhat and in which the dollar’s momentum fades. From a risk point of view, better-than-expected US eco releases can easily reignite the sell-off given that markets aren’t aligned with Fed indications on one more rate hike later this year.
News and views
Former Prime Minister Fico’s Smer Party came out as the biggest at Saturday’s Slovak parliamentary elections. It secured 22.94% of the vote. Fico has a pro-Russian stance and wants to end military aid to Ukraine. He also opposes to some EU policies including on migration and climate. The closest contender of the Smer party, the pro-EMU PS party of European Parliament vice president Michal Simecka, received a below expected 17.96% of the votes. The Social democratic ‘Hlas’ (Voice) party of former Prime Minister Pellegrini, obtained 14.7% of the votes. At 68.51%, the voter turnout was high compared to previous elections. President Zuzana Caputova today is expected to appoint Fico to form a new government. Analysts expect Fico to try to from a government with his Smer Party, the Hlas party and the Nationalist SNS party. This coalition would have a majority of 79 seat out of 150 in total in Parliament.
The BoJ’s quarterly Tankan survey showed that Japanese firms turn more optimistic on activity for the second consecutive quarter. The headline large manufacturing index improved from 5 to 9. Also the outlook in the sector improved from 9 to 10. The large non-manufacturing measure improved from 23 to 27, a level not seen since the final quarter of 1991, as the sector rebounded after authorities lifted corona-restrictions. Especially companies in the accommodation, eating and drinking industry showed high levels of confidence. The outlook for the non-manufacturing sector also improved (21 from 20) but less than expected. Sentiment among smaller companies basically stabilized. According to the Tankan survey, Japanese corporations take into account a level for the yen at USD/JPY 135.75 for this fiscal year. With respect to inflation, Japanese corporates still see consumer price inflation at 2.2% three years ahead. At USD/JPY 149.75 the yen this morning continues its weakening trend. The Japanese 10-y government bond yield touched a new cycle top at 0.78%.