

Sample Category Title
USD/CAD Daily Outlook
Daily Pivots: (S1) 1.3470; (P) 1.3527; (R1) 1.3638; More....
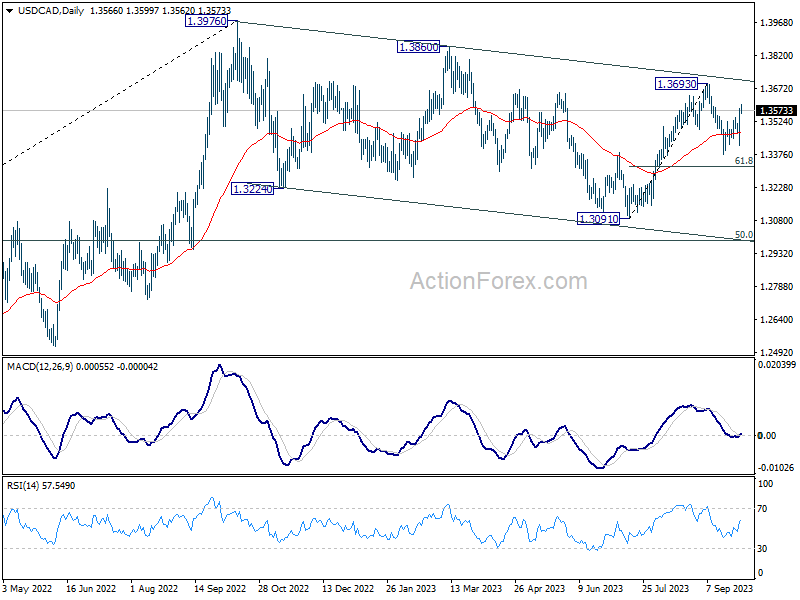
Intraday bias in USD/CAD stays mildly on the upside for retesting 1.3693. Strong resistance could be seen there to limit upside on first attempt. On the downside, below 1.3415 support will resume the fall from 1.3693 through 1.3378 to 61.8% retracement of 1.3091 to 1.3693 at 1.3321.
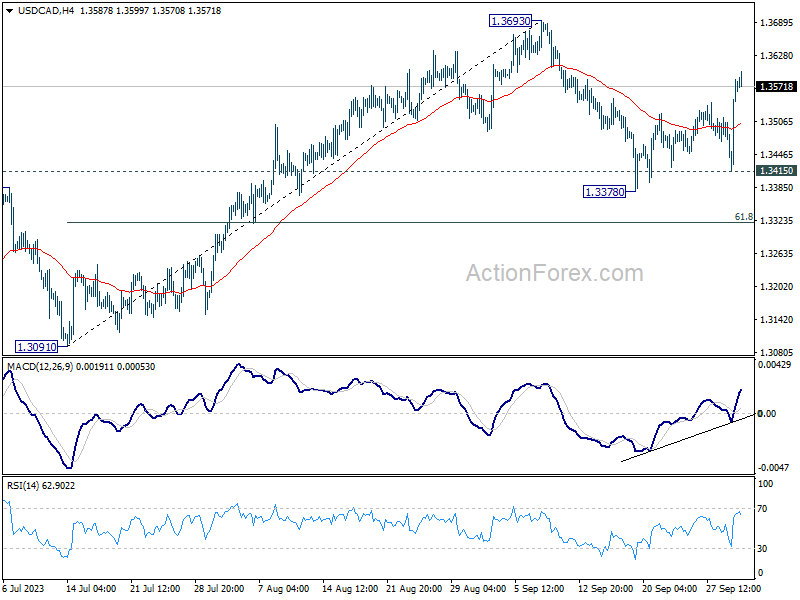
In the bigger picture, no change in the view that price actions from 1.3976 (2022 high) are a corrective pattern to up trend from 1.2005 (2021 low). The question is whether it has completed with three waves down to 1.3091, or still extending. But even in case of extension, downside should be contained by 50% retracement of 1.2005 to 1.3796 at 1.2991. Meanwhile, firm break of 1.3693 should validate the former case, and target 1.3976 and above.
AUD/USD Daily Report
Daily Pivots: (S1) 0.6401; (P) 0.6451; (R1) 0.6486; More...
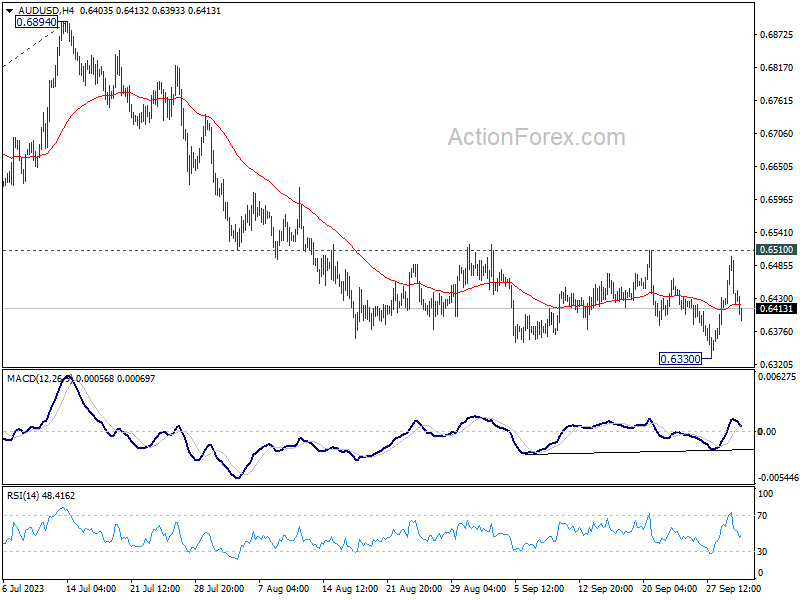
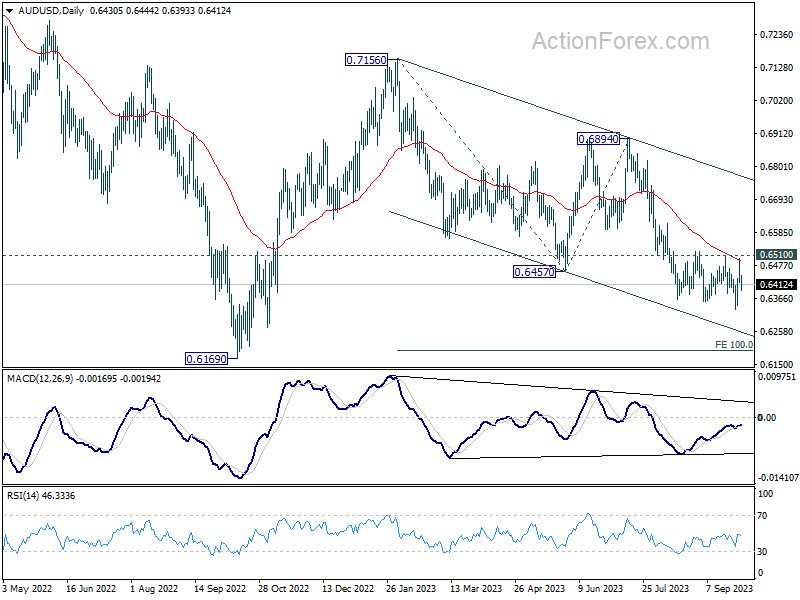
Intraday bias in AUD/USD remains neutral for the moment as range trading continues. As long as 0.6510 resistance holds, near term outlook stays bearish. On the downside, break of 0.6330 will resume the whole decline from 0.7156 to 100% projection of 0.7156 to 0.6457 from 0.6894 at 0.6195. However, firm break of 0.6510 will confirm short term bottoming, and turn bias back to the upside.
In the bigger picture, down trend from 0.8006 (2021 high) is possibly still in progress. Decisive break of 0.6169 will target 61.8% projection of 0.8006 to 0.6169 to 0.7156 at 0.6021. This will now remain the favored case as long as 0.6894, in case of strong rebound.
EUR/USD Daily Outlook
Daily Pivots: (S1) 1.0548; (P) 1.0583; (R1) 1.0607; More...
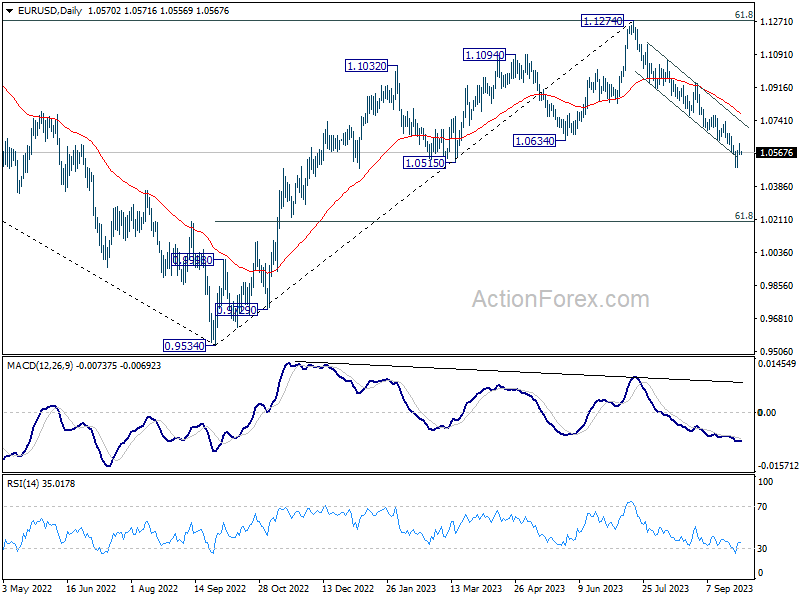
Intraday bias in EUR/USD remains neutral as consolidation from 1.0487 is extending. Stronger recovery cannot be ruled out. But near term outlook will stay bearish as long as 1.0764 support turned resistance holds. Break of 1.0487 will resume the fall from 1.1274 to 1.0199 fibonacci level.
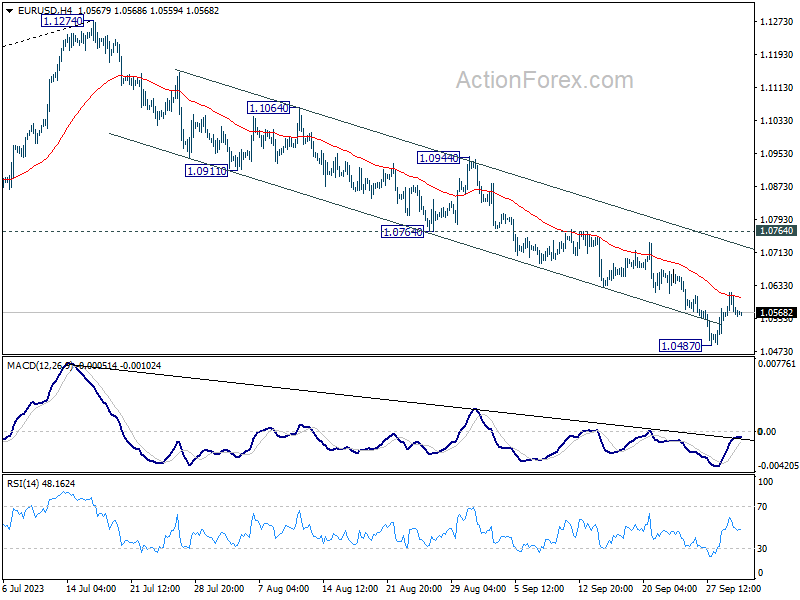
In the bigger picture, fall from 1.1274 medium term top could still be a correction to rise from 0.9534 (2022 low). But chance of a complete trend reversal is rising. In either case, current fall should target 61.8% retracement of 0.9534 to 1.1274 at 1.0199 next. For now, risk will stay on the downside as long as 55 D EMA (now at 1.0786) holds, in case of rebound.
GBP/USD Daily Outlook
Daily Pivots: (S1) 1.2167; (P) 1.2219; (R1) 1.2258; More...
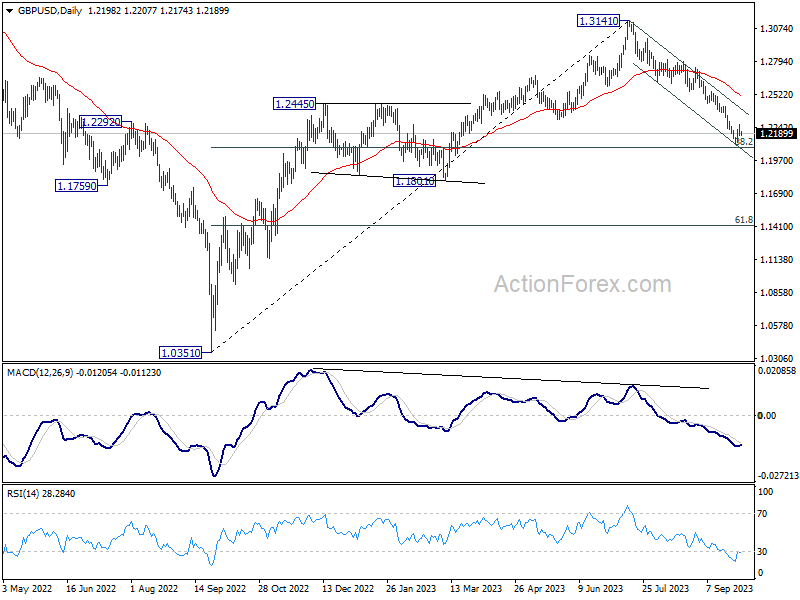
Intraday bias in GBP/USD stays neutral as consolidation from 1.2109 is extending. While stronger rise cannot be ruled out, near term outlook will stay bearish as long as 1.2420 resistance holds. On the downside, decisive break of 1.2075 fibonacci level would carry larger bearish implication and target 1.1801 support next.
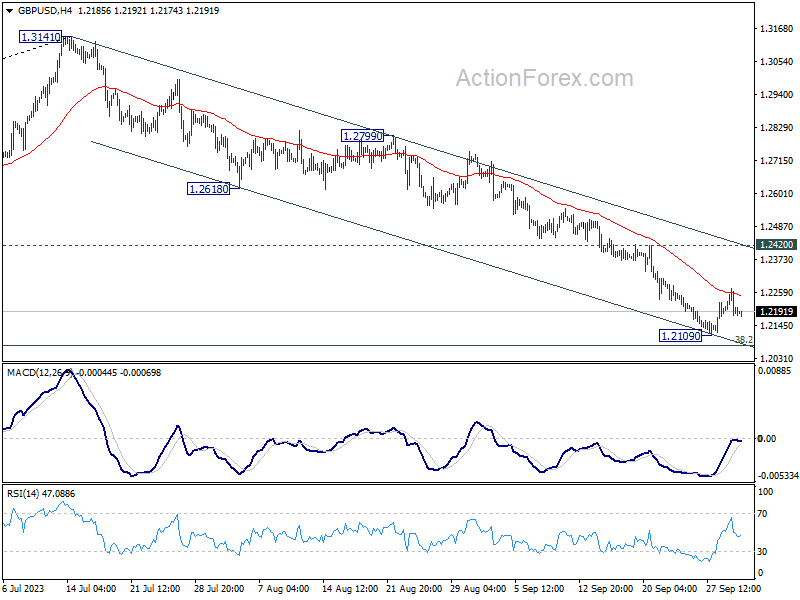
In the bigger picture, fall from 1.3141 medium term top could still be a correction to up trend from 1.0351 (2022 low) only. But risk of complete trend reversal is rising. Sustained break of 38.2% retracement of 1.0351 to 1.3141 at 1.2075 will pave the way to 61.8% retracement at 1.1417. For now, risk will stay on the downside as long as 55 D EMA (now at 1.2517) holds, in case of rebound.
USD/CHF Daily Outlook
Daily Pivots: (S1) 0.9107; (P) 0.9135; (R1) 0.9180; More....
Intraday bias in USD/CHF remains neutral for consolidation below 0.9244. Deeper retreat cannot be ruled out. But near term outlook will stay bullish as long as 0.9019 support holds. On the upside, break of 0.9224 will resume the rally from 0.8551 to 0.9439 resistance next.
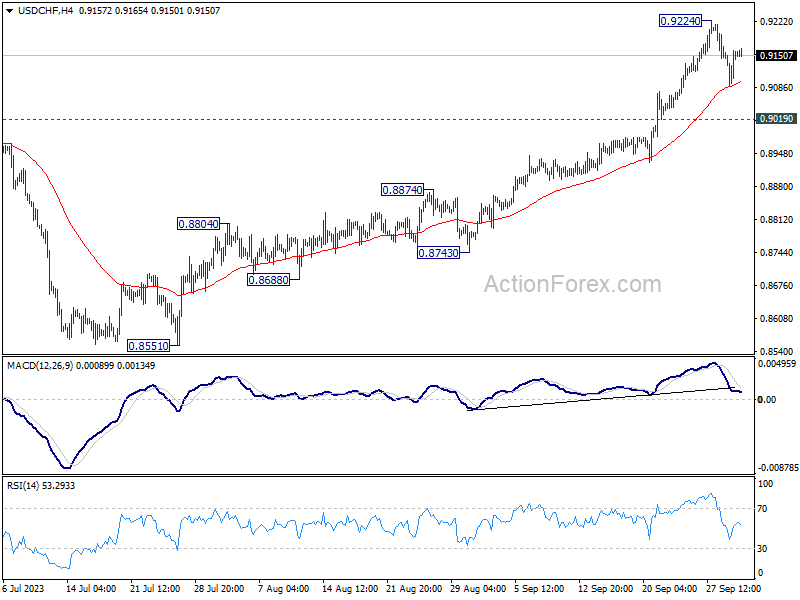
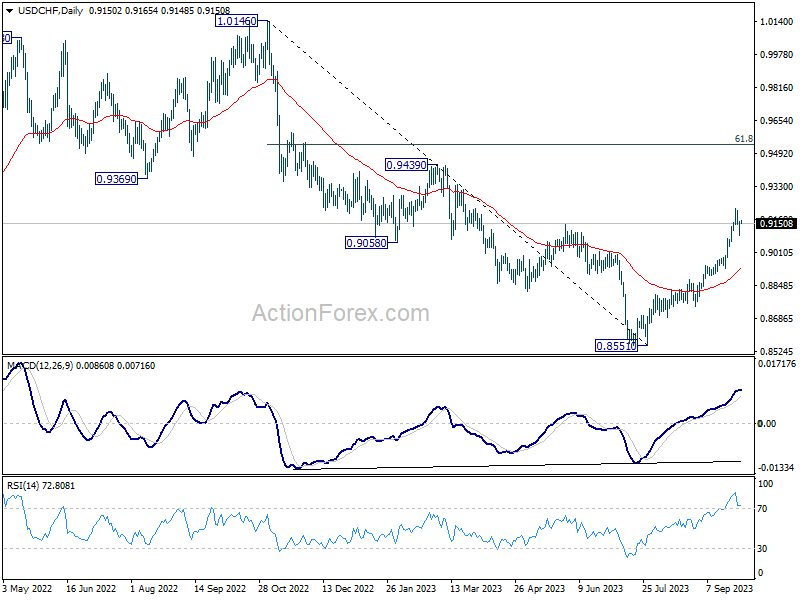
In the bigger picture, current development indicates that rise from 0.8551 is reversing whole down trend from 1.0146. Further rally would then be seen to 61.8% retracement at 0.9537 and above. For now, this will be the favored case as long as 55 D EMA (now at 0.8923) holds, even in case of deep pullback.
US Futures Gain as US Stays Open, Gold Feels Heavy
The US government didn’t shut down yesterday, as US policymakers agreed on a short-term funding deal that will keep the lights on until November 17th. But the new deal excludes any new aid package for Ukraine – which is a key demand from Democrats. Therefore, the political headache in the US is not over, but the politicians bought themselves a couple of weeks to try to find a better solution.
Bitcoin rallied and US equity futures gained in Asia hinting at improved appetite after the S&P500 recorded its 4th straight week of losses last week, and a nearly 5% fall in September. Investors didn’t flock into the US Treasuries following the US no-shutdown news, however. The US 10-year yield opened the week above 4.60% and pushed marginally higher, whereas the 2-year yield rebounded, after getting closer to the 5% mark after Friday’s PCE index showed slower than expected inflation numbers. The fact that the rising gasoline prices start showing in inflation figures is not good news, yet melting US savings and student debt repayments should weigh on US spending. And if all goes according to the plan, a softer US spending could pull more pressure off of inflation and counter the positive impact of rising energy prices on overall inflation numbers. Futures market now give around 70% chance for another pause in FOMC’s November meeting.
Despite waning political tensions, the US dollar kicked off the week on a positive note. The Chinese official PMI rose above the 50 threshold; the Caixin numbers looked softer, but remained in the expansion zone. The Japanese tankan survey showed that confidence among big manufacturers improved for a second month. The Nikkei was better bid this morning, as the USJDPY came a notch closer to the 150 mark. In the Eurozone, last Friday’s inflation figures enchanted investors and the European Central Bank (ECB) doves. Both headline and core inflation fell more than expected. Core inflation fell to 4.5%, a year low. We are still more than twice the ECB’s 2% inflation goal, and the rising energy prices and weakening euro make the path uncertain for the coming months but if the Fed is done hiking, the ECB is certainly done hiking as well. The Stoxx 600 jumped following an encouraging fall in inflation, but gains remained short-lived, appetite in European real estate and luxury brands remain limited and a slide below the 445 level is still my base case scenario. In currency, the softening ECB expectations should keep the euro bears in play, but a potential weakness in the US dollar on political relief could help the euro recover recent losses.
In the commodity space, gold feels like it's tied to a stone and thrown into the sea. The price of an ounce is now below $1950. Oversold market conditions hint that we should soon see a pause and correction, but the US yields look appetizing and a potential fall in the yields would make the stocks appetizing leaving little room for gold to make a comeback. In energy, the crude rally is losing steam above the $90pb. OPEC+ will meet this week. No changes are expected to the outlook policy, the rising demand and falling supply continue to support higher oil prices. Even the Russian oil which is supposed to be capped at $60pb is advancing decidedly toward the $100 level.
Asian Growth Signs, US Avoids Shutdown
Market movers today
Euro area unemployment figures for august are released. The labour market has been surprisingly strong this year despite the monetary policy tightening and cooling economy. In July, the unemployment rate remained at the historical low of 6.4%. We expect to see a slow and muted rise in the unemployment rate going forward in line with the signals from the PMI employment figures.
ISM for manufacturing for September is released in the US. We already have the Flash S&P PMI which showed a slight improvement compared to August, and we will also get the final version of that measure today.
In Sweden the Riksbank releases minutes from its recent policy meeting, see more below.
Vice chairman Michael Barr from the Fed speaks about monetary policy and financial stability 19.00 CET.
The Reserve Bank of Australia will announce its rate decision 5.30 CET on Tuesday, we expect no rate change.
For the remainder of the week, the most important market mover will be the US jobs report released on Friday.
The 60 second overview
US: On Saturday, Congress approved a plan to keep the federal government open until mid-November, avoiding a shutdown for now just hours before the midnight deadline, see New York Times.
Inflation: Friday brought some uplifting inflation news to the ECB with a large decline in euro area core inflation to 4.5% in September from 5.3% in August. A big chunk of it can be explained by the German 9-euro ticket exiting the inflation measure. However, zooming in on MoM price pressures, price pressures actually appear to have subsided in September. European bond yields also traded a few basis points lower in the afternoon session on Friday. In the US, PCE data confirmed that US core inflation pressures have cooled down with PCE core at just 0.1% m/m in August.
Japan: The Tankan business survey for Q3 was even stronger than expected with big non-manufacturers' mood at the highest level since the early 90's. The big manufacturers' index rose from 5 to 9, also beating expectations. Businesses spending plans remain robust and 3 and 5 year inflation expectations were unchanged at a level above 2%. The strong business mood will be key for the potential for a higher wage pressure in the economy next year, a prerequisite for Bank of Japan normalising its policies. This morning a summary of opinions from the BoJ's September meeting revealed that more policymakers discussed the prospects of an eventual exit from ultra-loose policy. One member said the second half of the current fiscal year, ending in March 2024, will be an "important period" in determining whether the BoJ's price target will be achieved. We expect another tweak to the yield curve control this year ahead of further normalisation next year.
China: The Caixin PMI decreased to 50.6 in September from 51 in August, less than expected. Even so, it confirms the picture painted by the official PMIs released on Sunday, which edged above 50 for the first time in six months, that the economy is bottoming out.
Equities: Equities lost steam in the last hours of trading on Friday. Softer US core PCE inflation, another batch of favourable inflation developments overseas or a strong earnings report was not enough to maintain the risk appetite. Europe rose 0.4% while S&P 500 was -0.3% lower. This resulted in Europe and Nordics unchanged for the week and US a percent lower. Although it may not have felt like it, it has not been all blue: The sell-off has mostly taken place in defensives, small caps have beat large caps and growth has even given value some revenge. US futures are a notch higher this morning and Asia is higher, although China is closed for holiday.
FI: The republicans and democrats have avoided a government shutdown in the US, but the deal on the budget lasts only until mid-November and the uncertainty can resume again. The risk of a government shutdown can put US monetary policy on hold even inflation does not decline as expected. Thus, the outlook for US Treasury yields is uncertain as there is a risk of a downgrade from Moody's in case of a shutdown.
FX: Last week was characterised by SEK strength amid the Riksbank (likely) having initiated its FX reserve hedging program (SEK buying). This has brought EUR/SEK down to the 11.55 level - the lowest level since July. Also, NOK had a good end to July with EUR/NOK falling to 11.30. EUR/USD continues to trend lower with the cross - despite a slight uptick Thursday - still finishing the week below 1.06. Finally, USD/JPY is approaching the 150 level amid the rise in global yields.
Credit: Credit markets saw the second consecutive day of improving sentiment, with iTraxx Xover tightening 2.5bp and Main closing 0.3bp tighter. Cash bonds saw more mixed performance and IG bonds tightened 2bp while HY bonds widened 3bp.
Nordic macro
Riksbank minutes published at 09:30 CET. We will look for board members' views on the probability of another rate hike and any thoughts on how long rates need to remain on high/restrictive levels. Interesting to hear the reasoning on the SEK and inflation outcomes, as in the latest minutes there was a lot of focus on the too elevated service inflation. September manufacturing PMI is out. Both NIER manufacturing confidence and the German flash PMI were higher in September, hence, the stage looks set for a slight rebound.
Technical Outlook and Review
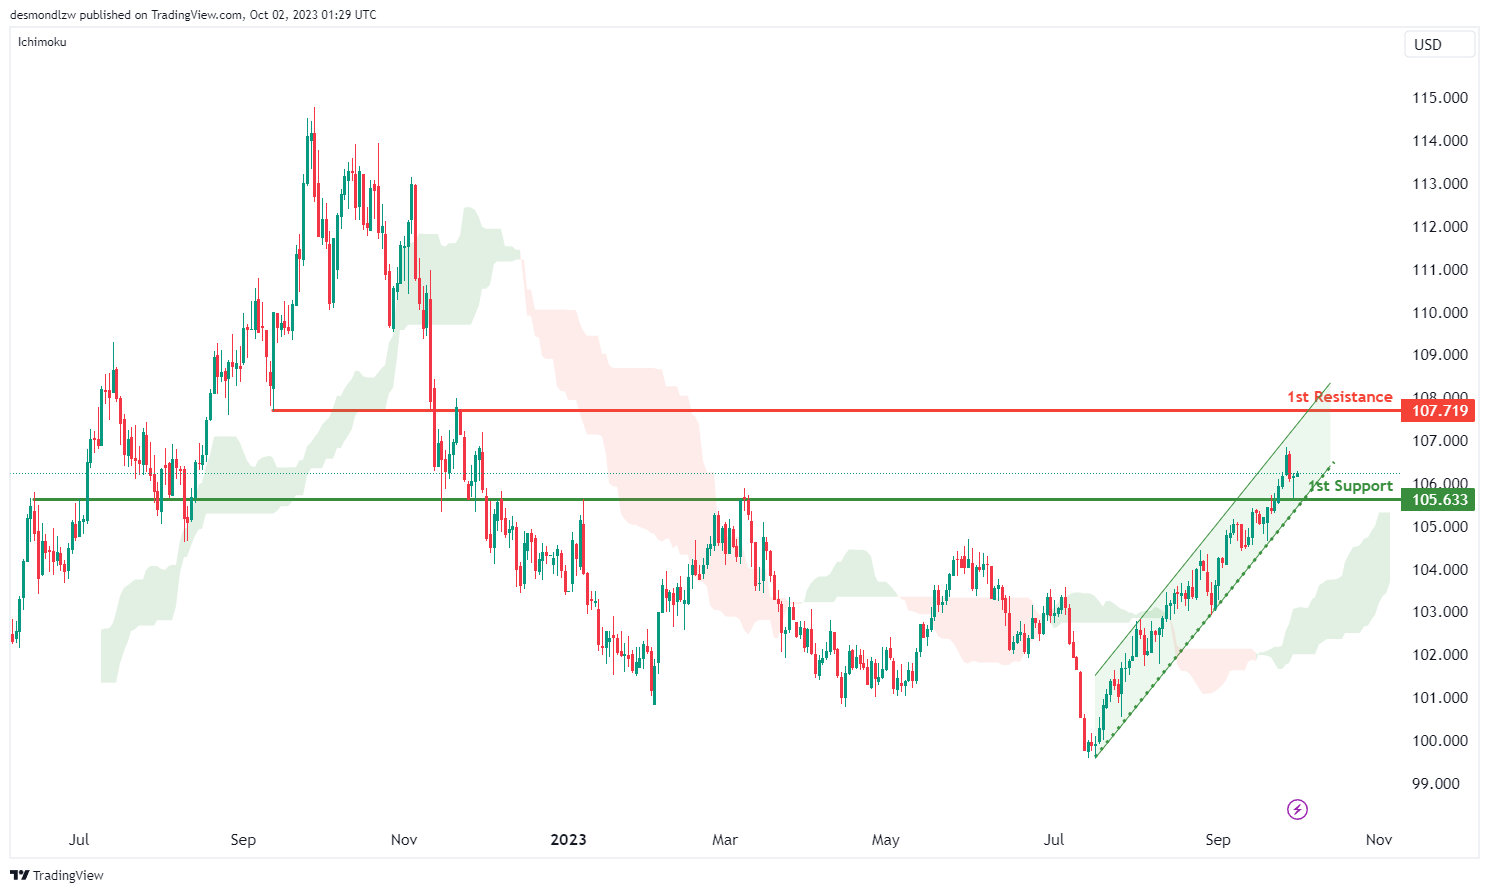
DXY:
The DXY (US Dollar Index) chart is currently experiencing bullish momentum, with several factors contributing to this trend. These factors include the price being above the bullish Ichimoku cloud and within a bullish ascending channel, both of which support the bullish outlook.
In this context, there is a potential scenario where the price could continue its bullish movement towards the 1st resistance level at 107.71. This level is identified as an overlap resistance, signifying its significance as a potential barrier to further upward movements.
On the downside, the 1st support at 105.63 is recognized as an overlap support, suggesting it may act as a strong support zone if the price retraces.
EUR/USD:
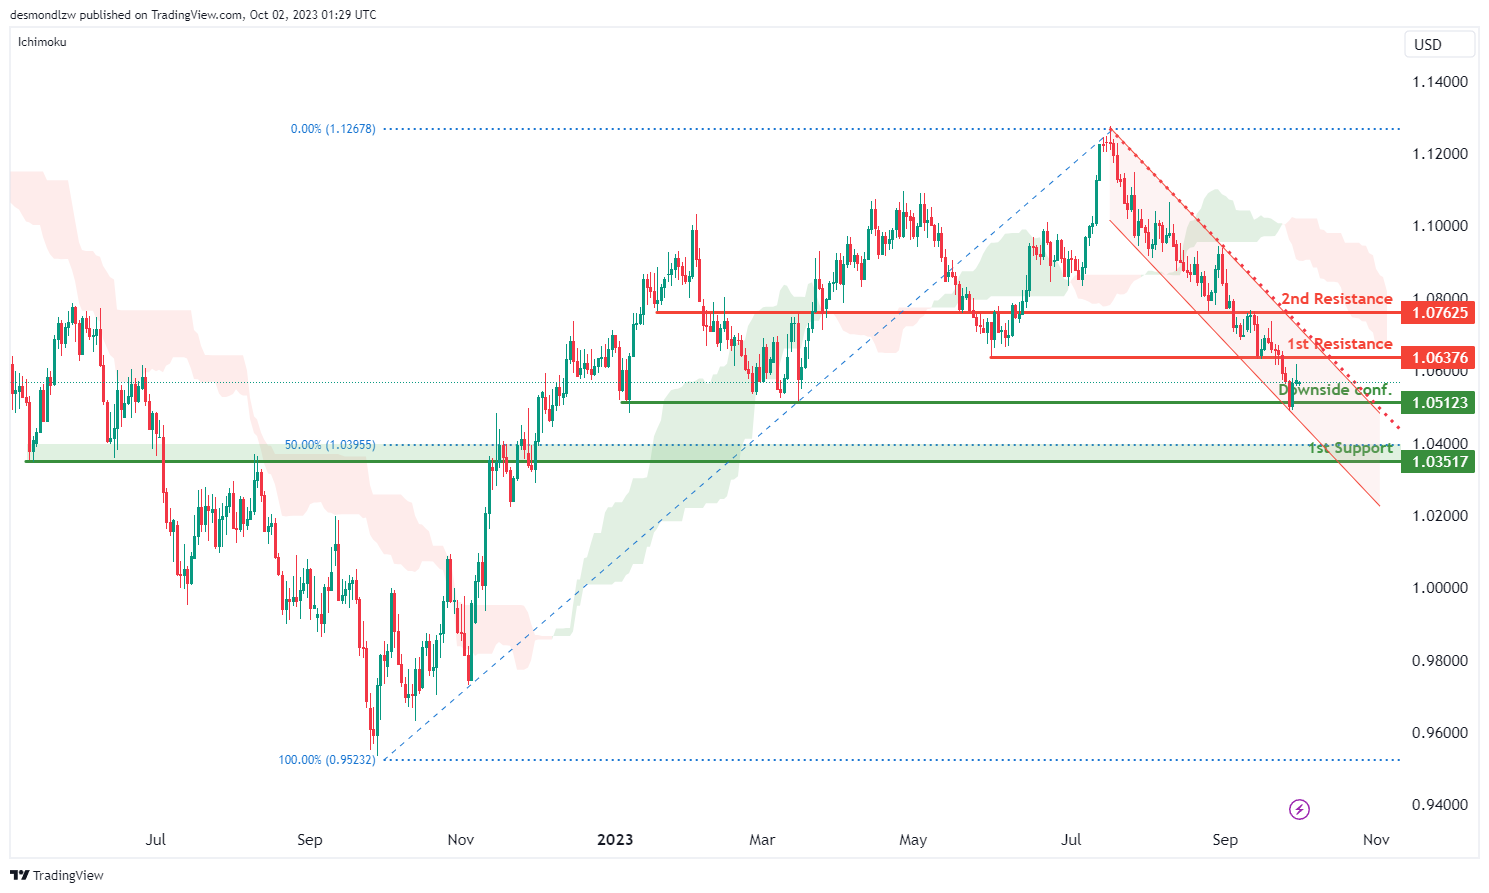
The EUR/USD chart currently exhibits a bearish overall momentum, primarily due to the following factors: it is trading below the bearish Ichimoku cloud and within a bearish channel, indicating a prevailing bearish trend.
In this context, there is a potential scenario where the price could continue its bearish movement towards the “waiting for downside confirmation” level at 1.0351. This level is significant as it is identified as an overlap support and aligns with the 50% Fibonacci Retracement, highlighting its potential importance as a support zone.
The 1st support at 1.0512 is another noteworthy level, characterized as a multi-swing low support, reinforcing its role as a potential support area.
On the resistance side, the 1st resistance level at 1.0637 is identified as an overlap resistance, which may act as a barrier to any potential upward movements. Beyond this, the 2nd resistance at 1.0762 is marked as a swing high resistance
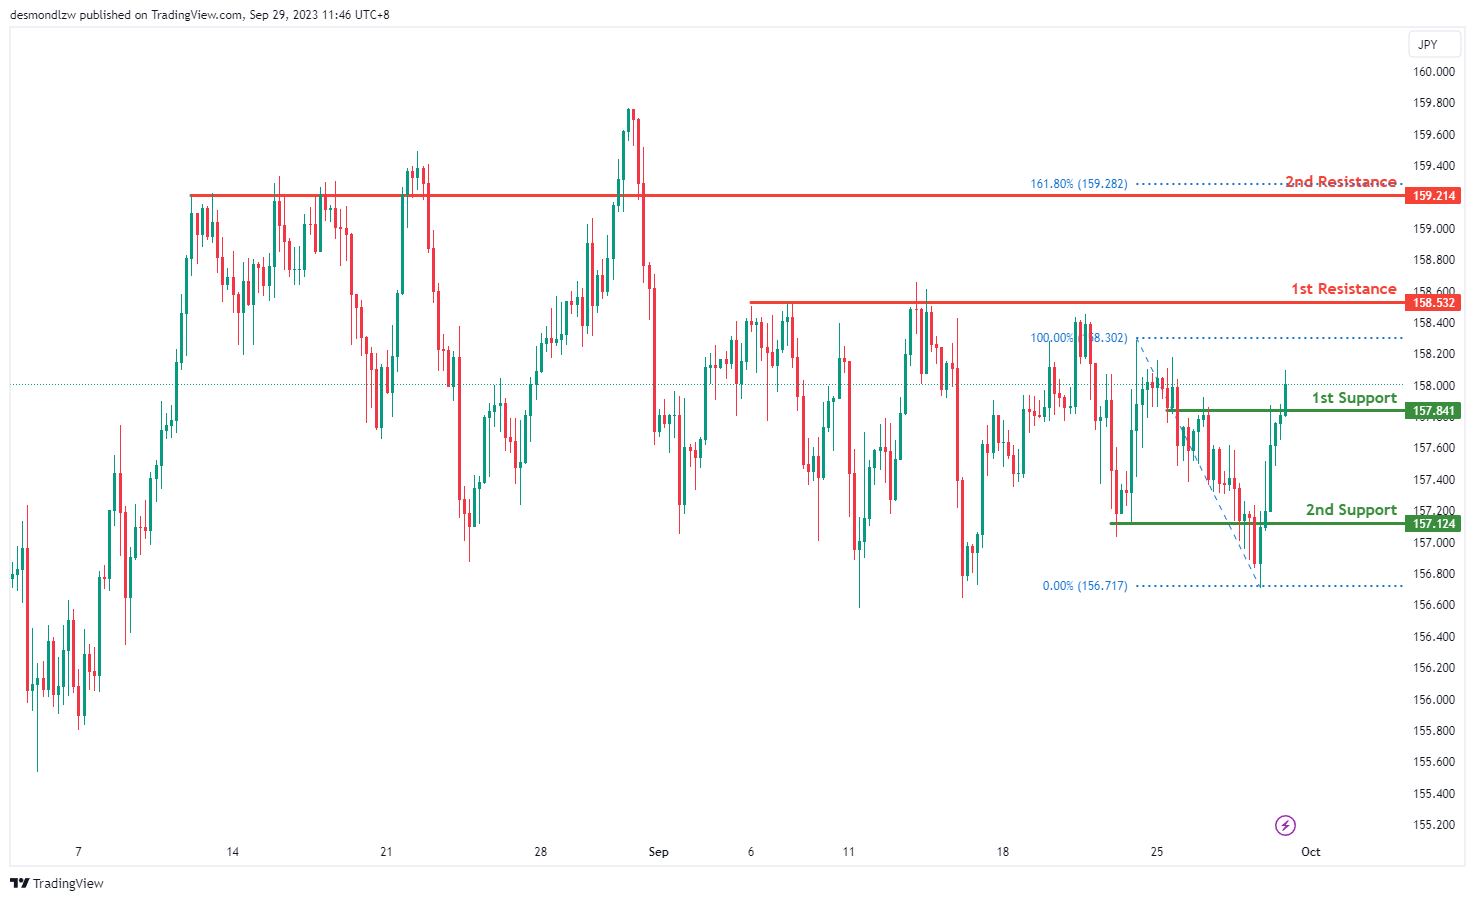
EUR/JPY:
The EUR/JPY chart currently exhibits a bullish overall momentum, indicating a positive sentiment in the market. There’s potential for a bullish continuation in the price movement towards its first resistance.
The first support level at 157.84 is considered a good level of support due to its characteristics as a pullback support, which suggests that it may act as a foundation for any potential bullish movement. Additionally, the second support at 157.12, also identified as a pullback support, provides further reinforcement for the bullish case, indicating potential stability in this price range.
Looking ahead, the chart faces its first resistance at 158.53, which is characterized as a multi-swing high resistance. This level represents a key obstacle that, if breached, could signify a strong bullish move. Beyond this, there is a second resistance at 159.21, identified as a pullback resistance, which may serve as an additional target for bullish price action.
In summary, the bullish momentum in the EUR/JPY chart, supported by pullback supports, suggests the potential for a bullish continuation towards the first and second resistance levels, indicating opportunities for further price appreciation.
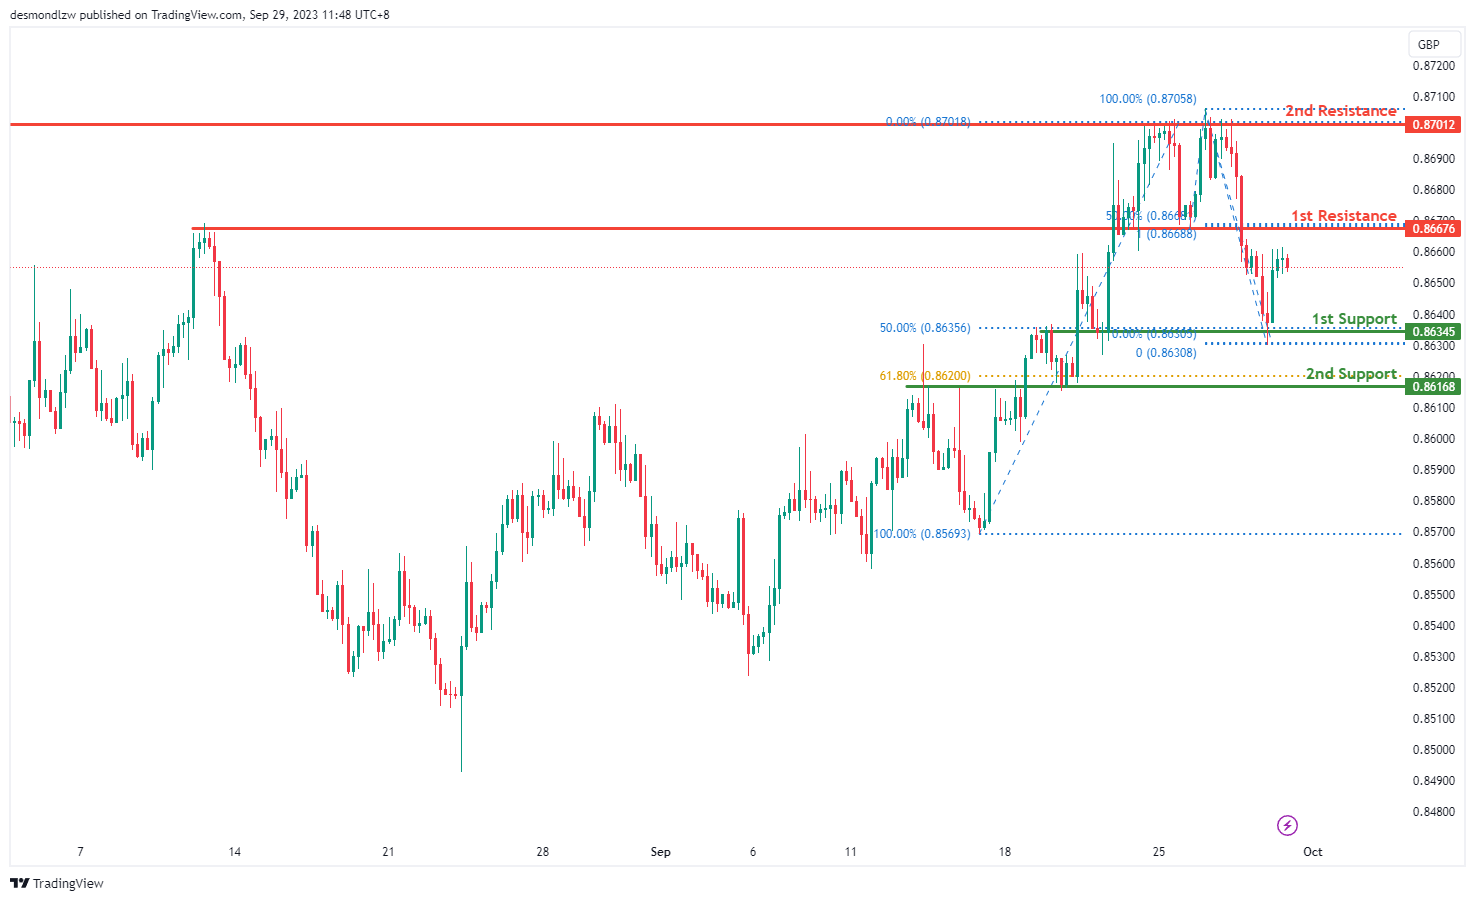
EUR/GBP:
The EUR/GBP chart currently exhibits a bearish overall momentum, suggesting a prevailing downtrend in the market. However, there is a potential short-term price movement anticipated, which could involve a rise towards the first resistance before reversing and declining towards the first support level.
The first support level at 0.8634 is considered a significant support zone as it represents an overlap support and coincides with the 50% Fibonacci Retracement level. This level may act as a foundation for potential price reversals or as a target for bearish movements. Additionally, the second support at 0.8616, identified as an overlap support and aligned with the 61.80% Fibonacci Retracement, provides further support for potential price rebounds.
In the short term, the chart is expected to face its first resistance at 0.8667. This level is characterized as a pullback resistance and coincides with the 50% Fibonacci Retracement, making it a pivotal point where a reversal may occur. Beyond this, there is a second resistance at 0.8701, which is identified as a multi-swing high resistance, signifying a formidable barrier for bullish advances.
In summary, while the overall momentum of the EUR/GBP chart remains bearish, there is a short-term scenario in which the price may rise towards the first resistance before encountering potential selling pressure, leading to a subsequent drop towards the first and second support levels.
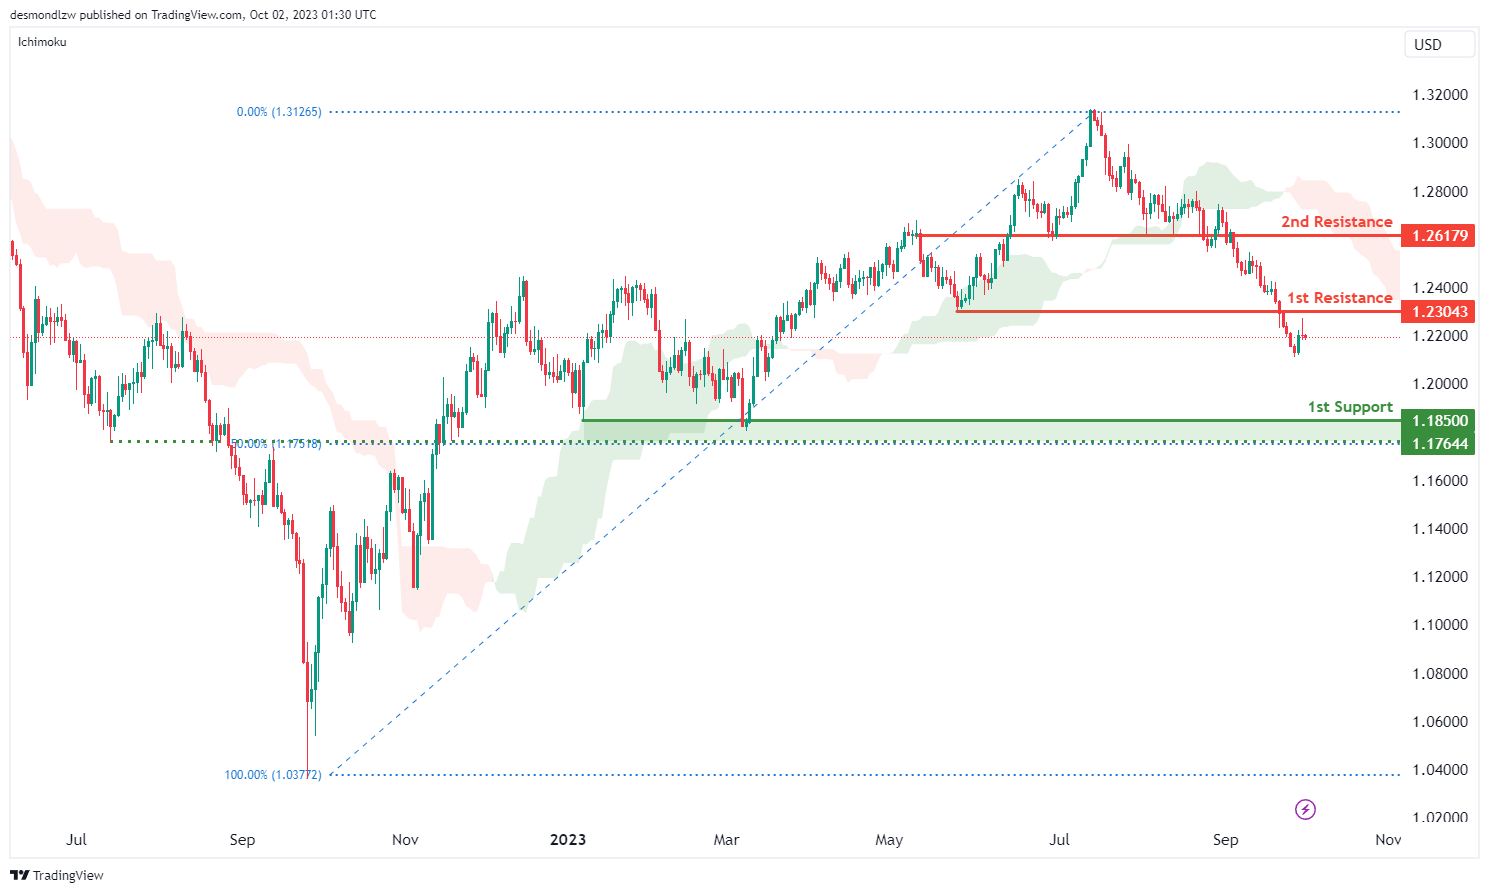
GBP/USD:
The GBP/USD chart currently reflects a bearish overall momentum, primarily attributed to the fact that the price is trading below the bearish Ichimoku cloud.
In this context, there is a potential scenario where the price could continue its bearish movement towards the 1st support at 1.185. This level is significant as it is identified as a swing low support.
Additionally, there is an intermediate support level at 1.1764, which holds importance as it is characterized by an overlap support and aligns with the 50% Fibonacci Retracement, further highlighting its potential as a support zone.
On the resistance side, the 1st resistance level at 1.2304 is noteworthy, marked as a pullback resistance, suggesting its significance as a potential barrier to upward movements. Beyond this, the 2nd resistance at 1.2617 also serves as a pullback resistance,
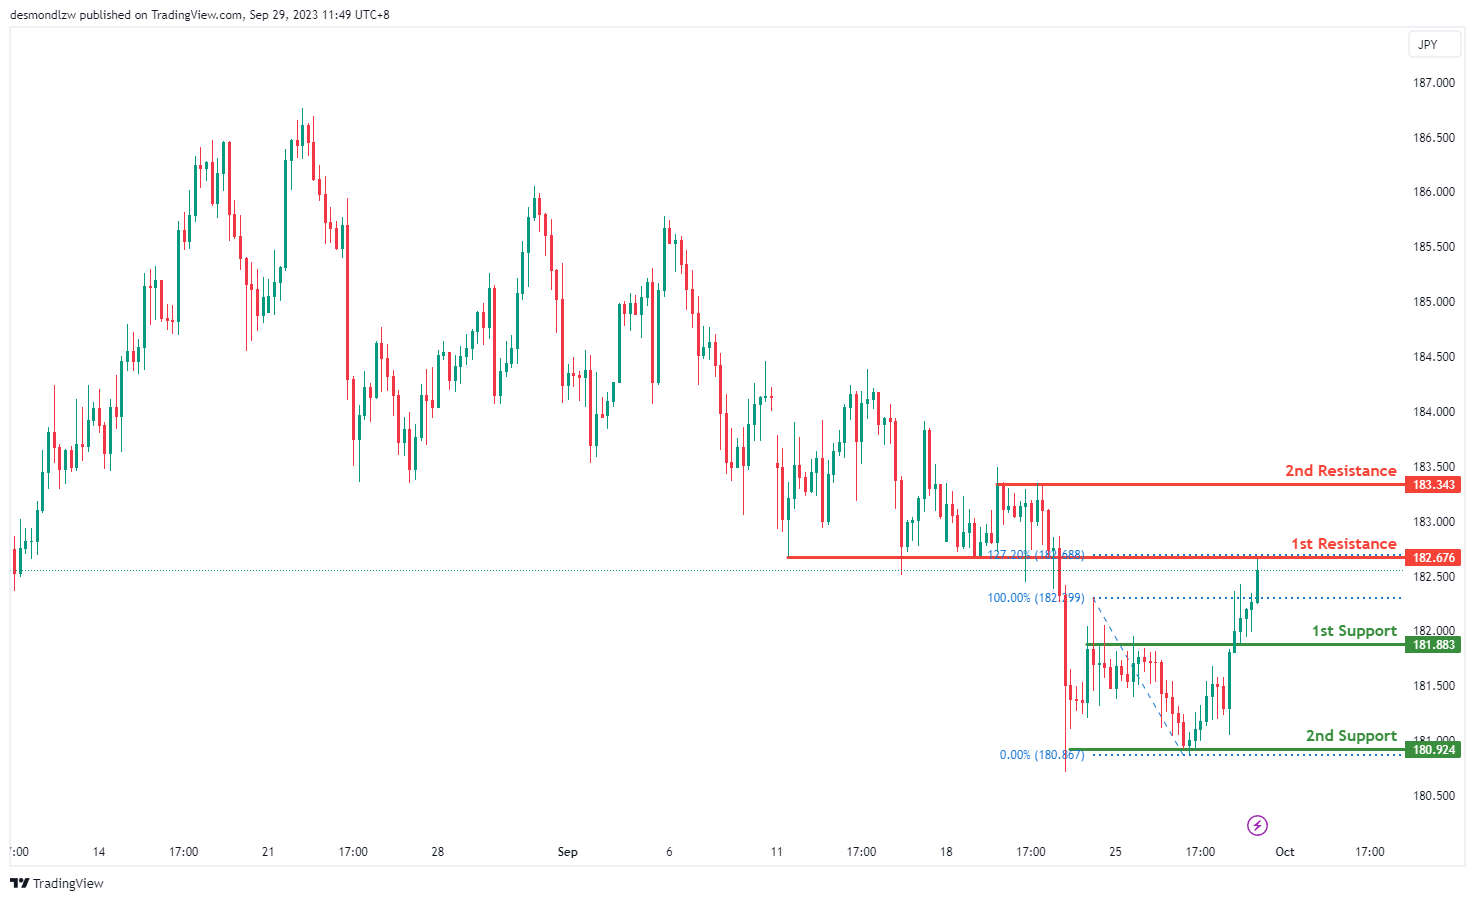
GBP/JPY:
The GBP/JPY chart currently exhibits a bearish overall momentum, indicating a prevailing downtrend in the market. It is anticipated that the price may experience a bearish reaction off the first resistance level, potentially leading to a decline towards the first support.
The first support level at 181.88 is considered a significant support zone, characterized as an overlap support. This level holds historical significance and may act as a strong foundation for potential price rebounds or as a target for bearish movements. Additionally, the second support at 180.92 is identified as a multi-swing low support, reinforcing its significance as a potential level where buyers could step in.
In terms of resistance, the chart is expected to encounter its first resistance at 182.67. This level is defined as a pullback resistance and is further strengthened by the presence of the 127.20% Fibonacci Extension, making it a critical zone for potential reversals or bearish reactions. Beyond this, there is a second resistance at 183.34, identified as a multi-swing high resistance, indicating a substantial barrier for bullish advances.
In summary, while the overall momentum of the GBP/JPY chart remains bearish, there is a scenario in which the price could react bearishly off the first resistance and decline towards the first and second support levels.
USD/CHF:
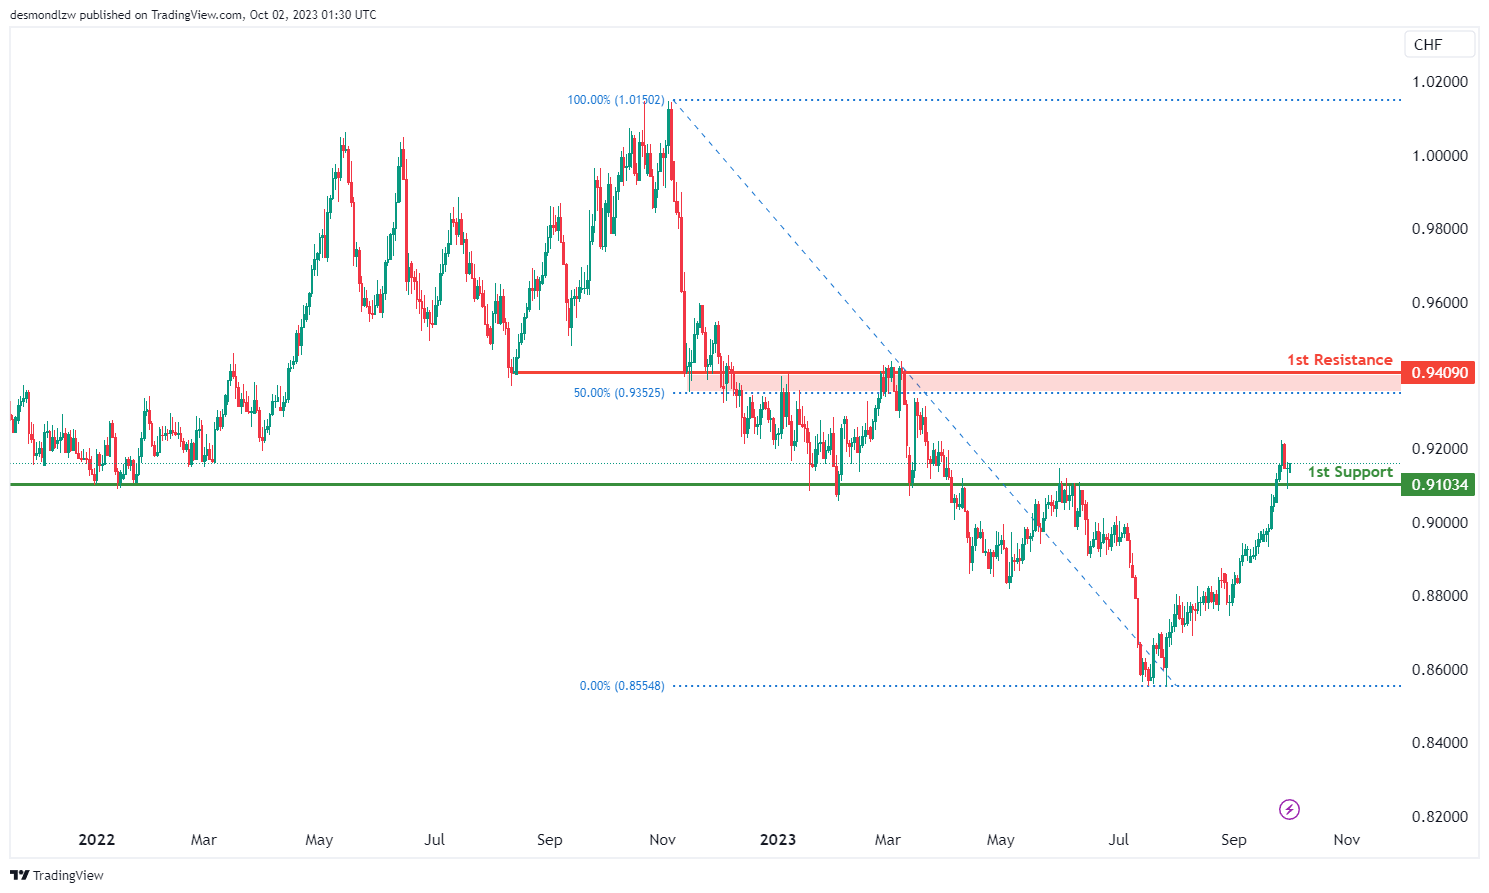
The USD/CHF chart currently exhibits a bullish overall momentum.
In this context, there is a potential scenario where the price might experience a bullish bounce off the 1st support at 0.9103, which is identified as an overlap support.
On the resistance side, the 1st resistance level at 0.9409 is significant, marked as an overlap resistance and aligning with the 50% level.
USD/JPY:
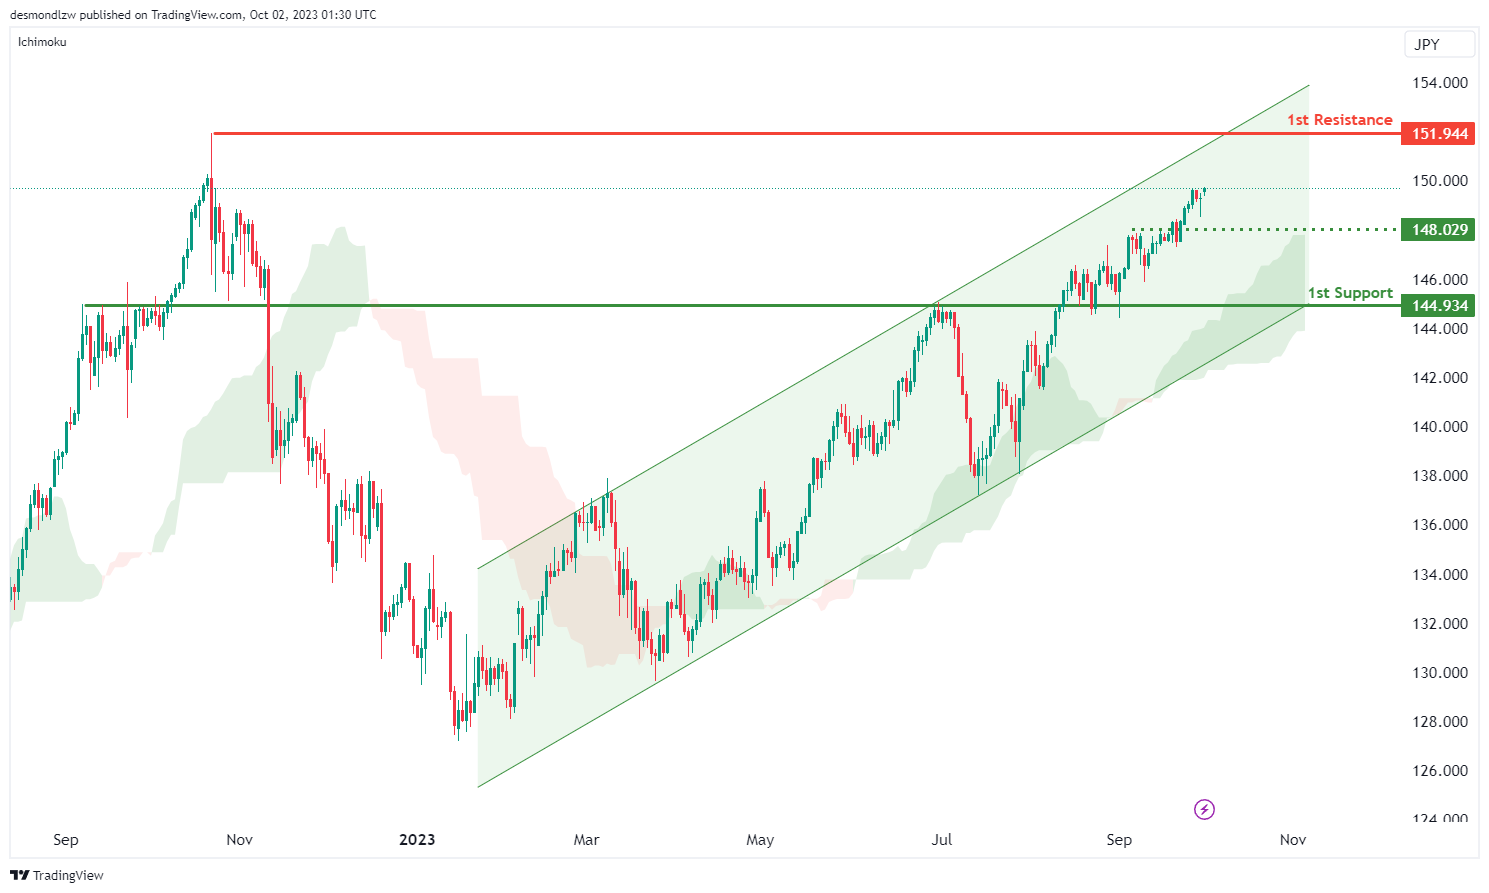
The instrument in question is USD/JPY, and the overall chart momentum currently leans bullish. This bullish sentiment is substantiated by two key factors: the price is positioned above the bullish Ichimoku cloud, and it is also within a bullish ascending channel. These factors suggest that the price might continue its upward trajectory due to its bullish momentum.
In terms of support and resistance levels, the first support is identified at 144.93, characterized as an overlap support. An intermediate support level is situated at 148.02, serving as a pullback support. On the resistance side, the first resistance level is at 151.94, marked as a swing high resistance.
USD/CAD:
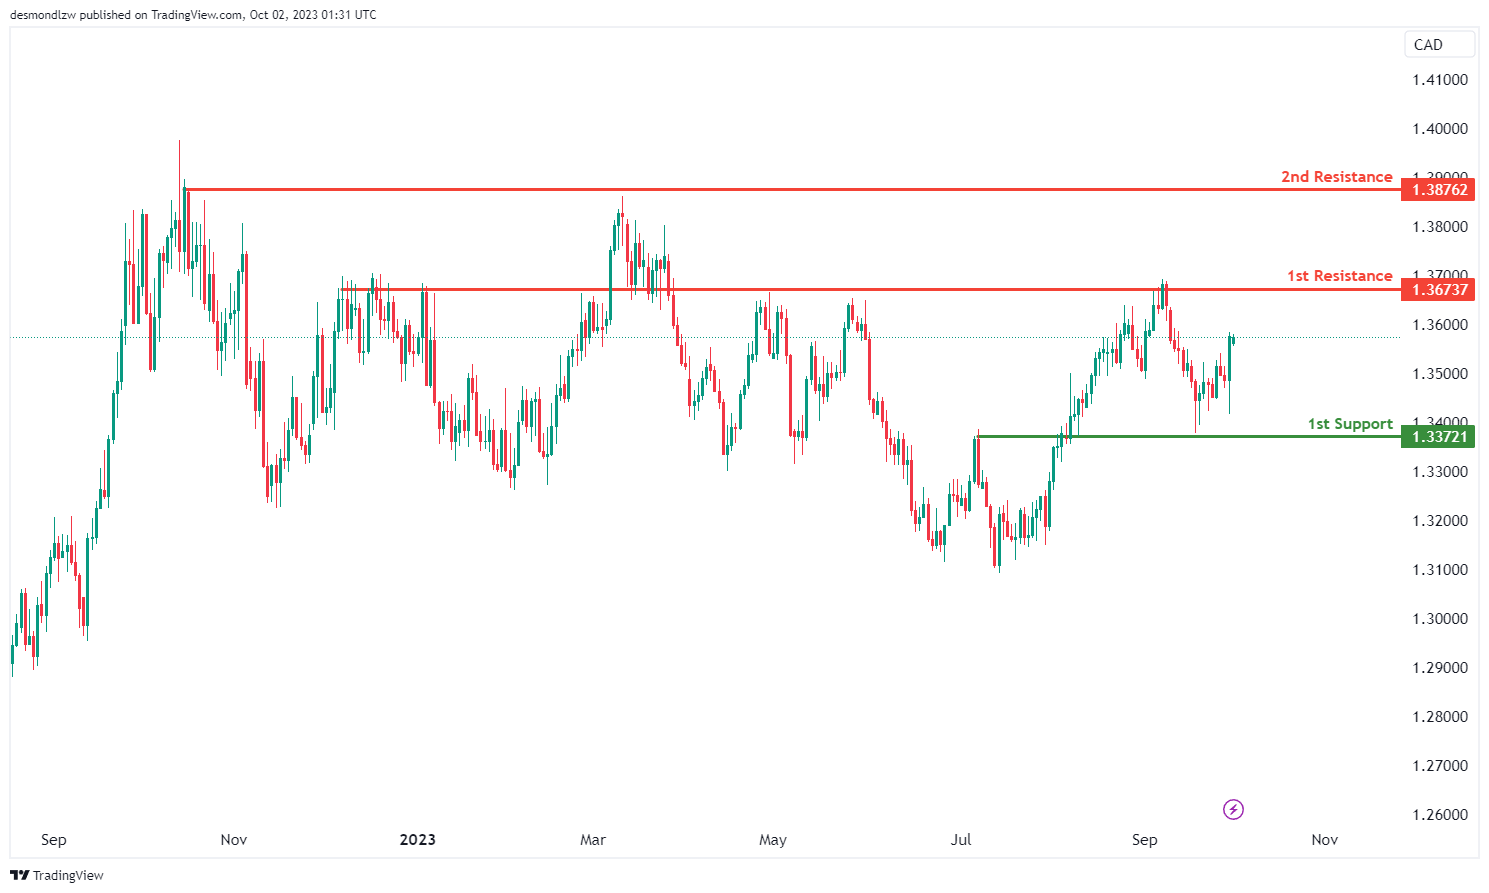
The USD/CAD chart currently exhibits a bullish momentum, indicating a potential bullish continuation towards the 1st resistance level.
On the support side, the 1st support at 1.3372 is identified as an overlap support, which might provide a level of price stability.
Conversely, the 1st resistance at 1.3673 is considered an overlap resistance, while the 2nd resistance at 1.3876 is recognized as a swing high resistance
AUD/USD:
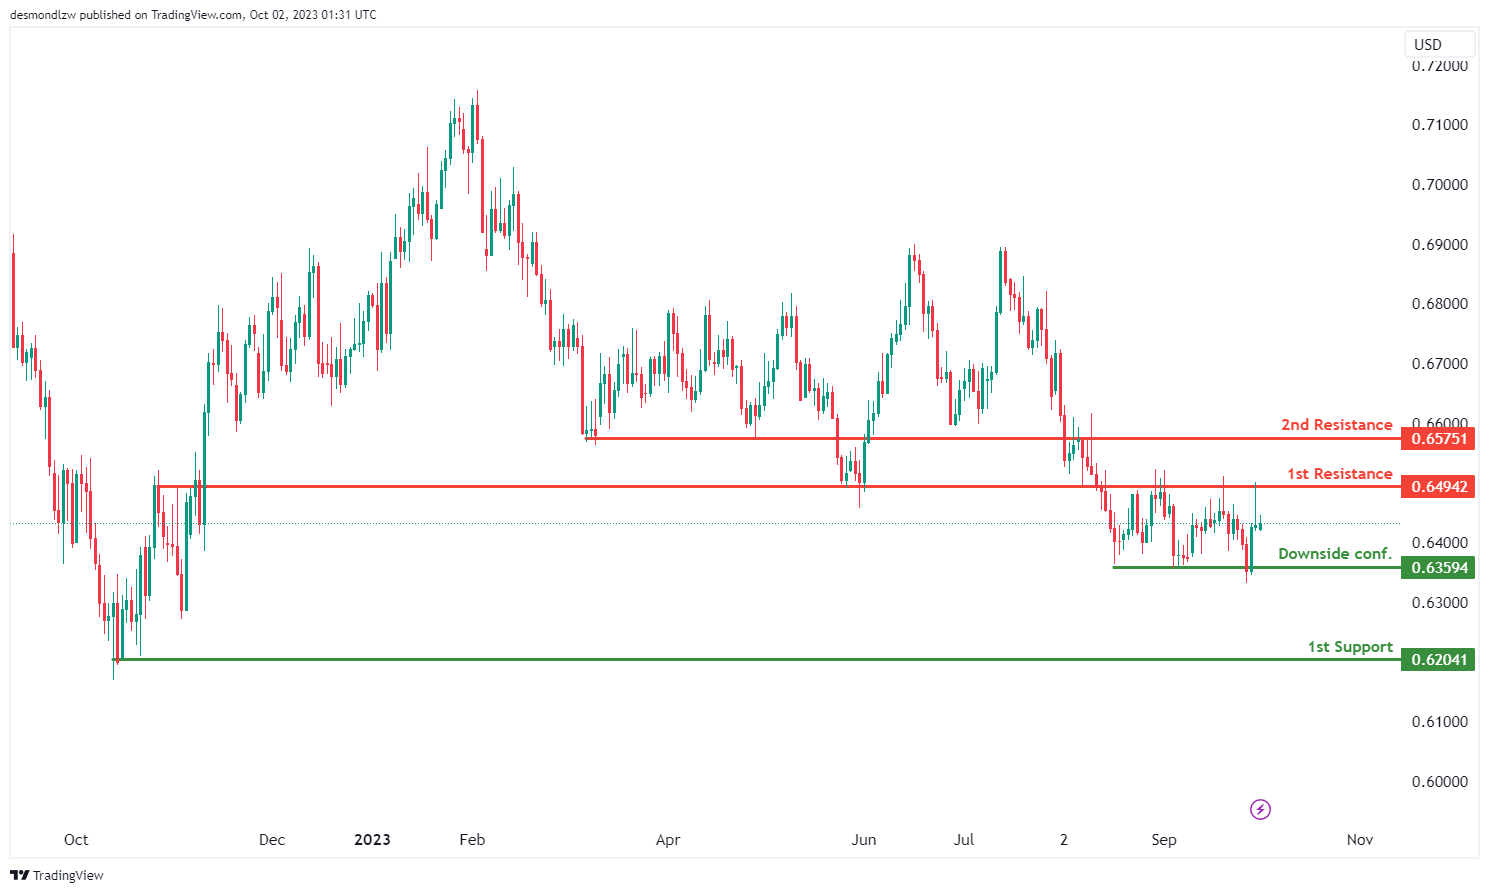
The AUD/USD chart is currently experiencing a neutral momentum, suggesting that price could potentially fluctuate between the 1st support at 0.6204 and the 1st resistance at 0.6494.
Additionally, there is a waiting phase for downside confirmation, with a level at 0.6359 considered as a multi-swing low support, which might provide insights into the future price direction.
On the resistance side, the 1st resistance at 0.6494 is identified as an overlap resistance, and beyond that, the 2nd resistance at 0.6575 also holds significance as an overlap resistance
NZD/USD
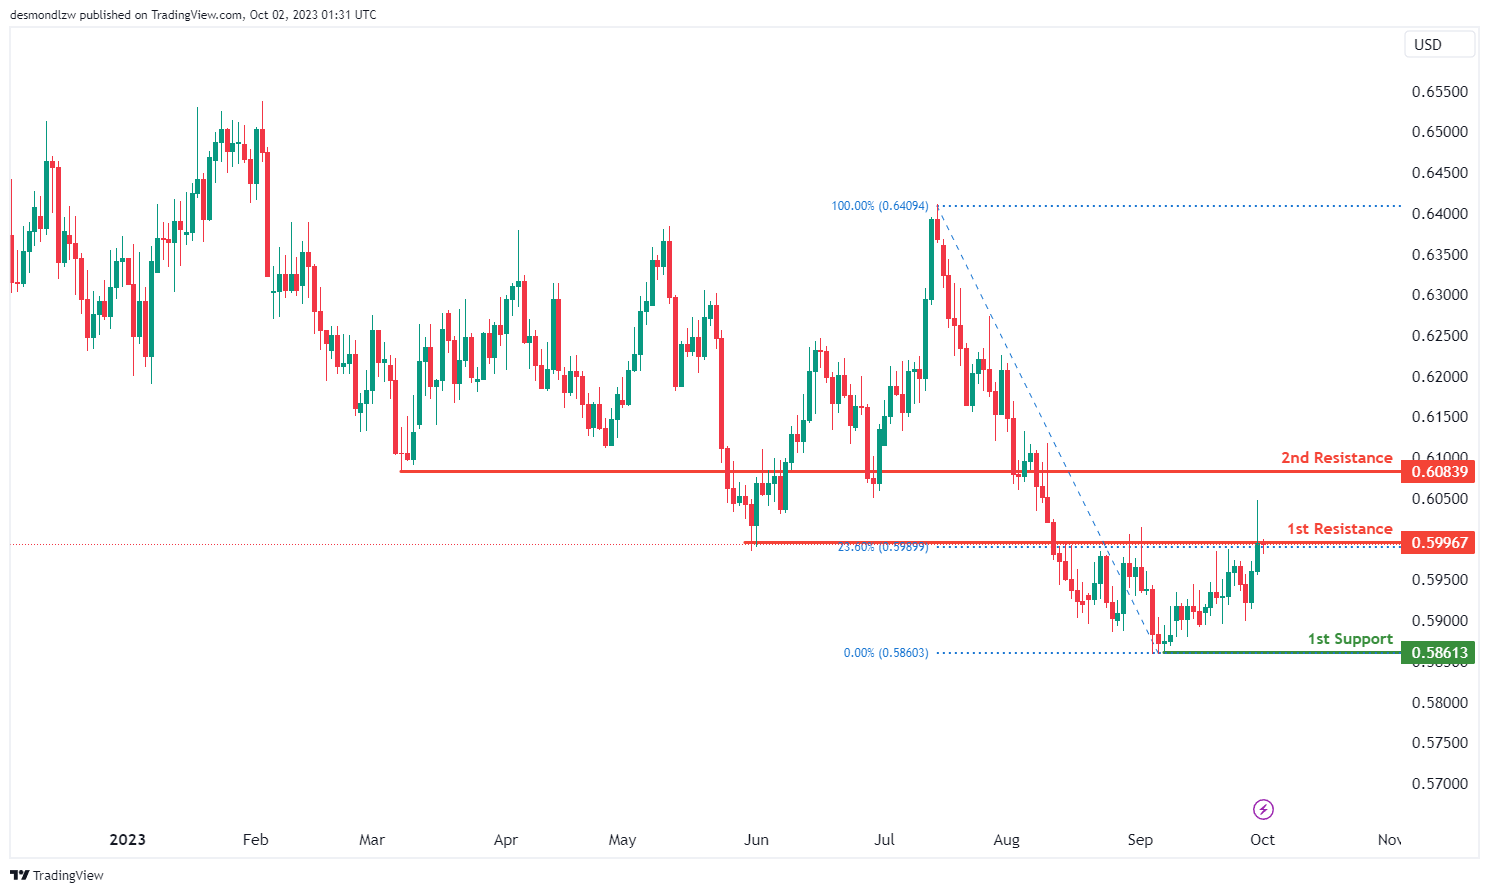
The NZD/USD chart currently indicates bearish momentum, suggesting the possibility of a bearish reaction off the 1st resistance level at 0.5996, followed by a potential drop to the 1st support level at 0.5861. The 1st support level is significant as it is identified as a swing low support.
On the resistance side, the 1st resistance at 0.5996 is notable, characterized as an overlap resistance with the added feature of aligning with the 23.60% Fibonacci Retracement. Additionally, the 2nd resistance at 0.6083 is also identified as an overlap resistance
DJ30:
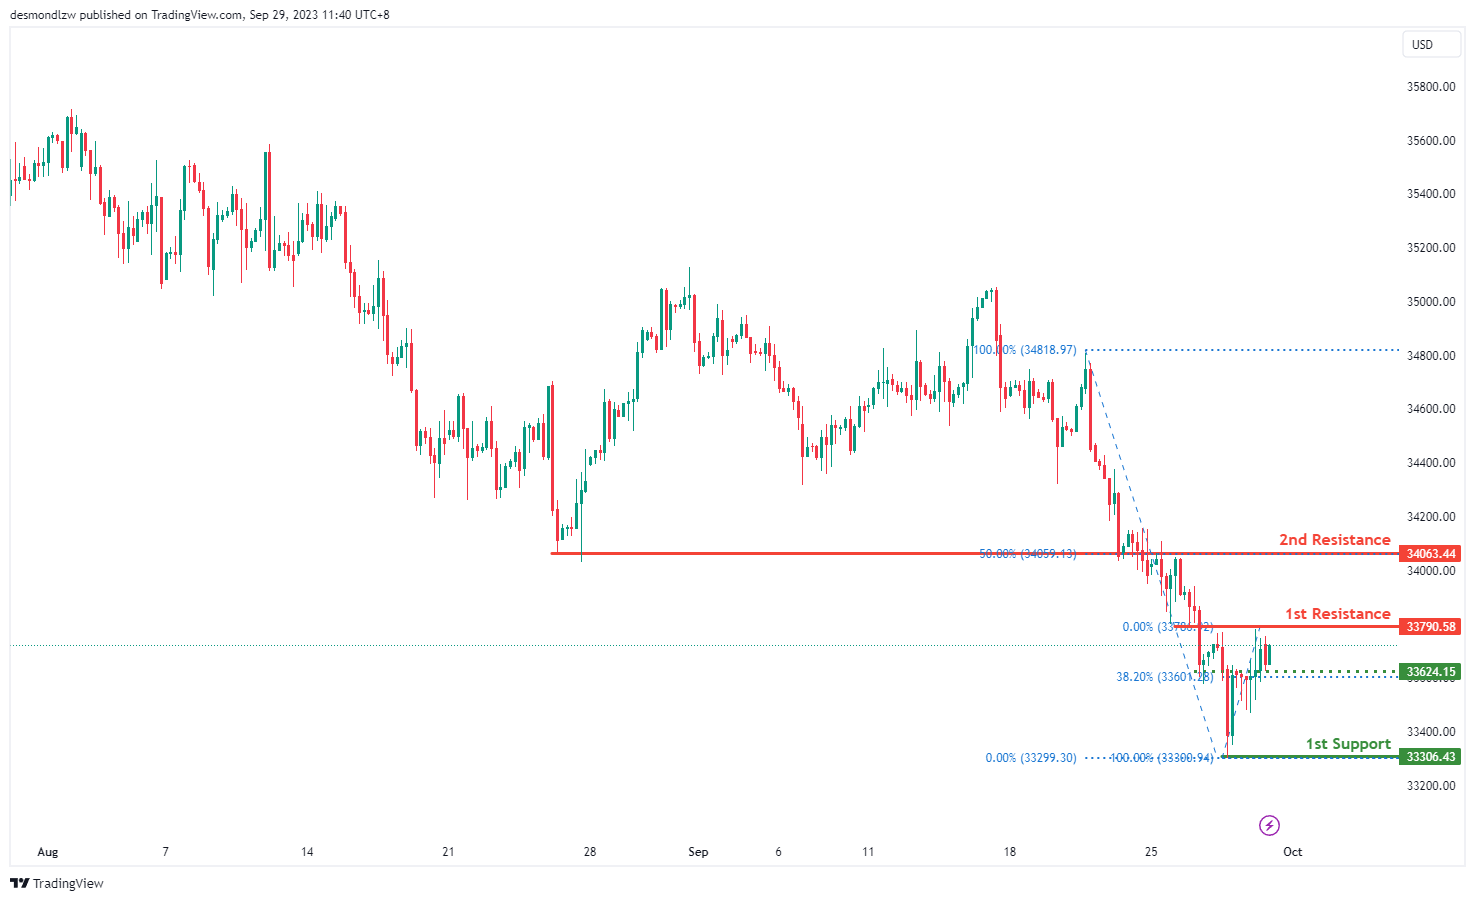
The DJ30 (Dow Jones Industrial Average) chart currently shows a bearish overall momentum, and there is a potential scenario where the price could react bearishly from the 1st resistance and decline towards the 1st support.
The 1st support level at 33,306.43 is considered a significant level because it corresponds to a swing low support. Swing lows represent historical price levels where buying interest has previously emerged, making this level a strong candidate for providing support in a bearish scenario.
There is an intermediate support level at 33,624.15, which is identified as an overlap support. This level coincides with the 38.20% Fibonacci Retracement, adding to its significance. Fibonacci retracement levels are frequently watched by traders for potential reversals or areas of support and resistance.
On the resistance side, the 1st resistance level at 33,790.58 is recognized as an overlap resistance. Overlap resistances often act as barriers to further price increases, as traders may use these levels to take profits or establish short positions.
Above the 1st resistance, the 2nd resistance level at 34,063.44 is noted as an overlap resistance and is also positioned at the 50% Fibonacci Retracement level.
GER30:
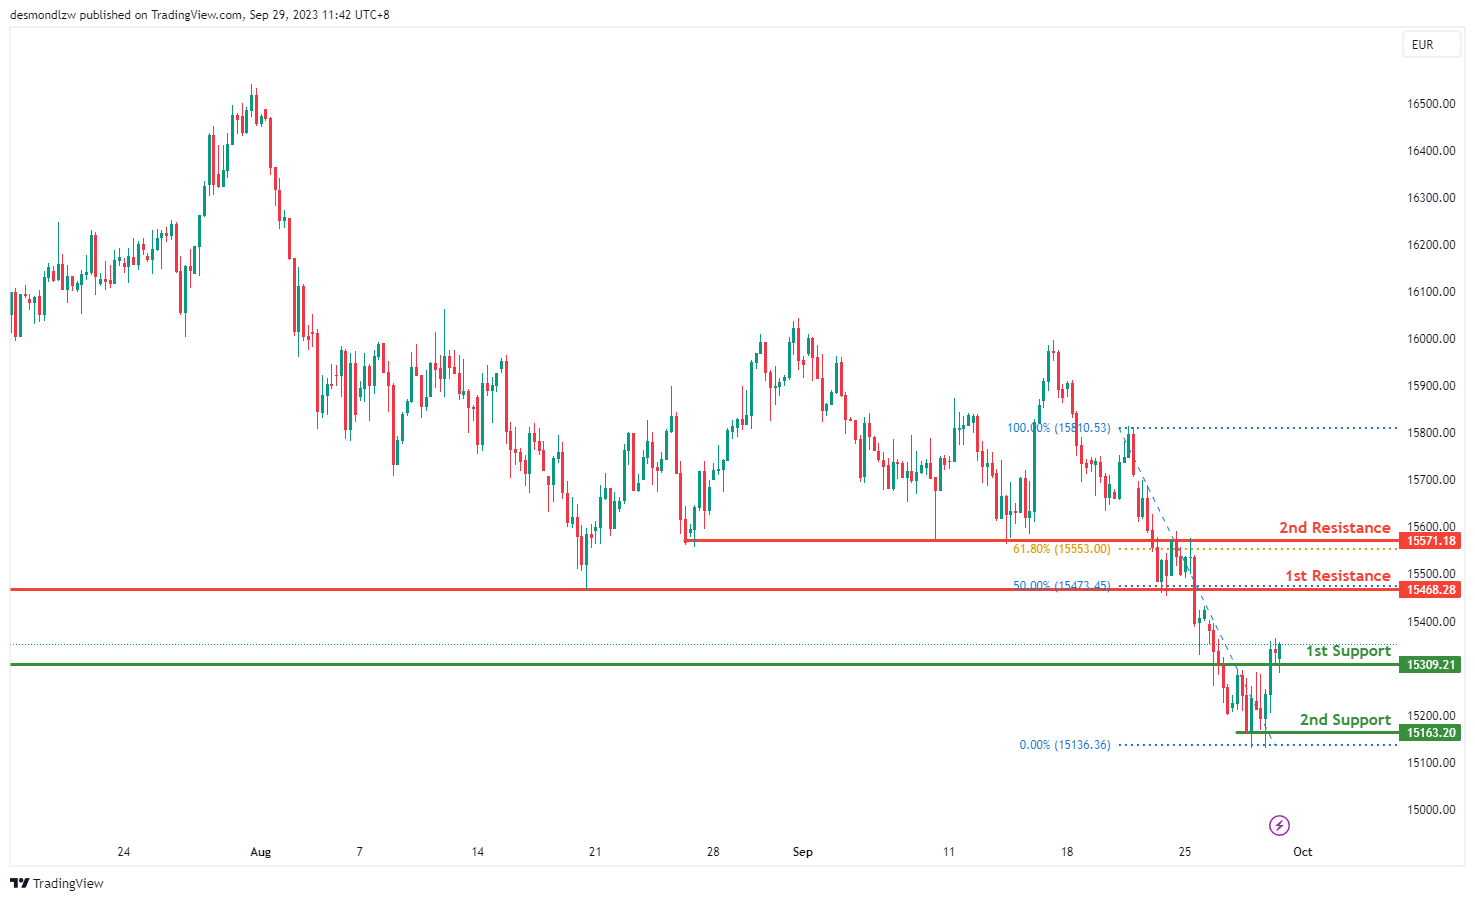
The GER30 (Germany 30) chart currently displays a bullish overall momentum, suggesting a positive sentiment in the market. There is a potential scenario in which the price could experience a bullish bounce off the 1st support and subsequently move towards the 1st resistance.
The 1st support level at 15,309.21 is considered a strong support zone as it corresponds to an overlap support. Overlap supports often indicate areas where the price has previously found support and may attract buying interest again.
The 2nd support level at 15,163.20 is another notable support level, identified as a multi-swing low support. This level reinforces the potential for support in the event of a price pullback.
On the resistance side, the 1st resistance level at 15,468.28 is identified as a pullback resistance. This level coincides with the 50% Fibonacci Retracement, a key technical level used by traders to identify potential reversals or areas of resistance.
Above the 1st resistance, the 2nd resistance level at 15,571.18 is marked as an overlap resistance and is also positioned at the 61.80% Fibonacci Retracement.
US500
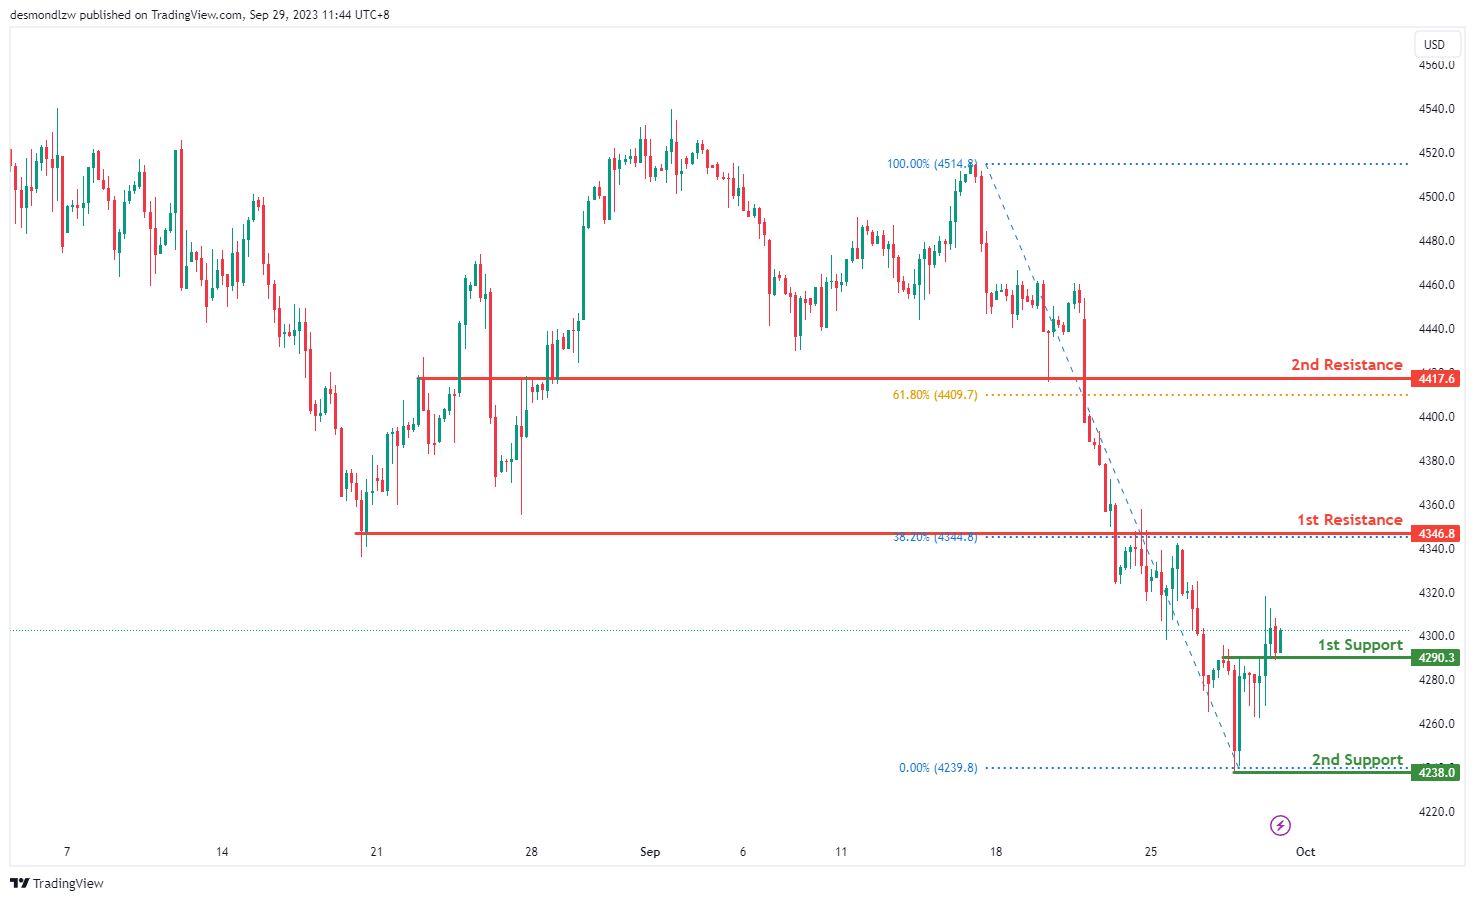
The US500 chart currently exhibits a bullish overall momentum, with several factors contributing to this positive sentiment. Notably, the price has the potential to experience a bullish bounce off its first support level at 4290.3, which is identified as an overlap support. Additionally, the presence of a swing low support at 4238.0 further strengthens the case for a bullish move.
Looking ahead, the chart faces its first resistance at 4346.8, which is characterized by both an overlap resistance and a 38.20% Fibonacci Retracement level. This level represents a significant obstacle that, if overcome, could propel the price higher. Beyond this, there is a second resistance at 4417.6, which serves as a pullback resistance and aligns with a 61.80% Fibonacci Retracement, offering another potential target for bullish movement.
In summary, the US500 chart’s bullish momentum, supported by overlap and swing low supports, suggests the possibility of a bullish bounce at the first support level and a subsequent move towards the first and second resistance levels, which present opportunities for further price appreciation.
BTC/USD:
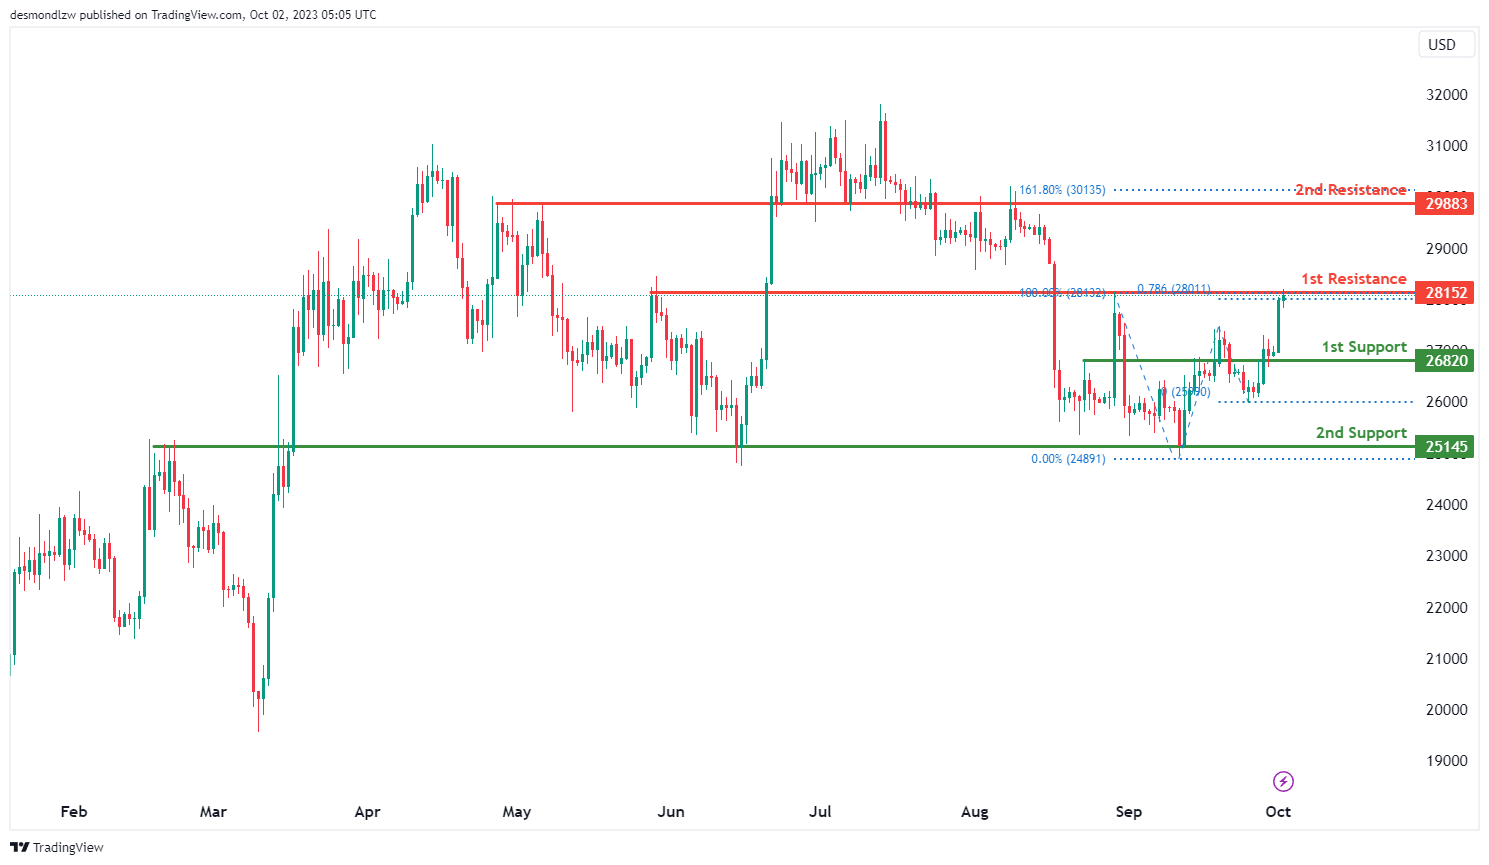
The BTC/USD chart is currently characterized by a bearish overall momentum, indicating a prevailing downtrend in the market. Several factors contribute to this bearish sentiment.
Price is anticipated to potentially experience a bearish reaction off the first resistance level at 28,152. This level is considered significant as it represents an overlap resistance, suggesting a historical point where selling pressure may emerge. Additionally, the presence of the 78.60% Fibonacci Projection adds further confluence to the resistance, making it a critical level to watch for potential reversals or bearish movements.
In contrast, the chart has two support levels that could potentially come into play. The first support at 26,820 is identified as a pullback support, signifying a level where buyers might step in or where price retracements could find support. Further strengthening the support is the second support at 25,145, which is characterized as an overlap support. This level has historical significance and could act as a substantial foundation for potential price rebounds.
ETH/USD:
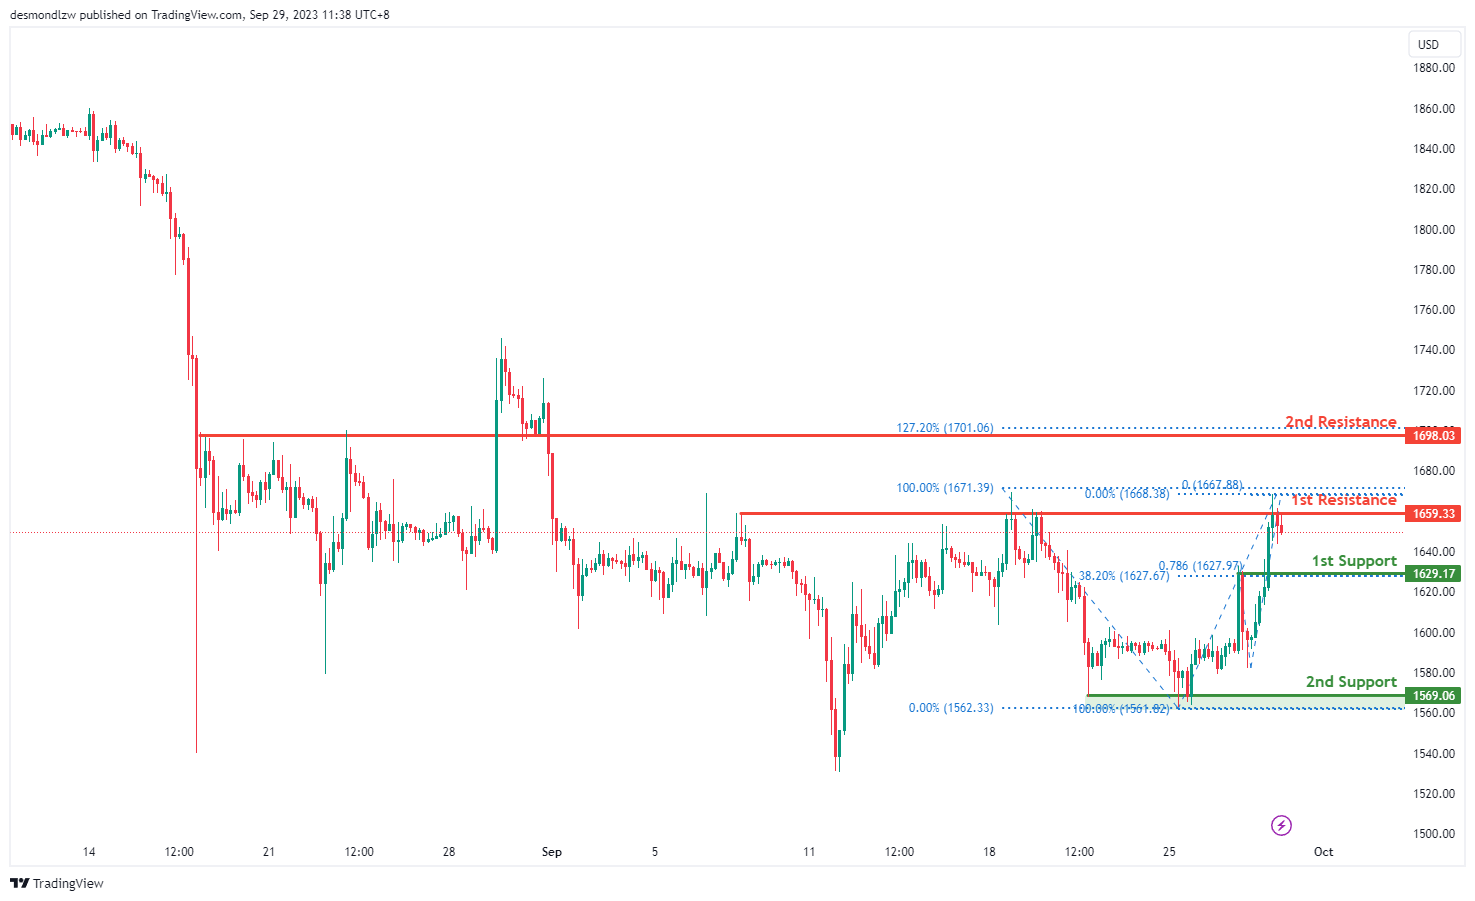
The ETH/USD chart currently exhibits a bullish overall momentum, but there is a potential short-term bearish scenario to consider, followed by a subsequent bullish move.
The 1st support level at 1,629.17 is identified as a pullback support. This level holds significance as it aligns with the 38.20% Fibonacci Retracement and the 78.60% Fibonacci Retracement, indicating a strong Fibonacci confluence. Traders often look at such confluence areas as potential reversal zones where buying interest may surge, leading to a bounce in prices.
The 2nd support level at 1,532.48 corresponds to a swing low support. Swing lows are historical price levels where buying interest has emerged, making this level a strong candidate for providing support in a bearish scenario.
In the short term, the price could potentially drop further to test the 1st support level. This move may be driven by profit-taking or short-term bearish sentiment.
However, the chart’s overall bullish momentum suggests that after reaching the 1st support, there is a possibility of a bounce. Traders may see this as an opportunity to enter bullish positions.
On the resistance side, the 1st resistance level at 1,659.33 is identified as a multi-swing high resistance. This level could potentially act as a barrier to further price advancement, as traders who missed earlier opportunities to sell may enter the market at this point.
Above that, the 2nd resistance level at 1,698.03 is noted as a pullback resistance. This level presents an additional hurdle for bullish price movements.
WTI/USD:
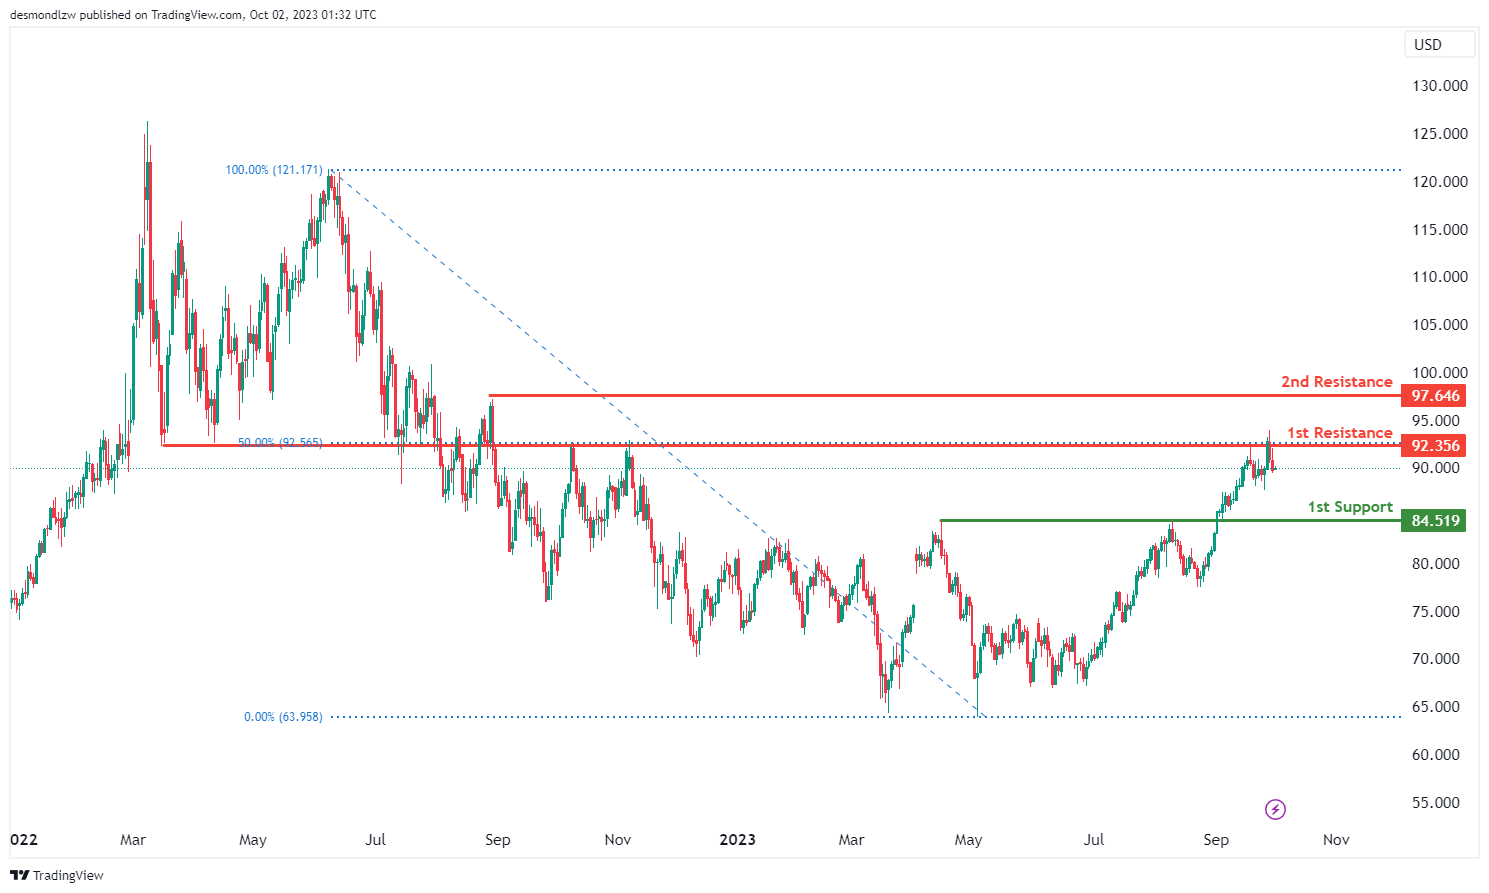
The WTI chart currently exhibits a bearish overall momentum, indicating the possibility of a bearish continuation towards the 1st support level at 84.51. This support level is significant as it is identified as an overlap support.
On the resistance side, the 1st resistance at 92.35 is noteworthy and characterized as an overlap resistance with the additional feature of aligning with the 50% Fibonacci Retracement. Beyond this, the 2nd resistance at 97.64 serves as a swing high resistance
XAU/USD (GOLD):
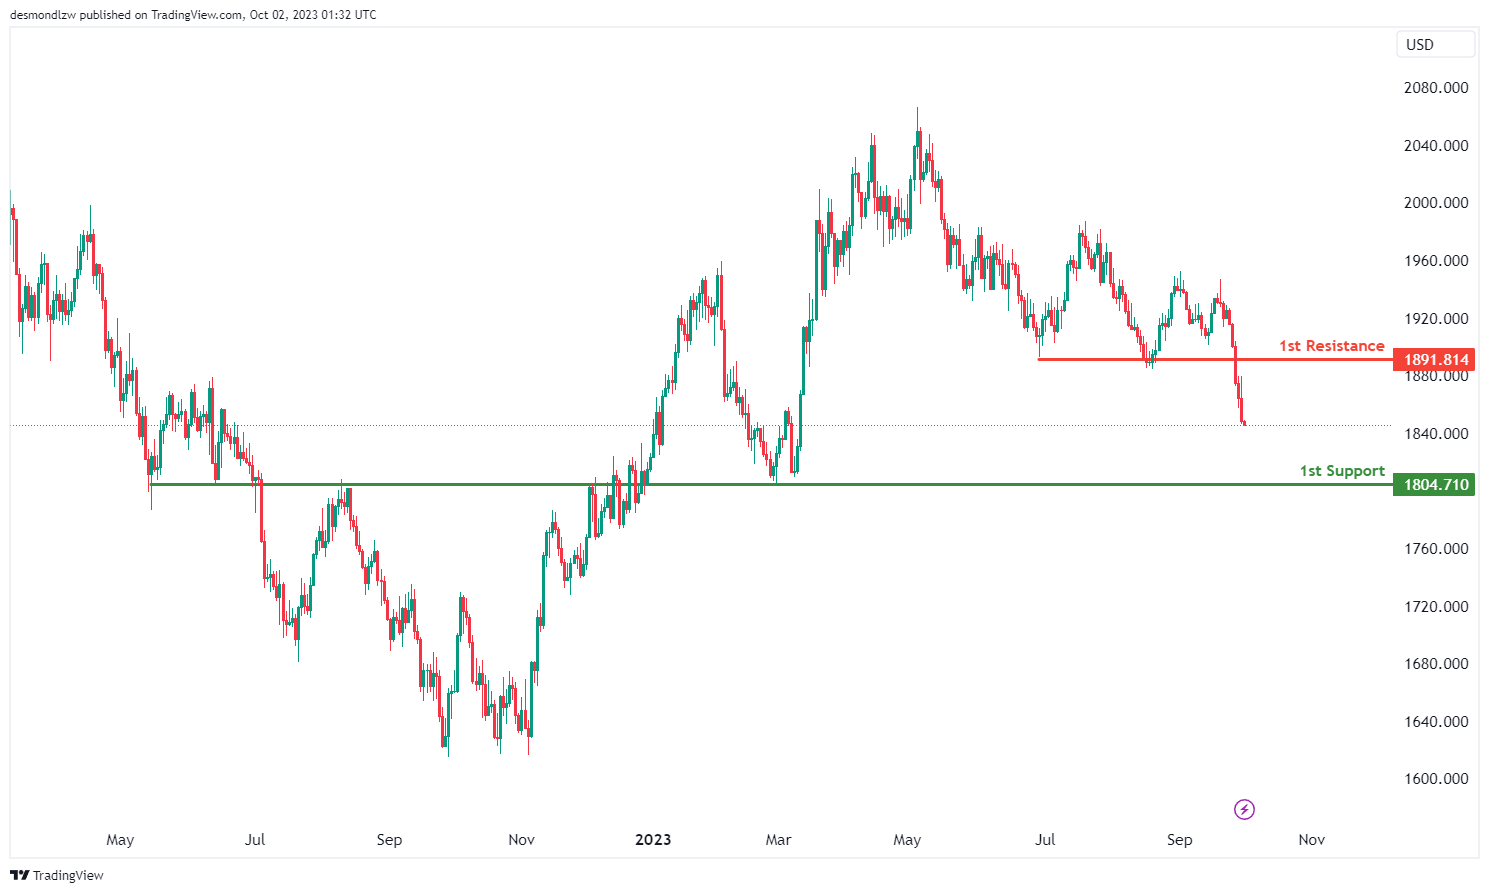
The XAU/USD chart presently reflects a bearish overall momentum, suggesting a potential bearish continuation towards the 1st support level at 1804.71. This level is considered significant as it’s identified as an overlap support.
On the resistance side, the 1st resistance at 1891.81 is noteworthy, characterized as a pullback resistance. This resistance level may pose a barrier to further price increases.
USD/JPY Daily Outlook
Daily Pivots: (S1) 148.76; (P) 149.13; (R1) 149.73; More...
USD/JPY's rally resumed today by breaking through 149.70 resistance and intraday bias is back on the upside. Current rise from 127.20 should target a retest on 151.93 high next. On the downside, break of 148.51 support is needed to indicate short term topping. Otherwise, outlook will stay bullish in case of retreat.
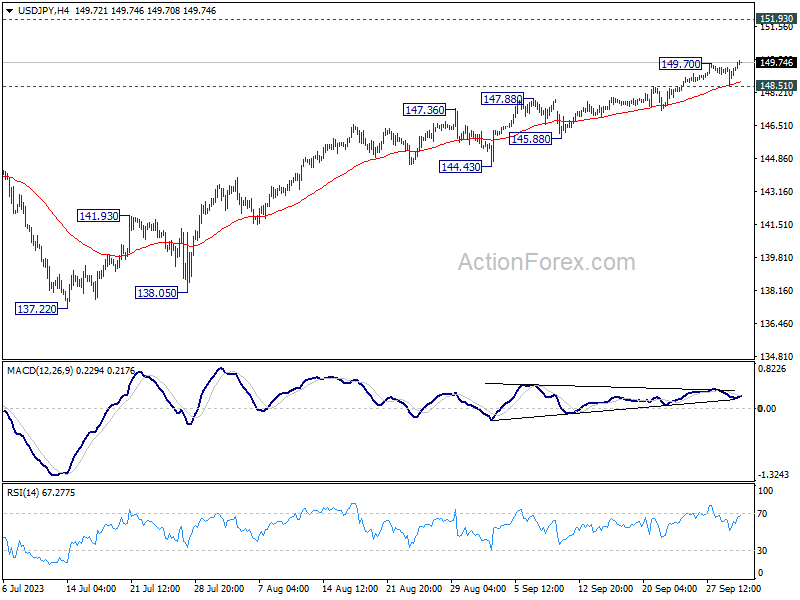
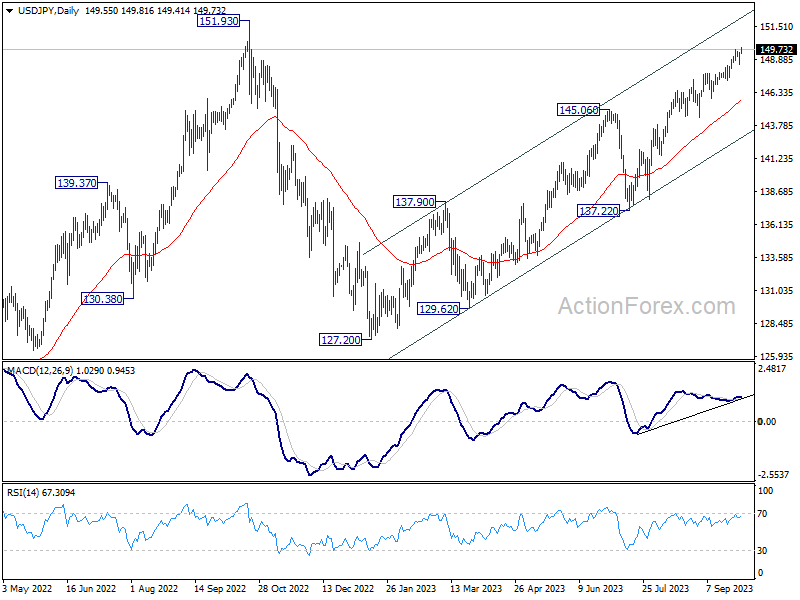
In the bigger picture, while rise from 127.20 is strong, it could still be seen as the second leg of the corrective pattern from 151.93 (2022 high). Rejection by 151.93, followed by break of 145.06 resistance turned support will be the first sign that the third leg of the pattern has started. However, sustained break of 151.93 will confirm resumption of long term up trend.
USD/JPY Nears 150, AUD/NZD Slides; US Data, RBA and RBNZ Eyed
USD/JPY is making notable advances today, resuming recent up trend, and edging closer to 150 psychological handle. AT the same time, Nikkei rebounds, reclaiming 32000 mark. The combined risk-on sentiment could be attributed to investors' positive response to the optimistic quarterly Tankan survey results, overshadowing the less favorable PMI Manufacturing data.
Despite Japan's repeated attempts at verbal interventions, their impact appears to be waning as market players seem getting increasingly indifferent to these remarks. A focus is now shifting to the sustainability of USD/JPY's current upside momentum, especially as the greenback is poised to face significant tests with the release of ISM indexes and non-farm payroll data in the coming data.
In the broader currency market panorama, Canadian dollar is riding the wave alongside US Dollar. Contrarily, Australian and New Zealand Dollars are trailing, displaying weakness in tandem with Yen. Sterling and Swiss Franc are exhibiting slight softness against Euro, but movements between European majors remain within familiar ranges.
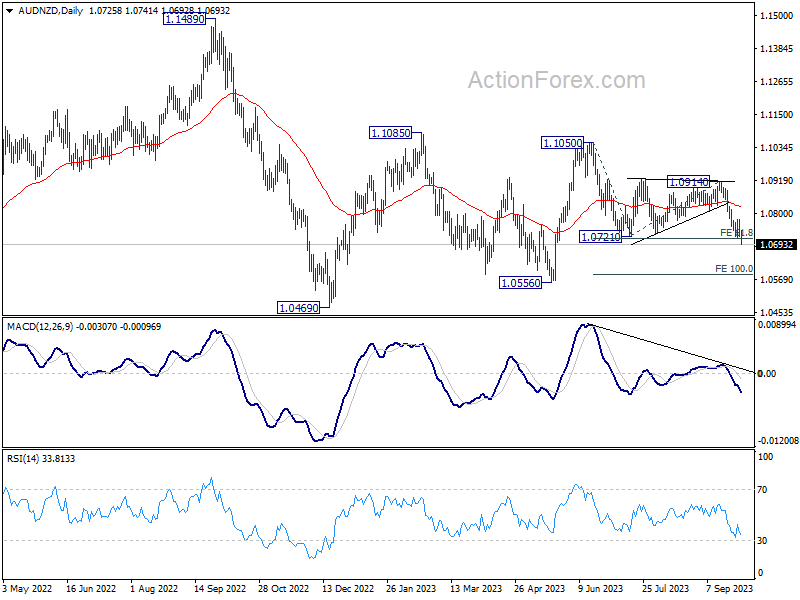
An essential development to monitor is the ongoing decline of AUD/NZD, especially with upcoming rate decisions from both RBA and RBNZ. Analysts predict both banks to maintain their interest rates unchanged. Technically, near term outlook in AUD/NZD will remain bearish as long as 1.0779 resistance holds. With 61.8% projection of 1.1050 to 1.0721 from 1.0914 at 1.0711 taken out, next target is 100% projection at 1.0585. Reaction from there will reveal whether the cross is resuming the down trend from 1.1489 (2022 high).
 In Asia, at the time of writing, Nikkei is up 0.25%. Japan 10-year JGB yield is up 0.0087 at 0.780. Singapore Strait Times is down -0.08%. Hong Kong and China are on holiday.
BoJ opinions: A blend of caution and optimism
Summary of Opinions of BoJ's September 21-22 meeting reiterated the general stance that ultra-loose monetary policy remains necessary for now. Yet, there was an undercurrent of optimism, with some members seeing achieve of price target "in sight".
The collective view reinforced that the "sustainable and stable achievement of the price stability target, accompanied by wage increases, has not yet come in sight." Given this scenario, the summary stressed the necessity to "patiently continue with monetary easing under yield curve control."
Underpinning the continued focus on wages, one member stated it is "necessary" to uphold the "momentum for wage hikes through continuation of monetary easing." Also, in order to achieve inflation target of 2 percent in a sustainable manner, it is necessary that "wage increases take root."
However, amid the cautious tones, rays of optimism emerged. One member opined that "Japan's economy is getting closer to achieving the price stability target, although there is somewhat of a distance to go." Providing a potential timeline for evaluating the price stability objective, focus is now on "the second half of fiscal 2023" especially considering the wage growth prospects for 2024.
Furthering this optimism, another viewpoint conveyed confidence, indicating that "Achievement of 2 percent inflation in a sustainable and stable manner seems to have clearly come in sight." This perspective also hinted at a clearer outcome by "January to March of next year."
Japan's Tankan survey reveals strong business sentiment
The latest Tankan survey results in Q3 showcased strengthening corporate sentiment in Japan. Key indices and outlooks, along with projections for capital expenditure, underscore a robust business environment, as inflation expectations maintain steadiness.
Large Manufacturing Index showed notable gains from 5 to 9, marking its second consecutive quarter of growth. Concurrently, Large Non-Manufacturing Index advanced from 23 to 27, recording its best level since 1991 and marking its sixth straight quarter of improvement.
Further reflecting this positive trend, Large Manufacturing Outlook Index increased from 9 to 10, while its Large Non-Manufacturing Outlook saw an ascent from 20 to 21.
In terms of capital commitments, prominent firms revealed ambitious plans, with an anticipation to bolster capital expenditure by 13.6% for the fiscal year ending March 2024.
Regarding inflation, the corporate sector's expectations remain consistent. Firms anticipate a price increase of 2.5% in the upcoming year, 2.2% over a three-year horizon, and 2.1% looking five years ahead. These figures mirror projections made in the prior quarter.
A crucial insight from a BOJ official noted that many large businesses have successfully offset higher costs by adjusting consumer prices, subsequently enhancing the overall business sentiment.
Further elevating the positive mood have been factors such as a resurgence in auto production and declining costs for raw materials. However, the official also acknowledged the challenges faced by some smaller enterprises, which have found it difficult to raise their prices.
Japan PMI manufacturing finalized at 48.5 in Sep, headwinds at home and abroad
Japanese manufacturing sector is facing challenges as evidenced by the drop in PMI Manufacturing to 48.5 in September, down from August's 49.6, the lowest level since February. Additionally, the average reading for Q3 stands at 49.3, a reduction from 50.0 in Q2.
According to key findings by S&P Global, the sector experienced faster falls in production and incoming new work. Alarmingly, backlogs declined at the strongest rate since April. A specific area of concern is the accelerated rate of input price inflation, reaching a four-month high, fueled by increasing costs of raw materials, oil, freight, and energy.
Usamah Bhatti at S&P Global Market Intelligence, conveyed a sombre view of the situation. He noted, "Depressed economic conditions domestically and globally weighed heavily on the sector, as both output and new orders were scaled back further. The decline in the latter was notably sharp, and the strongest seen for seven months." The future outlook is also tinged with apprehension, as manufacturers signaled the most significant depletion in outstanding business in five months.
The inflationary aspect further complicates the picture. Bhatti highlighted, "The rate of input price inflation accelerated for the second month running to a four-month high." Reports indicated that the sustained weakness of the yen is exacerbating the situation, elevating prices for inputs from abroad and placing an additional strain on firms.
RBA, RBNZ and US Data Deluge
This week, the spotlight shines on the meetings of two central banks and a slew of significant US economic data.
RBA, under the stewardship of its new Governor Michelle Bullock, is stepping into the limelight. With expectations anchored on continuation of 4.10% interest rate, the focus shifts to any potential hints of a future trajectory, especially amidst the backdrop of a slight uptick in the monthly CPI in . With Q3 data largely veiled in obscurity, concrete guidance is anticipated to be sparse, leaving market analysts and investos to decipher subtler cues.
Across the waters, RBNZ is another focal point. Holding a pioneering stance in post-COVID rate hikes, speculations are rife on whether RBNZ could also be the trailblazer in reversing the trend with rate cuts in the forthcoming year. However, consensus is elusive. Some economic pundits are forecasting an opposite movement, anticipating a hike to 5.75% come November or an increment early next year. Yet, with Q3 data conspicuously absent, tangible guidance from RBNZ remain improbable.
In the US, a busy week unfurls with ISM reports and non-farm payroll data taking center stage. These releases are imbued with heightened significance following last week's softer-than-projected core inflation figures. Fed fund futures currently indicate a sub-35% probability of a rate hike by year-end. A pressing query emerges - is the US economy, especially services sector and employment, moderating sufficiently to douse inflationary pressures, or is it on the brink of a more pronounced downturn, heralding a recession?
Complicating the narrative is the potential disarray in the data release schedule, courtesy of the partial government shutdown. This adds another layer of uncertainty, rendering the task of gauging economic health and future directions more intricate.
Here are some highlights for the week:
- Monday: BoJ summary of opinions, Japan Tankan survey, PMI manufacturing final; Swiss retail sales, PMI manufacturing; Eurozone PMI manufacturing final, unemployment rate; UK PMI manufacturing final; US ISM manufacturing construction spending.
- Tuesday: Japan monetary base; RBA rate decision, Australia building approvals; Swiss CPI.
- Wednesday: RBNZ rate decision; Eurozone PMI services final, PPI, retail sales; UK PMI services final; US ADP employment, ISM services, factory orders.
- Thursday: Australia trade balance; Germany trade balance; France industrial production; UK PMI construction; Canada trade balance, Ivey PMI; US jobless claims, trade balance.
- Friday: Japan average cash earnings, household spending, leading indicators; Swiss unemployment rate; Germany factory orders; France trade balance; Swiss foreign currency reserves; Canada employment; US non-farm payrolls.
USD/JPY Daily Outlook
Daily Pivots: (S1) 148.76; (P) 149.13; (R1) 149.73; More...
USD/JPY's rally resumed today by breaking through 149.70 resistance and intraday bias is back on the upside. Current rise from 127.20 should target a retest on 151.93 high next. On the downside, break of 148.51 support is needed to indicate short term topping. Otherwise, outlook will stay bullish in case of retreat.
In the bigger picture, while rise from 127.20 is strong, it could still be seen as the second leg of the corrective pattern from 151.93 (2022 high). Rejection by 151.93, followed by break of 145.06 resistance turned support will be the first sign that the third leg of the pattern has started. However, sustained break of 151.93 will confirm resumption of long term up trend.
Economic Indicators Update
| GMT | Ccy | Events | Actual | Forecast | Previous | Revised |
|---|---|---|---|---|---|---|
| 23:50 | JPY | BoJ Summary of Opinions | ||||
| 23:50 | JPY | Tankan Large Manufacturing Index Q3 | 9 | 6 | 5 | |
| 23:50 | JPY | Tankan Large Manufacturing Outlook Q3 | 10 | 5 | 9 | |
| 23:50 | JPY | Tankan Non - Manufacturing Index Q3 | 27 | 24 | 23 | |
| 23:50 | JPY | Tankan Non - Manufacturing Outlook Q3 | 21 | 22 | 20 | |
| 23:50 | JPY | Tankan Large All Industry Capex Q3 | 13.60% | 13.40% | ||
| 00:00 | AUD | TD Securities Inflation M/M Sep | 0.00% | 0.20% | ||
| 00:30 | JPY | Manufacturing PMI Sep F | 48.5 | 48.6 | 48.6 | |
| 06:30 | CHF | Real Retail Sales Y/Y Aug | -1.80% | -2.20% | ||
| 07:30 | CHF | Manufacturing PMI Sep | 40.5 | 39.9 | ||
| 07:45 | EUR | Italy Manufacturing PMI Sep | 45.6 | 45.4 | ||
| 07:50 | EUR | France Manufacturing PMI Sep F | 43.6 | 43.6 | ||
| 07:55 | EUR | Germany Manufacturing PMI Sep F | 39.8 | 39.8 | ||
| 08:00 | EUR | Italy Unemployment Aug | 7.70% | 7.60% | ||
| 08:00 | EUR | Eurozone Manufacturing PMI Sep F | 43.4 | 43.4 | ||
| 08:30 | GBP | Manufacturing PMI Sep F | 44.2 | 44.2 | ||
| 09:00 | EUR | Eurozone Unemployment Rate Aug | 6.40% | 6.40% | ||
| 13:30 | CAD | Manufacturing PMI Sep | 48 | |||
| 13:45 | USD | Manufacturing PMI Sep F | 48.9 | 48.9 | ||
| 14:00 | USD | ISM Manufacturing PMI Sep | 47.9 | 47.6 | ||
| 14:00 | USD | ISM Manufacturing Prices Paid Sep | 48.9 | 48.4 | ||
| 14:00 | USD | ISM Manufacturing Employment Index Sep | 48.5 | |||
| 14:00 | USD | Construction Spending M/M Aug | 0.60% | 0.70% |