Sample Category Title
Fed’s Bowman flags energy as potential setback to disinflation progress; advocates more hike
Fed Michelle Bowman has made her hawkish stance clear on the pressing issue of inflation that continues to grip the US economy. In a speech today, Bowman emphasized the persistence of inflationary pressures, signaling the need for a more restrictive monetary policy to anchor inflation back to the Fed's 2% target.
"Inflation continues to be too high, and I expect it will likely be appropriate for the Committee to raise rates further and hold them at a restrictive level for some time to return inflation to our 2 percent goal in a timely way," Bowman stated.
Bowman pointed to the latest inflation reading based on the PCE index, noting a rise in overall inflation driven, in part, by escalating oil prices. "I see a continued risk that high energy prices could reverse some of the progress we have seen on inflation in recent months," she warned.
Also, Bowman cited the Summary of Economic Projections released during the September FOMC meeting, where "the median participant expects inflation to stay above 2 percent at least until the end of 2025." This expectation of prolonged inflationary pressures aligns with Bowman's perspective that "further policy tightening" will be instrumental in steering inflation back towards target.
What to Trade in October
Welcome to October, the tenth month of 2023. For this installment of What to Trade, I have handpicked a few of my favorite trade ideas for the month. Let’s go over a few of them.
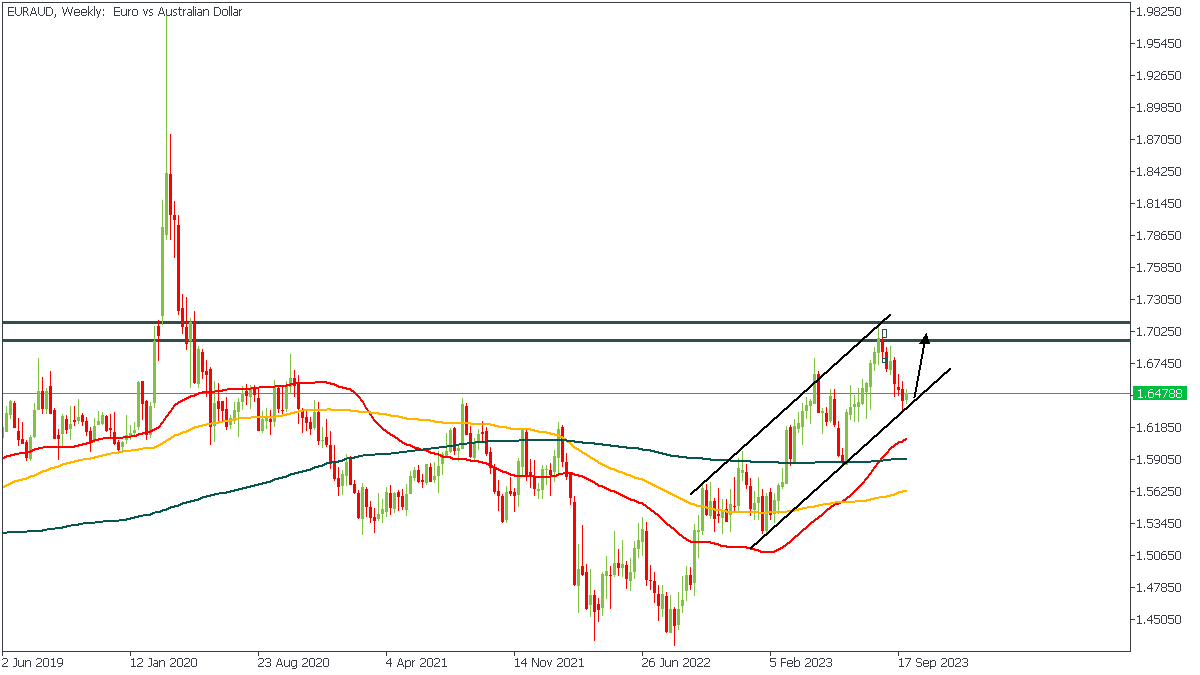
EURAUD - W1 Timeframe
The weekly timeframe of EURAUD presents an interesting scenario: we see a compression of the price within the rising channel pattern and the price currently resting on the support trendline of the channel. Considering also that the 50-period moving average has crossed above the 100 and 200-period moving averages, indicating a shift in bias, I will be on on the lookout for opportunities to buy EURAUD this month.
Analyst’s Expectations:
- Direction: Bullish
- Target: 1.67521
- Invalidation: 1.62399
EURNZD - D1 Timeframe
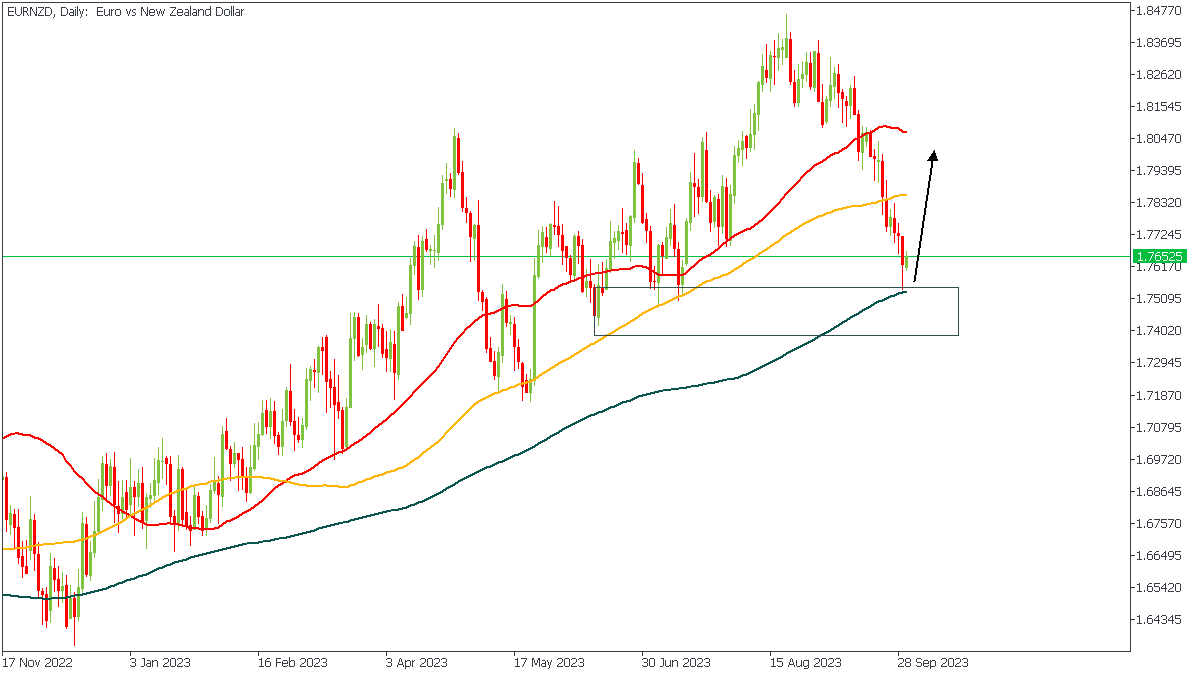
EURNZD has reached the 200-day moving average (a potential area of support) on the daily timeframe, and seems to already be reacting to the demand zone presented on the chart. Considering the bullish array of the moving averages, I am inclined to trade in favor of the bullish sentiment.
Analyst’s Expectations:
- Direction: Bullish
- Target: 1.79984
- Invalidation: 1.3908
AUDCHF - W1 Timeframe
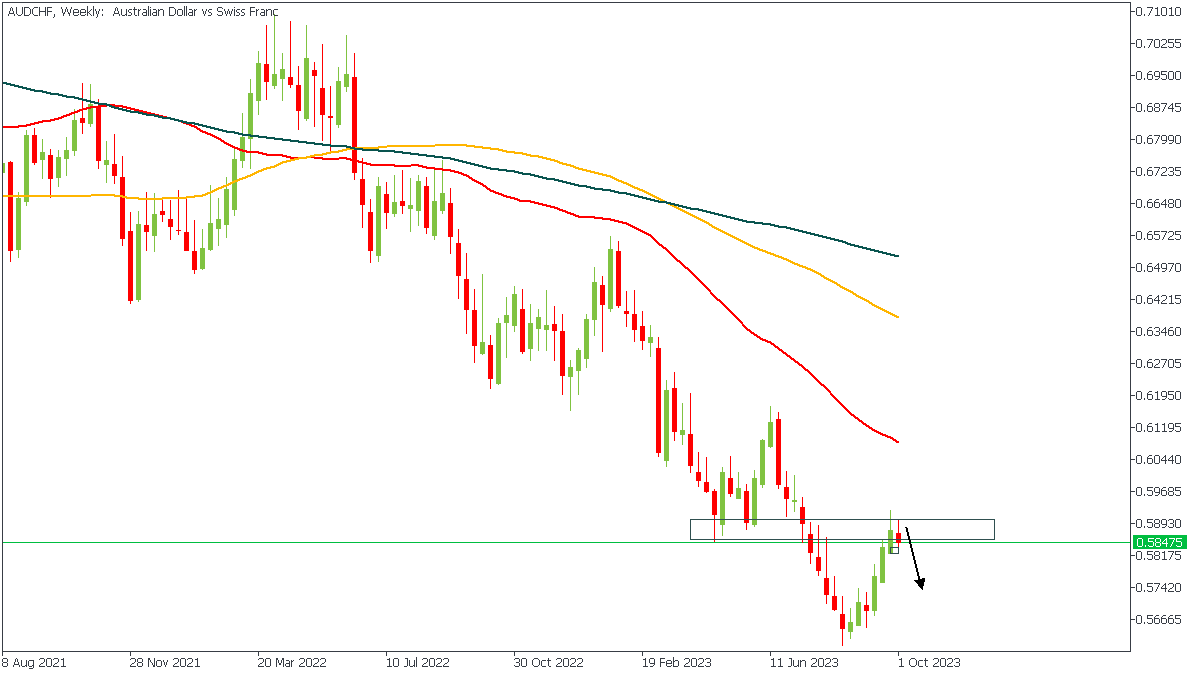
AUDCHF on the weekly timeframe is currently at a pivot zone and could very well be returning to the previous low area. From the chart we see that the moving averages are still poised in a descending array, which signifies that the overall trend is bearish. It should be noted also that the RSI is overbought on the Daily timferame.
Analyst’s Expectations:
- Direction: Bearish
- Target: 0.57828
- Invalidation: 0.59131
CONCLUSION
The trading of CFDs comes at a risk. Thus, to succeed, you have to manage risks properly. To avoid costly mistakes while you look to trade these opportunities, be sure to do your due diligence and manage your risk appropriately.
Does Gold Bugs Capitulation Mean Reversal is Imminent?
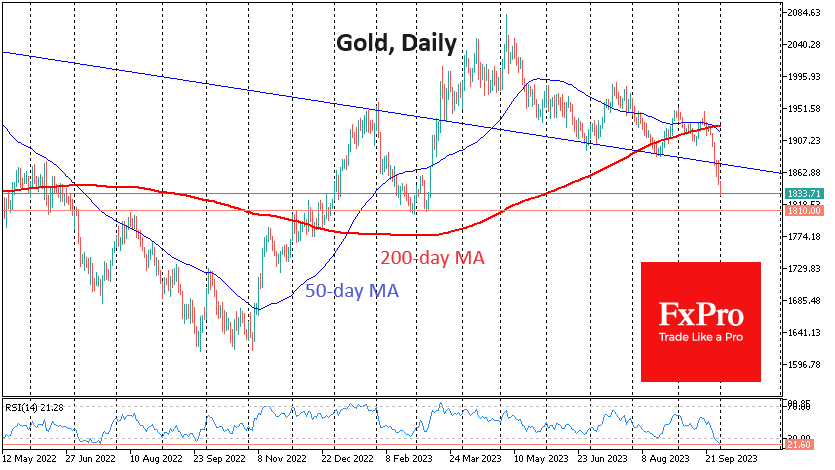
Gold lost almost 4% last week, the biggest drop in over two years. The price of a troy ounce fell below $1835, its lowest level since March. Gold’s sell-off last week looked like a capitulation of the bulls, with a break of multi-month support. This could soon be followed by increased volatility with new lows. It is often at times like this that market inflexion points are formed.
Last week, gold accelerated its decline by breaking the support of the downtrend channel of recent months. The last time gold traded at such a low was over six months ago, when the US regional banking crisis triggered an influx of buyers, pushing the price away from support around $1810.
Then, as now, the pressure on gold came from rising US government bond yields and a reassessment of expectations for higher long-term interest rates. In our view, the key difference in market sentiment is that a sell-off in gold accompanied last week’s sharp rise in cryptocurrencies.
In the short term, gold is oversold, creating the potential for a corrective bounce. On the daily chart, the RSI oscillator has dropped to 21.6. The last time the indicator recorded such low levels was in June and August 2018, when a reversal from decline to growth was forming in gold for the following years.
It may well be that this acceleration in gold’s decline is a sign that the fall is nearing its end, but it is still a case where it is better to be a little late to the rally than to buy in.
After falling below $1890, gold has been in thin air territory since March with no significant support levels. The nearest support remains at $1810. Around this level, gold found buyers with deep pockets in March.
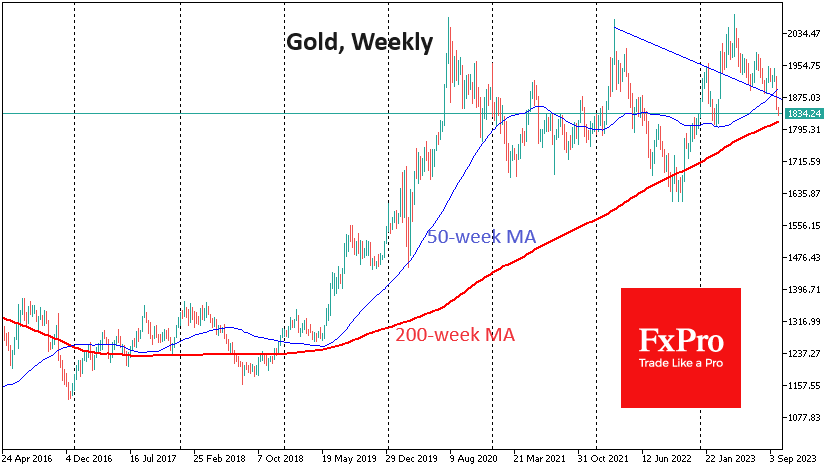
Not far from this level is the 200-week moving average. This is an essential indicator of the ultra-long-term trend. Over the past six years, gold has been bought on dips below this line, keeping it below 3.5%. This lower line of defence is not far from $1750.
If a further $80 drop from current levels is not appetising enough for long-term buyers, a new bear market in gold will have to be established.
US ISM manufacturing rose to 49.0, highest since last Nov
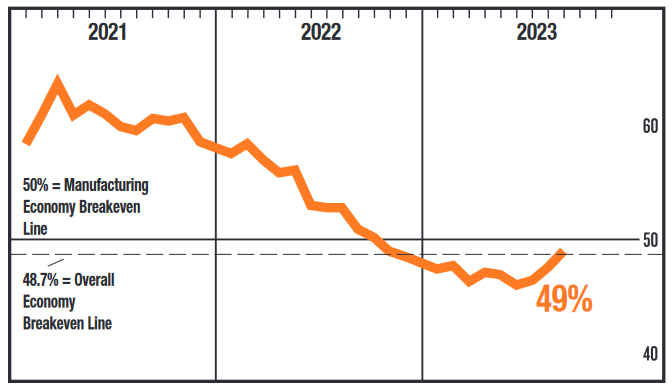
US ISM Manufacturing PMI exhibited an encouraging uptick in September, climbing to 49.0 from 47.6, surpassing the anticipated 47.9. Although the manufacturing sector is still in the grip of contraction, the pace has slackened, marking the sector's finest performance since November 2022. September's reading marks the 11th consecutive month of contraction, but also the third month showcasing an improvement.
Diving into the particulars, several key indices within the PMI reported positive shifts. New orders swelled to 49.2 from 46.8, and production amplified its reach, moving from 50.0 to 52.5. Furthermore, the employment index turned the corner, ascending from 48.5 to 51.2, signalling an uplift in hiring within the sector. However, not all indices saw a rise. The prices index experienced a substantial dip, plummeting from 48.4 to 43.8, reflecting a significant reduction in input costs.
When examining the historical correlation between the Manufacturing PMI and the broader economy, September's 49.0 reading translates to a 0.1% increase in real gross domestic product on an annualized basis. It implies that, despite the continued contraction, the manufacturing sector's decline is moderating, potentially heralding a turning point in upcoming months.
Sunset Market Commentary
Markets:
New month/quarter, but no profound change in market trends. On the contrary. After a brief rebound of bonds on Thursday and on Friday, previous trends apparently still have some way to go, especially if this week’s US data confirm ongoing resilience in activity and/or key labour market. The US avoiding a government shutdown and a solid Japan BOJ tankan report in essence shouldn’t be major news for markets. Even so, it’s enough a pretext for yields to take the way north again. A lot of Fed and ECB speakers are scheduled to give their view this week. Recent comments suggest that a majority of the Fed governors is holding to the narrative that an additional rate might be needed to balance supply and demand in a way that is enough to bring inflation to target in a sustainable way. In this respect, Richmond Fed president Barkin made some interesting remarks on the strength of the housing market, with housing prices hardly declining despite the Fed’s aggressive hiking cycle. If the housing market turns out to have made a secular shift, becoming less sensitive to higher interest rates, it might be necessary that prices in other parts of the economy should lessen a bit more. Whatever the reason, US yields are rising between 7 bps (5-y) and 6 bps (2y & 30-y). The US manufacturing ISM, to be released after finishing this report is the first really important reference. Fed Powell also joins a roundtable discussion later today. In case of a solid ISM report and/or hawkish message from Powell, US yields at maturities >5-y have a good chance of ending the day at new cycle peak closing levels. European bonds again outperform their US counterparts with German yields adding between 1,5 bps (2-y) and 5 bps (30-y). European investors are reluctant to already place bets on an additional ECB hike. However, the global ‘higher for longer narrative’ and trend for higher real yields at longer maturities also protects the downside in European yields. The start of the new quarter, didn’t inspire equity investors. The Eurostoxx 50 is ceding 0.5%, holding well below the previous 4200 range bottom. US indices also open with small losses. After taking a breather end last week, the dollar firmly takes the upper hand. The TW DXY index jumps from 106.17 late on Friday to currently 106.55. EUR/USD at 1.053 again has the 2023 low (1.0484) on the radar. USD/JPY (149.8) is only a whisker away from the 150 barrier. Markets are pondering the chances of MoF interventions to prevent further yen losses. Question remains on the efficacity of such action if an important part of the driver of the move is USD strength, next to yen weakness. Sterling gains marginally against the euro (EUR/GBP 0.866) but is holding within its recent consolidation pattern (0.863/0.8706).
News & Views:
The Czech manufacturing PMI fell more than expected in September (41.7 from 42.9 vs 42.5 consensus). The PMI fell below the 50 boom-bust mark in June last year and hasn’t really recovered since. Another sharp monthly contraction in new orders dragged output, with foreign client demand also dissipating amid challenging economic conditions in key export markets. Jobs were cut at the sharpest pace in over three years. Efforts to cut costs and improve cash flow led to the steepest drop in stocks of purchases in over 14 years. Pre-production inventories and stocks of finished items shrank as well. Muted demand for goods and inputs sparked further cuts to input costs and output charges, as firms and suppliers alike sought to drive sales. Czech goods producers still anticipate higher output over the coming year, but the degree of optimism dropped to the lowest in 2023 so far. The Czech PMI bolsters the case for CNB rate cut. The central bank indicated last week that both November and December gatherings are “live” meetings. Our preferred scenario is a 50 bps rate cut in December. The Polish manufacturing PMI improved marginally (43.9 from 43.1 vs 43.6 consensus). Details showed similar broad-based weakness like the Czech reading with further sharp falls in new orders, output, backlogs and input purchases albeit more slowly than in August. Employment was cut at the fastest in a year. Both input and output prices fell for the sixth month running. On a small bright note, forward-looking Future Output Index signaled the strongest 12 month outlook since March. The Polish zloty stabilized in the EUR/PLN 4.6-4.7 range after being whacked by the NBP’s unexpected 75 bps rate cut early September. NBP and government officials afterwards pushed back against the idea of similar cuts in October. The NBP will announce its policy decision on Wednesday.
Euro/Dollar Exchange Rate Remains Near its Lowest Levels
The main currency pair starts the week and the month by consolidating around the 1.0569 mark.
The US Federal Reserve's intention to potentially raise interest rates once again in 2023 is strengthening the position of the USD. The 10-year treasury bonds yield in the US remains at long-term highs regardless of a minor correction.
This week, statistics will be abundant in both the US and the eurozone. Employment sector reports for September in the US are expected to show stabilisation without any notable catalysts.
The eurozone will report on retail sales in August, the PPI, and business activity in the services sector. All these reports will provide insight into the state of the economic system. It is not certain whether there will be any catalyst among the European statistics to support the EUR, although this possibility exists.
Technical analysis of EUR/USD currency pair:
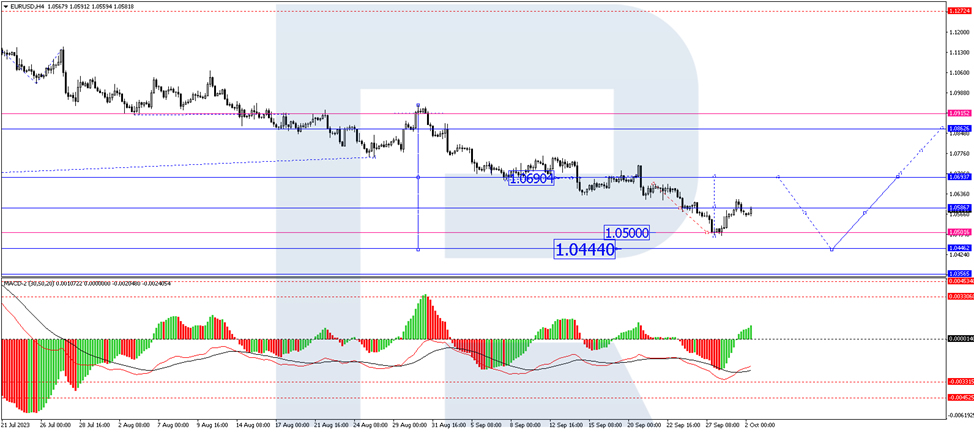
On the EURUSD H4 chart, a consolidation range has formed around 1.0700, reaching the local target of a declining wave at 1.0500 upon escaping the range downwards. Today the market has corrected to 1.0615. A new link of correction to 1.0620 is not excluded, followed by a decline to 1.0440. After reaching this level, a correction to 1.0700 could follow (with a test from below). Next, a decline to 1.0140 is expected. Technically, this scenario is confirmed by the MACD, whose signal line is below zero. The indicator is expected to set new lows.
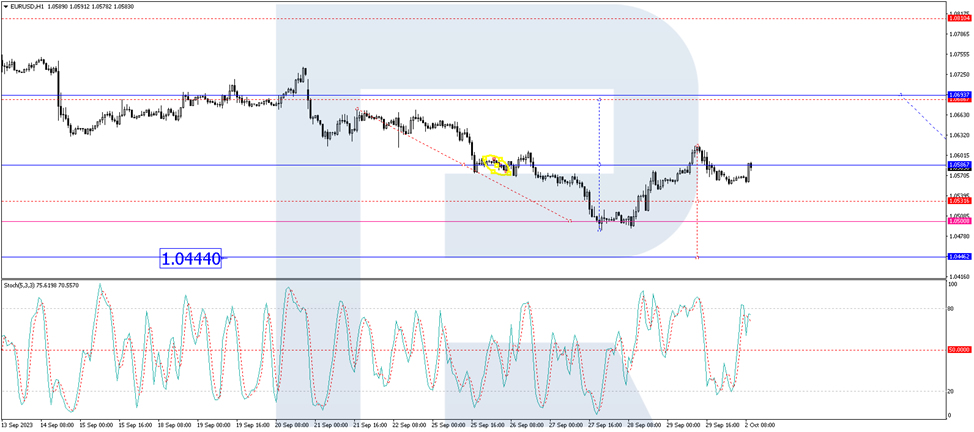
On the EURUSD H1 chart, a movement in a declining wave to 1.0440 is forming. By now, the market has completed a consolidation range of around 1.0586, reaching the local target of a declining wave at 1.0500 with an escape from the range downwards. A link of correction to 1.0615 has formed today. A new price hike to 1.0620 is not excluded. Next, a new declining movement to 1.0440 is expected, followed by a rise to 1.0700. Technically, this scenario is confirmed by the Stochastic oscillator, whose signal line has rebounded from the 80 mark and is currently pointing sharply downwards. The line might eventually fall to the 20 mark.
USD/JPY Mid-Day Outlook
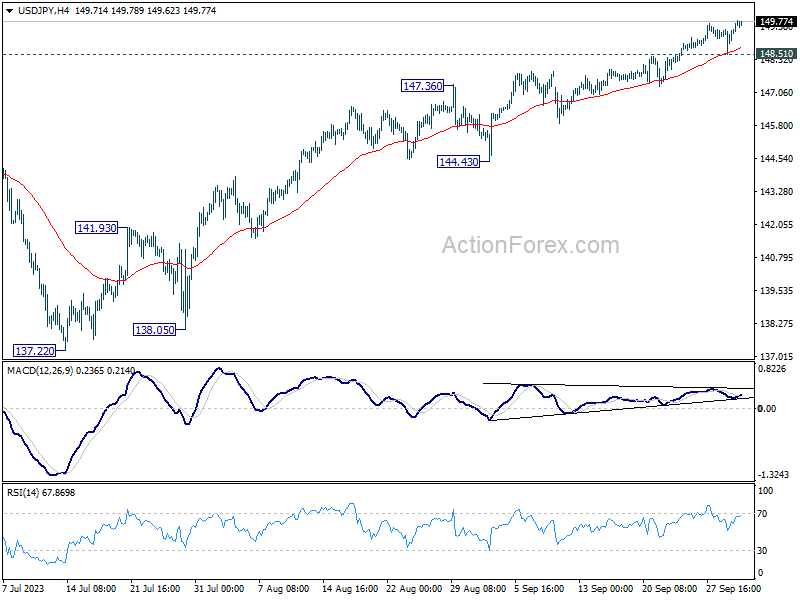
Daily Pivots: (S1) 148.76; (P) 149.13; (R1) 149.73; More...
Intraday bias in USD/JPY remains on the upside for the moment. Current rise from 127.20 should target a retest on 151.93 high next. On the downside, break of 148.51 support is needed to indicate short term topping. Otherwise, outlook will stay bullish in case of retreat.
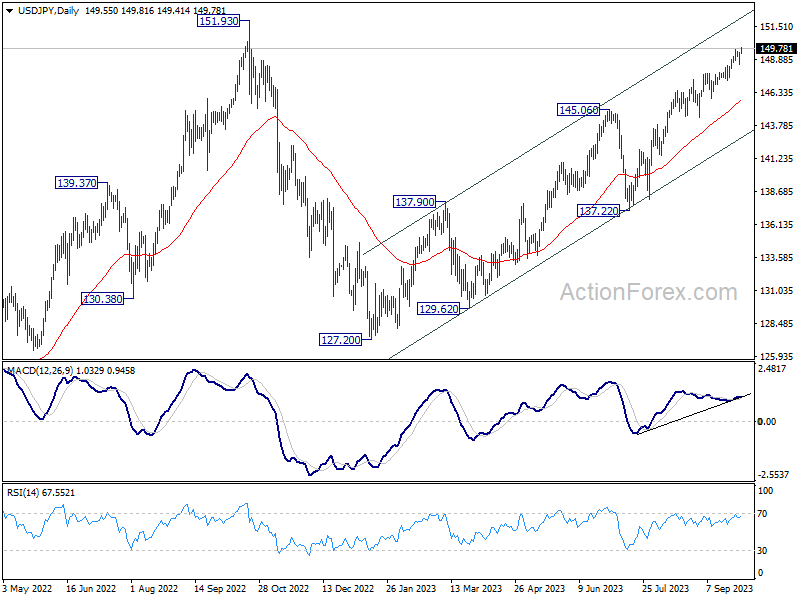
In the bigger picture, while rise from 127.20 is strong, it could still be seen as the second leg of the corrective pattern from 151.93 (2022 high). Rejection by 151.93, followed by break of 145.06 resistance turned support will be the first sign that the third leg of the pattern has started. However, sustained break of 151.93 will confirm resumption of long term up trend.
USD/CHF Mid-Day Outlook
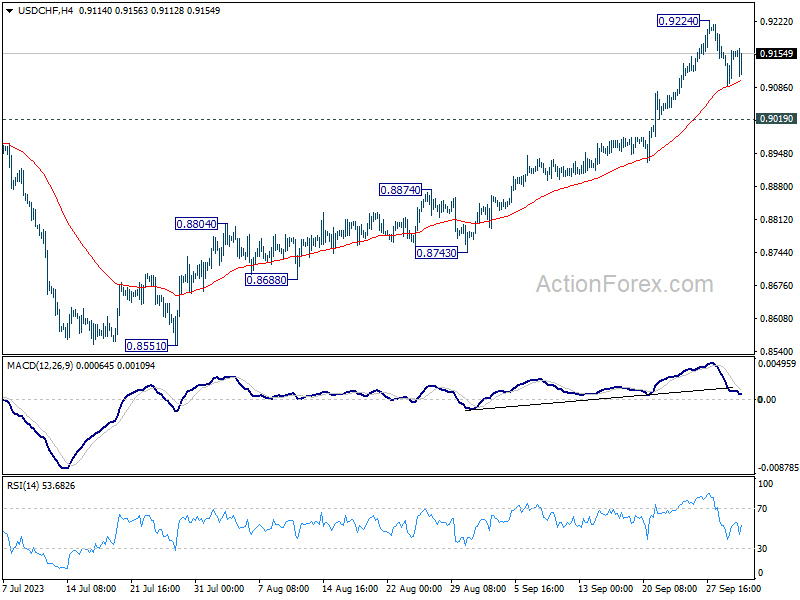
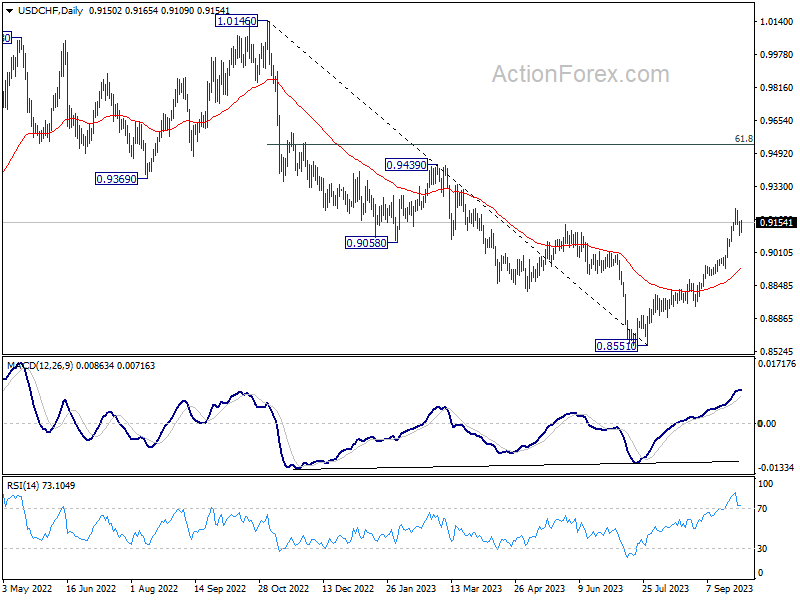
Daily Pivots: (S1) 0.9107; (P) 0.9135; (R1) 0.9180; More....
USD/CHF is staying in consolidation from 0.9224 and intraday bias remains neutral. Deeper retreat cannot be ruled out. But near term outlook will stay bullish as long as 0.9019 support holds. On the upside, break of 0.9224 will resume the rally from 0.8551 to 0.9439 resistance next.
In the bigger picture, current development indicates that rise from 0.8551 is reversing whole down trend from 1.0146. Further rally would then be seen to 61.8% retracement at 0.9537 and above. For now, this will be the favored case as long as 55 D EMA (now at 0.8923) holds, even in case of deep pullback.
GBP/USD Mid-Day Outlook
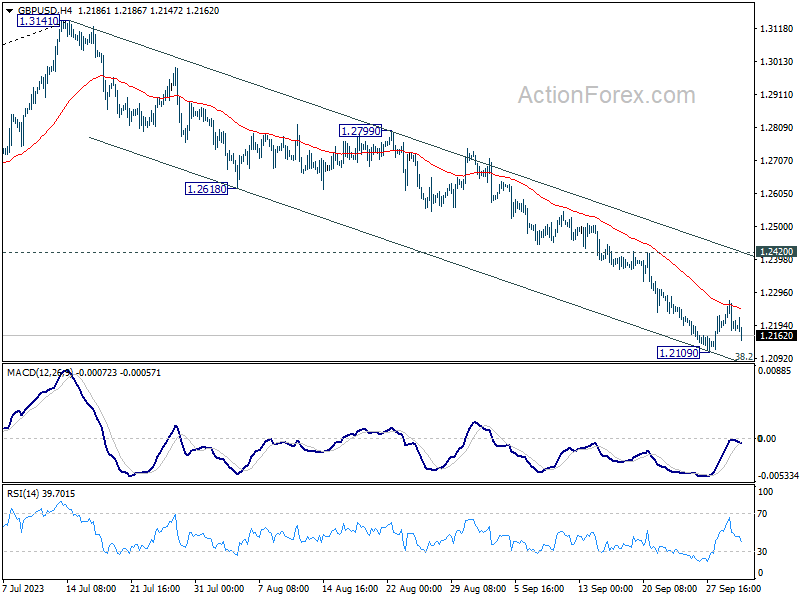
Daily Pivots: (S1) 1.2167; (P) 1.2219; (R1) 1.2258; More...
GBP/USD dips notably after rejection by 55 4H EMA, but stays above 1.2109 support. Intraday bias remains neutral for the moment. While stronger recovery cannot be ruled out, near term outlook will stay bearish as long as 1.2420 resistance holds. On the downside, decisive break of 1.2075 fibonacci level would carry larger bearish implication and target 1.1801 support next.
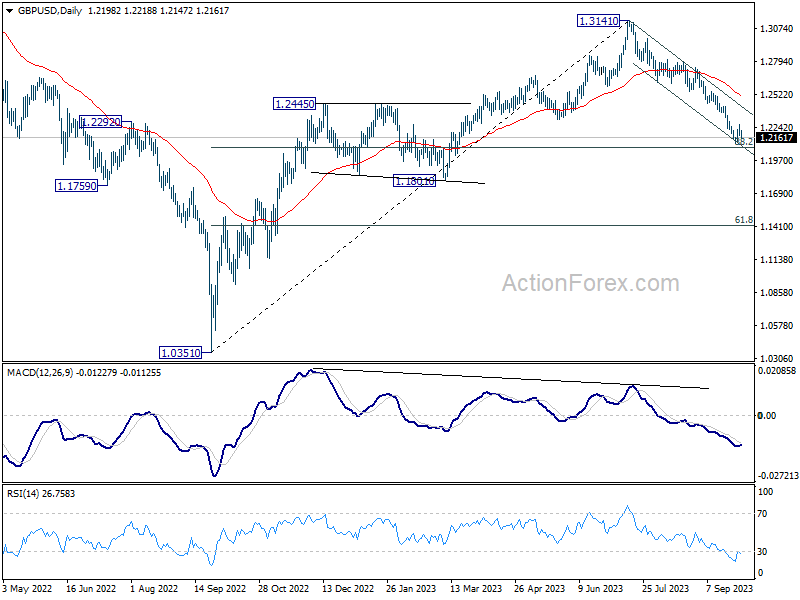
In the bigger picture, fall from 1.3141 medium term top could still be a correction to up trend from 1.0351 (2022 low) only. But risk of complete trend reversal is rising. Sustained break of 38.2% retracement of 1.0351 to 1.3141 at 1.2075 will pave the way to 61.8% retracement at 1.1417. For now, risk will stay on the downside as long as 55 D EMA (now at 1.2517) holds, in case of rebound.
EUR/USD Mid-Day Outlook
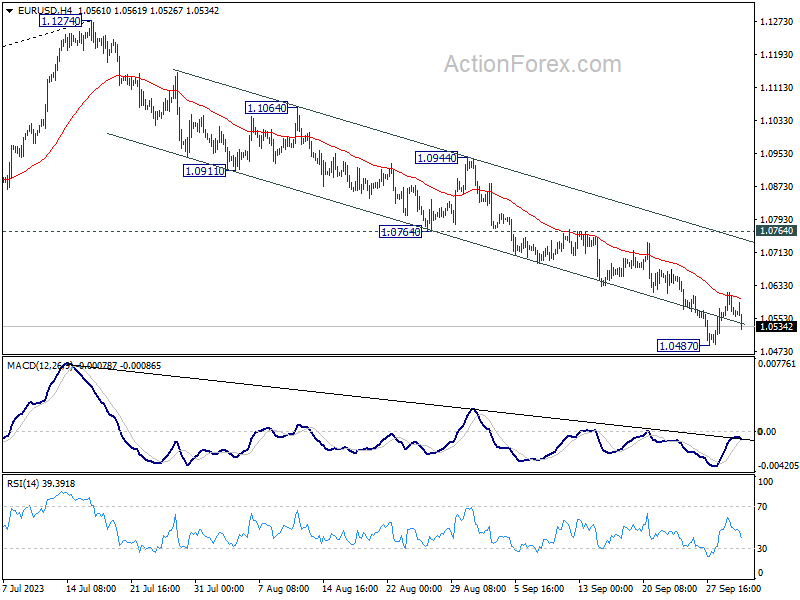
Daily Pivots: (S1) 1.0548; (P) 1.0583; (R1) 1.0607; More...
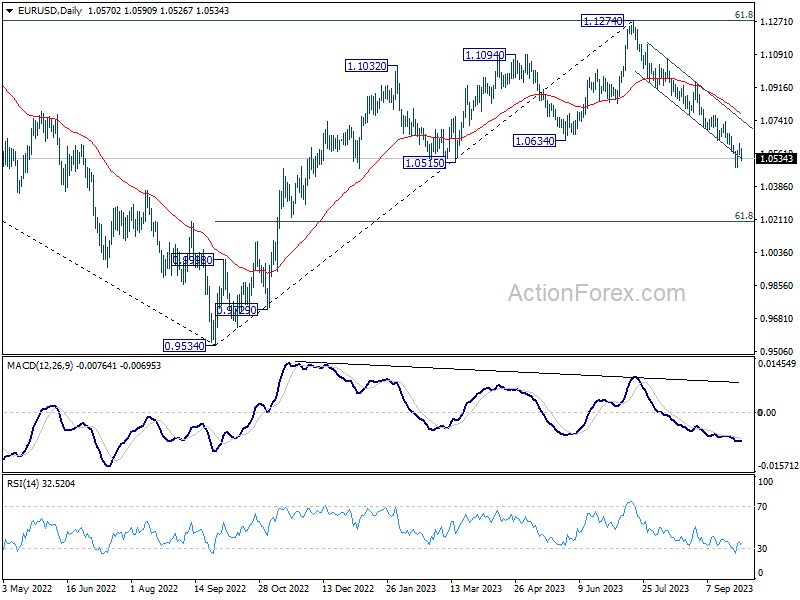
EUR/USD dips notably after rejection by 55 4H EMA, but stays above 1.0487 support. Intraday bias remains neutral for the moment. Stronger recovery cannot be ruled out. But near term outlook will stay bearish as long as 1.0764 support turned resistance holds. Break of 1.0487 will resume the fall from 1.1274 to 1.0199 fibonacci level.
In the bigger picture, fall from 1.1274 medium term top could still be a correction to rise from 0.9534 (2022 low). But chance of a complete trend reversal is rising. In either case, current fall should target 61.8% retracement of 0.9534 to 1.1274 at 1.0199 next. For now, risk will stay on the downside as long as 55 D EMA (now at 1.0786) holds, in case of rebound.