Sample Category Title
EUR/USD Mid-Day Outlook
Daily Pivots: (S1) 1.0548; (P) 1.0583; (R1) 1.0607; More...
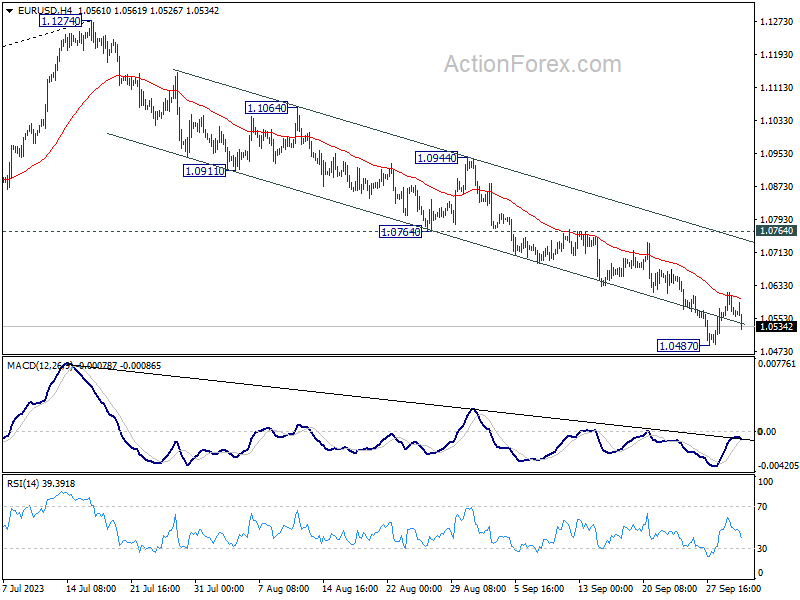
EUR/USD dips notably after rejection by 55 4H EMA, but stays above 1.0487 support. Intraday bias remains neutral for the moment. Stronger recovery cannot be ruled out. But near term outlook will stay bearish as long as 1.0764 support turned resistance holds. Break of 1.0487 will resume the fall from 1.1274 to 1.0199 fibonacci level.
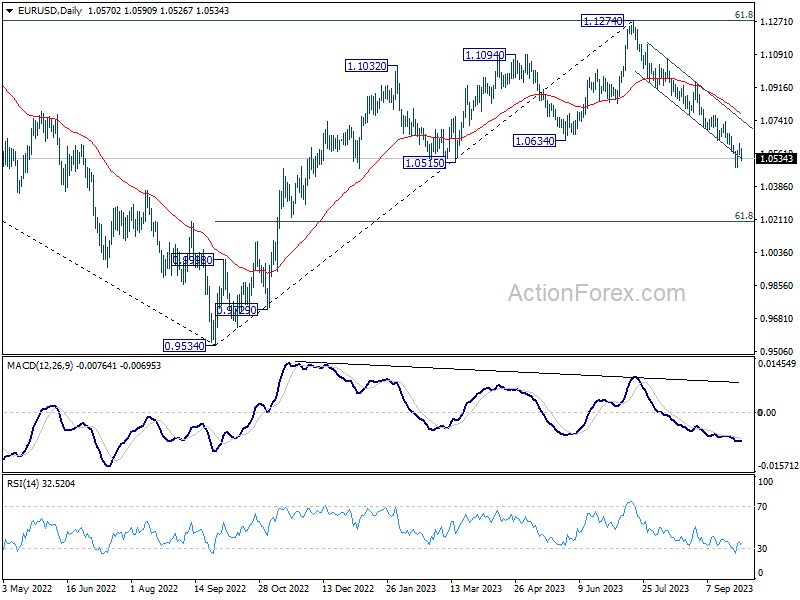
In the bigger picture, fall from 1.1274 medium term top could still be a correction to rise from 0.9534 (2022 low). But chance of a complete trend reversal is rising. In either case, current fall should target 61.8% retracement of 0.9534 to 1.1274 at 1.0199 next. For now, risk will stay on the downside as long as 55 D EMA (now at 1.0786) holds, in case of rebound.
Dollar Benefits from Rising Treasury Yields; Precious Metals Stumble
Dollar is experiencing a broad rise today, buoyed by an uptick in treasury yields and risk aversion sentiments. The US Congress averted potential economic turbulence by passing a stopgap funding bill over the weekend, ensuring the federal government doesn't enter its fourth partial shutdown within a decade. However, this positive momentum in US futures was fleeting. This strengthening of Dollar is mirrored by decline in Gold and Silver, both plunging to their lowest levels since March.
In the realm of currencies, Canadian Dollar is emerging as one of the stronger performers, with Swiss Franc not far behind – the latter finding support from purchases against European majors. Conversely, Australian and New Zealand dollars are today's underperformers. Both antipodean currencies are in the spotlight as anticipating respective central bank meetings this week, with RBA kicking off the sequence in the coming Asian session.
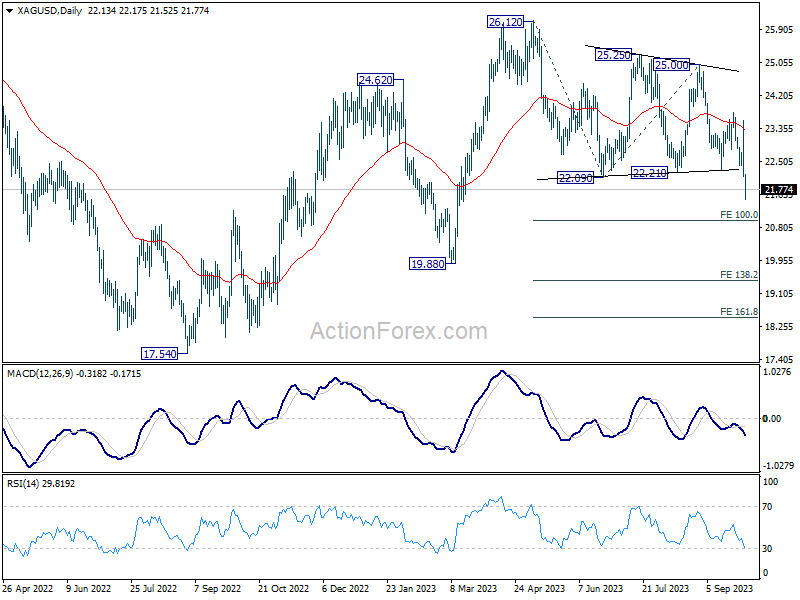
Technically, Silver resumed the decline from 26.12 and hits a low as 21.52 so far. It's unsure whether this fall is an impulsive or a corrective move for now. But risk will stay on the downside as long as 55 D EMA (now at 23.35) holds. Next target is 100% projection of 26.12 to 22.09 from 25.00 at 20.97. Decisive break there could prompt downside acceleration, and will act as a strong signal of underlying bearishness.
In Europe, at the time of writing, FTSE is down -0.49%. DAX is down -0.32%. CAC is down -0.37%. Germany 10-year yield is up 0.0253 at 2.870. Earlier in Asia, Nikkei closed down -0.31% on late selloff. Japan 10-year JGB yield rose 0.0054 to 0.776. Singapore Strait Times fell -0.27%.
Eurozone unemployment rate ticks down to 6.4%, EU down to 5.9%
Unemployment rate in Eurozone has seen a drop from 6.5% to 6.4% in August, aligning with market expectations. Similarly, the broader EU reported a decrease in its unemployment rate, ticking down from 6.0% to 5.9%.
Eurostat, provided further details on this development. As of August 2023, an estimated 12.837m individuals in EU were unemployed. Out of these, Eurozone accounted for 10.856m jobless persons. When juxtaposed with the data from July, there's a marked decrease of -112k unemployed persons in EU, with Eurozone contributing a decline of -107k to this number.
An even more pronounced positive trend emerges when the data is analyzed year-on-year. From August 2022 to August 2023, EU saw a reduction in unemployment by -335k individuals, while Eurozone alone experienced a decline of -407k unemployed persons.
Eurozone PMI manufacturing finalized at 43.4, sub-50 reading persists for 15 months
September Eurozone PMI Manufacturing shows a persistent trend of contraction, finalizing at 43.4, a marginal decline from August's 43.5. This marks a continuous 15-month spell where the headline index has been below the 50.0 threshold, indicating contraction.
Excluding Greece, which barely recorded expansion with Manufacturing PMI of 50.3, every other country monitored in the survey showed downturns. A country-wise breakdown ranks Greece at the top, followed by Ireland (49.6), Spain (47.7), Italy (46.8), France (44.2), Netherlands (43.6), Austria (39.6), and Germany (39.6).
Cyrus de la Rubia, the Chief Economist at Hamburg Commercial Bank, painted a clear picture of the current manufacturing scenario. He stated, "We are feeling pretty certain that the recession in manufacturing continued during this period." He also added that a significant pickup might only materialize with the advent of the new year. However, he expressed optimism by highlighting the possibility of reaching the lowest point in the current economic cycle.
Drawing parallels with past recessions, de la Rubia remarked, "With the exception of the great recession in 2008/2009, output prices have never decreased at a pace faster than the current three-month average." He emphasized the rarity of such sharp falls and indicated the likelihood of a rebound.
France and Germany led the downturn, while Spain and Italy showed relative resilience. However, when viewed through the lens of ongoing slowdown duration, Italy emerged as the poorest performer. Its manufacturing sector has been in recession since the latter half of 2022, with Germany joining the downturn in the second quarter of the current year.
"Given our forecast that the global manufacturing sector is bottoming out, these countries may be spared from a downturn lasting longer than two quarters," de la Rubia added, hinting at a silver lining in the looming clouds of economic contraction.
UK PMI manufacturing finalized at 44.3, still mired in contraction
UK PMI Manufacturing experienced a slight uptick, finalized 44.3 in September from the previous month's 39-month low of 43.0. However, despite this marginal improvement, an in-depth examination of the five sub-indices of the PMI - new orders, output, employment, stocks of purchases, and supplier delivery times - revealed a consistent downturn in the sector's performance.
Rob Dobson, Director at S&P Global Market Intelligence, portrayed a challenging scene for the UK's manufacturing industry. "September saw the manufacturing sector still mired in contraction territory," he noted. This is attributed to weakened conditions both domestically and internationally that have negatively impacted new order intakes, leading to reduced production volumes.
One of the significant factors exacerbating the situation is the ongoing cost-of-living crisis in the UK. A rapid increase in interest rates is further pressuring the manufacturing sector. Producers have explicitly linked these developments to the troubles they are encountering.
BoJ opinions: A blend of caution and optimism
Summary of Opinions of BoJ's September 21-22 meeting reiterated the general stance that ultra-loose monetary policy remains necessary for now. Yet, there was an undercurrent of optimism, with some members seeing achieve of price target "in sight".
The collective view reinforced that the "sustainable and stable achievement of the price stability target, accompanied by wage increases, has not yet come in sight." Given this scenario, the summary stressed the necessity to "patiently continue with monetary easing under yield curve control."
Underpinning the continued focus on wages, one member stated it is "necessary" to uphold the "momentum for wage hikes through continuation of monetary easing." Also, in order to achieve inflation target of 2 percent in a sustainable manner, it is necessary that "wage increases take root."
However, amid the cautious tones, rays of optimism emerged. One member opined that "Japan's economy is getting closer to achieving the price stability target, although there is somewhat of a distance to go." Providing a potential timeline for evaluating the price stability objective, focus is now on "the second half of fiscal 2023" especially considering the wage growth prospects for 2024.
Furthering this optimism, another viewpoint conveyed confidence, indicating that "Achievement of 2 percent inflation in a sustainable and stable manner seems to have clearly come in sight." This perspective also hinted at a clearer outcome by "January to March of next year."
Japan's Tankan survey reveals strong business sentiment
The latest Tankan survey results in Q3 showcased strengthening corporate sentiment in Japan. Key indices and outlooks, along with projections for capital expenditure, underscore a robust business environment, as inflation expectations maintain steadiness.
Large Manufacturing Index showed notable gains from 5 to 9, marking its second consecutive quarter of growth. Concurrently, Large Non-Manufacturing Index advanced from 23 to 27, recording its best level since 1991 and marking its sixth straight quarter of improvement.
Further reflecting this positive trend, Large Manufacturing Outlook Index increased from 9 to 10, while its Large Non-Manufacturing Outlook saw an ascent from 20 to 21.
In terms of capital commitments, prominent firms revealed ambitious plans, with an anticipation to bolster capital expenditure by 13.6% for the fiscal year ending March 2024.
Regarding inflation, the corporate sector's expectations remain consistent. Firms anticipate a price increase of 2.5% in the upcoming year, 2.2% over a three-year horizon, and 2.1% looking five years ahead. These figures mirror projections made in the prior quarter.
A crucial insight from a BOJ official noted that many large businesses have successfully offset higher costs by adjusting consumer prices, subsequently enhancing the overall business sentiment.
Further elevating the positive mood have been factors such as a resurgence in auto production and declining costs for raw materials. However, the official also acknowledged the challenges faced by some smaller enterprises, which have found it difficult to raise their prices.
Japan PMI manufacturing finalized at 48.5 in Sep, headwinds at home and abroad
Japanese manufacturing sector is facing challenges as evidenced by the drop in PMI Manufacturing to 48.5 in September, down from August's 49.6, the lowest level since February. Additionally, the average reading for Q3 stands at 49.3, a reduction from 50.0 in Q2.
According to key findings by S&P Global, the sector experienced faster falls in production and incoming new work. Alarmingly, backlogs declined at the strongest rate since April. A specific area of concern is the accelerated rate of input price inflation, reaching a four-month high, fueled by increasing costs of raw materials, oil, freight, and energy.
Usamah Bhatti at S&P Global Market Intelligence, conveyed a sombre view of the situation. He noted, "Depressed economic conditions domestically and globally weighed heavily on the sector, as both output and new orders were scaled back further. The decline in the latter was notably sharp, and the strongest seen for seven months." The future outlook is also tinged with apprehension, as manufacturers signaled the most significant depletion in outstanding business in five months.
The inflationary aspect further complicates the picture. Bhatti highlighted, "The rate of input price inflation accelerated for the second month running to a four-month high." Reports indicated that the sustained weakness of the yen is exacerbating the situation, elevating prices for inputs from abroad and placing an additional strain on firms.
EUR/USD Mid-Day Outlook
Daily Pivots: (S1) 1.0548; (P) 1.0583; (R1) 1.0607; More...
EUR/USD dips notably after rejection by 55 4H EMA, but stays above 1.0487 support. Intraday bias remains neutral for the moment. Stronger recovery cannot be ruled out. But near term outlook will stay bearish as long as 1.0764 support turned resistance holds. Break of 1.0487 will resume the fall from 1.1274 to 1.0199 fibonacci level.
In the bigger picture, fall from 1.1274 medium term top could still be a correction to rise from 0.9534 (2022 low). But chance of a complete trend reversal is rising. In either case, current fall should target 61.8% retracement of 0.9534 to 1.1274 at 1.0199 next. For now, risk will stay on the downside as long as 55 D EMA (now at 1.0786) holds, in case of rebound.
Economic Indicators Update
| GMT | Ccy | Events | Actual | Forecast | Previous | Revised |
|---|---|---|---|---|---|---|
| 23:50 | JPY | BoJ Summary of Opinions | ||||
| 23:50 | JPY | Tankan Large Manufacturing Index Q3 | 9 | 6 | 5 | |
| 23:50 | JPY | Tankan Large Manufacturing Outlook Q3 | 10 | 5 | 9 | |
| 23:50 | JPY | Tankan Non - Manufacturing Index Q3 | 27 | 24 | 23 | |
| 23:50 | JPY | Tankan Non - Manufacturing Outlook Q3 | 21 | 22 | 20 | |
| 23:50 | JPY | Tankan Large All Industry Capex Q3 | 13.60% | 13.40% | ||
| 00:00 | AUD | TD Securities Inflation M/M Sep | 0.00% | 0.20% | ||
| 00:30 | JPY | Manufacturing PMI Sep F | 48.5 | 48.6 | 48.6 | |
| 06:30 | CHF | Real Retail Sales Y/Y Aug | -1.80% | -1.80% | -2.20% | -2.50% |
| 07:30 | CHF | Manufacturing PMI Sep | 44.9 | 40.5 | 39.9 | |
| 07:45 | EUR | Italy Manufacturing PMI Sep | 46.8 | 45.6 | 45.4 | |
| 07:50 | EUR | France Manufacturing PMI Sep F | 44.2 | 43.6 | 43.6 | |
| 07:55 | EUR | Germany Manufacturing PMI Sep F | 39.6 | 39.8 | 39.8 | |
| 08:00 | EUR | Italy Unemployment Aug | 7.30% | 7.70% | 7.60% | |
| 08:00 | EUR | Eurozone Manufacturing PMI Sep F | 43.4 | 43.4 | 43.4 | |
| 08:30 | GBP | Manufacturing PMI Sep F | 44.3 | 44.2 | 44.2 | |
| 09:00 | EUR | Eurozone Unemployment Rate Aug | 6.40% | 6.40% | 6.40% | 6.50% |
| 13:30 | CAD | Manufacturing PMI Sep | 48 | |||
| 13:45 | USD | Manufacturing PMI Sep F | 48.9 | 48.9 | ||
| 14:00 | USD | ISM Manufacturing PMI Sep | 47.9 | 47.6 | ||
| 14:00 | USD | ISM Manufacturing Prices Paid Sep | 48.9 | 48.4 | ||
| 14:00 | USD | ISM Manufacturing Employment Index Sep | 48.5 | |||
| 14:00 | USD | Construction Spending M/M Aug | 0.60% | 0.70% |
Crypto Feels Power
Market picture
The crypto market capitalisation has risen over 2.7% in the last 24 hours to over $1.11 trillion, a level not seen since mid-August.
Bitcoin managed to hold above its 50-day moving average over the weekend, which it surpassed in a strong move on the 28th of September. BTCUSD surged over $1000 with a 4% gain, hitting a 7-week high of $28.3K. Contrary to the upward momentum at the end of last week, the intraday rally may be too stretched for now. After a long march, the price touched the technically and emotionally important 200-day moving average (currently $28K). There is a risk that we could see a repeat of the August 29 reversal to the downside. But that’s a risk, not the main scenario.
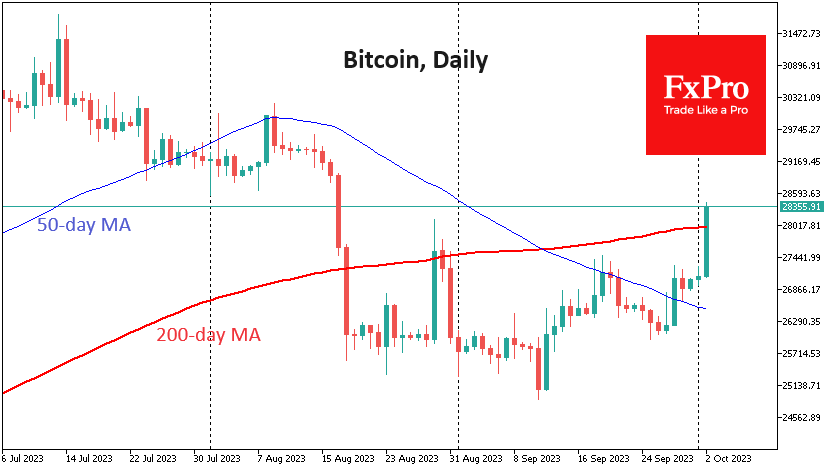
Bitcoin ended September up 4.1% at $27.1K, bucking the seasonal trend of the worst month of the year, which was hard to expect in an environment of a rising dollar and a falling S&P 500. Over the past 12 years, bitcoin has ended October higher on eight occasions. The average gain was 29.6%, and the average loss was 15.2%.
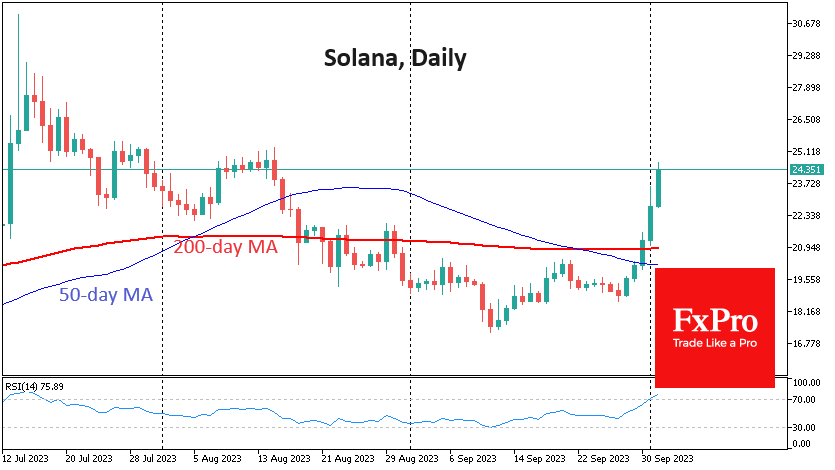
Solana rose 30%, rallying for the fifth day in a row and reaching its highest level since August 15th. On Sunday, it broke through the 50 and 200-day averages and continued to rise on Sunday and Monday. If Bitcoin has once again become an indicator of risk sentiment for global markets, has Solana become a leading indicator for Bitcoin?
News Background
Asset management company VanEck announced the launch of the Ethereum Strategy ETF. The actively managed ETF will be based on CFTC-regulated Ethereum-based settlement futures. The new instrument is similar to the firm’s other product, the Bitcoin Strategy ETF (XBTF), which will launch in November 2021.
The team behind the newly launched crypto exchange, CommEX, includes former Binance employees who helped develop the platform, the company said in an open letter. CommEX did not name the beneficiaries, saying they “prefer to remain undisclosed persons”.
AUD/USD Falls Ahead of RBA Meeting
- Australian dollar falls below 0.6400
- MI Inflation Gauge comes in at 0%
- RBA expected to hold rates at 4.1%
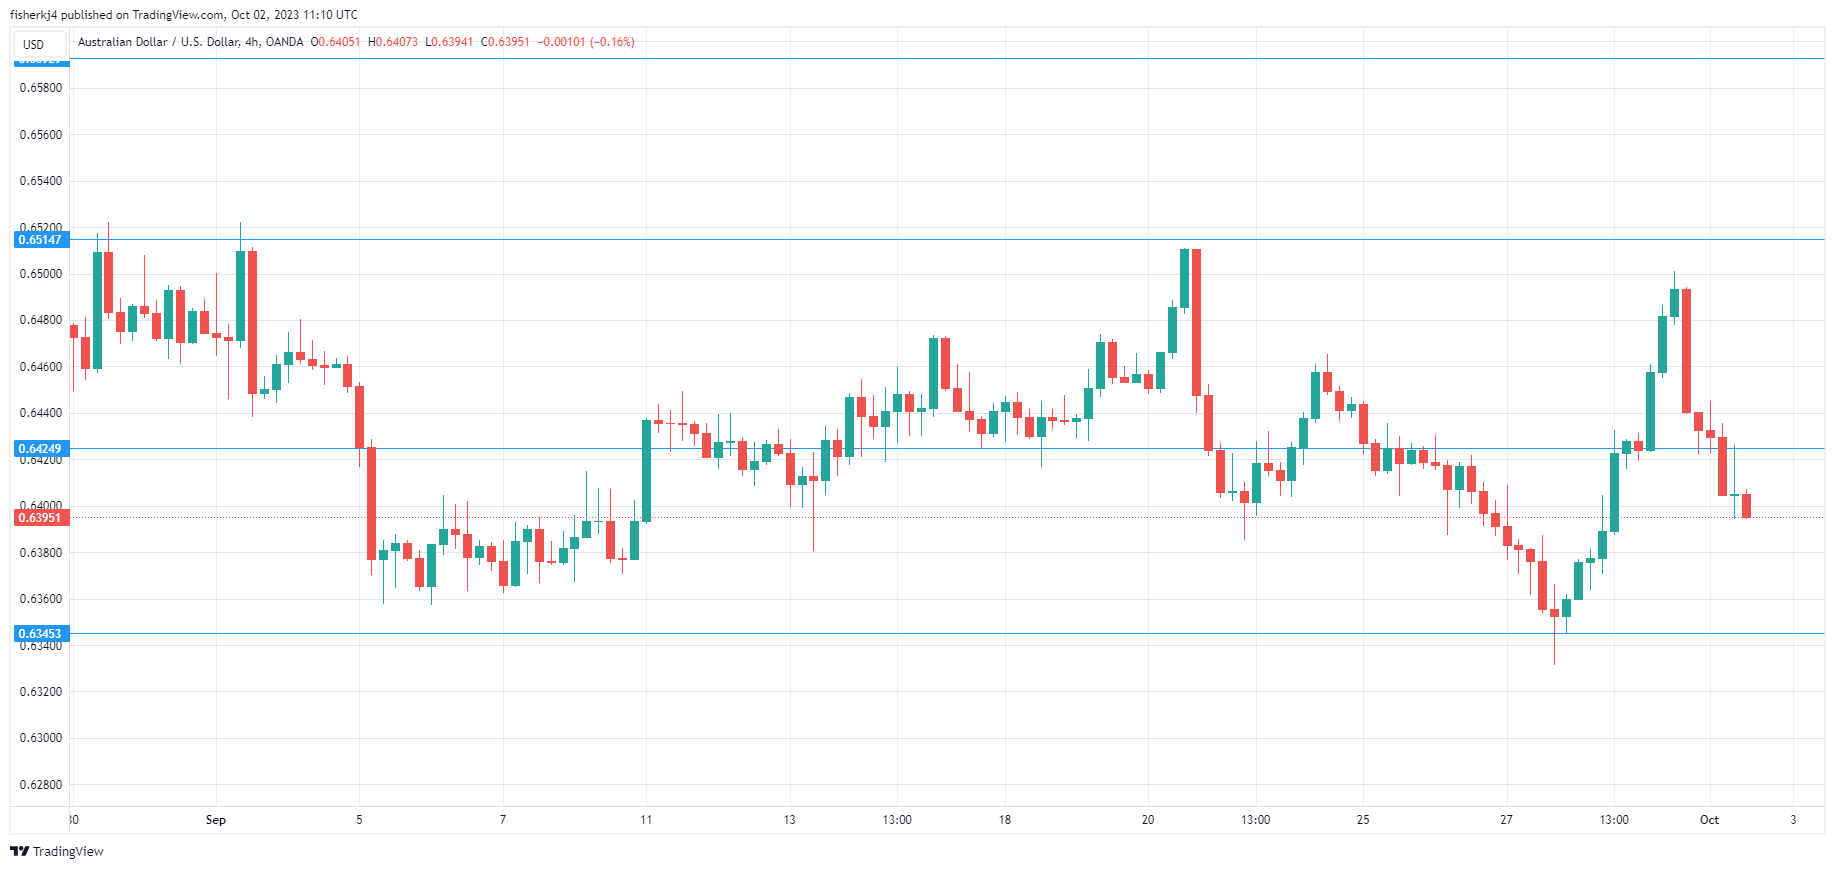
The Australian dollar has started the week considerably lower. In the European session, AUD/USD is trading at 0.6397, down 0.55%.
MI Inflation Gauge comes in at 0%
The Melbourne Institute’s Inflation Gauge was flat in September after 12 straight months of increases. This follows a 0.2% m/m in August and missed the consensus estimate of 0.4% m/m. This reading follows last week’s CPI release, which showed that consumer inflation rose to 5.2% y/y in August, up from 4.9% m/m a month earlier. The spike in inflation is unlikely to concern the Reserve Bank of Australia, as the rise was related to higher energy and housing costs.
The RBA meets on Tuesday, and the markets are expecting the central bank to pause rates at 4.1% for a fourth straight time. According to the ASX 30-day interbank cash rate futures as of 28 September, there is a 93% probability of a pause at the meeting, with a 7% chance of a quarter-point trim.
Tuesday’s meeting will be the first chaired by Michele Bullock, who so far hasn’t veered from the stance of her predecessor, Philip Lowe. Bullock has said that rate hikes remain on the table, but it appears a safe bet that the RBA will remain on the sidelines tomorrow, especially with the economic slowdown in China, Australia’s largest trading partner. Bullock has said that the RBA will make its rate decisions based on the data, and with third-quarter inflation not coming out until later this month, that would push any rate moves to at least November.
In the US, manufacturing has been in a deep hole, with the PMI reeling off 10 straight declines. The trend is expected to continue on Tuesday, with the ISM Manufacturing PMI for September expected at 48.9, compared to 47.9 in August..
AUD/USD Technical
- AUD/USD is testing support at 0.6423. The next support line is 0.6345
- There is resistance at 0.6514 and 0.6592
USD/JPY Rallied to 11-month High Despite Rosy Q3 Tankan Report and Verbal Interventions
- Upbeat longer-term inflationary expectations and business sentiment of large Japanese corporations could not derail the relentless up move of USD/JPY.
- Momentum factor and further potential 10-year US Treasury/JGB yield spread premium are supporting this current bout of rallies seen in USD/JPY at least in the short-term.
- The key resistances to watch will be at 150.00/150.30 and 150.80/150.90.
The bulls of USD/JPY have continued to charge forward and broke above last week’s high of 147.71 in today’s (2 October) Asian session as it printed a current intraday high of 149.82 at this time of the writing, just a whisker away from the key psychological level of 150.00.
This current bout of relentless up move of USD/JPY has come despite a better-than-expected Q3 Tankan survey report that indicated sentiment of both large manufacturers and non-manufactures have improved significantly.
The large manufacturers’ sentiment climbed to 9 points in Q3 from 5 points recorded in Q2 which was the highest print since Q2 2022 and surpassed consensus of 6 points. Similarly, the large non-manufacturers index rose to 27 points to a 32-year high in Q3 from 23 points in Q2, above the consensus of 24 points.
In addition, the Q3 Tankan survey report has also highlighted most Japanese firms expect an elevated inflationary trend where consumer prices are likely to stay above the Bank of Japan (BoJ) target of 2% for the next three to five years.
Fundamentally speaking, this latest set of key economic data should encourage some signs of intraday JPY strength to put a breather to the ongoing major uptrend of USD/JPY in place since mid-January 2023. But price actions have decided to move in the opposite direction against the latest fundamental factors and the latest round of “verbal interventions” out this morning’s Asian session from Japan’s Finance Minister Suzuki and Chief Cabinet Secretary Matsuno in an attempt to talk down the strength of USD/JPY.
Therefore, it seems that the current short-term bullish trend of USD/JPY seems to be supported by the momentum factor & the 10-year US Treasury yield premium expansion over the 10-year Japanese Government Bonds (JGBs).
US 10-year US Treasury/JGB yield spread is looking to eye 3.99% next
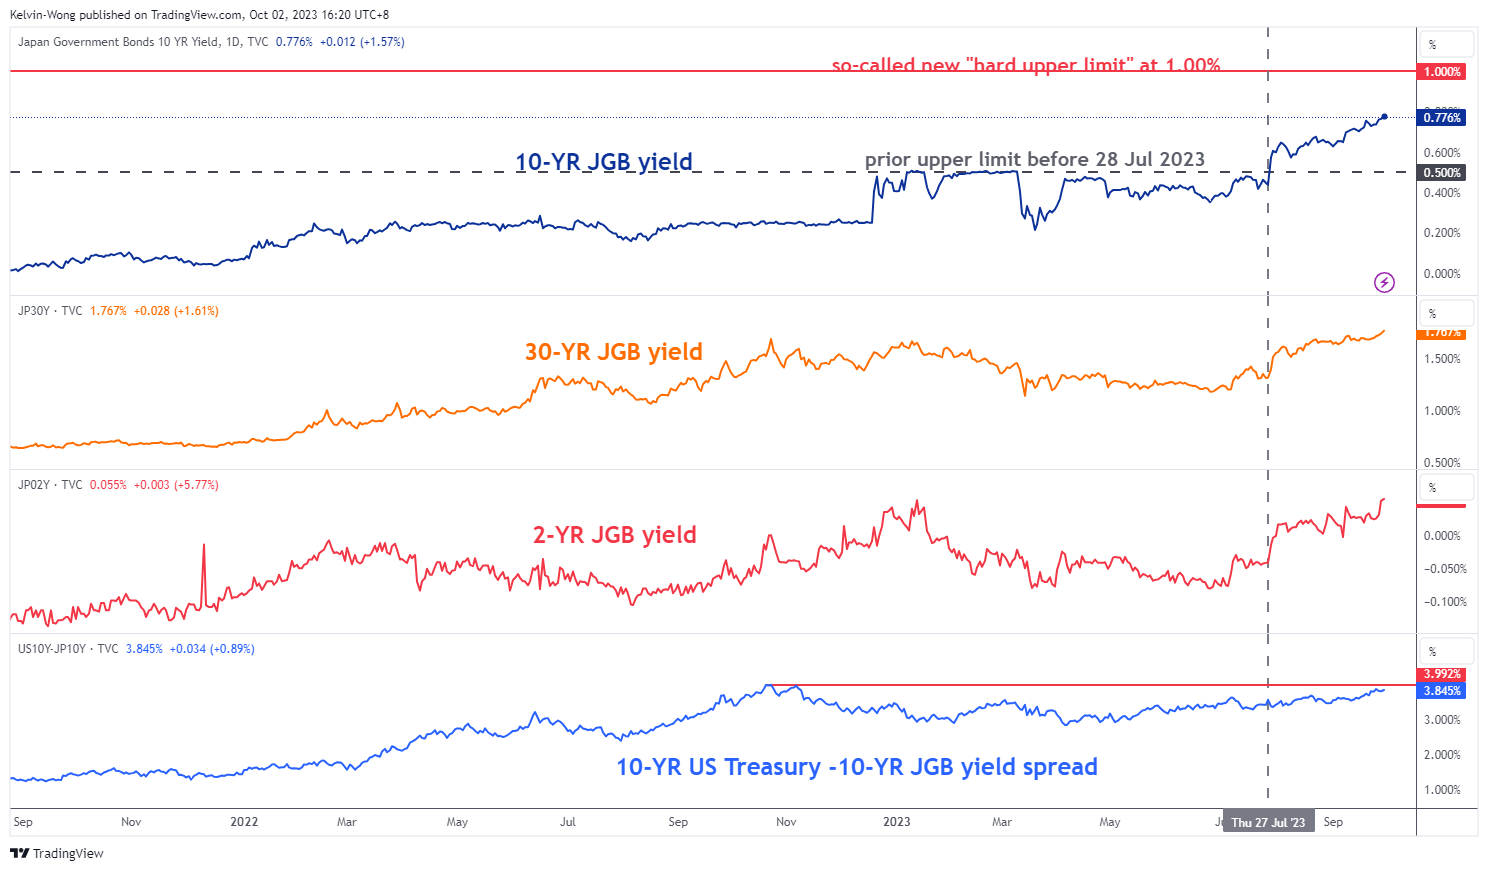
Fig 1: JGB yields medium-term trends with 10-year US Treasury/10-year JGB yield spread as of 2 Oct 2023 (Source: TradingView, click to enlarge chart)
Despite the current sticky rally seen in the 10-year JGB yield since ex-post 28 July 2023’s BoJ newly adjusted “flexible yield curve control” policy has hit 0.77% today, close to a 10-year high but the 10-year US Treasury yield has risen by a higher magnitude.
Therefore, the yield premium between the 10-year US Treasury and 10-year JGB has continued to expand in a steady uptrend and now looking to test the major resistance level of 3.99% with the current yield spread trading at 3.85% at this time of the writing. Hence, another potential positive 14 basis points (bps) up move in the yield premium may occur which in turn is able to support a further potential rally in the USD/JPY at least in the short term.
Bullish momentum breakout seen in daily RSI of USD/JPY
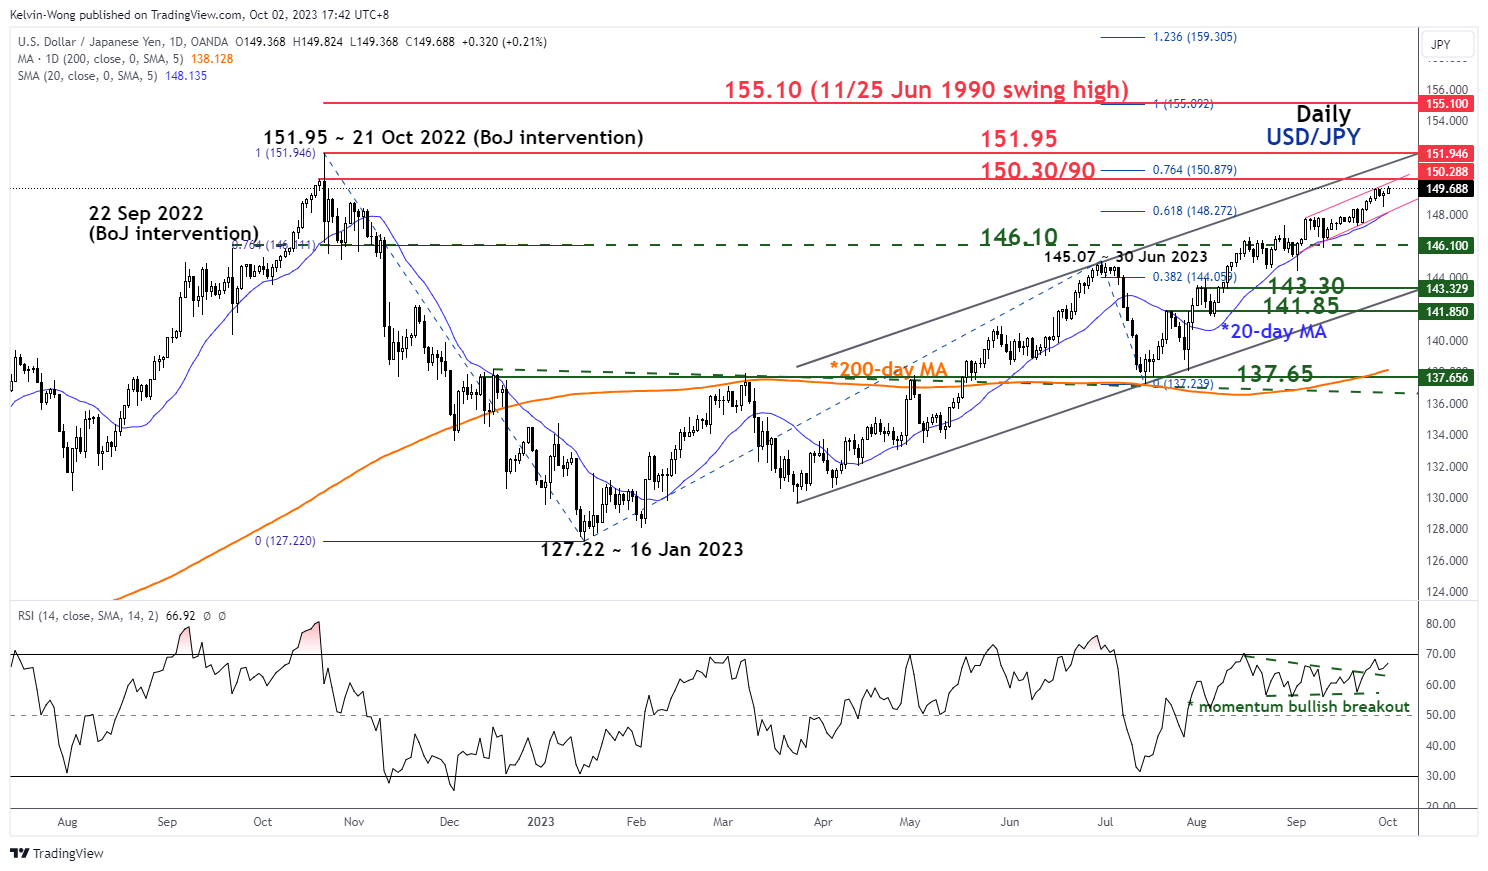
Fig 2: USD/JPY major & medium-term trends as of 2 Oct 2023 (Source: TradingView, click to enlarge chart)
The daily RSI indicator of the USD/JPY, a gauge of momentum has shaped a bullish momentum breakout on 26 September 2023 from a former consolidation in place since 16 August 2023 near its overbought zone.
These observations suggest that medium-term upside momentum remains intact which in turn supports a further potential up move in USD/JPY.
Oscillating within a minor ascending channel
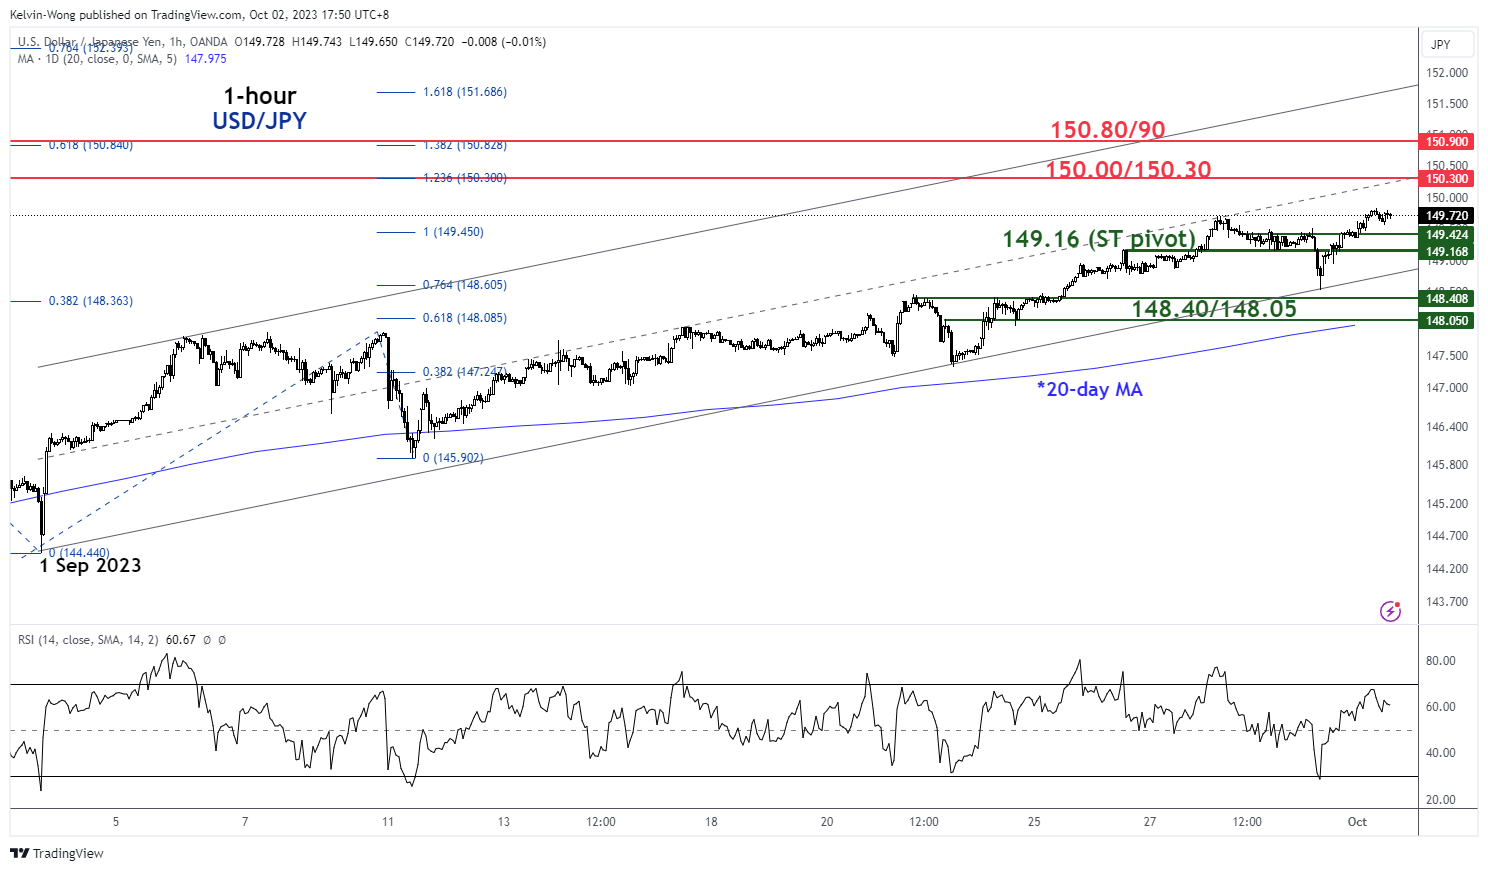
Fig 3: USD/JPY minor short-term trend as of 2 Oct 2023 (Source: TradingView, click to enlarge chart)
As seen on the shorter-term 1-hour chart of the USD/JPY, its price actions have oscillated within a short-term minor ascending channel in place since the 1 September 2023 low of 144.44.
Watch the 149.16 key short-term pivotal support to maintain a potential short-term impulsive up leg sequence in the USD/JPY to see the next intermediate resistance coming at 150.00/150.30, and a break above it may see a further push up towards 150.80/150.90 major resistance (21 October 2022 swing high area & a cluster of Fibonacci extension levels).
On the other hand, a breakdown below 149.16 put the bullish tone in jeopardy for a corrective pull-back to expose the next intermediate support at 148.40/148.05 (also the 20-day moving average).
EUR/USD: Bears Regaining Traction After Brief Recovery
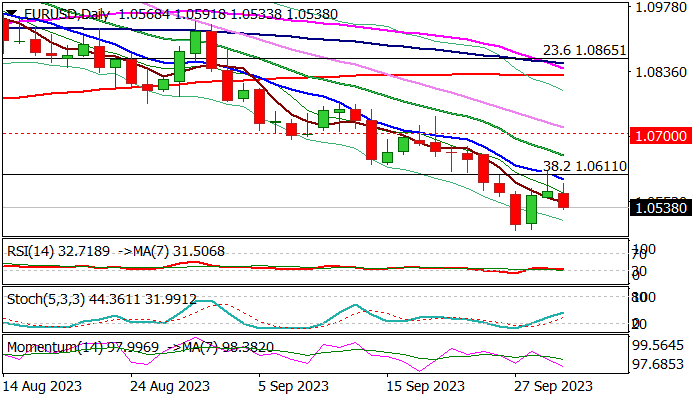
EURUSD accelerated lower in early Monday trading, generating initial signal that two-day recovery is likely over, and larger bears are regaining control.
The notion is supported by the long shadow of Friday’s daily candle, which indicated strong upside rejection (recovery was capped by broken Fibo 38.2% of 0.9535/1.1275 rally, reverted to solid resistance and reinforced by falling 10DMA).
Larger downtrend (the pair has registered eleven consecutive weekly losses) paused for a brief consolidation on oversold daily studies but persisting strong downside pressure limited recovery attempts.
Technical studies remain in full bearish setup on daily chart, adding to signals of possible bearish continuation scenario, with break of 1.0488 (new nine-month low) to expose target at 1.0405 (50% retracement) and risk deeper drop on break.
Near-term bias is expected to remain with bears while 1.0611 barrier caps the action.
Busy calendar for this week suggests that volatility is likely to increase, with release of US Sep Manufacturing PMI being the highlight today.
The activity in manufacturing sector is expected to show slight improvement in September (47.7 f/c vs 47.6 in Aug) though the sector remains in a contraction (below 50 threshold) since November 2022, but initial signals of reversal might be developing, as the indicator gradually recovered from June’s multi-year low in past two months.
Investors will be also closely watching series of releases of reports from the US labor sector this week (JOLTS; ADP; NFP) which will provide more evidence about the conditions in the sector and contribute to Fed’s creation of the monetary policy in coming months.
Res: 1.0598; 1.0617; 1.0652; 1.0700.
Sup: 1.0483; 1.0405; 1.0284; 1.0200.
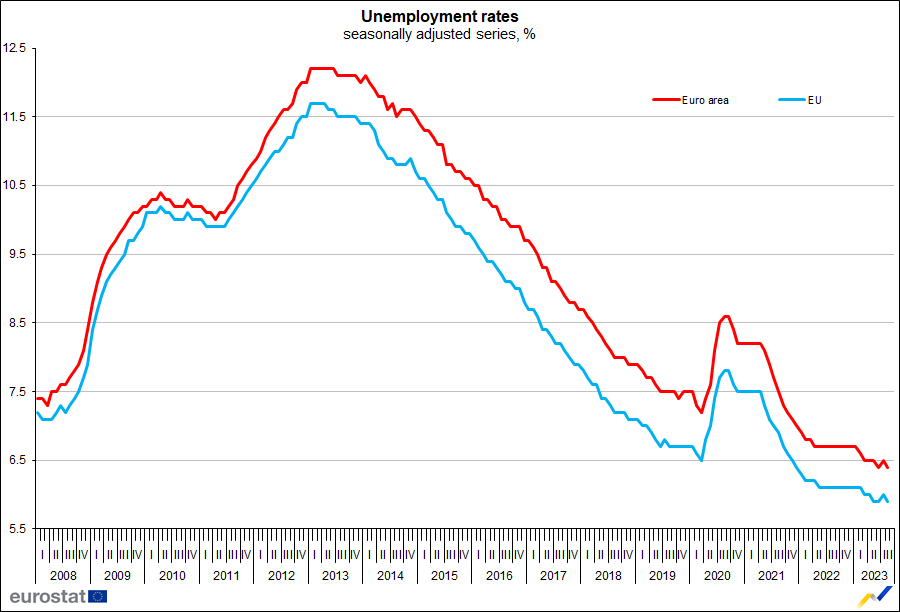
Eurozone unemployment rate ticks down to 6.4%, EU down to 5.9%
Unemployment rate in Eurozone has seen a drop from 6.5% to 6.4% in August, aligning with market expectations. Similarly, the broader EU reported a decrease in its unemployment rate, ticking down from 6.0% to 5.9%.
Eurostat, provided further details on this development. As of August 2023, an estimated 12.837m individuals in EU were unemployed. Out of these, Eurozone accounted for 10.856m jobless persons. When juxtaposed with the data from July, there's a marked decrease of -112k unemployed persons in EU, with Eurozone contributing a decline of -107k to this number.
An even more pronounced positive trend emerges when the data is analyzed year-on-year. From August 2022 to August 2023, EU saw a reduction in unemployment by -335k individuals, while Eurozone alone experienced a decline of -407k unemployed persons.
XAU/USD: Gold Price at Lowest in Nearly Seven Months Ahead of Key US Labor Data
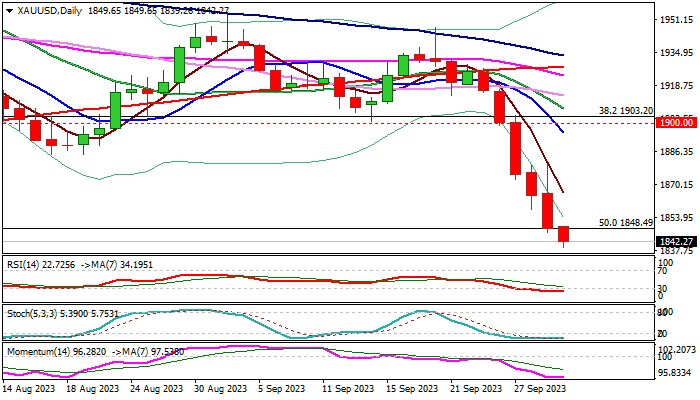
Gold keeps negative tone at the beginning of the week and fell to new lowest in almost seven months ($1839) in early European trading on Monday.
The metal extends steep fall into sixth straight day after registering weekly loss of 4% last week (the biggest weekly drop since mid-June 2021).
Gold was down 4.7% in September, mainly driven by stronger dollar, but recent weak US economic data signal that tight Fed monetary policy started to bite, which may result in fresh demand for safe-haven yellow metal.
Data on Friday showed that underlying US inflation eased last month (PCE index, closely watched by Fed), adding to signals that the central bank might be done with rate hikes, though percentage of expectations for another hike is still significant.
The US economic data to be released this week, are expected to provide more details, with today’s speech by Fed Chair Powell to be followed by job openings, private sector hiring and non-farm payrolls.
Technical picture on daily chart is bearish but deeply oversold, which suggests that bears may start to face headwinds.
Fresh weakness broke below $1848 (50% of $1616/$2080 rally) and eyeing $1823 (weekly Ichimoku cloud base) which may mark a strong obstacle and pause larger bears.
Slower pace ahead of key US labor data is likely and a partial profit taking after a steep fall could be a likely near-term scenario, with overall bearish bias to remain intact while the price stays below former low at $1885 (Aug 17).
Caution on return above $1900 zone (former strong support, now reverted to significant resistance) which would put larger bears on hold.
Res: 1848; 1866; 1885; 1895.
Sup: 1839; 1823; 1814; 1804.
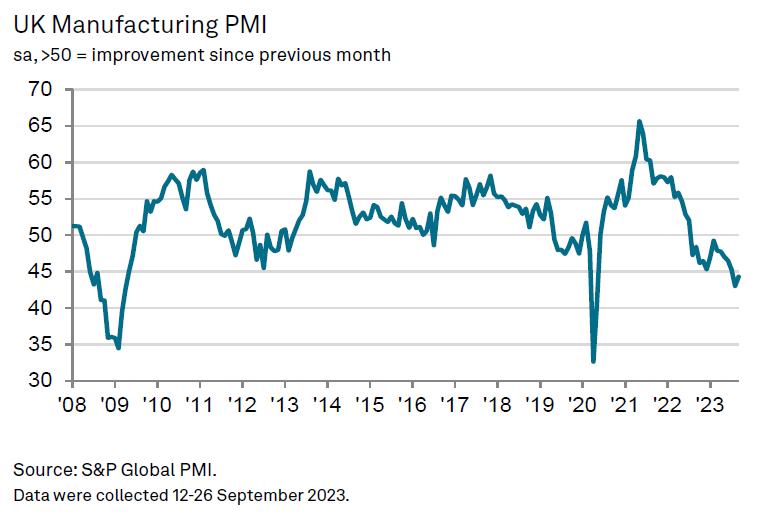
UK PMI manufacturing finalized at 44.3, still mired in contraction
UK PMI Manufacturing experienced a slight uptick, finalized 44.3 in September from the previous month's 39-month low of 43.0. However, despite this marginal improvement, an in-depth examination of the five sub-indices of the PMI - new orders, output, employment, stocks of purchases, and supplier delivery times - revealed a consistent downturn in the sector's performance.
Rob Dobson, Director at S&P Global Market Intelligence, portrayed a challenging scene for the UK's manufacturing industry. "September saw the manufacturing sector still mired in contraction territory," he noted. This is attributed to weakened conditions both domestically and internationally that have negatively impacted new order intakes, leading to reduced production volumes.
One of the significant factors exacerbating the situation is the ongoing cost-of-living crisis in the UK. A rapid increase in interest rates is further pressuring the manufacturing sector. Producers have explicitly linked these developments to the troubles they are encountering.
EURUSD Bounces Off 8-month Low; Downtrend Intact
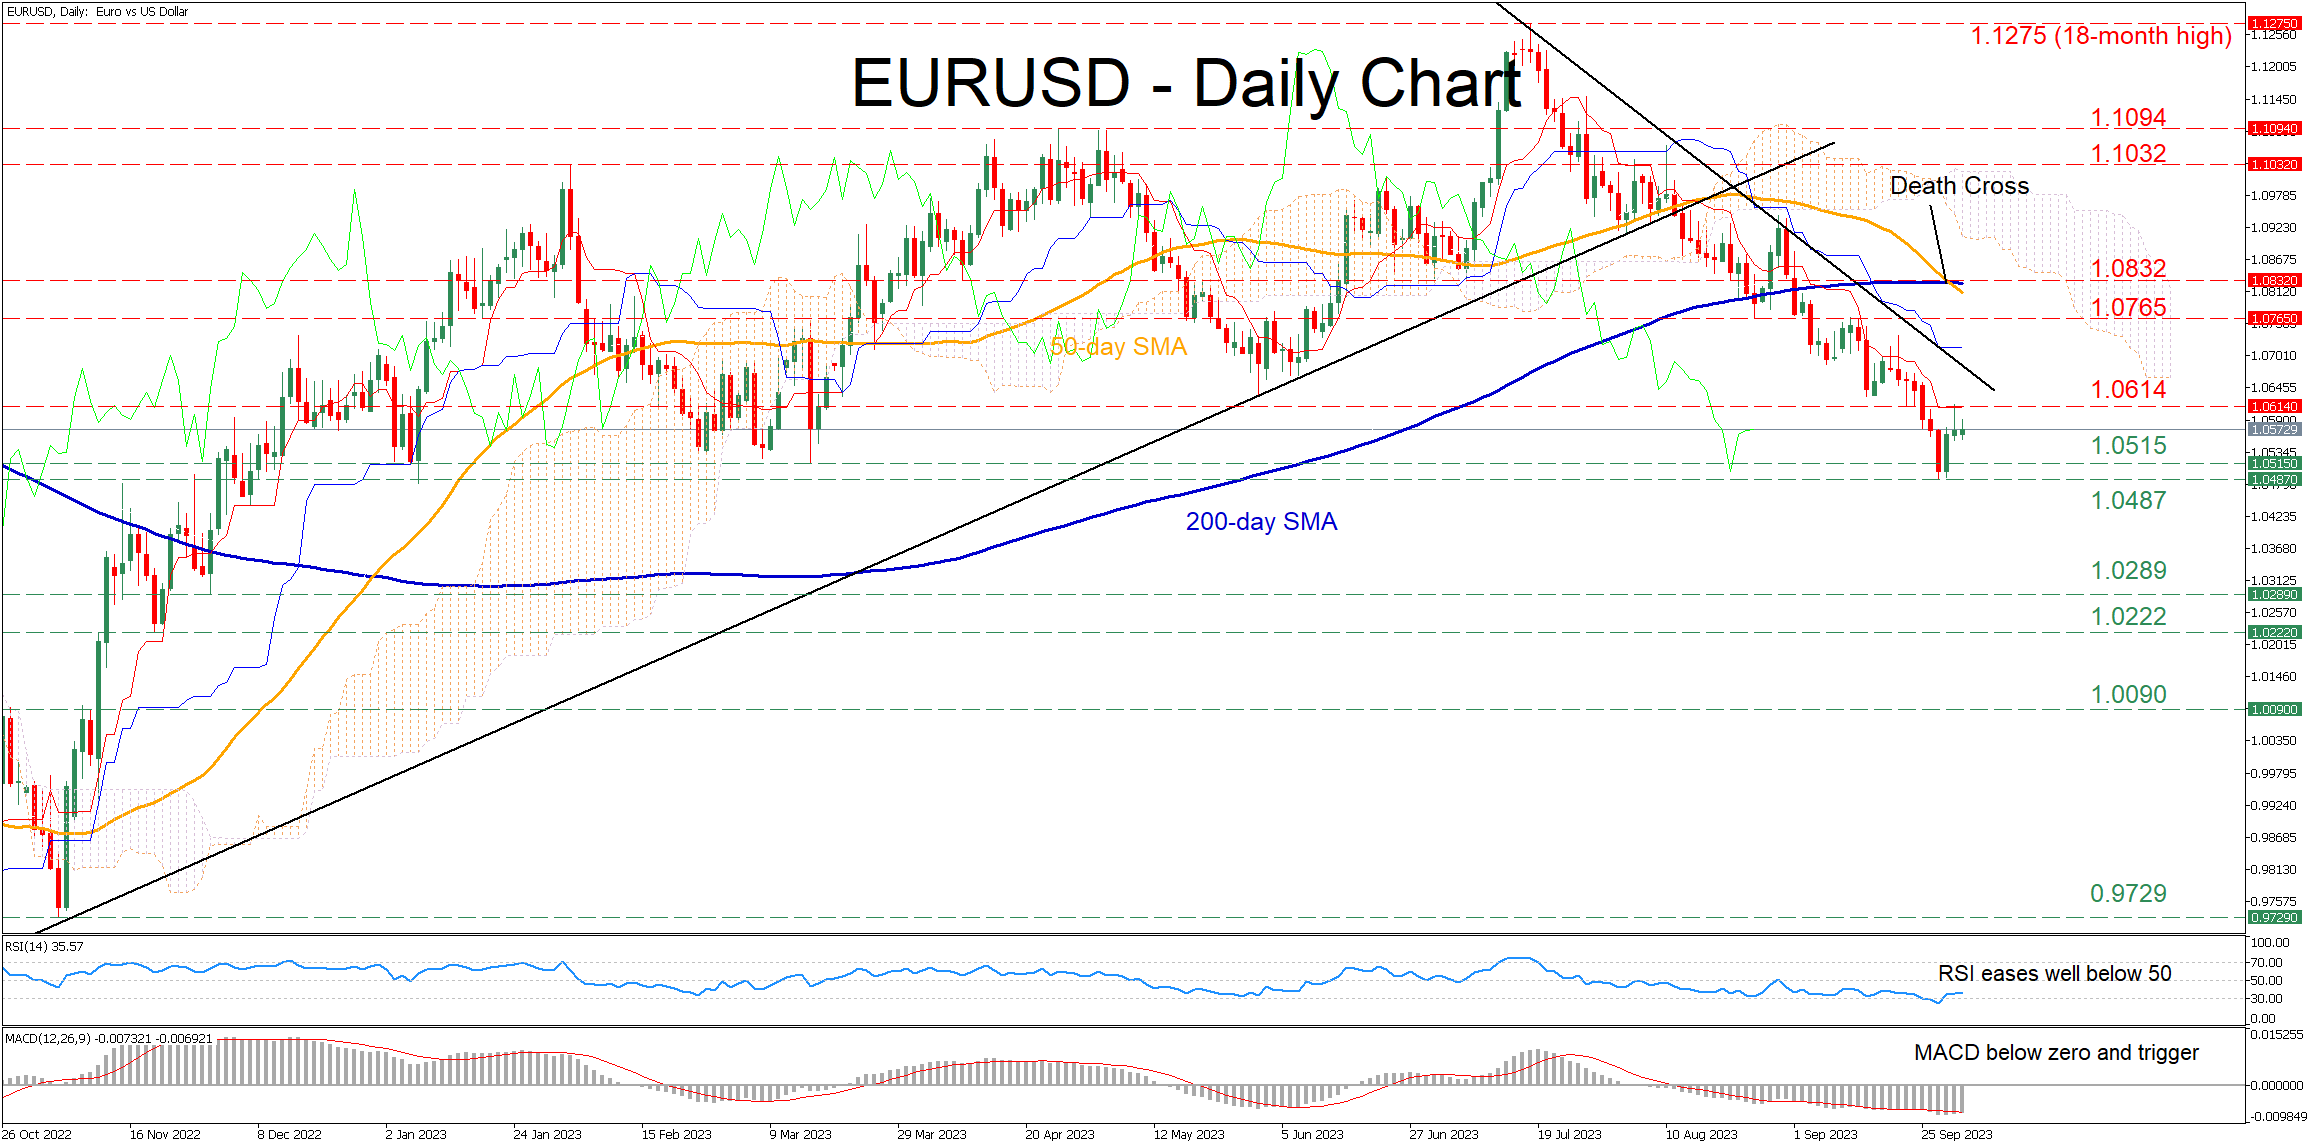
- EURUSD stuck in a clear downward path, posting a fresh 8-month bottom of 1.0487
- Formation of a death cross between 50- and 200-day SMAs could spell more trouble
- Despite latest rebound the momentum indicators remain skewed to the bearish side
EURUSD has been in a steady retreat after peaking at the 18-month high of 1.1275 on July 18, generating a series of lower highs and lower lows. Even though the pair managed to find its feet at the eight-month bottom of 1.0487, the bearish short-term structure remains in place.
Should the bears attempt to push the price lower, the March bottom of 1.0515 could prove to be the first barrier for the pair to clear. A violation of that floor could pave the way for the recent eight-month low of 1.0487. Piercing through that region, the price might then slide towards the November 2022 support zone of 1.0289.
On the flipside, if the pair reverses back higher, initial advances could be rejected at the recent resistance region of 1.0614 before the 1.0765 hurdle gets tested. Even higher, the June-July support of 1.0832 may serve as strong resistance in the future. Failing to halt there, the pair could then ascend towards the February peak of 1.1032.
In brief, despite the latest bounce, EURUSD remains stuck in a steep downtrend. Looking forward, the recent completion of a death cross between the 50- and 200-day simple moving averages (SMAs) could induce further downside pressures.