Sample Category Title
EUR/USD Upsides Could Remain Capped, PMI’s Next
Key Highlights
- EUR/USD is attempting a recovery wave from the 1.0485 zone.
- A major bearish trend line is forming with resistance near 1.0640 on the 4-hour chart.
- GBP/USD declined toward 1.2100 before it found support.
- The US ISM Manufacturing Index could increase from 47.6 to 47.9 in Sep 2023.
EUR/USD Technical Analysis
The Euro followed a bearish path below 1.0650 against the US Dollar. EUR/USD dived below the 1.0550 zone to enter a bearish zone.
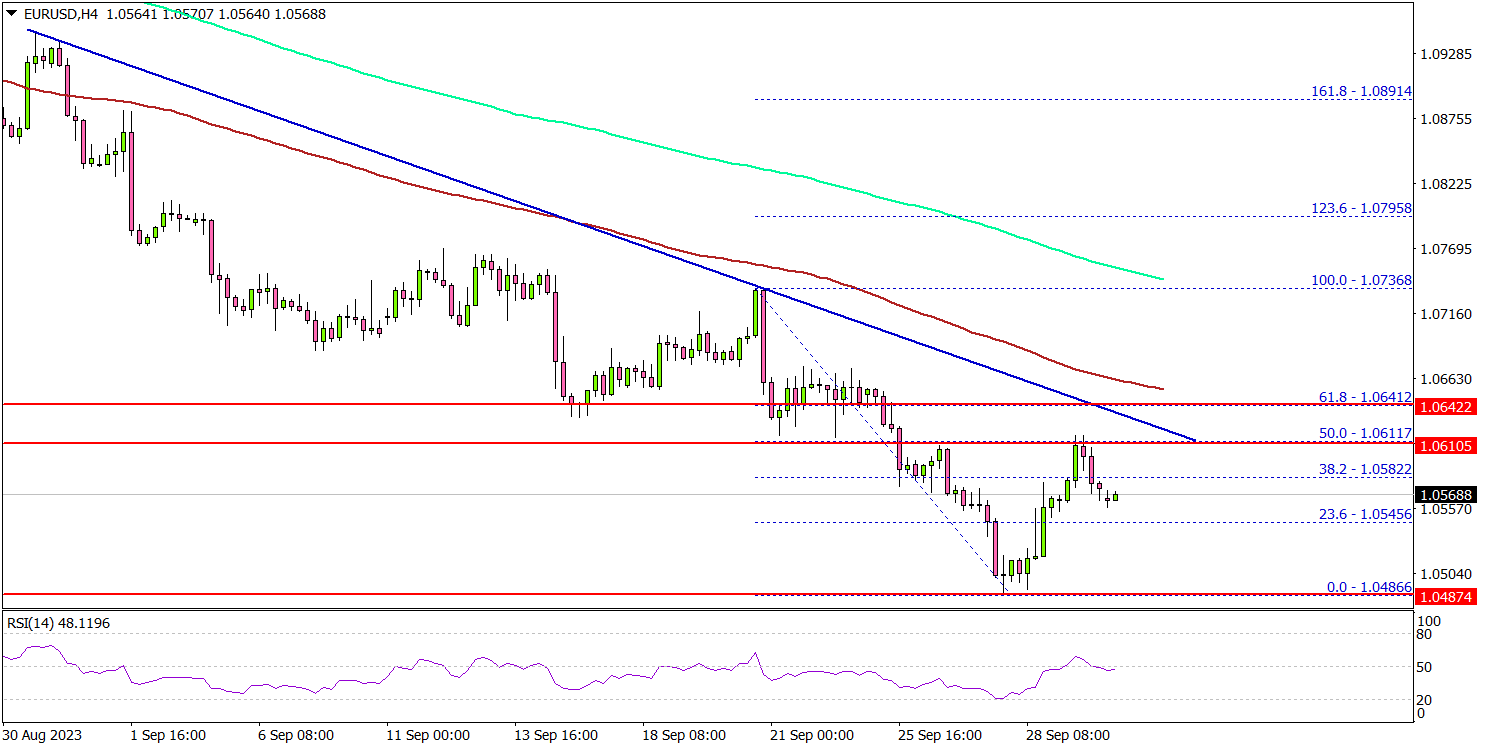
Looking at the 4-hour chart, the pair settled below the 1.0620 level, the 100 simple moving average (red, 4 hours), and the 200 simple moving average (green, 4 hours).
A low was formed near 1.0486 and the pair recently started an upside correction. There was a move above the 1.0550 level. The pair tested the 50% Fib retracement level of the downward move from the 1.0736 swing high to the 1.0486 low.
On the upside, immediate resistance is near the 1.0620 level. The first major resistance is near 1.0640. There is also a major bearish trend line forming with resistance near 1.0640 on the same chart.
The trend line is near the 61.8% Fib retracement level of the downward move from the 1.0736 swing high to the 1.0486 low. A close above 1.0640 could start a steady increase toward 1.0750.
If there is no break above 1.0640, the pair could start another decline. Immediate support is near the 1.0550 level. The next key support is seen near the 1.0520 level, below which it could test 1.0485. Any more losses might send the pair toward the 1.0350 level.
Looking at GBP/USD, the pair extended its decline toward the 1.2100 level and is currently attempting a recovery wave.
Economic Releases
- Germany’s Manufacturing PMI for Sep 2023 - Forecast 39.8, versus 39.8 previous.
- Euro Zone Manufacturing PMI for Sep 2023 – Forecast 43.4, versus 43.4 previous.
- UK Manufacturing PMI for Sep 2023 – Forecast 44.2, versus 44.2 previous.
- US Manufacturing PMI for Sep 2023 – Forecast 48.9, versus 48.9 previous.
- US ISM Manufacturing Index for Sep 2023 – Forecast 47.9, versus 47.6 previous
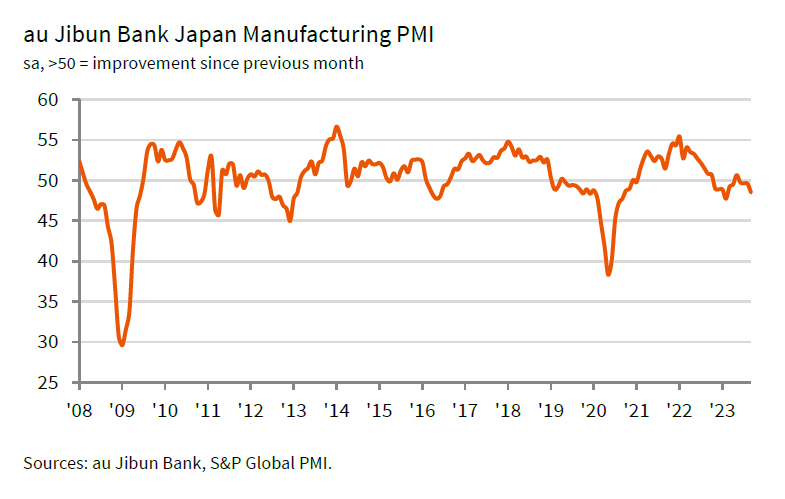
Japan PMI manufacturing finalized at 48.5 in Sep, headwinds at home and abroad
Japanese manufacturing sector is facing challenges as evidenced by the drop in PMI Manufacturing to 48.5 in September, down from August's 49.6, the lowest level since February. Additionally, the average reading for Q3 stands at 49.3, a reduction from 50.0 in Q2.
According to key findings by S&P Global, the sector experienced faster falls in production and incoming new work. Alarmingly, backlogs declined at the strongest rate since April. A specific area of concern is the accelerated rate of input price inflation, reaching a four-month high, fueled by increasing costs of raw materials, oil, freight, and energy.
Usamah Bhatti at S&P Global Market Intelligence, conveyed a sombre view of the situation. He noted, "Depressed economic conditions domestically and globally weighed heavily on the sector, as both output and new orders were scaled back further. The decline in the latter was notably sharp, and the strongest seen for seven months." The future outlook is also tinged with apprehension, as manufacturers signaled the most significant depletion in outstanding business in five months.
The inflationary aspect further complicates the picture. Bhatti highlighted, "The rate of input price inflation accelerated for the second month running to a four-month high." Reports indicated that the sustained weakness of the yen is exacerbating the situation, elevating prices for inputs from abroad and placing an additional strain on firms.
Japan’s Tankan survey reveals strong business sentiment
The latest Tankan survey results in Q3 showcased strengthening corporate sentiment in Japan. Key indices and outlooks, along with projections for capital expenditure, underscore a robust business environment, as inflation expectations maintain steadiness.
Large Manufacturing Index showed notable gains from 5 to 9, marking its second consecutive quarter of growth. Concurrently, Large Non-Manufacturing Index advanced from 23 to 27, recording its best level since 1991 and marking its sixth straight quarter of improvement.
Further reflecting this positive trend, Large Manufacturing Outlook Index increased from 9 to 10, while its Large Non-Manufacturing Outlook saw an ascent from 20 to 21.
In terms of capital commitments, prominent firms revealed ambitious plans, with an anticipation to bolster capital expenditure by 13.6% for the fiscal year ending March 2024.
Regarding inflation, the corporate sector's expectations remain consistent. Firms anticipate a price increase of 2.5% in the upcoming year, 2.2% over a three-year horizon, and 2.1% looking five years ahead. These figures mirror projections made in the prior quarter.
A crucial insight from a BOJ official noted that many large businesses have successfully offset higher costs by adjusting consumer prices, subsequently enhancing the overall business sentiment.
Further elevating the positive mood have been factors such as a resurgence in auto production and declining costs for raw materials. However, the official also acknowledged the challenges faced by some smaller enterprises, which have found it difficult to raise their prices.
BoJ opinions: A blend of caution and optimism
Summary of Opinions of BoJ's September 21-22 meeting reiterated the general stance that ultra-loose monetary policy remains necessary for now. Yet, there was an undercurrent of optimism, with some members seeing achieve of price target "in sight".
The collective view reinforced that the "sustainable and stable achievement of the price stability target, accompanied by wage increases, has not yet come in sight." Given this scenario, the summary stressed the necessity to "patiently continue with monetary easing under yield curve control."
Underpinning the continued focus on wages, one member stated it is "necessary" to uphold the "momentum for wage hikes through continuation of monetary easing." Also, in order to achieve inflation target of 2 percent in a sustainable manner, it is necessary that "wage increases take root."
However, amid the cautious tones, rays of optimism emerged. One member opined that "Japan's economy is getting closer to achieving the price stability target, although there is somewhat of a distance to go." Providing a potential timeline for evaluating the price stability objective, focus is now on "the second half of fiscal 2023" especially considering the wage growth prospects for 2024.
Furthering this optimism, another viewpoint conveyed confidence, indicating that "Achievement of 2 percent inflation in a sustainable and stable manner seems to have clearly come in sight." This perspective also hinted at a clearer outcome by "January to March of next year."
WTI Wave Analysis
- WTI reversed from resistance level 92.00
- Likely to fall to support level 87.00
WTI crude oil earlier reversed down from the pivotal resistance level 92.00 (which reversed the price strongly at the end of 2022) intersecting with the upper weekly Bollinger Band and the 50% Fibonacci correction of the downtrend from the middle of the last tear.
The downward reversal from the resistance level 92.00 will create the second consecutive weekly candlesticks reversal pattern Doji – signalling the strength of the resistance level 92.00.
Given the strength of the resistance level 92.00, WTI crude oil can be expected to fall further toward the next support level 87.00.

EURCAD Wave Analysis
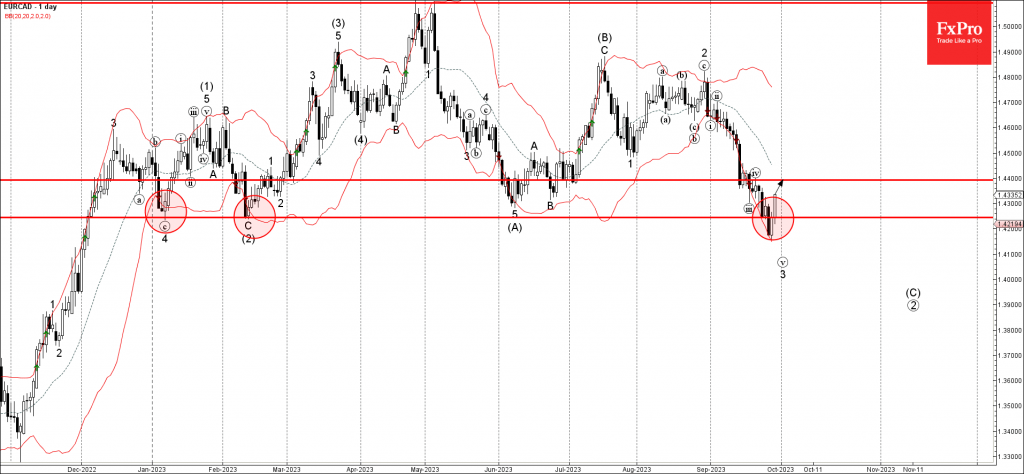
- EURCAD reversed from long-term support level 1.4245
- Likely to rise to resistance level 1.4400
EURCAD currency pair recently reversed up from the long-term support level 1.4245 (which has been reversing the price from January) intersecting with the lower daily Bollinger Band.
The upward reversal from the support level 1.4245 created the daily candlesticks reversal pattern Bullish Engulfing – strong buy signal for this currency pair.
Given the strength of the support level 1.4245, EURCAD currency pair can be expected to rise further toward the next resistance level 1.4400 (top of the previous wave iv).
Forex and Cryptocurrencies Forecast
EUR/USD: Correction is Not a Trend Reversal Yet
The dynamics of the EUR/USD pair in the past week were atypical. In a standard scenario, combating inflation against the backdrop of a strong economy and a healthy labour market leads to an increase in the central bank's interest rate. This, in turn, attracts investors and strengthens the national currency. However, this time the situation unfolded quite differently.
U.S. macroeconomic data released on Thursday, September 28, indicated strong GDP growth in Q2 at 2.1%. The number of initial unemployment claims was 204K, slightly higher than the previous figure of 202K, but less than the expected 215K. Meanwhile, the total number of citizens receiving such benefits amounted to 1.67 million, falling short of the 1.675 million forecast.
This data suggests that the U.S. economy and labour market remain relatively stable, which should prompt the U.S. Federal Reserve to increase interest rates by 25 basis points (bps). It's worth noting that Neil Kashkari, President of the Federal Reserve Bank of Minneapolis, recently confirmed his full support for such a move, as combating high inflation remains the central bank's primary objective. Jamie Dimon, CEO of JPMorgan, went even further, stating that he does not rule out the possibility of rate hikes from the current 5.50% to as high as 7.00%.
However, these figures and forecasts failed to make an impression on market participants. Especially since the rhetoric from Fed officials proved to be quite contradictory. For instance, Thomas Barkin, President of the Federal Reserve Bank of Richmond, does not believe that U.S. GDP will continue to grow in Q4. He also pointed out that there's a wide range of opinions regarding future rates and that it's unclear if additional changes in monetary policy are required. Austin Goolsbee, President of the Federal Reserve Bank of Chicago, noted that overconfidence in the trade-off between inflation and unemployment carries the risk of policy mistakes.
Such statements have tempered bullish sentiment on the dollar. Amid this murky and contradictory backdrop, yields on U.S. Treasury bonds, which had been supporting the dollar, fell from multi-year highs. Uncertainty surrounding the U.S. federal budget and the threat of a government shutdown also weighed on the dollar. Furthermore, September 28 and 29 marked the last trading days of Q3, and after 11 weeks of gains, dollar bulls began closing long positions on the DXY index, locking in profits.
As for the Eurozone, inflation has clearly started to wane. Preliminary data indicates that the annual Consumer Price Index (CPI) growth in Germany has slowed from 6.4% to 4.3%, reaching its lowest point since the onset of Russia's military invasion of Ukraine. The overall Eurozone CPI also fell—despite a previous rate of 5.3% and a forecast of 4.8%, it declined to 4.5%.
This reduction in CPI led to a rescheduling of the European Central Bank's (ECB) anticipated dovish policy shift from Q3 2024 to Q2 2024. Moreover, the likelihood of a new interest rate hike has significantly diminished. In theory, this should have weakened the euro. However, concerns over the fate of the dollar proved to be more impactful, and after bouncing off 1.0487, EUR/USD moved upward, reaching a high of 1.0609.
According to analysts at Germany's Commerzbank, some traders were simply very dissatisfied with levels below 1.0500, so neither macro data nor statements from Fed officials could exert any significant influence on this. However, the rebound does not indicate either a trend reversal or the complete end of the dollar rally. Commerzbank analysts believe that since the market has clearly bet on a soft landing for the U.S. economy, the dollar is likely to react particularly harshly to data that does not confirm this viewpoint.
Analysts at MUFG Bank also believe that the 1.0500 zone has finally become a strong level that served as a catalyst for the reversal. However, in the opinion of the bank's economists, the correction is primarily technical in nature and could soon fizzle out.
On Friday, September 29, traders awaited the release of the Personal Consumption Expenditures Index (PCE) in the U.S., which is a key indicator. Year-on-year, it registered at 3.9%, precisely matching forecasts (the previous figure was 4.3%). The market reacted with a minor increase in volatility, after which EUR/USD closed the trading week, month, and quarter at 1.0573. Strategists at Wells Fargo, part of the "big four" U.S. banks, believe that Europe's low metrics compared to the U.S. should exert further downward pressure on the euro. They also believe that the European Central Bank (ECB) has already concluded its current cycle of monetary tightening, as a result of which the pair may drop to the 1.0200 level by early 2024.
Shifting from the medium-term outlook to the near-term, as of the evening of September 29, expert opinions are evenly split into three categories: one-third foresee further dollar strengthening and a decline in EUR/USD; another third expect an upward correction; and the last third take a neutral stance. As for technical analysis, both among trend indicators and oscillators on the D1 chart, the majority, 90%, still favor the U.S. dollar and are coloured red. Only 10% side with the euro. The pair's nearest support levels are around 1.0560, followed by 1.0490-1.0525, 1.0375, 1.0255, 1.0130, and 1.0000. Bulls will encounter resistance in the area of 1.0620-1.0630, then 1.0670-1.0700, followed by 1.0745-1.0770, 1.0800, 1.0865, 1.0895-1.0925, 1.0985, and 1.1045.
Data releases pertaining to the U.S. labour market are anticipated throughout the week spanning from October 3 to October 6. The week will culminate on Friday, October 6, when key indicators, including the unemployment rate and the Non-Farm Payroll (NFP) figures, are set to be disclosed. Earlier in the week, specifically on Monday, October 2, insights into the U.S. manufacturing sector's business activity (PMI) will be unveiled. Federal Reserve Chair Jerome Powell is also scheduled to speak on this day. On Wednesday, October 4, information regarding the business activity in the U.S. services sector as well as Eurozone retail sales will be made public.
GBP/USD: No Drivers for Pound Growth
According to the latest data published by the UK's National Statistics Office, the country's Gross Domestic Product (GDP) increased by 0.6% year-over-year in Q2, exceeding expectations of 0.4% and up from 0.5% in the previous quarter. While this positive trend is certainly encouraging, the UK's 0.6% growth rate is 3.5 times lower than the comparable figure in the United States, which stands at 2.1%. Therefore, any commentary on which economy is stronger is unnecessary.
Strategists from ING, the largest banking group in the Netherlands, believe that GBP/USD rose in the second half of the past week solely due to a correction in the U.S. dollar. According to them, there are no tangible catalysts related to the United Kingdom that would justify a sustained increase in the British currency at this stage.
Analysts at UOB Group anticipate that GBP/USD could fluctuate within a fairly broad range of 1.2100-1.2380 over the next 1-3 weeks. However, Wells Fargo strategists expect the pair to continue its decline, reaching the 1.1600 zone in early 2024, where it last traded in November 2022. The likelihood of such a move is corroborated by signals from the Bank of England suggesting that the interest rate on the pound may have peaked.
GBP/USD closed the past week at the 1.2202 mark. Analyst opinions on the pair's near-term future are split, offering no clear direction: 40% are bullish on the pair, another 40% are bearish, and the remaining 20% have adopted a neutral stance. Among trend indicators and oscillators on the daily chart (D1), 90% are painted in red, while 10% are in green. Should the pair move downward, it will encounter support levels and zones at 1.2120-1.2145, 1.2085, 1.1960, and 1.1800. Conversely, if the pair rises, it will face resistance at 1.2270, 1.2330, 1.2440-1.2450, 1.2510, 1.2550-1.2575, 1.2600-1.2615, 1.2690-1.2710, 1.2760, and 1.2800-1.2815.
No significant events related to the United Kingdom's economy are anticipated for the upcoming week.
USD/JPY: Awaiting the Breach of 150.00
"Appropriate measures will be taken against excessive currency movements, not ruling out any options," "We are closely monitoring currency exchange rates." Do these phrases sound familiar? Indeed, they should: these are words from yet another verbal intervention conducted by Japan's Finance Minister Shunichi Suzuki on Friday, September 29. He added that "the government has no specific target level for the Japanese yen that could serve as a trigger for currency intervention."
One can agree with the last statement, especially considering that USD/JPY reached the 149.70 level last week, a height it last achieved in October 2022. Moreover, amid large-scale global bond selloffs, the Bank of Japan (BoJ) took measures to curb the rising yields of 10-year JGBs and announced an unscheduled operation to purchase these bonds on September 29. In such a scenario, if not for the global dollar correction, it's highly likely that this operation could have propelled USD/JPY to break through the 150.00 mark.
As we've already noted above, according to many experts, the dollar's sell-off is most likely related to profit-taking in the final days of the week, month, and quarter. Therefore, this trend may soon dissipate, making the breach of the 150.00 level inevitable.
Could 150.00 be the "magic number" that triggers Japan's financial authorities to commence currency interventions? At the very least, market participants view this level as a potential catalyst for such intervention. This is all the more plausible given the current economic indicators. Industrial production remained unchanged in August compared to July, and core inflation in Japan's capital slowed for the third consecutive month in September. Under these conditions, economists at Mizuho Securities believe that although currency interventions may have limited impact, "the government would lose nothing politically by demonstrating to the Japanese public that it is taking the sharp rise in import prices seriously, caused by the weakening yen.".
The week concluded with USD/JPY trading at the 149.32 mark. A majority of surveyed experts (60%) anticipate a southern correction for the USD/JPY pair, possibly even a sharp yen strengthening due to currency intervention. Meanwhile, 20% predict the pair will confidently continue its northward trajectory, and another 20% have a neutral outlook. On the D1 timeframe, all trend indicators and oscillators are painted in green; however, 10% of the latter are signalling overbought conditions. The nearest support levels are situated at 149.15, followed by 148.45, 147.95-148.05, 146.85-147.25, 145.90-146.10, 145.30, 144.45, 143.75-144.05, 142.20, 140.60-140.75, 138.95-139.05, and 137.25-137.50. The closest resistance stands at 149.70-150.00, followed by 150.40, 151.90 (October 2022 high), and 153.15.
Apart from the release of the Tankan Large Manufacturers Index for Q3 on October 2, no other significant economic data concerning the state of the Japanese economy is scheduled for the upcoming week.
CRYPTOCURRENCIES: Hopes on Halving and Halloween
In the first half of the week, BTC/USD trended downward, succumbing to the strengthening U.S. dollar. However, it managed to hold within the $26,000 zone, after which the dynamics shifted: The Dollar Index (DXY) began to weaken, giving the bulls an opportunity to push the pair back to the support/resistance area around $27,000.
It's clear that the stringent monetary policy of the Federal Reserve will continue to exert pressure on bitcoin, as well as the broader cryptocurrency market. While the U.S. regulator opted not to raise the refinancing rate at the end of September, it did not rule out such a move in the future. Adding to the market's uncertainty is the SEC's pending decisions on spot bitcoin ETF applications.
Mark Yusko, CEO of Morgan Creek Capital, believes that a favourable decision by the SEC on these applications could trigger an inflow of $300 billion in investments. In such a scenario, both the market capitalization and the coin's value would significantly increase.
However, the key word here is "if." Anthony Scaramucci, the founder of SkyBridge Capital, acknowledged at the Messari Mainnet Conference in New York the existence of "headwinds" for bitcoin in the form of high interest rates set by the Federal Reserve and the hostility of SEC Chairman Gary Gensler. Nevertheless, this investor and former White House official is confident that bitcoin offers greater prospects than gold. If the bitcoin ETF applications are eventually approved, it would lead to widespread adoption of digital assets. Scaramucci believes that the worst is already behind us in the current bear market. "If you have bitcoin, I wouldn't sell it. You've weathered the winter. [...] The next 10-20 years will be incredibly bullish," he stated. According to the financier, the younger generation will mainstream the first cryptocurrency, just as they did with the internet.
Amid uncertainties surrounding the actions of the Federal Reserve and the SEC, the primary hope for the growth of the crypto market lies in the forthcoming halving event scheduled for April 2024. This event is almost certain to occur. However, even here, opinions vary. A number of experts predict a decline in bitcoin's price before the halving.
An analyst known as Rekt Capital compared the current market situation to the BTC price dynamics in 2020 and speculated that the coin's price could fall within a descending triangle, potentially reaching as low as $19,082.
Well-known trader Bluntz, who accurately predicted the extent of bitcoin's fall during the 2018 bear trend, also foresees a continuing downward trajectory. He doubts that the asset has hit its bottom because the descending triangle pattern forming on the chart appears incomplete. Consequently, Bluntz anticipates that bitcoin could depreciate to around $23,800, thereby completing the third corrective wave.
Benjamin Cowen, another renowned analyst, is also bearish in his outlook. He believes that the BTC price could plummet to the $23,000 level. Cowen bases his prediction on historical patterns, which suggest that the price of the flagship cryptocurrency usually experiences a significant slump before a halving event. According to Cowen, past cycles indicate that BTC and other cryptocurrencies do not exhibit strong performance in the period leading up to this crucial event.
In the event of a downturn in digital asset prices, the upcoming halving could spell financial ruin for many miners, some of whom have already succumbed to the competitive pressures of 2021-2022. Currently, miners are operating on thin margins. At present, block rewards constitute 96% of their income, while transaction fees make up just 4%. The halving will cut the block mining rewards in half, and if this occurs without a corresponding increase in the coin's price, it could lead to financial catastrophe for many operators.
Some companies have started to connect their mining farms directly to nuclear power plants, bypassing distribution networks, while others are looking to renewable energy sources. However, not everyone has such options. According to Glassnode, the industry-average cost to mine one bitcoin currently stands at $24,000, although this varies significantly from country to country. CoinGecko data shows the lowest cost of mining in countries like Lebanon ($266), Iran ($532), and Syria ($1,330). In contrast, due to higher electricity costs, the U.S. sees costs soar to $46,280. If bitcoin's price or network fees do not significantly increase by the time of the halving, a wave of bankruptcies is likely.
Is this a bad or good development? Such bankruptcies would lead to a reduction in the mining of new coins, creating a supply deficit, and ultimately driving up their price. As it is, the crypto exchange reserves have already decreased to 2 million BTC, nearing a six-year low. Market participants are opting to hold their reserves in cold storage, anticipating a future surge in prices.
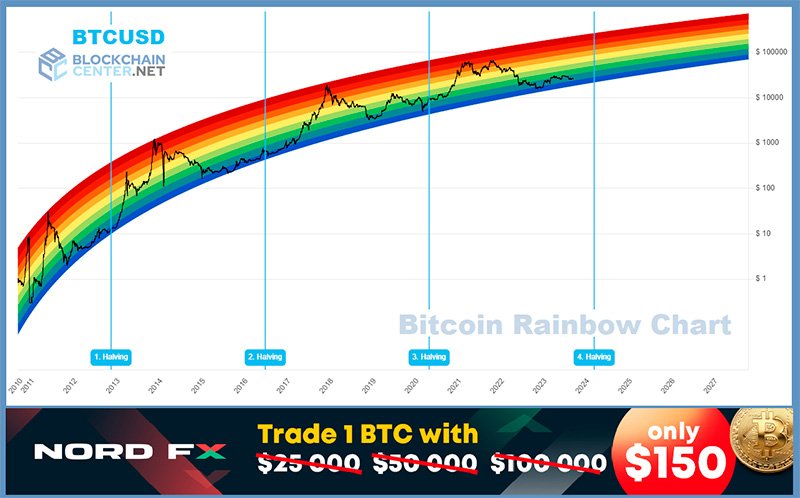
Research firm Fundstrat has speculated that against the backdrop of the halving, BTC prices could surge by more than 500% from current levels, reaching the $180,000 mark. Financial corporation Standard Chartered projects that the price of the flagship cryptocurrency could rise to $50,000 this year and to $120,000 by the end of 2024. The Bitcoin Rainbow Chart by the Blockchain Center also recommends buying; BTC/USD quotes on their chart are currently in the lower zone, suggesting a rebound is due.
According to Michael Saylor, the CEO of MicroStrategy, the inherent supply limitation of bitcoin capped at 21 million coins makes it the best asset for preserving and growing capital. The billionaire compared the depreciation rate of fiat currencies with the dynamics of inflation. He argued that individuals could see their savings erode if held in traditional currencies, citing that over the past 100 years, funds held in U.S. dollars would have lost about 99% of their value.
As of the time of writing this review, on the evening of Friday, September 29, BTC/USD has neither fallen to $19,000 nor risen to $180,000. It is currently trading at $26,850. The overall market capitalization of the cryptocurrency market stands at $1.075 trillion, up from $1.053 trillion a week ago. The Crypto Fear & Greed Index has increased by 5 points, moving from 43 to 48, transitioning from the 'Fear' zone to the 'Neutral' zone.
In conclusion, a forecast for the upcoming month. Experts have once again turned to artificial intelligence, this time to predict the price of the flagship cryptocurrency by Halloween (October 31). AI from CoinCodex posits that by the specified date, bitcoin will increase in price and reach a mark of $29,703.
Interestingly, there is even a term in the crypto market known as "Uptober." The idea is that every October, bitcoin sees significant price gains. Looking at the 2021 figures, bitcoin was trading near $61,300 on October 31, marking an increase of over 344% compared to 2020. This phenomenon remained relevant even in the past year, 2022, following the high-profile crash of the FTX exchange. On October 1, 2022, the asset was trading at $19,300, but by October 31, the coin had reached a mark of $21,000. Let's see what awaits us this time.
Beijing’s stabilization efforts tested as Caixin PMIs highlight growing economic challenges
China's Caixin PMI Manufacturing registered a modest dip in September, dropping to 50.6 from previous 51.0. This reveals a deceleration in growth of the manufacturing sector, albeit still remaining in the expansionary range.
According to the report, the second consecutive month saw an increase in both production and new orders. However, one area of concern is sharp acceleration in input cost inflation, which has reached its highest point in eight months. Despite the ongoing growth, employment scenario seems to be losing steam, with a reported decline, mirroring subdued business confidence.
The situation isn't brighter on the services front. Caixin PMI Services for September recorded a fall from 51.8 to 50.2, marking the lowest value over the past nine months of growth. Though there's a slight increase in services activity, it comes amid decelerating sales growth. Employment in the sector expanded, but only marginally. This subdued performance correlates with the dip in business confidence, which is currently at a ten-month low.
Wang Zhe, Senior Economist at Caixin Insight Group, elaborated on the data, stating, "Both manufacturing and services PMIs tumbled despite remaining in expansionary territory, with the latter falling at a more pronounced rate."
He further pointed out the concerning trend in the manufacturing sector's employment dynamics, which has affected the overall job market. Despite limited growth, output prices witnessed a sharp increase, marking their most rapid ascent since March 2022.
Zhe also commented on the broader economic context: "Over the past few months, Beijing has introduced multiple policies aimed at encouraging consumption, expanding investment and stabilizing expectations. Various important economic indicators have shown marginal improvement, and the macroeconomy has shown signs of stabilization. However, the economic recovery has yet to find a solid footing, with insufficient domestic demand, external uncertainties, and pressure on the job market."
To sum up, while China's economic indicators point to marginal improvement, the underlying data suggests there is a long road ahead to achieve a stable and robust economic recovery. The recent PMI readings, in particular, indicate potential headwinds in both the manufacturing and services sectors.


Full China Caixin PMI manufacturing and services releases.
Dollar’s Ascendancy on Market Flux Challenged by Resilient Aussie and Kiwi
As the global financial markets tread through turbulent waters marked by escalating treasury yields and declining stocks, the US Dollar emerged as a beacon of strength. A noticeable uplift in the currency was observed last week, an upward motion fuelled by the twin factors of soaring treasury yields and a pervasive risk-averse sentiment that gripped the global markets. The slight retraction of Dollar on Friday could be attributed more to end-of-quarter position adjustments than a shift in the currency's overarching bullish tone.
Investors' growing doubts regarding Fed's capability to ensure a soft landing for US economy may exacerbate market jitters in the coming days. Adding to these concerns is the rapid normalization of the yield curve, signaling heightened recession risks. In such an environment, Dollar's potential to ascend is potentiated if both risk aversion in the market and the rally in yields gain further momentum.
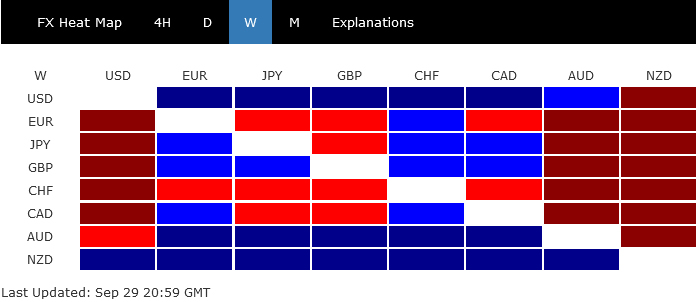
Yet, in the weekly performance matrix, Dollar, despite its robust showing, was eclipsed by New Zealand Dollar, with Australian Dollar trailing close behind. Kiwi and Aussie's resilience, perhaps unexpectedly, could be tethered to a tentative revival of investor confidence in China's economic outlook. However, this glimmer of optimism is tempered by a residue of caution. For these antipodean currencies to firmly establish their rebound, tangible evidence of renewed investor confidence in China will be imperative.
On the other end of the spectrum, Swiss Franc and Euro languished at the lower echelons, marked as the week's underperformers, with Canadian Dollar not far ahead. Sterling and Yen presented a mixed bag.
Onset of whirlwind? Stocks plunge and yields skyrocket as yield curve normalizes swiftly
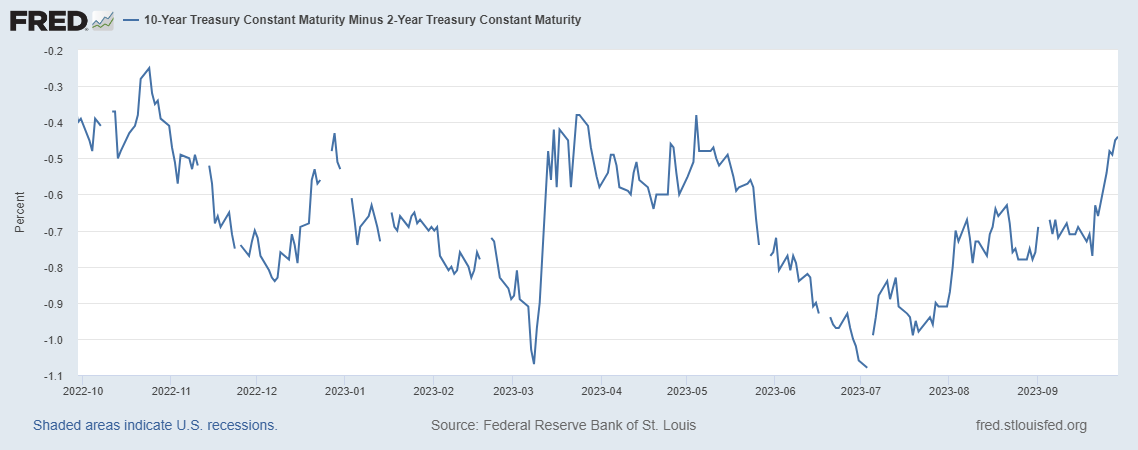
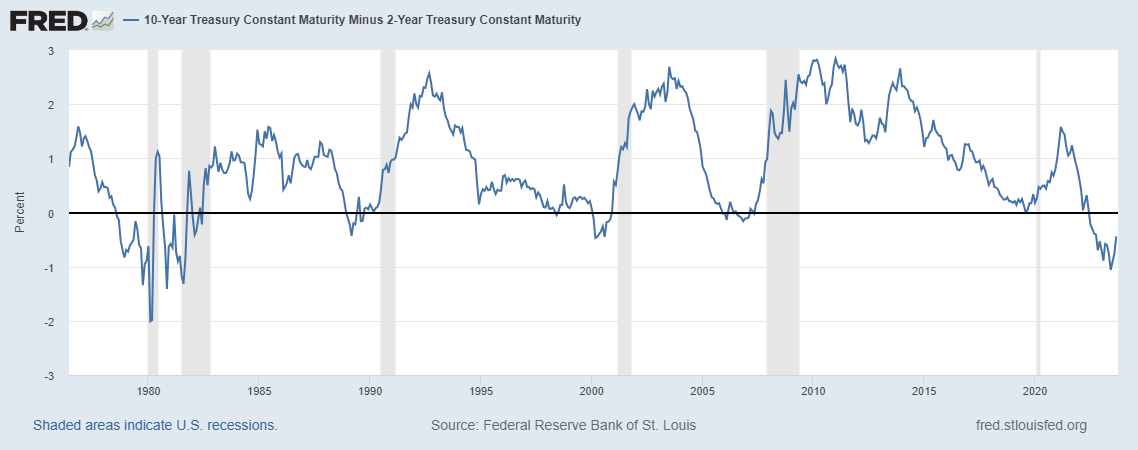
The financial markets in the US experienced a turbulent week, characterized by a sharp surge in long-term Treasury yields and a continued correction in the stock markets. 10-year yields reached a new 16-year peak, registering the largest weekly increase since July, while 30-year yield ascended to levels unseen since 2010. Concurrently, the yield curve underwent a swift normalization, with 10-year vs. 2-year Treasury spread narrowing significantly.
US stock markets also felt the pressure, with both DOW and S&P 500 closing the week in the negative, showing declines of about -1.3% and -0.7% respectively. To add to the tumult, S&P 500 and NASDAQ registered their most substantial monthly percentage declines for the year, with all three major indexes posting quarterly drops for the first time in 2023.
The risk-off sentiment was primarily fueled by expectations of persistently high interest rates and growing doubts regarding Fed's ability to engineer a soft landing for the economy. High interest rates, coupled with escalating energy prices, are anticipated to dampen consumer spending, potentially leading to a more pronounced economic downturn than expected. The shadow of another partial US government shutdown further exacerbates the uncertainty, posing a threat to investor confidence.
It's been pointed out here multiple times before. Historically, normalization of the inverted 10- to 2-year yield curve could be a precursor to a looming recession. Although not yet a certainty, a spread below 0.4 could signal a rapid deterioration in outlook.
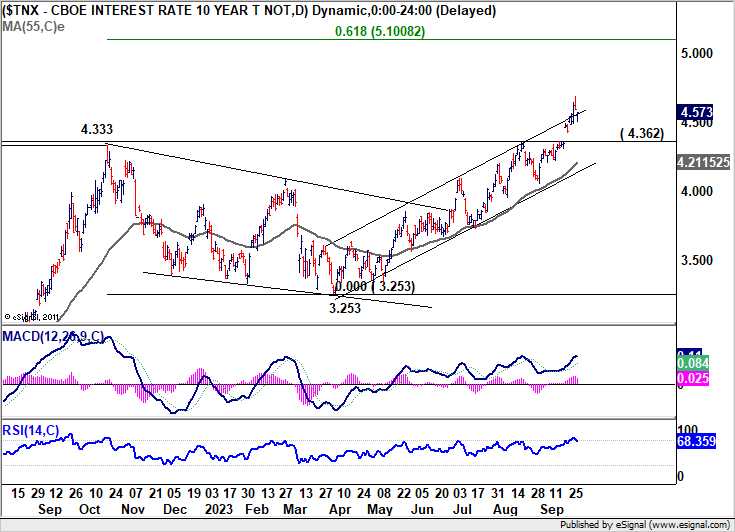
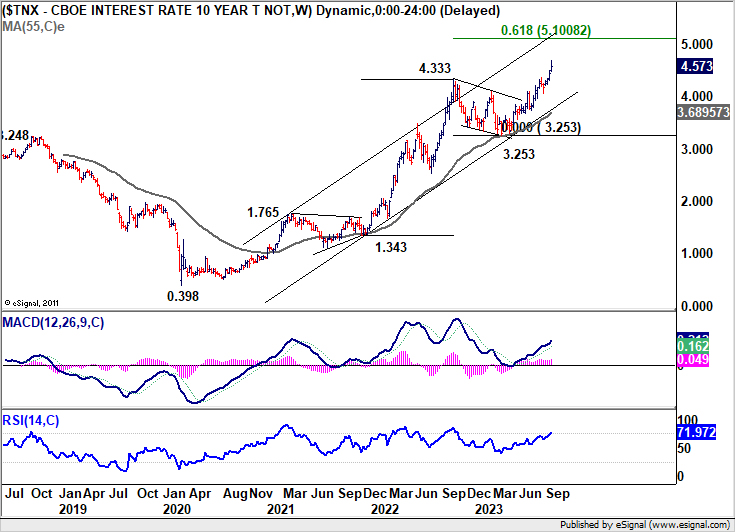
On a technical note, 10-year yield's break of the medium-term rising channel resistance could seen as tentative sign of upside acceleration. Near term outlook will stay bullish as long as 4.362 resistance turned support holds. Next target is 61.8% projection of 1.343 to 4.333 from 3.253 at 5.100 (comparing to 2-yr yield at 5.054 currently).
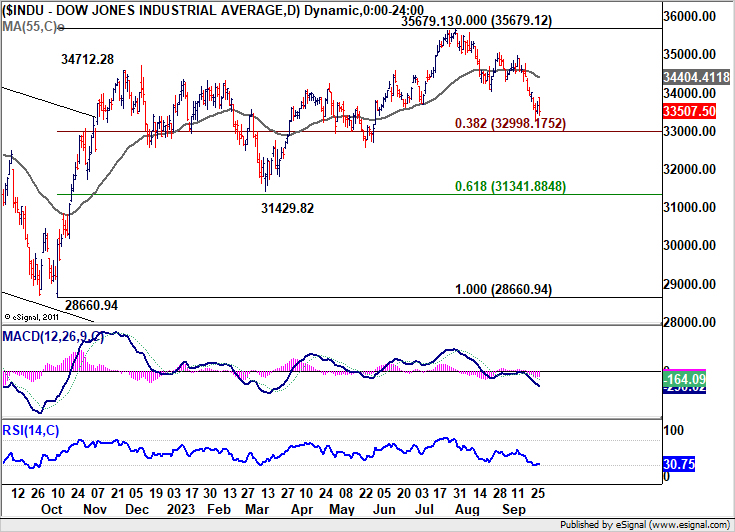
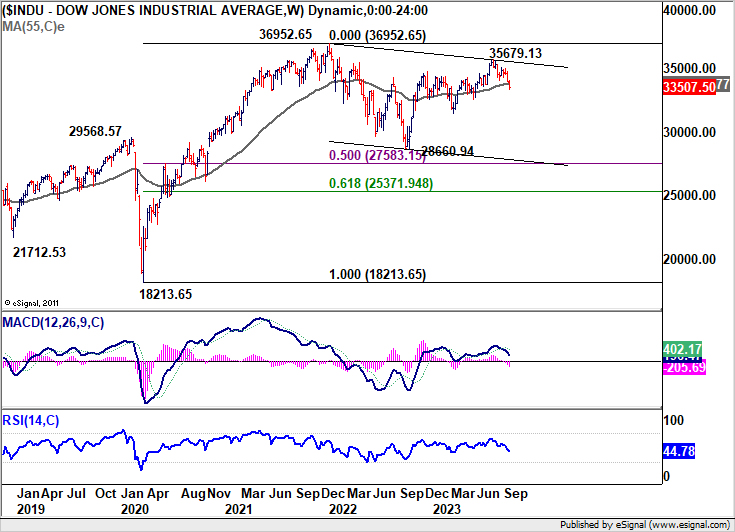
Meanwhile, DOW's decline resumed last week. The close below 55 W EMA affirmed the case that rise from 28660.94 has completed with three waves up to 35679.13. Immediate focus is now on 38.2% retracement of 28660.94 to 35679.12 at 32998.17. Sustained break there should add more credence to this bearish case and target 61.8% retracement at 31341.88 and below.
More importantly, as the third leg of the long term pattern from 36952.65 (2022 high), fall from 35679.13 has the potential to extend to 50% retracement of 18213.65 (2020 low) to 36952.65 at 27583.15.
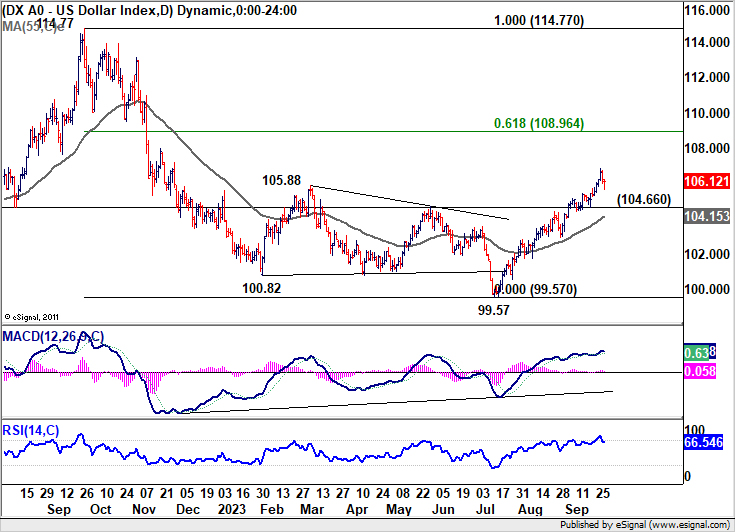
Dollar Index soared to as high as 106.83 before retreating to close at 106.21. Upside momentum appears to be flattening out as seen in D MACD. However, the amalgamation of escalating risk aversion and soaring yields might instigate a renewed upside acceleration. In any case, outlook will stay bullish as long as 104.66 support holds. Next target is 61.8% retracement of 114.77 (2022 high) to 99.57 at 108.96 and above.
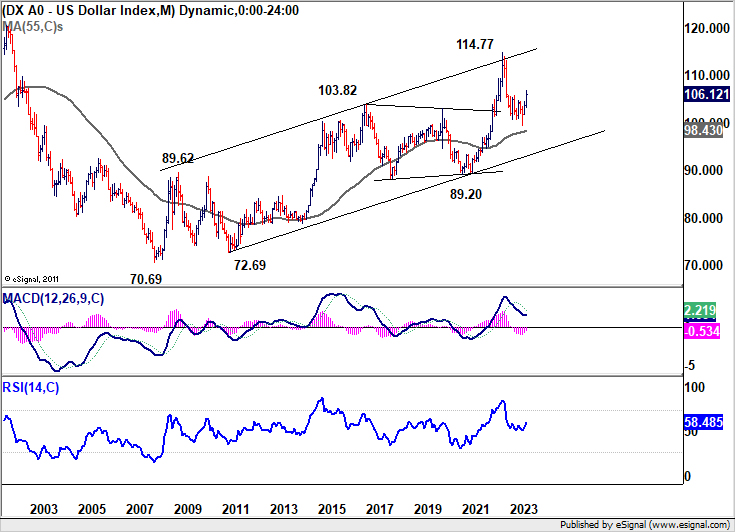
Also, the index defended 55 M EMA (now at 98.43) comfortably. Uptrend from 70.69 (2008 low) remains intact. While it's still early to conclude, current rise from 99.57 has the potential to develop into a sustainable medium term rally through 114.77 to resume the long term up trend.
A glimmer of resilience: AUD and NZD stand firm despite market volatility
Despite the prevailing risk-off sentiment in the global markets last week, Australian and New Zealand Dollar exhibited unexpected resilience. This firm stance could be attributed to a rebound in copper prices and increasing speculation of another interest rate hike by RBNZ.
Moreover, a slight recovery in investor sentiment towards China's economy, evident from the late rebound in Hong Kong stocks and the Chinese Yuan. However, a pinch of skepticism remains as the ongoing issues in China's property sector pose a lingering shadow. Also, August PMI data released over the weekend (manufacturing up from 49.7 to 50.2, non-manufacturing up from 51.0 to 51.7) showed no substantial improvement.
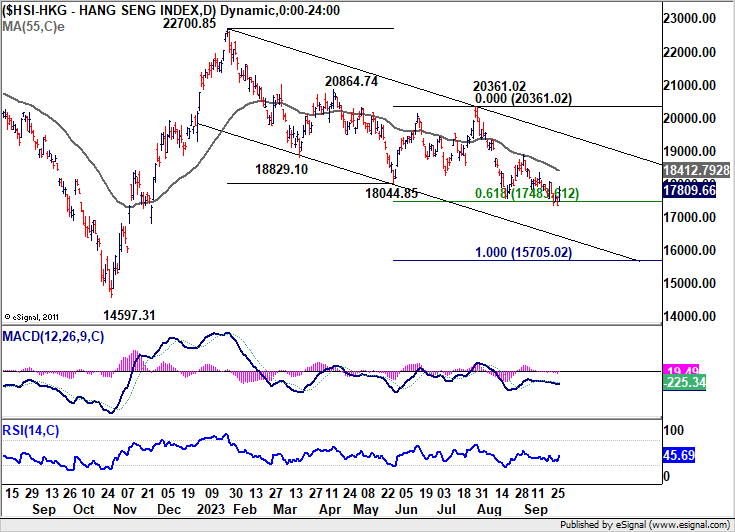
Diving into the technical aspects, Hong Kong's HSI is at a pivotal juncture where a technical rebound seems plausible. The index defended 61.8% projection of 22700.85 to 18044.85 from 20361.02 twice last week. An extended rebound might be seen in the near term to 55 D EMA (now at 18412.79). Sustained break there could indeed bolster the case of trend reversal, for at least a take on 20361.02 resistance.
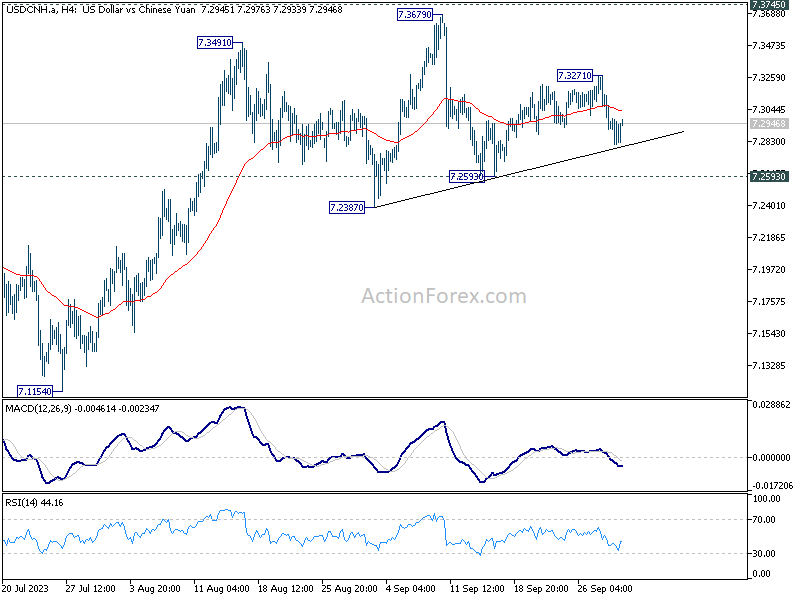
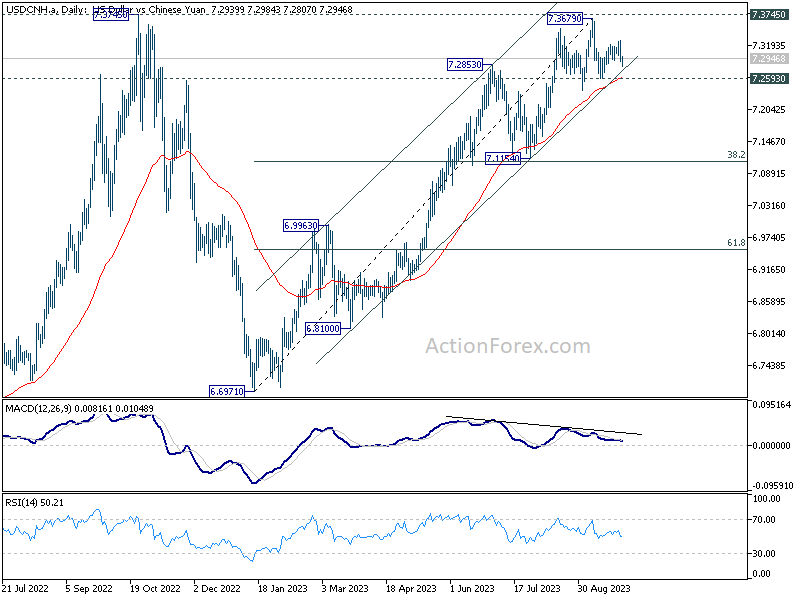
In the currency arena, USD/CNH is potentially crafting a head and shoulders top formation (ls: 7.3491; h: 7.3679; rs: 7.3271), just shy of 7.3745 (2022 high). Decisive break of 7.2593 support, and sustained trading below 55 D EMA (now at 7.2613) should prompt deeper selloff to 7.1154 cluster support (38.2% retracement of 6.6971 to 7.3679 at 7.1117).
Should these technical developments unfold as mentioned, Aussie and Kiwi might gain an upper hand against their European counterparts and potentially even Yen.
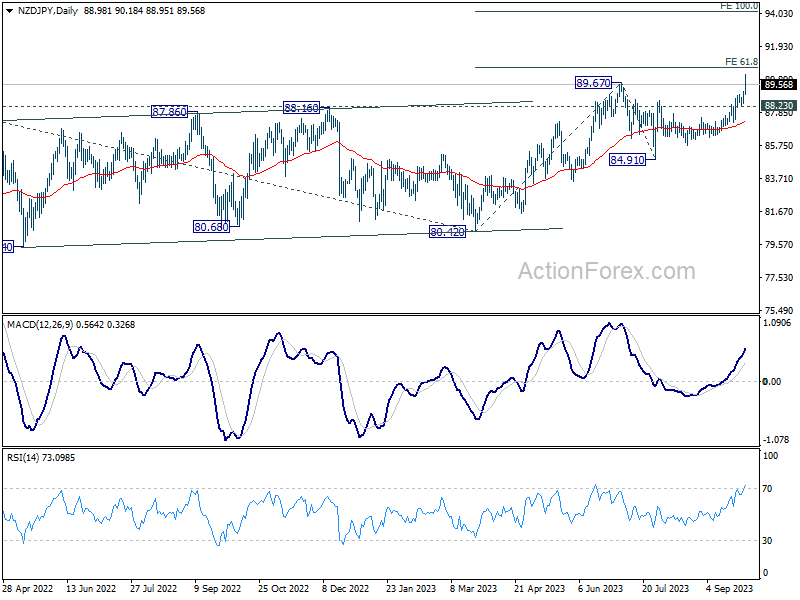
NZD/JPY's uptrend got a fresh breath of life by surpassing the 89.67 resistance. Near term outlook will stay bullish as long as 88.23 support holds. Decisive break of 61.8% projection of 80.42 to 89.67 from 84.19 at 90.62 could prompt upside acceleration to 100% projection at 94.16 in the near term.
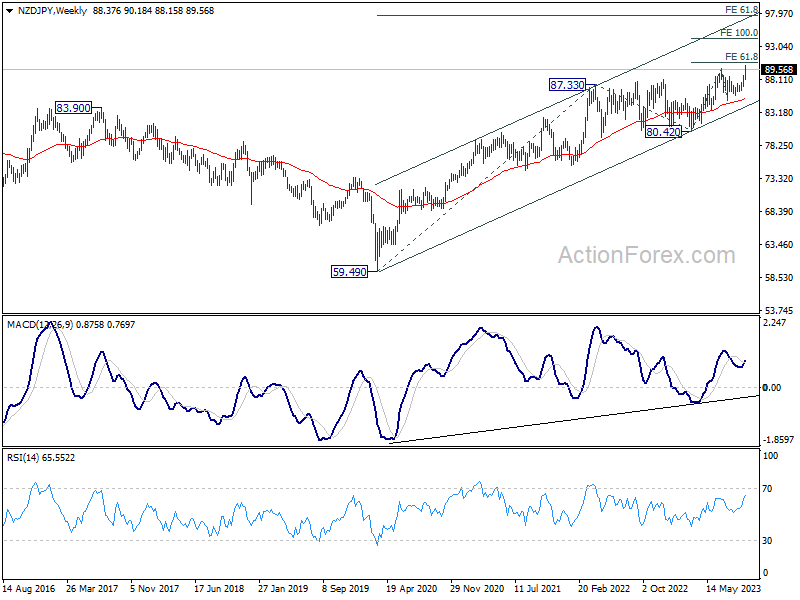
As for the medium term, the up trend from 59.49 (2020 low) could be target 61.8 projection of 59.49 to 87.33 from 80.42 at 97.62.
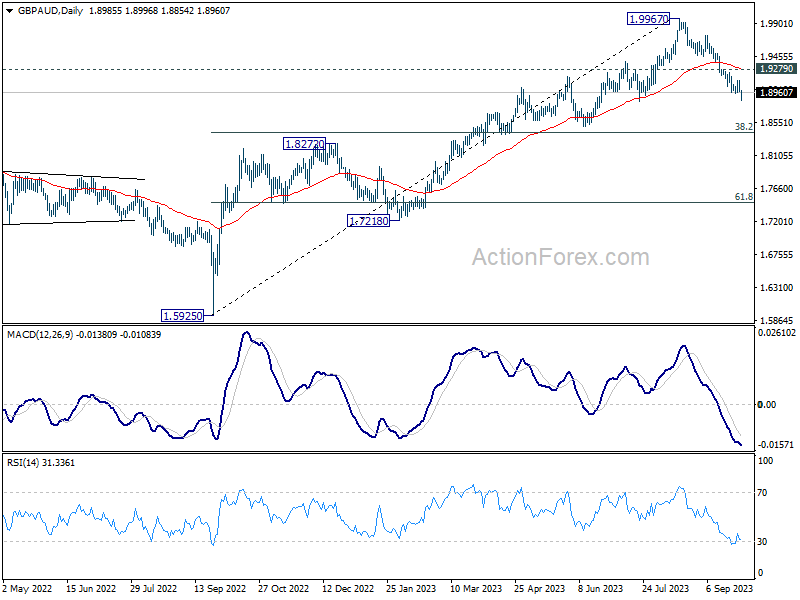
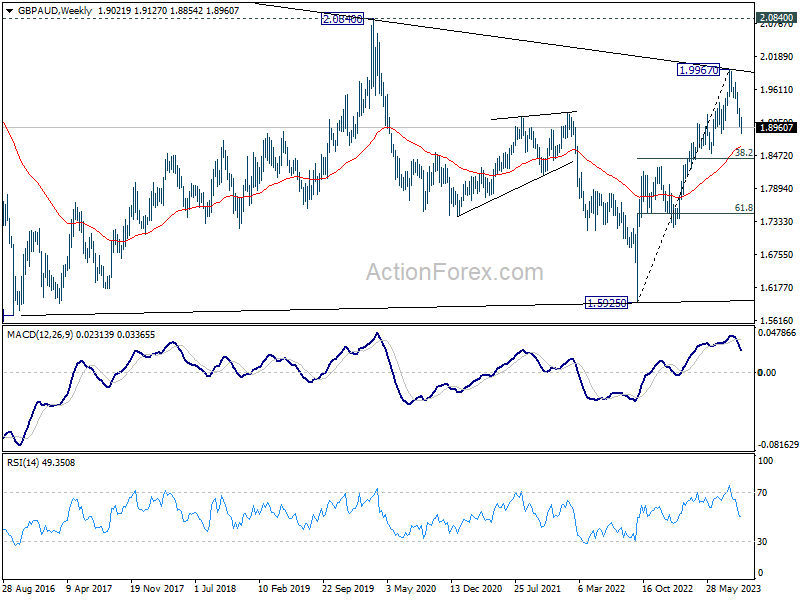
Meanwhile, GBP/AUD's downturn continued unabated, plunging 1.8854. Near term outlook will stay bearish as long as 1.9279 resistance holds. Current fall should target 55 W EMA (now at 1.8618). Sustained break there will argue that it's reversing whole rise from 1.5925 (2022 low). Next target will be 38.2% retracement of 1.5925 to 1.9967 at 1.8423, or even further to 61.8% retracement at 1.7469.
AUD/USD Weekly Report
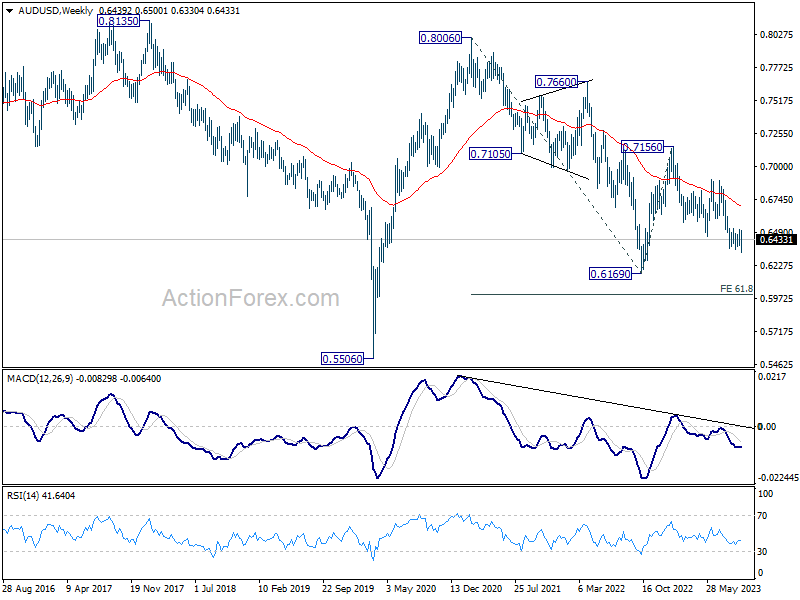
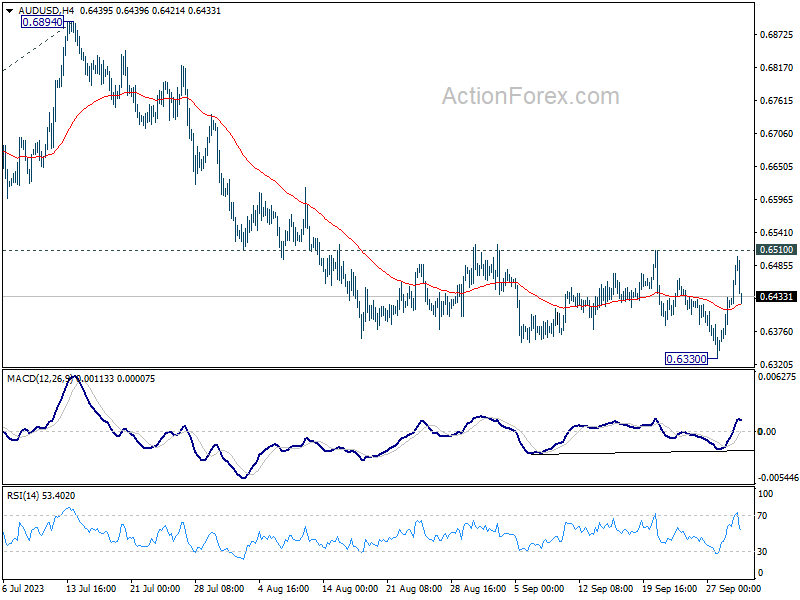
AUD/USD rebounded strongly after initial fall to 0.6630 last week. But upside is capped below 0.6510 resistance. Initial bias remains neutral this week and further fall is in favor. On the downside, break of 0.6330 will resume the whole decline from 0.7156 to 100% projection of 0.7156 to 0.6457 from 0.6894 at 0.6195. However, firm break of 0.6510 will confirm short term bottoming, and turn bias back to the upside.
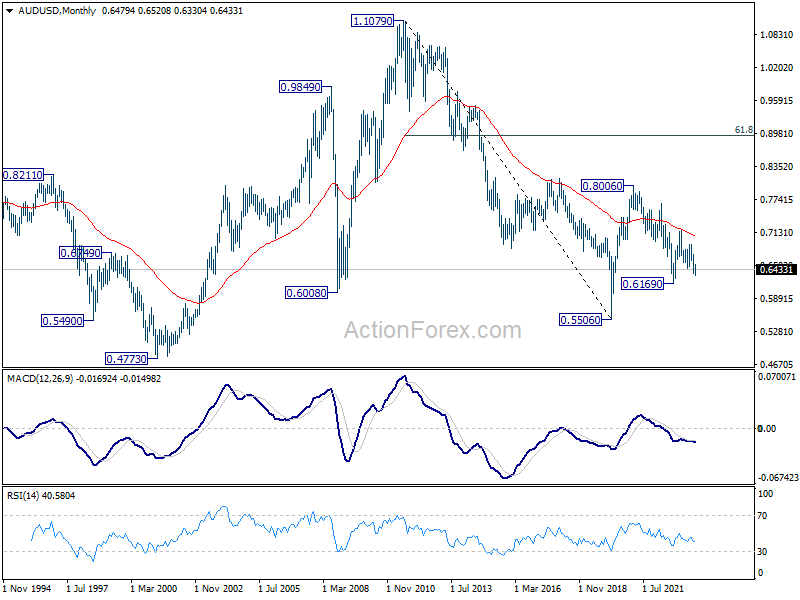
In the bigger picture, down trend from 0.8006 (2021 high) is possibly still in progress. Decisive break of 0.6169 will target 61.8% projection of 0.8006 to 0.6169 to 0.7156 at 0.6021. This will now remain the favored case as long as 0.6894, in case of strong rebound.
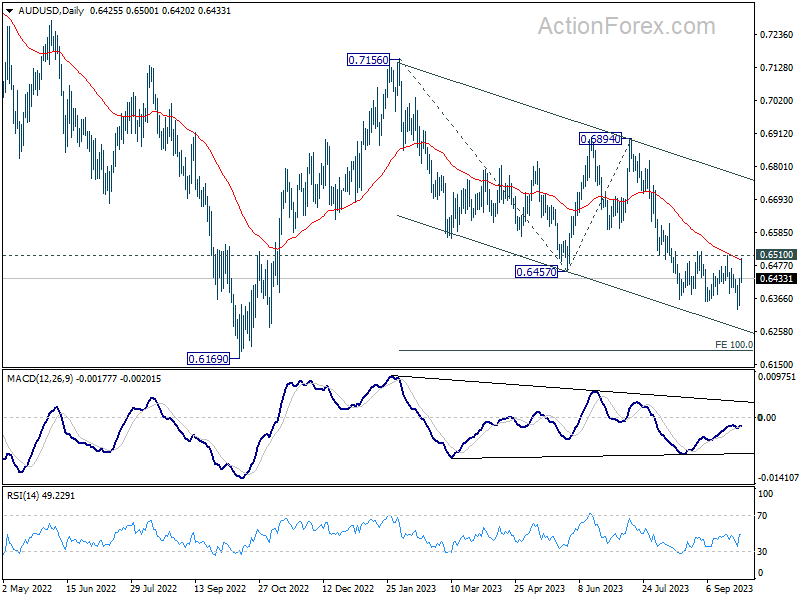
In the long term picture, while fall from 0.8006 might extend lower, the structure argues that it's merely a correction to rise from 0.5506 (2020 low). In case of downside extension, strong support should emerge above 0.5506 to bring reversal. But still, momentum of the next move will be monitored to adjust the assessment.