

Sample Category Title
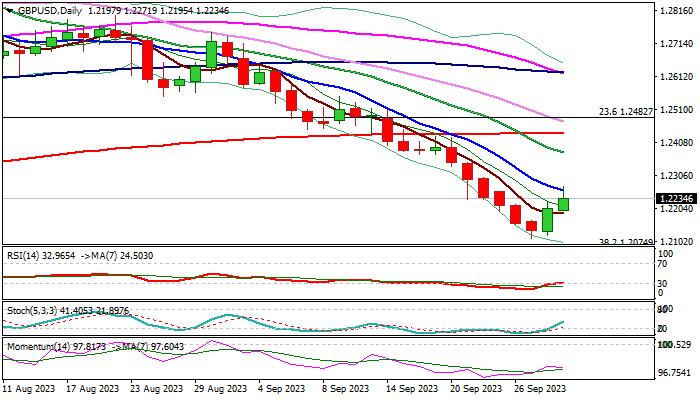
GBP/USD: Two-day Recovery Faces Headwinds from Falling 10DMA
Profit-taking on dollar longs at the end of Q3 lifts sterling for the second day, pushing the price to one-week high.
Slightly stronger UK economic growth in the second quarter, compared to Q1 and consensus, may boost optimism and add to supportive factors to sterling, though US consumer spending increased in line with expectations and underlying inflation (PCE report) rose marginally in August and suggests that price pressures are subsiding, which would be good news for the US central bank.
Fresh recovery so far retraced 50% of the latest 1.2424/1.2110 bear-leg and cracked pivotal falling 10DMA (1.2259), with close above here needed to strengthen near-term structure for further recovery in coming sessions.
Otherwise, expect the downside to remain vulnerable while the action stays below 10DMA.
Res: 1.2258; 1.2308; 1.2374; 1.2412.
Sup: 1.2188; 1.2110; 1.2074; 1.2000.
Sunset Market Commentary
Markets
Today’s action adds to our believe that we’ve witnessed a short term exhaustion move on markets yesterday, making way for some short term consolidation as eco data drip in. US Treasuries already staged a comeback during yesterday’s US session with European bonds catching up at the start of dealings this morning. We must add that they failed to really build on those opening gains, confirming strong underlying bearish sentiment, especially at the (very) long end of the curve these days. The more so given that September EMU inflation printed below consensus. Yesterday’s national figures already hinted in that direction. Inflation rose by 0.3% M/M (vs 0.5% forecast) with the Y/Y-figure falling from 5.2% to 4.3%, the slowest pace since October 2021. Household energy bills were the main downside force, massively outweighing higher pump prices. Core inflation slowed from 5.3% Y/Y to 4.5% Y/Y (vs 4.8% Y/Y), marking the first sub-5% reading since September 2022. Non-energy industrial goods inflation fell to 4.2% from 4.7% and services inflation to 4.7% from 5.5%. Today’s inflation figures confirm that the ECB will be able to at least skip a rate hike at the end of October policy meeting. The jury remains out on possible finetuning hikes at the end of the year or in Q1 2024 though. ECB Kazaks this morning indicated that rates will stay on hold for a while. ECB Vasle questioned how ECB policy is reaching the economy. Growth is slowing but the labour market remains strong. ECB Vujcic sounded also more cautious than Vasle on how things will proceed given uncertainties ahead. German yields lose 5.4 bps to 9.4 bps at the time of writing with the belly of the curve outperforming the wings. Intraday action in US Treasuries was more or less similar. A batch of near-consensus US eco data didn’t alter that. Personal income and spending both increased by 0.4% M/M in August. Headline and core PCE deflators rose a tad less than forecasted (0.4% M/M & 3.5% Y/Y for headline and 0.1% & 3.9% Y/Y) but August figures faced an upward revision. US yields currently lose 3.3 bps to 6.5 bps with the belly performing best as well. Lack of agreement on spending bills in US congress risks ending in a government shutdown after the weekend, but this isn’t a source of market concern at the moment. Consolidation is ongoing at FX and stock markets as well. The trade weighted dollar loses the 106 big figure again with EUR/USD above 1.06 after a test of the high 1.04 support area earlier this week. Both paint (inverted) hammer formations on the weekly technical charts after failing to pierce respective upper (DXY) and lower (EUR/USD) bounds on rising/declining trend channels. European stock markets rebound over 1% with key US indices opening 0.2-1.2% higher. Similar inverted hammer patterns are visual on the weekly charts.
News & Views
Polish inflation was 0.4% lower in September compared to August. Y/Y inflation dropped substantially from 10.1% to 8.2%. In a monthly perspective, food and non-alcoholic drinks (-0.4%), electricity, gas & other (-0.8%) and fuel prices (-3.1%) supported the decline in the price index. Details on other subcategories will only be available at the update later next month. However, core/services inflation probably eased at a slower pace. The National Bank of Poland at its early September meeting surprisingly cut the policy rate from 6.75% to 6.0% as it anticipated a further fall in inflation in the months ahead. Markets are now pondering whether there is already room of additional easing when the NBP meets next week (Wednesday). They currently anticipate at least an additional 25 bps step. The Polish 2-y swap yield (4.51%) currently eases 4 bps in a daily perspective, but that is also driven by the trend in core EMU yields. The zloty showed some volatility around the release, but currently trades little changed near EUR/PLN 4.63. In the days after the September decision, the zloty dropped more than 4% against the euro.
Data from the Swiss National Bank showed that it stepped up sales of foreign currency in the second quarter of this year. It cut its balance sheet by an equivalent of CHF 40.3bn, up from CHF 32.2bn in the first three months of this year. In doing so, the SNB strengthens its Swiss franc, helping the central bank in its quest against inflation. Earlier this month, the SNB kept rates unexpectedly steady at 1.75% but held on to stating that “in the current environment, the focus is on selling foreign currency.” The status quo triggered a minor CHF correction that brought EUR/CHF to levels of 0.966 currently. We think the SNB won’t be bothered by this recent weakening, as it offers its ailing manufacturing sector some relief.
U.S. Consumer Spending Slows, Even as Core Inflation Continues to Cool in August
Personal income grew 0.4% month-on-month (m/m) in August, in line with market expectations. This was a sizeable acceleration from the prior month's 0.2% gain. The increase primarily reflected a rise in compensation to employees, receipts on assets, rental income, and proprietors’ income that was partly offset by a decrease in personal current transfers.
Accounting for inflation and taxes, real personal disposable income fell -0.2% m/m, following a similar decline in the previous month.
Personal consumption expenditures rose 0.4% m/m, decelerating from the upwardly revised 0.9% posted in July (previously 0.8%). August's reading came in just below market expectations for 0.5% growth.
- Expenditures on services grew 0.4% m/m, down from the upwardly revised 1.0% in July (previously 0.8%). Spending on housing and utilities (led by housing), transportation services, and health care were the primary contributors to movements in the services category.
- There was also an increase in goods spending, which rose 0.6% m/m, an acceleration from the 0.5% posted in July. This reflected a 1.3% m/m gain in non-durable goods spending (largely reflecting increased spending for gasoline and other energy goods due to higher prices) as durable goods spending declined by -0.6% on the month.
Adjusting for inflation, real spending grew 0.1% for the month, coming in just above the consensus estimate for a flat reading. In real terms, goods spending was down -0.2% m/m, while services were up 0.2%.
The personal consumption expenditure (PCE) price deflator rose 0.4% m/m, and 3.5% on a year-on-year (y/y) basis – bang-on the consensus forecast (3.5% y/y) but above July's reading (3.4% y/y).
The core PCE price deflator (which excludes food and energy and is the Fed's preferred measure of inflation) rose 0.1% m/m, decelerating from 0.2% over the two previous months and was below the consensus forecast of 0.2%. On an annual basis, core PCE inflation decelerated to 3.9% y/y from 4.3% y/y the month prior, falling below 4% for the first time since June 2021.
The personal savings rate fell to 3.9% in August, down 0.2%-pts from July's reading of 4.1%.
Key Implications
The steam that has kept U.S. consumers powering along is starting to show signs of cooling. Facing a confluence of factors ranging from declining savings to resumption of student loan payments, consumers are coming under increasing strain and this was reflected in subdued spending in August. A downgrade to consumer spending growth in Q2 from the previously reported 1.7% annualized to a more muted 0.8% adds impetus to the cooling momentum. With two data points in for the third quarter, consumer spending growth is currently tracking at around 3.5%, down from our most recent forecast of 3.7%.
The other major point of interest on the radar in today's report is the core PCE price deflator. While the Fed opted to maintain the policy rate at 5.5% at the September meeting, clear evidence that the recent inflation slowdown can be sustained was a prerequisite to keeping them on the sidelines at upcoming meetings. Today's PCE inflation numbers delivered on that front. Our measure of non-housing service inflation (aka "supercore") ticked down to 4.3% y/y from 4.6% in July and remained unchanged at 3.5% on a 3-month annualized basis. With the Fed's preferred measure of inflation continuing to edge lower in August to sub-4%, market pricing is now heavily favoring the Fed holding rates steady in November.
A Major Boost for ECB But There’s Still a Long Way to Go
European stock markets are performing well at the end of the week after spending much of it in the red on the back of fresh interest rate concerns.
A determination to drive home the message that interest rates will stay higher for longer appears to have finally wobbled investors. Today's HICP inflation figures from the eurozone will have come as a big relief against that backdrop which may explain why we're ending the week on a high.
A beat at both the headline and core levels puts the eurozone in a promising position, especially with both expected to fall much more over the next couple of months, at which point investors may well start demanding more rate cut debate at the ECB. Not that I think policymakers will even entertain that idea any time soon.
Recent trend is promising for US inflation
Talking of positive surprises, the US PCE inflation numbers weren't bad either. The monthly reading fell unexpectedly to 0.4% while at the core level, it was also lower at 0.1%. The annual readings may have been in line but that's extremely promising as far as recent trends are concerned. With data over the coming weeks likely to be disrupted, this certainly feels like it falls in the pause category for the Fed at the next meeting.
Is the Oil rally hitting a ceiling?
The oil price rally has continued this week although there are some signs that it’s starting to run on fumes as we go into the weekend. The fundamentals remain very supportive of the price, with the market in deficit thanks to the efforts of OPEC+ in restricting supply.
But with investors now questioning the resilience of the global economy going into next year against the backdrop of higher interest rates for longer, that bullish bias in oil markets may become more balanced. At these levels, OPEC+ - in particular Saudi Arabia and Russia with their additional voluntary cuts - may reassess whether the full package of restrictions is still necessary.
Gold crushed by hawkish central bank comments
It seems central bank policymakers have done too good a job of convincing investors that interest rates will remain higher for longer, recently. Yields have been rising this week, crushing sentiment and taking gold down with it. The yellow metal slipped below $1,900 on Wednesday after falling since the start of the week and the outlook doesn’t look particularly promising in the short-term.
While there’s every chance policymakers have gone too far and the data may outperform their expectations, allowing for a recovery in the price of gold, a shutdown could complicate things. That arguably makes Fed speak all the more influential and may encourage a little more balance in the commentary. For now, though, gold has broken big support levels and with momentum, which doesn’t bode well for it. It’s seen support around $1,860 which has been a notable level in the past and if it can manage a rebound, $1,900 could be key.
Bitcoin remains choppy after a decent surge on Thursday
A US government shutdown will be disruptive in many ways and it seems crypto is not immune to that, with the spot bitcoin ETF application deadline reportedly being pushed back as a result of the inability of Congress to reach a deal. It's hardly the biggest casualty of the shutdown but may frustrate the community after such a long drawn-out battle. It's not affecting the price though, with bitcoin ending the week on a high back around $27,000. Broadly speaking, this is within the late summer choppy range.
Canada’s Economy Flat in July, With Modest Growth Projected in August
The Canadian economy held steady on a month-on-month (m/m) basis in July, in line with Statistics Canada's advanced estimate and a tick below market expectations of slight 0.1% m/m growth. The flash estimate for August points toward modest 0.1% m/m growth.
July's reading was mixed, with output expanding in 9 of 20 industries. Goods producing industries (-0.3% m/m) lagged the 0.1% m/m gain in the services sector.
There was a tug of war between special factors on the goods side. The mining, quarry, and oil & gas sector bounced back to +1.9% m/m, led by mining and quarrying (+4.2% m/m), which were rebounding from wildfire related shutdowns in June. But the port strike on the west coast depressed activity in manufacturing (-1.5% m/m). Agriculture was also down (-1.5% m/m), partially offset the increases in other goods sectors. The construction sector remained flat in July after two consecutive months of declines.
As expected on the services side, the transportation and warehousing sector contracted, albeit modestly, by 0.2% m/m as a result of the British Columbia port strikes. By subsector, water transportation pulled back (-3.4% m/m) alongside air transportation (-2.1%). Surprisingly, rail transportation grew by 1.1% on the month despite the strikes and the inclement weather affecting a rail line in Nova Scotia.
Also in services, finance and insurance rose for the third consecutive month, up 0.3% m/m in July, wholesale trade bounced back (+0.3% m/m), and retail trade slid for a sixth consecutive month (-0.2% m/m).
The advanced reading of a 0.1% m/m gain in August is driven by increases in wholesale trade, finance, and insurance. Partially offsetting this gain is declines in retail trade and oil and gas extraction.
Key Implications
With so many idiosyncratic shocks in Canada this year, it is challenging to distill where activity is trending in the economy. Quarterly GDP estimates to date have been impacted by a host of "special factors", from the federal workers strike in April, wildfires affecting production in the oil patch in June, the BC port strikes in July, record-breaking wildfire activity, other weather events, and one-time government rebates. Most of the effects of these shocks have now dissipated, and barring any further one-off events, GDP growth should be more predictable over the coming months.
With today's print and August's flash guidance, there is downside risk to our modest expectation for 1% growth in the third quarter, as published in our recent forecast. It is also considerably lower than the Bank of Canada's (BoC) 1.5% estimate. Not surprisingly, today's print ultimately tamped down the expectations for another rate hike in the coming month, with markets having lowered their probability of a hike at next meeting to 35%. The BoC must balance a slowing growth backdrop against renewed inflation pressures in August, especially across the BoC's core measures. The BoC will need to remain vigilant and see more evidence of a cooling economy before they can get comfortable on the sidelines. Next week's update to employment and wages combined with updates to September's inflation figures next month will be the two key metrics on watch that will inform the BoC's next policy decision on October 25th.
USD/JPY Mid-Day Outlook
Daily Pivots: (S1) 149.07; (P) 149.38; (R1) 149.62; More...
Intraday bias in USD/JPY stays neutral at this point. Retreat from 149.70 could extend lower. But near term outlook will stay bullish as long as 145.88 support holds. Above 149.70 will resume larger rise from 127.20 to retest 151.93 high.
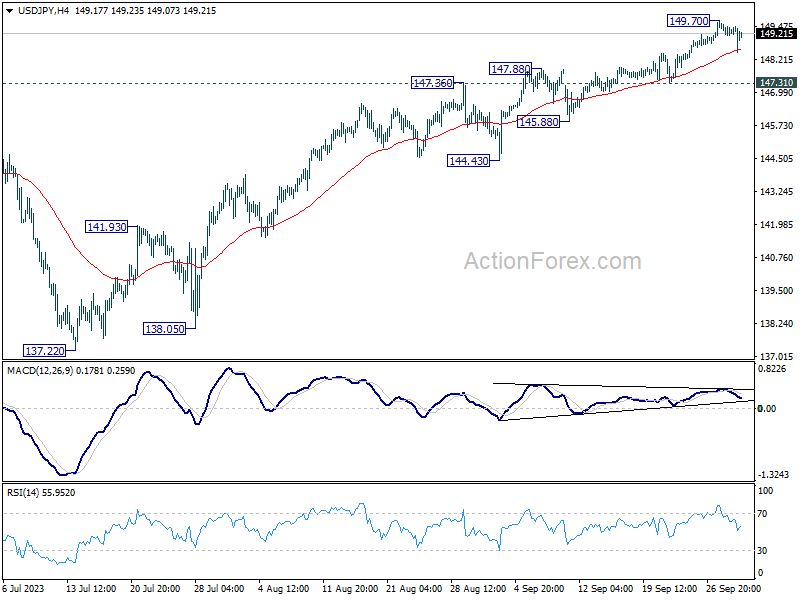
In the bigger picture, while rise from 127.20 is strong, it could still be seen as the second leg of the corrective pattern from 151.93 (2022 high). Rejection by 151.93, followed by break of 145.06 resistance turned support will be the first sign that the third leg of the pattern has started. However, sustained break of 151.93 will confirm resumption of long term up trend.
USD/CHF Mid-Day Outlook
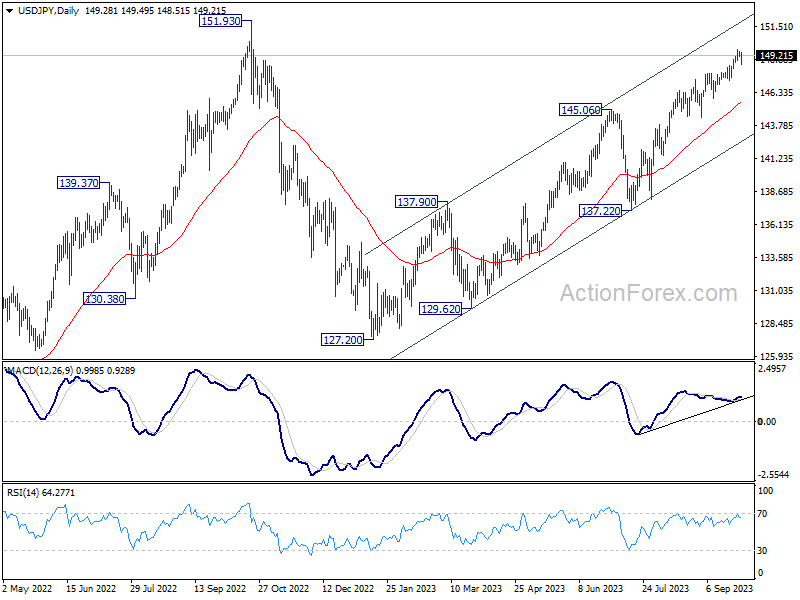
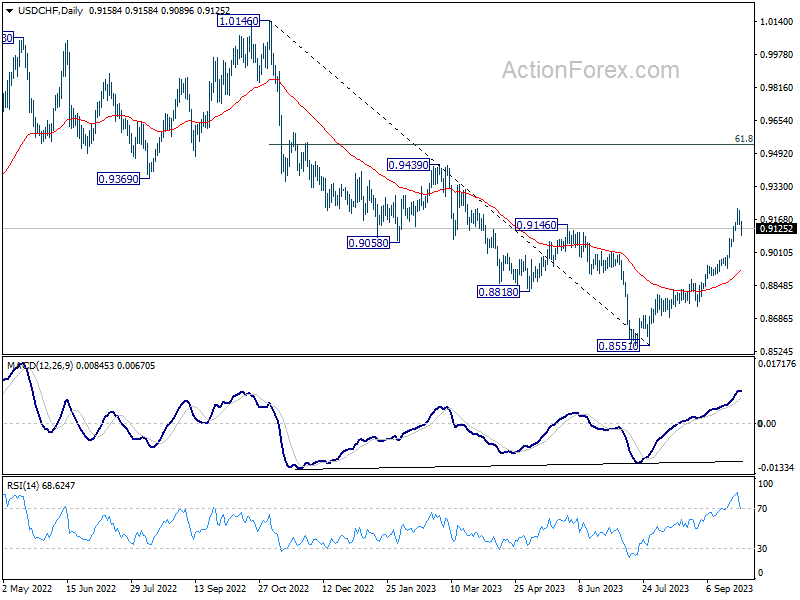
Daily Pivots: (S1) 0.9125; (P) 0.9171; (R1) 0.9195; More....
Intraday bias in USD/CHF remains neutral for the moment. Retreat from 0.9224 could extend lower. But risk will stay on the upside as long as 0.9019 support holds. Break of 0.9224 will resume the rally from 0.8551 to 0.9439 resistance next.
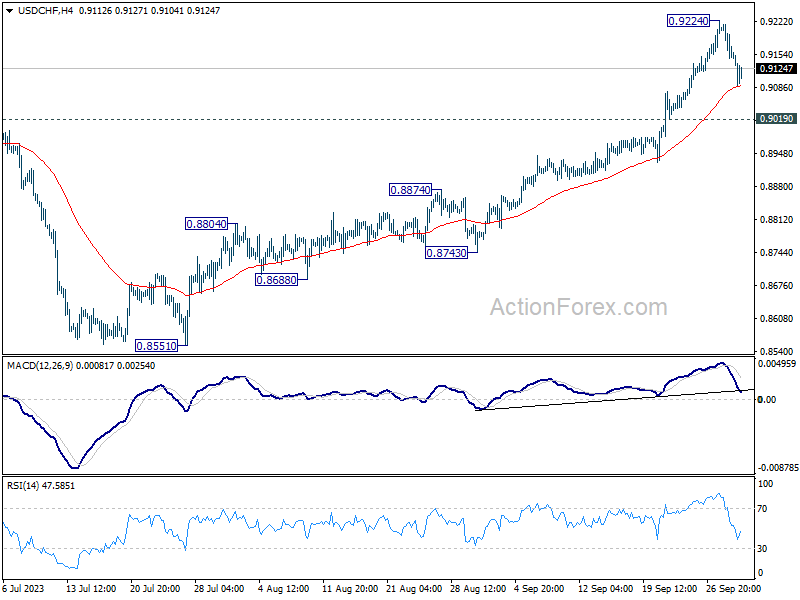
In the bigger picture, current development indicates that rise from 0.8551 is reversing whole down trend from 1.0146. Further rally would then be seen to 61.8% retracement at 0.9537 and above. For now, this will be the favored case as long as 55 D EMA (now at 0.8917) holds, even in case of deep pullback.
EUR/USD Mid-Day Outlook
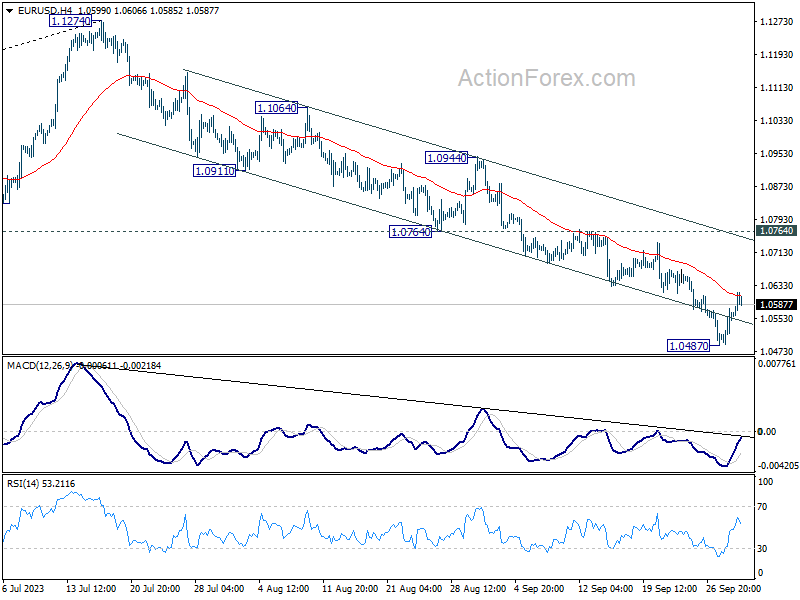
Daily Pivots: (S1) 1.0512; (P) 1.0545; (R1) 1.0600; More...
Intraday bias in EUR/USD remains neutral for the moment. Recovery from 1.0487 could extend higher. But risk will stay on the downside as long as 1.0764 support turned resistance holds. Break of 1.0487 will resume the fall from 1.1274 to 1.0199 fibonacci level.
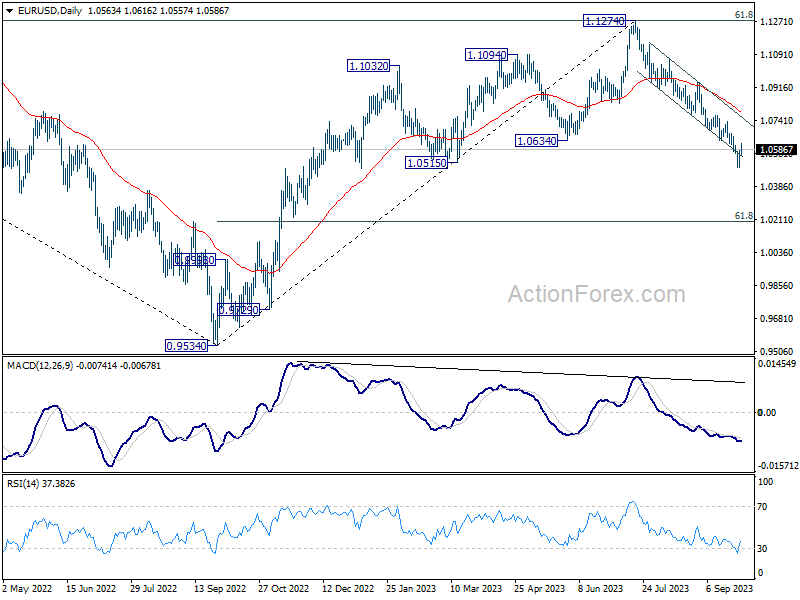
In the bigger picture, fall from 1.1274 medium term top could still be a correction to rise from 0.9534 (2022 low). But chance of a complete trend reversal is rising. In either case, firm break of 1.0515 support will target 61.8% retracement of 0.9534 to 1.1274 at 1.0199. For now, risk will stay on the downside as long as 55 D EMA (now at 1.0786) holds, in case of rebound.
GBP/USD Mid-Day Outlook
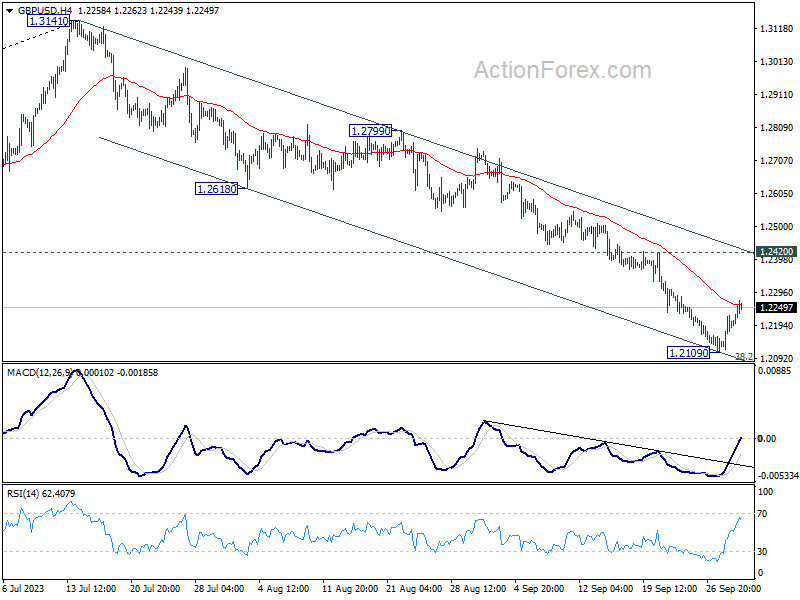
Daily Pivots: (S1) 1.2141; (P) 1.2183; (R1) 1.2246; More...
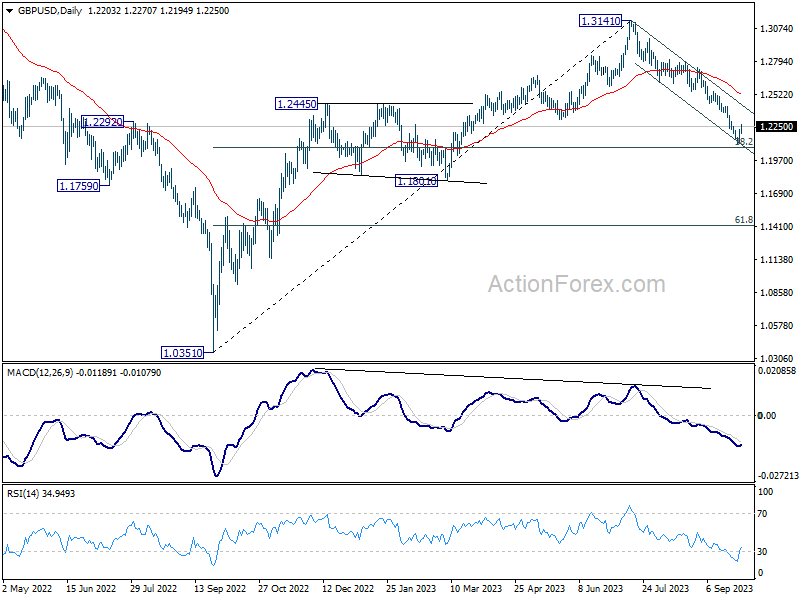
Intraday bias in GBP/USD remains neutral at this point. Recovery from 1.2109 could still extend higher. But near term risk will stay on the downside as long as 1.2420 turned resistance holds. Fall from 1.3141 is still in favor to continue. On the downside, decisive break of 1.2075 fibonacci level would carry larger bearish implication and target 1.1801 support next.
In the bigger picture, fall from 1.3141 medium term top could still be a correction to up trend from 1.0351 (2022 low) only. But risk of complete trend reversal is rising. Sustained break of 38.2% retracement of 1.0351 to 1.3141 at 1.2075 will pave the way to 61.8% retracement at 1.1417. For now, risk will stay on the downside as long as 55 D EMA (now at 1.2526) holds, in case of rebound.
End-of-Quarter Optimism Fuels Markets Amid Eased Inflation Pressures
As the quarter nears its end, a tangible shift towards a risk-on sentiment is sweeping through the global financial markets. Supported by lower than expected inflation data from both sides of the Atlantic, investors are regaining confidence. This renewed optimism is evident in the notable gains posted by major European stock indexes, with US futures also suggesting a robust opening. Benchmark treasury yields also continue to pare back recent gains.
The Eurozone's less-than-anticipated inflation figures are reinforcing the consensus that ECB have reached the peak of its interest rate hikes. Concurrently, US's modest monthly core PCE inflation reading has alleviated some urgency for Fed to implement another rate increase, further fueling the market's positive outlook. Meanwhile, concerns about the partial government shutdown in the US seem to be taking a backseat for traders
In the currency domain, the Dollar is facing a pronounced selloff, a trend that began in the Asian trading session and has intensified throughout the day. Euro and Yen are not far behind, echoing Dollar's dip. Contrarily, New Zealand and Australian Dollars are rallying, with Sterling joining the upward momentum. Canadian Dollar, however, is experiencing constrained vigor, attributed to disappointing GDP data that has curtailed its ascent.
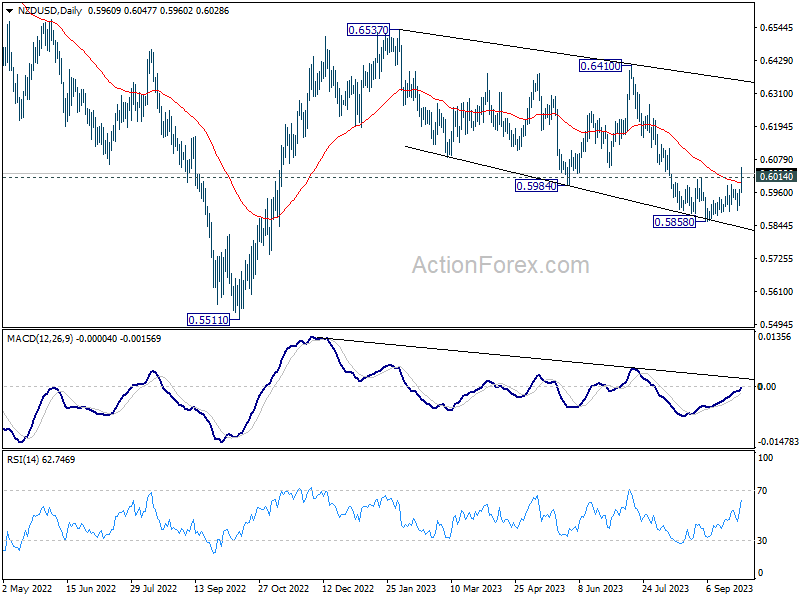
Technically, NZD/USD's strong break of 0.6014 resistance and 55 D EMA firstly confirms short term bottoming at 0.5858. More important, that's a sign that corrective pattern from 0.6537 has completed with three waves down to 0.5858. Further rally is now in favor in back to 0.6410 resistance next. To strengthen this bullish case, AUD/USD should also break through 0.6510 resistance and 55 D EMA soon in tandem.
In Europe, at the time of writing, FTSE is up 0.3%. DAX is up 1.17%. CAC is up 1.17%. Germany 10-year yield is down -0.0960 at 2.835. Earlier in Asia, Nikkei fell -0.05%. Hong Kong HSI rose 2.51%. Singapore Strait TImes rose 0.32%. Japan 10-year JGB yield rose 0.0097 to 0.771.
US PCE inflation rose to 3.5% yoy in Aug, core PCE down to 3.9% yoy
US personal income rose 0.4 mom or USD 87.6B in August, matched expectations. Personal spending rose 0.4% mom or USD 83.6B, below expectation of 0.5% mom. That includes USD 47.0B increase in spending for services, and USD 36.7B increase in spending for goods.
For the month, headline PCE price index rose 0.4% mom, below expectation of 0.5% mom. Core PCE price index rose 0.1% mom, below expectation of 0.2% mom. Prices for goods increased 0.8% mom and prices for services increased 0.2% mom. Food prices increased 0.2% mom and energy prices increased 6.1% mom.
From the same month one year ago, headline PCE price index rose from 3.4% yoy to 3.5% yoy, matched expectations. Core PCE price index slowed from 4.3% yoy to 3.9% yoy, matched expectations. Prices for goods increased 0.7% yoy and prices for services increased 4.9% yoy. Food prices increased 3.1% yoy and energy prices decreased -3.6% yoy.
Canada GDP flat in July, might edge up 0.1% mom in Aug
Canada GDP was essentially unchanged in July, below expectation of 0.10% mom growth. Goods-producing industries contracted -0.3% mom while services-producing industries grew 0.1% mom. Overall, 9 of 20 industrial sectors posted increases.
Advance information indicates that real GDP edged up 0.1% mom in August. Increases in wholesale trade and finance and insurance sectors were partly offset by decreases in retail trade and oil and gas extraction sectors.
Eurozone CPI eases to 4.3% in Sep, core CPI down to 4.5%
Eurozone CPI slowed from 5.2% yoy to 4.3% yoy in September, below expectation of 4.5% yoy. CPI core (ex energy, food, alcohol & tobacco) also slowed from 5.3% yoy to 4.5% yoy, below expectation of 4.8% yoy.
Looking at the main components, food, alcohol & tobacco is expected to have the highest annual rate in September (8.8%, compared with 9.7% in August), followed by services (4.7%, compared with 5.5% in August), non-energy industrial goods (4.2%, compared with 4.7% in August) and energy (-4.7%, compared with -3.3% in August).
ECB's Vasle: Probably done with rate hikes, but still many uncertainties
In a panel discussion held in Skopje today, opinions about the future of interest rates and inflation were aired by two members of ECB's Governing Council.
Bostjan Vasle suggested that the series of interest rate hikes might have come to an end, citing a possible easing of inflation. Boris Vujcic, on the other hand, shared a more cautious perspective, highlighting potential challenges in attaining the 2% inflation target.
Vasle, Slovenia's central bank head, was quoted saying, "It's probably the case that we are done with interest-rate increases." He noted that current economic indicators appear favorable, with preliminary signs of inflation tapering off.
However, Vasle also pointed out the prevailing uncertainties, stating, "We are seeing some signs of inflation going down, also some first signs of sustainability of this trends, but on the other hand, there are still many uncertainties."
Croatian central bank chief Vujcic, acknowledged the downward movement towards the 2% goal but pointed out the statistical effects that may be influencing these figures. His words served as a reminder of the monetary policy challenges that could arise if the disinflation process stalls before reaching the target.
"You might get into a situation where the inflation rate — the disinflation process — stops at a level, which is not your target," Vujcic expressed. "Then it's challenging for monetary policy, because it has to do something more to bring it all the way down to 2%."
Swiss KOF dips to 95.9, cooling economy for end of the year
Swiss KOF Economic Barometer registered a drop in September, moving from 96.2 to 95.9. Although this decline was milder than the anticipated fall to 90.5, the barometer still positions below its historical average. This suggests a deceleration in the Swiss economy as 2023 comes to a close.
KOF said: "The slight decline is primarily attributable to bundles of indicators from the manufacturing and other services sectors. Indicators from the finance and insurance sector and the construction industry are sending positive signals."
Japan's industrial output flat in Aug, Tokyo inflation eases in Sep
Japan's industrial output for August surprised by remaining steady month-on-month, outpacing expectations of a -0.8% mom decline. The seasonally adjusted index of production at factories and mines held its ground at 103.8, based on 2020 base of 100. Equally, index of industrial shipments ticked up by 0.1% to 103.2. In contrast, inventory index marked a -1.7% decrease to 104.6, registering the first decline in a quadrimestrial span.
The Ministry of Economy, Trade and Industry maintained a cautious tone on the economy's direction, indicating that industrial output "fluctuated indecisively." However, optimism is still present; the ministry's poll suggests that manufacturers anticipate a 5.8% uptick in production for September, followed by a 3.8% rise in October.
On the retail front, August saw a 7.0% yoy surge in retail sales, surpassing anticipated 6.4% yoy. This momentum builds upon the month's modest growth of 0.1% mom.
The labor market remained resilient, with the unemployment rate steadfast at 2.7%. The job offers-to-applicants ratio for August persisted at 1.29, unchanged from July.
Inflationary pressures seem to be cooling down. Tokyo's core CPI for September, excluding food, dipped more than forecasted, from 2.8% yoy to 2.5% yoy , as opposed to the predicted 2.6% yoy. Headline CPI decreased slightly from 2.9% yoy to 2.8% yoy. Additionally, core-core CPI, which excludes both food and energy, retreated from 4.0% yoy to 3.8% yoy.
GBP/USD Mid-Day Outlook
Daily Pivots: (S1) 1.2141; (P) 1.2183; (R1) 1.2246; More...
Intraday bias in GBP/USD remains neutral at this point. Recovery from 1.2109 could still extend higher. But near term risk will stay on the downside as long as 1.2420 turned resistance holds. Fall from 1.3141 is still in favor to continue. On the downside, decisive break of 1.2075 fibonacci level would carry larger bearish implication and target 1.1801 support next.
In the bigger picture, fall from 1.3141 medium term top could still be a correction to up trend from 1.0351 (2022 low) only. But risk of complete trend reversal is rising. Sustained break of 38.2% retracement of 1.0351 to 1.3141 at 1.2075 will pave the way to 61.8% retracement at 1.1417. For now, risk will stay on the downside as long as 55 D EMA (now at 1.2526) holds, in case of rebound.
Economic Indicators Update
| GMT | Ccy | Events | Actual | Forecast | Previous | Revised |
|---|---|---|---|---|---|---|
| 23:30 | JPY | Tokyo CPI Y/Y Sep | 2.80% | 2.90% | ||
| 23:30 | JPY | Tokyo CPI ex Fresh Food Y/Y Sep | 2.50% | 2.60% | 2.80% | |
| 23:30 | JPY | Tokyo CPI ex Food Energy Y/Y Sep | 3.80% | 4.00% | ||
| 23:30 | JPY | Unemployment Rate Aug | 2.70% | 2.60% | 2.70% | |
| 23:50 | JPY | Industrial Production M/M Aug P | 0.00% | -0.80% | -1.80% | |
| 23:50 | JPY | Retail Trade Y/Y Aug | 7.00% | 6.40% | 6.80% | 7.00% |
| 01:30 | AUD | Private Sector Credit M/M Aug | 0.40% | 0.30% | 0.30% | |
| 05:00 | JPY | Housing Starts Y/Y Aug | -9.40% | -8.90% | -6.70% | |
| 05:00 | JPY | Consumer Confidence Index Sep | 35.2 | 36.2 | 36.2 | |
| 06:00 | GBP | GDP Q/Q Q2 F | 0.20% | 0.20% | 0.20% | |
| 06:00 | GBP | Current Account (GBP) Q2 | -25.3B | -14.0B | -10.8B | |
| 06:00 | EUR | Germany Import Price Index M/M Aug | 0.40% | 0.50% | -0.60% | |
| 06:00 | EUR | Germany Retail Sales M/M Aug | -1.20% | 0.50% | -0.80% | |
| 06:45 | EUR | France Consumer Spending M/M Aug | -0.50% | -0.40% | 0.30% | |
| 07:00 | CHF | KOF Economic Barometer Sep | 95.9 | 90.5 | 91.1 | 96.2 |
| 07:55 | EUR | Germany Unemployment Change Aug | 10K | 14K | 18K | |
| 07:55 | EUR | Germany Unemployment Rate Aug | 5.70% | 5.70% | 5.70% | |
| 08:30 | GBP | Mortgage Approvals Aug | 45K | 48K | 49K | 50K |
| 08:30 | GBP | M4 Money Supply M/M Aug | 0.20% | 0.20% | -0.50% | -0.60% |
| 09:00 | EUR | Eurozone CPI Y/Y Sep P | 4.30% | 4.50% | 5.20% | |
| 09:00 | EUR | Eurozone CPI Core Y/Y Sep P | 4.50% | 4.80% | 5.30% | |
| 12:30 | CAD | Canada GDP M/M Jul | 0.00% | 0.10% | -0.20% | |
| 12:30 | USD | Personal Income M/M Aug | 0.40% | 0.40% | 0.20% | |
| 12:30 | USD | Personal Spending Aug | 0.40% | 0.50% | 0.80% | |
| 12:30 | USD | PCE Price Index M/M Aug | 0.40% | 0.50% | 0.20% | |
| 12:30 | USD | PCE Price Index Y/Y Aug | 3.50% | 3.50% | 3.30% | 3.40% |
| 12:30 | USD | Core PCE Price Index M/M Aug | 0.10% | 0.20% | 0.20% | |
| 12:30 | USD | Core PCE Price Index Y/Y Aug | 3.90% | 3.90% | 4.20% | 4.30% |
| 12:30 | USD | Goods Trade Balance (USD) Aug P | -84.3B | -91.2B | -90.9B | -90.9B |
| 13:45 | USD | Chicago PMI Sep | 47.6 | 48.7 | ||
| 14:00 | USD | Michigan Consumer Sentiment Index Sep F | 67.7 | 67.7 |