Sample Category Title
Key Signals of Crypto Market Revival
Market picture
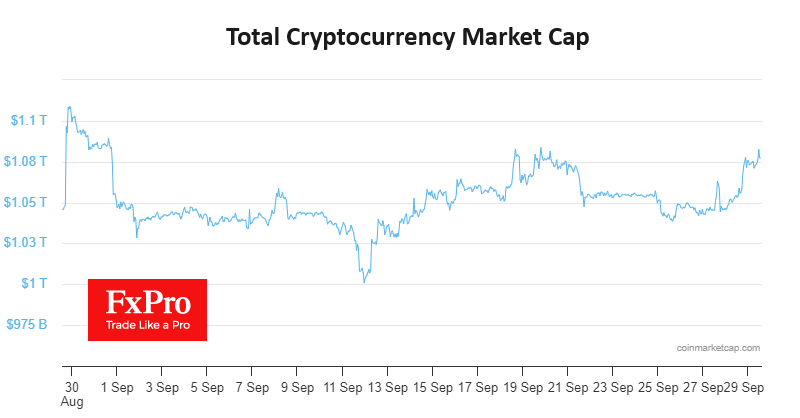
The crypto market has been torn, rising over 2% in the last 24 hours to $1.076 trillion. The excitement came after the approval of the Ethereum Futures ETF from Valkyrie, which will be available for trading from Friday. It’s not the victory everyone expected, as they were waiting for a long list of spot Bitcoin ETFs to be approved. But the positive news coincided nicely with a rebound in equity markets and a corrective decline in the dollar, adding fuel to the fire.
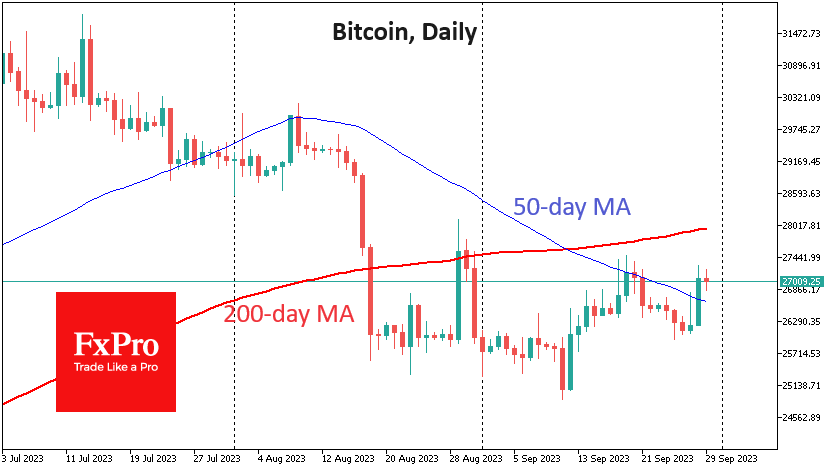
Bitcoin surged above $27K on Thursday, gaining over $800 (3.2%). The momentum allowed it to climb above its 50-day moving average, something it has been unable to do since early August. The ability to hold levels above this curve will be the first confirmation of a change in trend and will turn observers’ attention to the 27.5 area, where the previous local highs are located. We believe a move above $28K will attract even more buying interest.
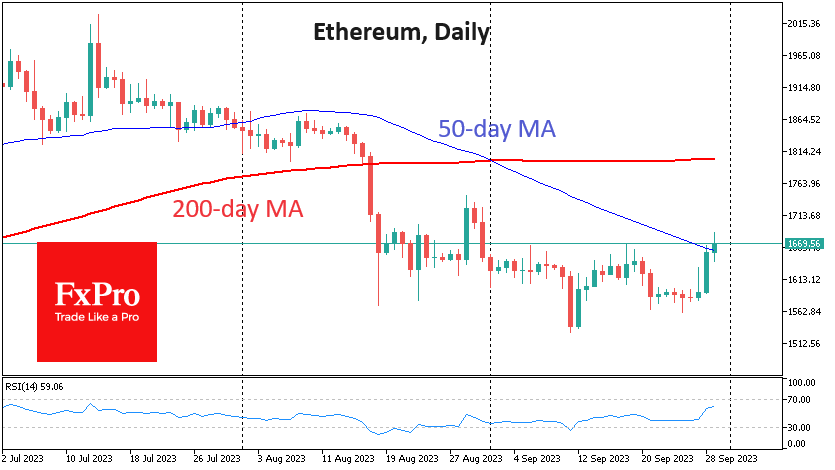
Ethereum gained over 3.2% in 24 hours, briefly topping $1685, its highest level since late August. Technically, it has managed to reverse the downtrend, boosting optimism for Bitcoin and the entire crypto market.
News Background
The SEC postponed a decision on applications to launch a spot Ethereum ETF from 21Shares and VanEck until the end of December. The regulator said it was “appropriate” to delay the applications to give it time to review the matter.
Ethereum blockchain developers have launched the Holesky test network at the second attempt, after a failed attempt on the anniversary of The Merge update. The new test network is intended to replace Goerli, which has been running since 2019 and whose support will end in early 2024.
Paysafe Payment Solutions, a euro payment provider, has stopped working with Binance. Industry participants have begun preparing for the collapse of Binance, writes the Wall Street Journal. If the leading crypto exchange collapses in the short term, liquidity in the market could evaporate, leading to a sharp decline in cryptocurrency prices.
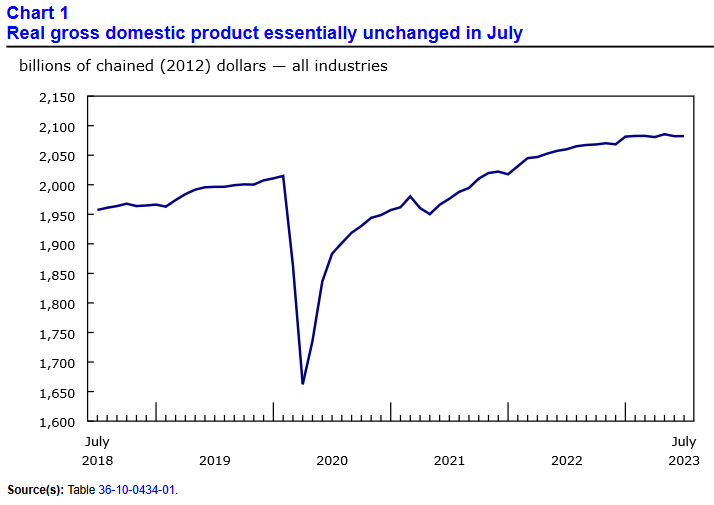
Canada GDP flat in July, might edge up 0.1% mom in Aug
Canada GDP was essentially unchanged in July, below expectation of 0.10% mom growth. Goods-producing industries contracted -0.3% mom while services-producing industries grew 0.1% mom. Overall, 9 of 20 industrial sectors posted increases.
Advance information indicates that real GDP edged up 0.1% mom in August. Increases in wholesale trade and finance and insurance sectors were partly offset by decreases in retail trade and oil and gas extraction sectors.
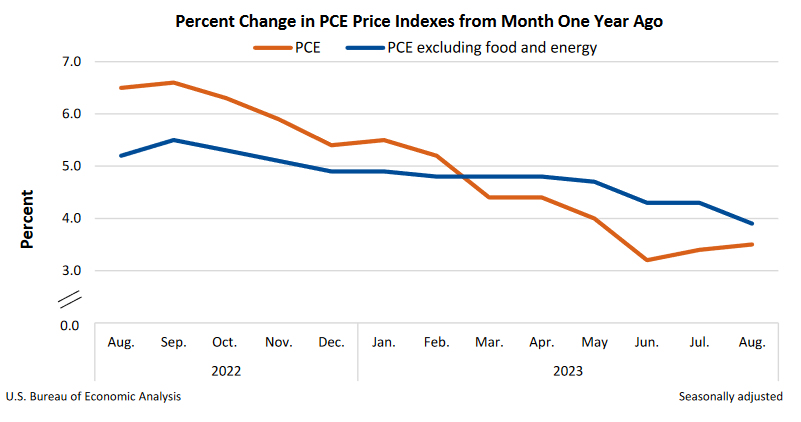
US PCE inflation rose to 3.5% yoy in Aug, core PCE down to 3.9% yoy
US personal income rose 0.4 mom or USD 87.6B in August, matched expectations. Personal spending rose 0.4% mom or USD 83.6B, below expectation of 0.5% mom. That includes USD 47.0B increase in spending for services, and USD 36.7B increase in spending for goods.
For the month, headline PCE price index rose 0.4% mom, below expectation of 0.5% mom. Core PCE price index rose 0.1% mom, below expectation of 0.2% mom. Prices for goods increased 0.8% mom and prices for services increased 0.2% mom. Food prices increased 0.2% mom and energy prices increased 6.1% mom.
From the same month one year ago, headline PCE price index rose from 3.4% yoy to 3.5% yoy, matched expectations. Core PCE price index slowed from 4.3% yoy to 3.9% yoy, matched expectations. Prices for goods increased 0.7% yoy and prices for services increased 4.9% yoy. Food prices increased 3.1% yoy and energy prices decreased -3.6% yoy.
ECB’s Vasle: Probably done with rate hikes, but still many uncertainties
In a panel discussion held in Skopje today, opinions about the future of interest rates and inflation were aired by two members of ECB's Governing Council.
Bostjan Vasle suggested that the series of interest rate hikes might have come to an end, citing a possible easing of inflation. Boris Vujcic, on the other hand, shared a more cautious perspective, highlighting potential challenges in attaining the 2% inflation target.
Vasle, Slovenia's central bank head, was quoted saying, "It's probably the case that we are done with interest-rate increases." He noted that current economic indicators appear favorable, with preliminary signs of inflation tapering off.
However, Vasle also pointed out the prevailing uncertainties, stating, "We are seeing some signs of inflation going down, also some first signs of sustainability of this trends, but on the other hand, there are still many uncertainties."
Croatian central bank chief Vujcic, acknowledged the downward movement towards the 2% goal but pointed out the statistical effects that may be influencing these figures. His words served as a reminder of the monetary policy challenges that could arise if the disinflation process stalls before reaching the target.
"You might get into a situation where the inflation rate — the disinflation process — stops at a level, which is not your target," Vujcic expressed. "Then it's challenging for monetary policy, because it has to do something more to bring it all the way down to 2%."
Canadian Dollar Extends Gains ahead of GDP
- Canada’s GDP expected to improve
- US PCE Core Prices projected to stay steady at 0.2%
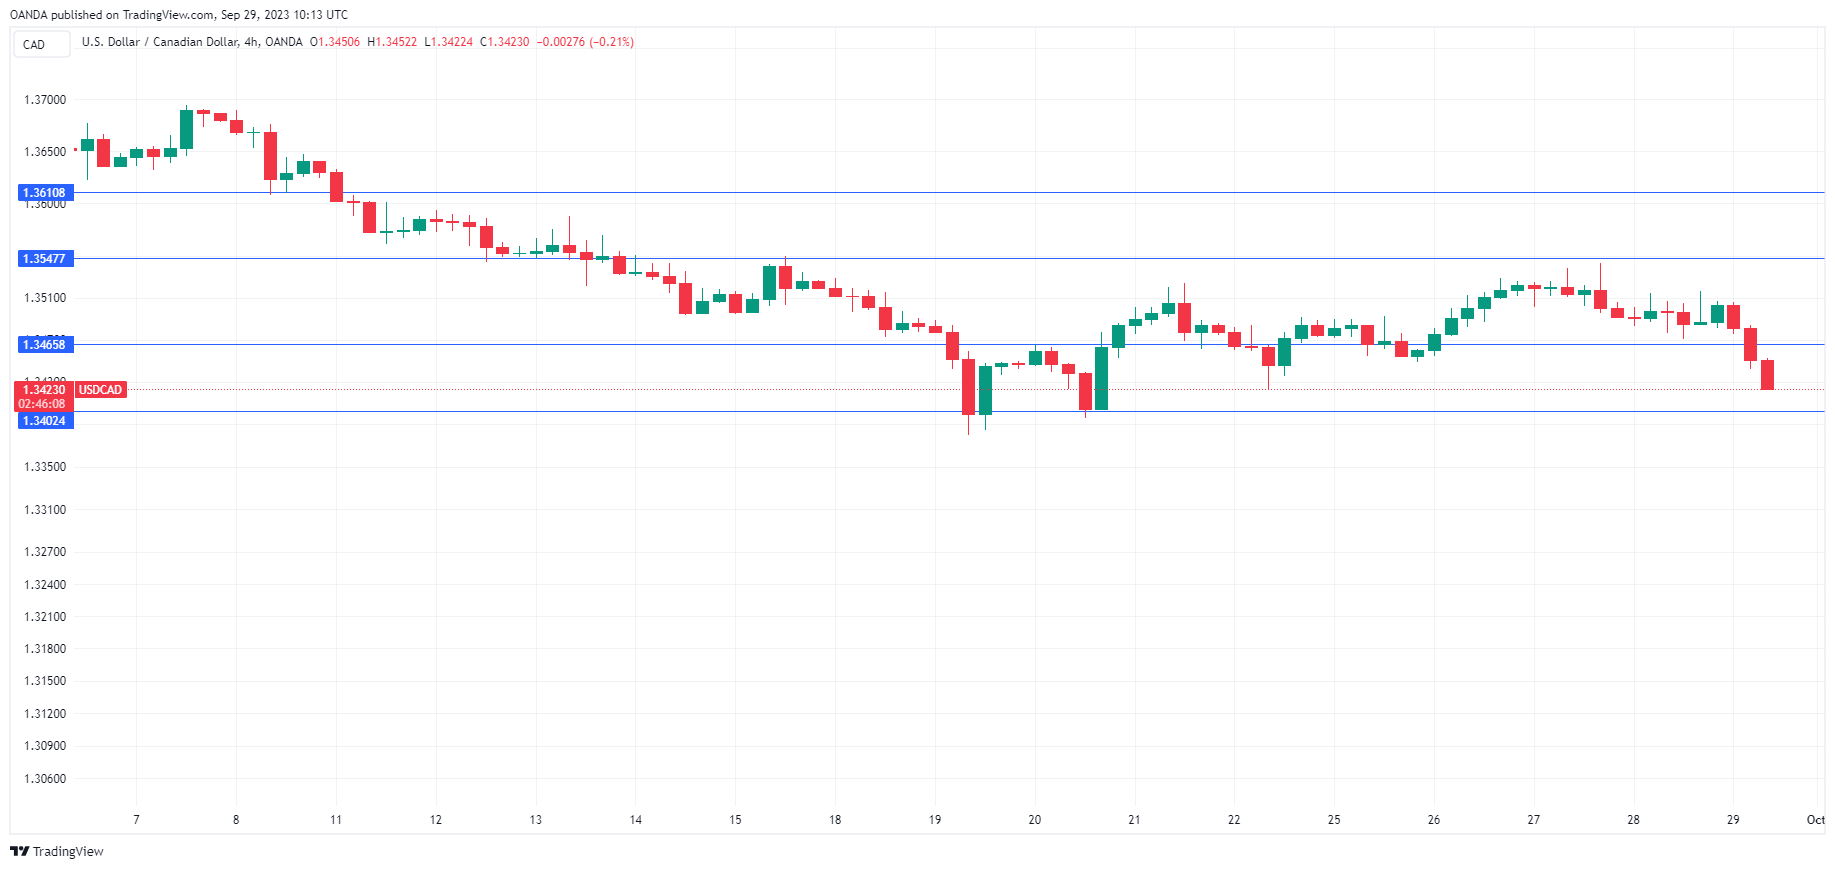
The Canadian dollar has posted losses on Friday. In the European session, USD/CAD is trading at 1.3446, down 0.28%.
Canada’s GDP expected to post 0.1% gain
I have noticed the phrase “US exceptionalism” being bandied about lately. This is in reference to the impressive strength of the US economy in the face of rising interest rates, in comparison to other major economies most of which are struggling. For proof, one has to go no further than the northern neighbor of the US, as Canada’s economy contracted by 0.2% m/m in July, with weakness reported across the economy. The labour market, which held strong as the Bank of Canada piled on higher interest rates, has slowed. Inflation rose in August to 4.0%, up sharply from 3.3% in July and well above the 2% target. Two of three core inflation measures also climbed, raising concerns that the central bank may be forced to raise interest rates before the end of the year.
Canada releases the August GDP report later today, with the markets expecting a small gain of 0.1% m/m. This would essentially point to stagnation, but that would be better than a second straight reading of negative growth, which would technically mean that the economy is in a recession. The Canadian dollar has held its own in September despite this grim backdrop, helped by rising oil prices which are fast approaching $100.
In the US, the markets will be keeping an eye on Core PCE Prices, which is considered the Fed’s preferred inflation indicator. The index was unchanged in July at 0.2% m/m, but the annual rate remains quite high at 4.2%. The consensus estimate is unchanged at 0.2%, and an unexpected reading could affect the movement of the US dollar.
USD/CAD Technical
- USD/CAD is testing resistance at 1.3468. The next resistance line is 1.3553
- 1.3408 and 1.3323 are the next support lines
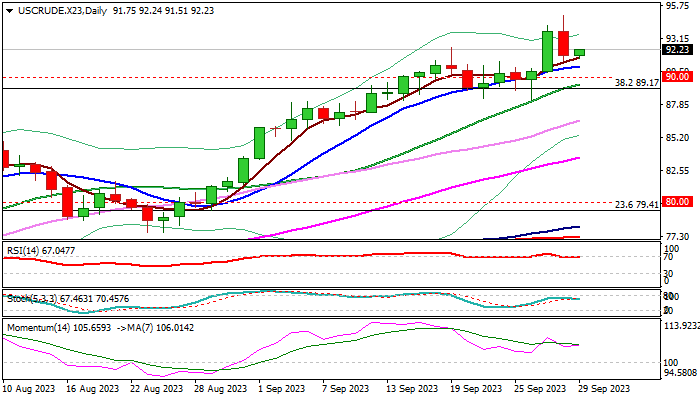
WTI Oil: Consolidating Under New 2023 High, On Track for a Quarterly Gains of Nearly 30%
WTI oil price is moving within a tight range but holding traction on Friday following a pullback from new 2023 high ($95.00) on Thursday (down 2% for the day).
Overall structure remains bullish, with tight supply on Saudi Arabia and Russia’s decision to extend their production cut for the rest of the year, offsetting concerns about lower demand on fragile conditions in western economies and slower than expected recovery of China’s economy (world’s second largest and top oil importer).
Oil price advanced almost 30% in the third quarter, with expectations to hit psychological $100 level if overall environment remains unchanged.
The contract is on track for bullish weekly close despite the latest easing and also for repeated close above $90 level, which will add to positive signals.
On the other hand, last week’s tight Doji candle and a long-legged candle forming this week, signal indecision, with overbought daily studies adding to signals that bulls may pause for consolidation.
Near-term action is also facing strong headwinds from the top of thick weekly Ichimoku cloud and may take some time to register a clear break higher.
Immediate support at $91.38 (Thursday’s low / rising 5DMA) holds for now and guard 10DMA ($90.84), with near-term bias expected to remain with bulls while the price stays above $90 level.
Caution on extension and close below $89.40/17 (20DMA / broken Fibo 38.2% of 130.48/$63.63) which would risk deeper pullback.
Res: 92.40; 93.42; 94.15; 95.00.
Sup: 91.38; 90.84; 90.00; 89.40.
US 30 Analysis: Dow Jones Finds Support
September is likely to be the second month in a row that the Dow Jones (US 30) stock market index declined. The last time this happened was... also in September, a year ago.
Important economic data was published yesterday:
→ According to a revised report released by the Bureau of Economic Analysis, US real GDP increased 2.1% year over year in the second quarter. This reduces the risk of recession.
→ The number of applications for unemployment benefits amounted to 204k for a week, which continues the downward trend that has emerged since June of this year.
Today, fresh data on the PCE inflation index will be published, it can provide evidence that inflation is slowly subsiding as long as the economy remains resilient.
More bullish arguments for displaying cautious optimism are provided by the Dow Jones index chart:
→ the price of US 30 has formed an inverted head-and-shoulders pattern (SHS);
→ this bullish pattern formed near the lower border of the descending channel — which indicates support from this line;
→ after Wednesday, when the bearish acceleration was noticeable, the price recovered — this is a sign that if there were panic sentiments, they have exhausted themselves.
→ On Thursday, the bears’ attempts to resume the decline failed, and Friday morning looks optimistic – during the Asian session the price exceeded Thursday’s high.
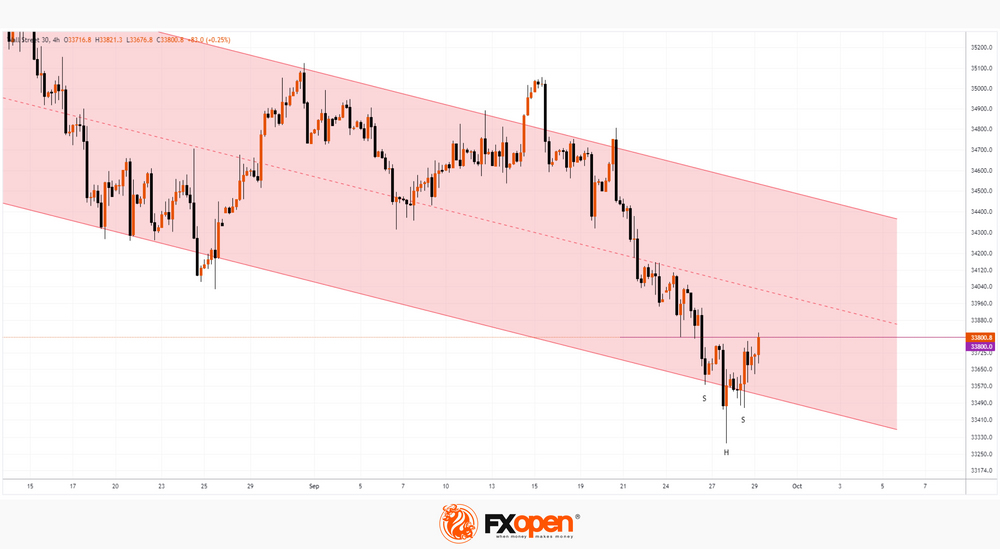
The market will receive more bullish arguments if the price can consolidate above the resistance of 33,800, which is the neck line of SHS.
Perhaps the tone for the rally is being set by insiders who have information that the risk of a government shutdown in the US is being minimized. If the emerging optimism continues for a longer period of time, then October will be able to interrupt the pattern of 2 bearish candles on the monthly chart, as was the case last year.
This article represents the opinion of the Companies operating under the FXOpen brand only. It is not to be construed as an offer, solicitation, or recommendation with respect to products and services provided by the Companies operating under the FXOpen brand, nor is it to be considered financial advice.
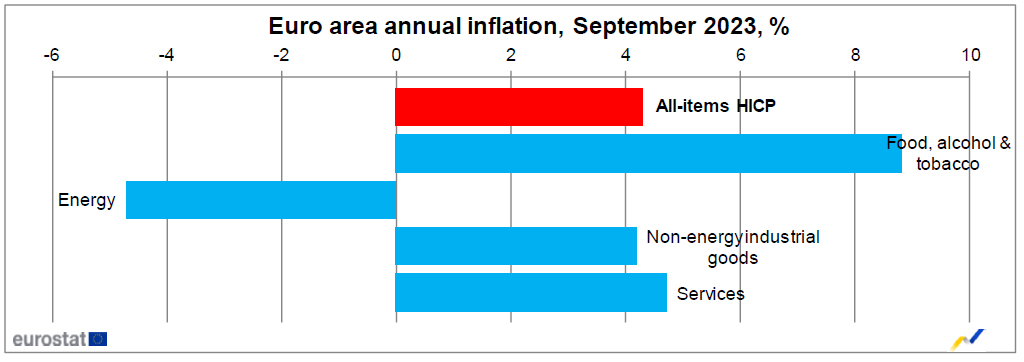
Eurozone CPI eases to 4.3% in Sep, core CPI down to 4.5%
Eurozone CPI slowed from 5.2% yoy to 4.3% yoy in September, below expectation of 4.5% yoy. CPI core (ex energy, food, alcohol & tobacco) also slowed from 5.3% yoy to 4.5% yoy, below expectation of 4.8% yoy.
Looking at the main components, food, alcohol & tobacco is expected to have the highest annual rate in September (8.8%, compared with 9.7% in August), followed by services (4.7%, compared with 5.5% in August), non-energy industrial goods (4.2%, compared with 4.7% in August) and energy (-4.7%, compared with -3.3% in August).
Gold Price Accelerates Lower, Crude Oil Price Dips
Gold price is moving lower below the $1,885 support. Crude oil price is now correcting gains and trading below the $92.00 support.
Important Takeaways for Gold and Oil Prices Analysis Today
- Gold price failed to clear the 1,915 resistance and moved lower against the US Dollar.
- A major bearish trend line is forming with resistance near $1,865 on the hourly chart of gold at FXOpen.
- Crude oil prices are now correcting lower below the $92.00 zone.
- There was a break below a key bullish trend line with support near $92.50 on the hourly chart of XTI/USD at FXOpen.
Gold Price Technical Analysis
On the hourly chart of Gold at FXOpen, the price struggled to settle above the $1,915 resistance. The price started a fresh decline below the $1,900 pivot level.
The price traded below the $1,885 support and the 50-hour simple moving average. It tested the $1,858 zone. A low is formed near $1,857.71 and the price is now consolidating losses. It is now struggling below the 23.6% Fib retracement level of the downward move from the $1,915 swing high to the $1,857 low.
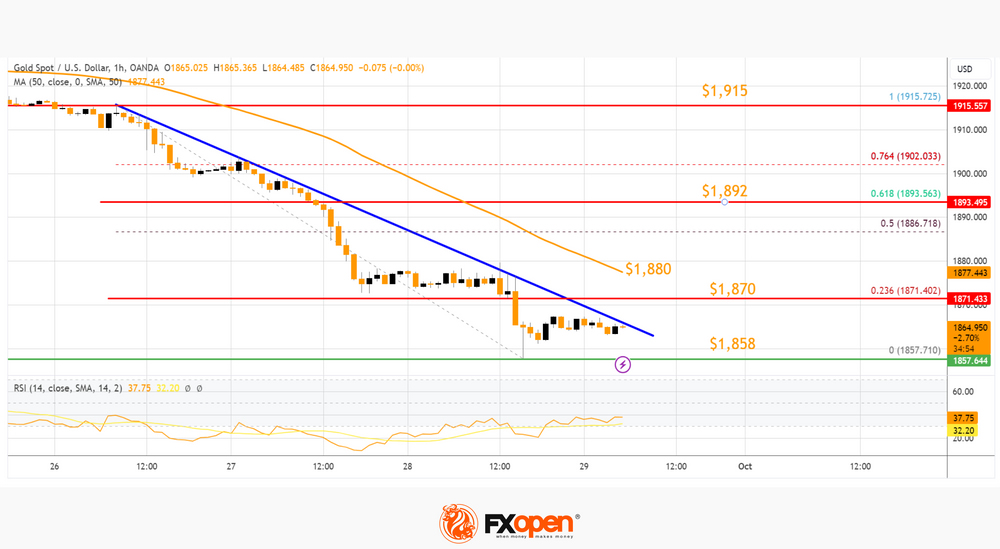
There is also a major bearish trend line forming with resistance near $1,865. The next major resistance is near $1,870, above which the price could test the 50-hour simple moving average at $1,880.
The next major resistance is near the 61.8% Fib retracement level of the downward move from the $1,915 swing high to the $1,857 low at $1,892. An upside break above the $1,892 resistance could send Gold price toward $1,915. Any more gains may perhaps set the pace for an increase toward the $1,930 level.
Initial support on the downside is near the $1,858 level. The first major support is near the $1,850 level. If there is a downside break below the $1,850 support, the price might decline further. In the stated case, the price might drop toward the $1,832 support.
Oil Price Technical Analysis
On the hourly chart of WTI Crude Oil at FXOpen, the price struggled to continue higher above $94.00 against the US Dollar. The price formed a short-term top and started a fresh decline below $92.50.
There was a steady decline below the $91.50 pivot level. The bears even pushed the price below $91.20 and the 50-hour simple moving average. There was also a break below a key bullish trend line with support near $92.50.
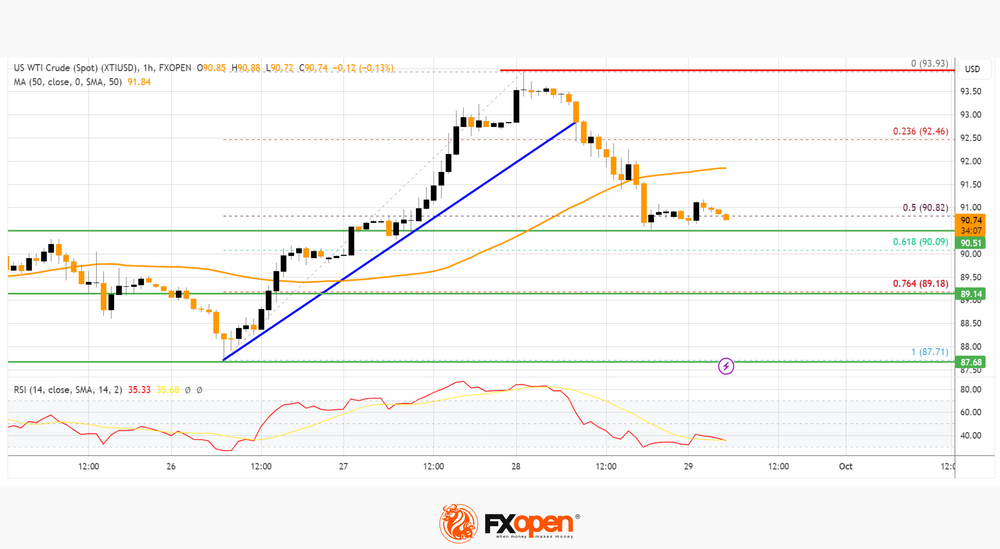
Finally, it tested the 50% Fib retracement level of the upward move from the $87.71 swing low to the $93.93 high. Immediate support is near the $90.50 level.
The next major support on the WTI crude oil chart is near $89.20 or the 76.4% Fib retracement level of the upward move from the $87.71 swing low to the $93.93 high. If there is a downside break, the price might decline toward $89.20. Any more losses may perhaps open the doors for a move toward the $87.80 support zone.
On the upside, immediate resistance is near the 50-hour simple moving average at $92.00. The next key resistance is near $92.40. If the price climbs further higher, it could face resistance near $93.20. Any more gains might send the price toward the $94.00 level.
This article represents the opinion of the Companies operating under the FXOpen brand only. It is not to be construed as an offer, solicitation, or recommendation with respect to products and services provided by the Companies operating under the FXOpen brand, nor is it to be considered financial advice.
AUD/USD: Recovery Accelerates on Month/Quarter End Profit Taking
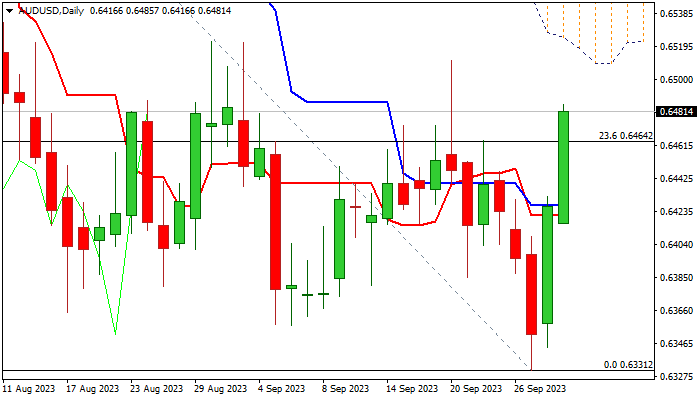
AUDUSD extends strong bounce from new 2023 low (0.6331) into second straight day, driven by profit-taking at the end of the month/quarter.
Slight change in Fed’s narrative on monetary policy from hawkish stance to unclear signals whether more policy tightening will be needed in coming months and looming partial US government shutdown, weighed on US dollar, putting larger bulls on hold and providing temporary relief to Australian currency.
Improving daily technical studies support recovery, with strong offers seen at 0.6510/20 zone (falling 55DMA / Aug 30 / Sep 1 double top / base of thick daily cloud), which should ideally cap recovery and offer better selling opportunities.
Conversely, penetration of daily cloud and sustained break above 0.6546 pivot (Fibo 38.2% of 0.6894/0.6331) would sideline larger bears for stronger recovery and expose targets at 0.6613/32 (50% retracement/daily cloud top).
Res: 0.6511; 0.6522; 0.6546; 0.6587.
Sup: 0.6464; 0.6427; 0.6380; 0.6357.