

Sample Category Title
AUD/JPY and Copper soar on renewed China optimism
Australian Dollar experienced a significant surge in today's Asian trading session, fueled in part by the vigorous rebound observed in Hong Kong stocks, the Chinese Yuan, and Copper prices. The rebound in stocks could attributed possible position adjustments after a tumultuous quarter in Hong Kong and China, and with the impending long holiday in China lasting until October 9. But there's still a budding sentiment of optimism concerning China's potential for economic recuperation.
A noteworthy comment from the International Monetary Fund has contributed to this optimism. The IMF recently expressed its observation yesterday of certain stabilization signs in China's economy from the latest data sets. The institution holds a perspective that China could realistically achieve growth rate close to 5% this year. Looking forward, the IMF anticipates China's GDP growth to decelerate to approximately 3.5% over a medium-term horizon. Nevertheless, this pace could experience a boost if China embarks on economic reforms.
AUD/JPY has powerfully broken 96.05 resistance mark, which is indicative of resumption of its recent rise from the 92.77. However, the nature of the current rally doesn't explicitly suggest it's impulsive, maintaining an air of ambiguity around potential technical interpretations.
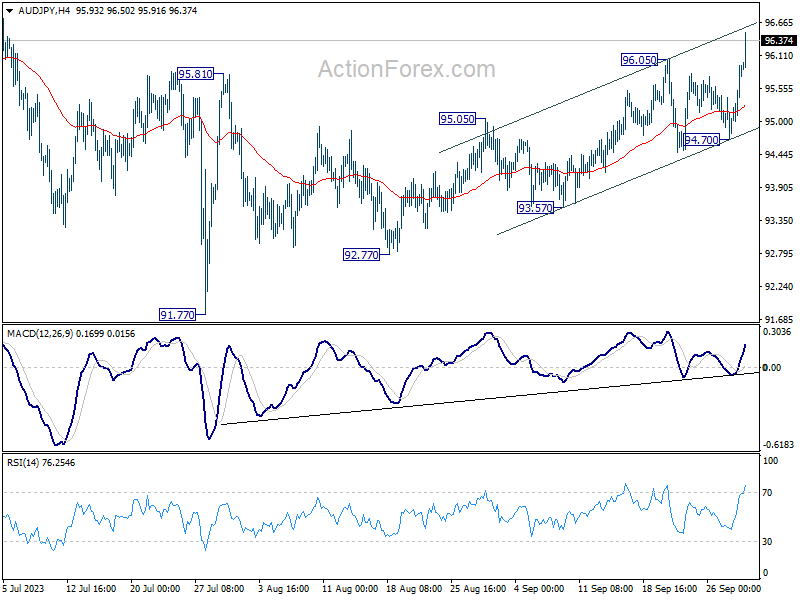
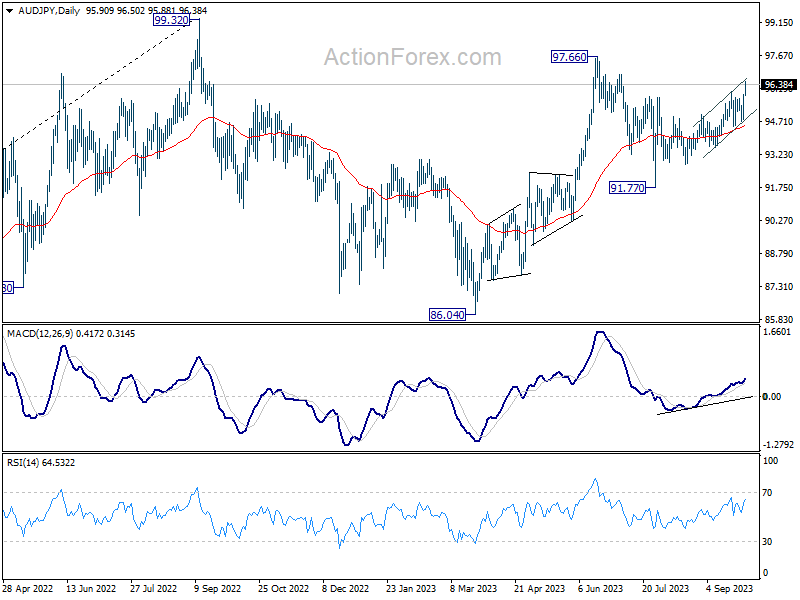
In one scenario, if price action from 91.77 serves as the second leg of the pattern originating from 97.66, then the peak of the current rally might be restricted by 97.66 resistance.
In another case, if the upswing from 91.77 is in continuation with the entire surge from 86.04, the climb could still be seen as the second leg of the pattern from the 2022 high of 99.32. As such, the upper boundary could be set by the 99.32 mark, even if 97.66 is surpassed.
So, upside potential appears to be limited for the medium term.
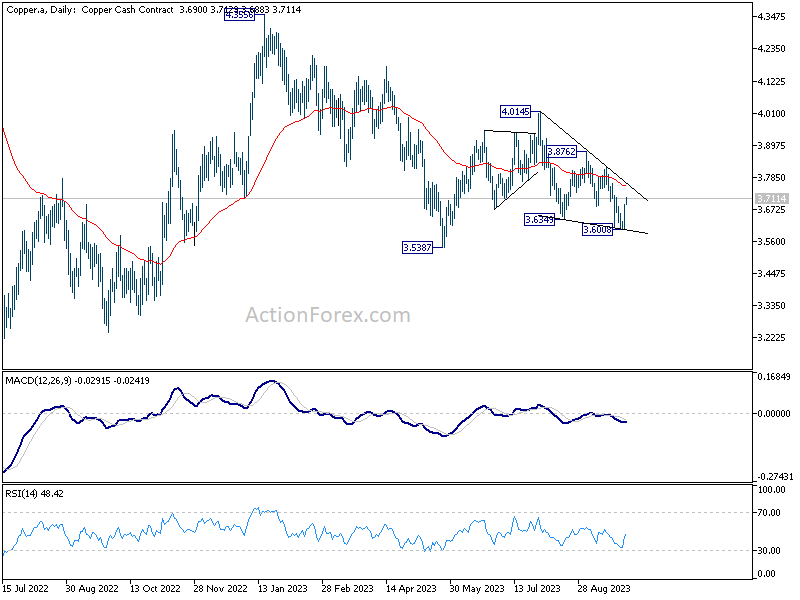
Turning to Copper, its robust rebound this week suggests that decline from 4.0145 might have culminated, completing three waves that bottomed at 3.6008. Sustained trading above 55 D EMA (now at 3.7540) would solidify this viewpoint, setting sights on 3.8762 resistance for validation.
For Australian Dollar to secure its foundational momentum, decisive break of 3.8762 resistance in Copper might be essential. Absent this, Aussie's rebound might retain its corrective nature.
USD/JPY Remains In Uptrend And Eyes 150.00
Key Highlights
- USD/JPY is moving higher above the 148.80 resistance zone.
- A key bullish trend line is forming with support near 148.80 on the 4-hour chart.
- EUR/USD tested 1.0500 and is currently recovering higher.
- Gold prices declined heavily below the $1,880 level.
USD/JPY Technical Analysis
The US Dollar started a decent increase from the 146.50 zone against the Japanese Yen. USD/JPY is rising and trading above the 148.80 resistance zone.
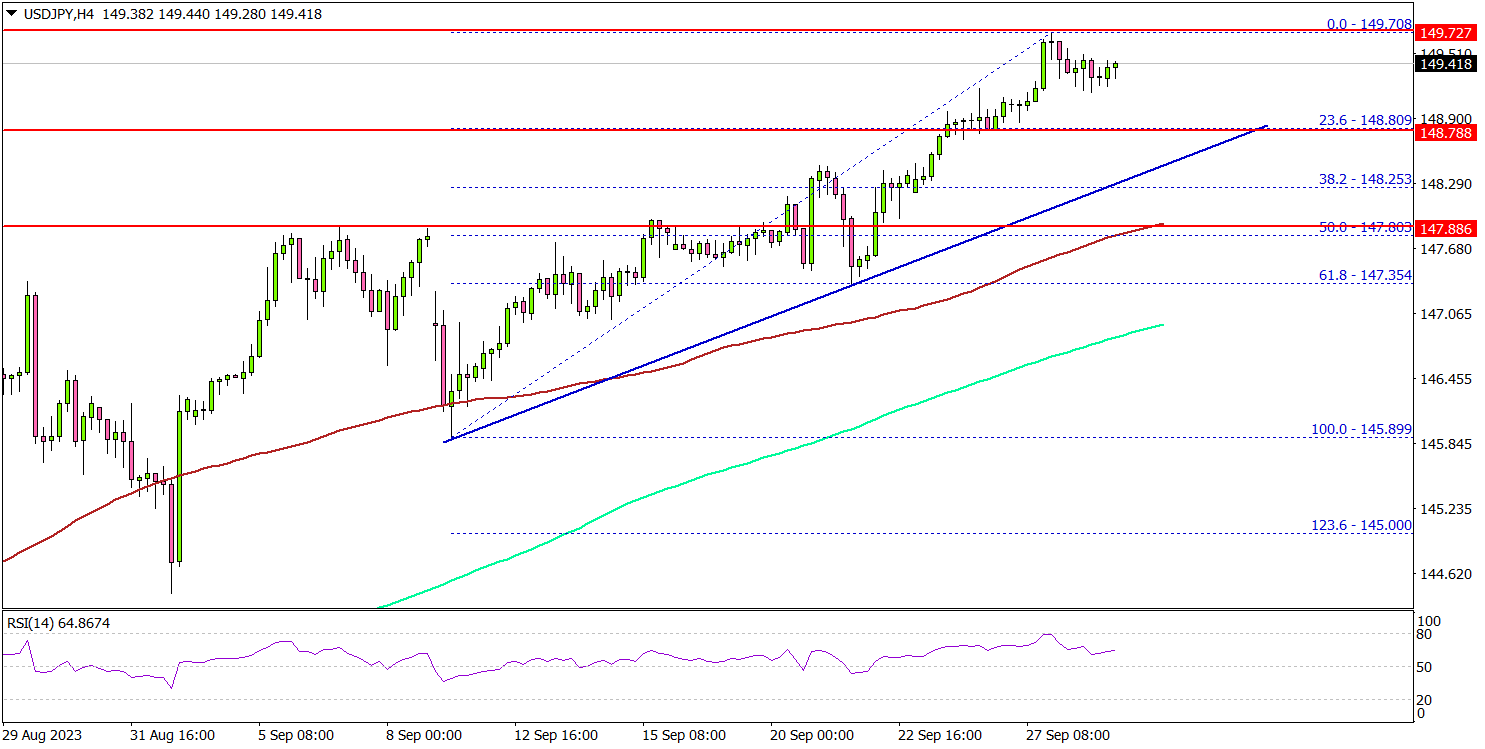
Looking at the 4-hour chart, the pair settled above the 148.80 level, the 100 simple moving average (red, 4 hours), and the 200 simple moving average (green, 4 hours).
The pair is showing positive signs and even climbed above 149.20. A high is formed near 149.70 and is currently consolidating gains. Immediate support is near the 149.00 level. The next key support is seen near the 148.80 level.
There is also a key bullish trend line forming with support near 148.80 on the same chart. The next main support is 147.80 and the 100 simple moving average (red, 4 hours), below which it could test 147.00. Any more losses might send the pair toward the 146.50 level.
On the upside, immediate resistance is near the 149.70 level. The first major resistance is near 150.00. A close above 150.00 could start a steady increase toward 159.20.
Looking at EUR/USD, the pair extended its decline toward the 1.0500 level and is currently attempting a recovery wave.
Economic Releases
- UK GDP for Q2 2023 (Preliminary) (QoQ) - Forecast +0.2%, versus +0.2% previous.
- US Personal Income for August 2023 (MoM) - Forecast +0.4%, versus +0.2% previous.
Japan’s industrial output flat in Aug, Tokyo inflation eases in Sep
Japan's industrial output for August surprised by remaining steady month-on-month, outpacing expectations of a -0.8% mom decline. The seasonally adjusted index of production at factories and mines held its ground at 103.8, based on 2020 base of 100. Equally, index of industrial shipments ticked up by 0.1% to 103.2. In contrast, inventory index marked a -1.7% decrease to 104.6, registering the first decline in a quadrimestrial span.
The Ministry of Economy, Trade and Industry maintained a cautious tone on the economy's direction, indicating that industrial output "fluctuated indecisively." However, optimism is still present; the ministry's poll suggests that manufacturers anticipate a 5.8% uptick in production for September, followed by a 3.8% rise in October.
On the retail front, August saw a 7.0% yoy surge in retail sales, surpassing anticipated 6.4% yoy. This momentum builds upon the month's modest growth of 0.1% mom.
The labor market remained resilient, with the unemployment rate steadfast at 2.7%. The job offers-to-applicants ratio for August persisted at 1.29, unchanged from July.
Inflationary pressures seem to be cooling down. Tokyo's core CPI for September, excluding food, dipped more than forecasted, from 2.8% yoy to 2.5% yoy , as opposed to the predicted 2.6% yoy. Headline CPI decreased slightly from 2.9% yoy to 2.8% yoy. Additionally, core-core CPI, which excludes both food and energy, retreated from 4.0% yoy to 3.8% yoy.
Fed’s Barkin: Path forward depends on inflationary pressures
Richmond Fed President Thomas Barkin highlighted the existing uncertainties surrounding the economic outlook in remarks made overnight. He stated, "The range of potential outcomes, to me, is still pretty broad," emphasizing the unpredictability of the current economic situation.
Reflecting on the recent decision of Fed to maintain status quo on interest rates, he said, "That's why I supported our decision to hold rates steady at the last meeting."
"We have time to see if we've done enough, or whether there's more work to be done," he added.
"The path forward to me depends on whether we can convince ourselves inflationary pressures are behind us, or whether we see them persisting," he said. Barkin further highlighted the significance of labor market developments in informing his perspective.
RBA Board a Certain Hold Next Week
The Reserve Bank Board meets next week on October 3 with Governor Bullock presiding over her first meeting.
We are certain that the Board will decide to continue the pause that began at the July meeting.
The Board meetings which occur immediately before the release of the quarterly Inflation Report and the updating of the staff's forecasts (namely those in April, July and October) have been ones where the Board has shown a preference to pause – even during this long tightening cycle.
At the October meeting last year, there was a surprise slowing in the pace of tightening from 50bps to 25bps; in January this year there was no meeting; April saw the first pause in the cycle after consecutive hikes in February and March; and July saw a pause after consecutive hikes in May and June.
Rates remained on hold in August and September so a move in October would be very surprising.
That does not preclude the Board from continuing to consider the two options – an increase of 0.25% or hold rates steady.
After describing the decision in June as "finely balanced" the Board has described the "on hold" decision as the "stronger one" in subsequent meetings – indicating a clear preference for the pause option.
The October decision statement is likely to repeat the sentiment, "members noted that some further tightening in policy may be required should inflation prove more persistent than expected."
That statement is a sensible position for a cautious central bank to hold, while inflation remains above the target band, while also providing some residual support for the vulnerable AUD (recently fallen below US64¢).
It is unlikely that the August monthly Inflation Indicator is a game changer. Annual inflation lifted from 4.9% in the year to July to 5.2%, mainly reflecting a 9% lift in petrol prices. A more reliable monthly Indicator than the Trimmed Mean monthly, which excludes volatile items, actually slowed from 5.8% to 5.5%.
The more comprehensive September quarterly Inflation Report will be watched closely by the Board and the market – with information from that quarterly update to feed into the RBA's considerations at the November Board meeting.
While the Bank does not publish its forecasts for annual inflation to the September quarter it does provide December and June.
It is currently expecting inflation to fall from around 6.0% in June (Trimmed Mean 5.9%; Headline 6.0%) to around 4% in December (TM 3.9% and Headline 4.1%).
Results around 5% for the September quarter would be in line with their expectations. These numbers would also have to be considered in the context of ongoing weakness in household spending; signs of a turning point in the labour market (job vacancies fell 9% in the three months from May to August); and real concerns around the outlook for China.
The market is currently giving around a 40% chance of a rate hike in November lifting to 90% in March.
Despite this market pricing, which is also indicating no rate cuts until 2025 we expect that the cash rate will remain on hold until August next year when the first rate cut can proceed. Our forecast for the conditions the Board will be facing by then will be an inflation rate that has fallen from 4.1% to 3.4%; an unemployment rate of 4.5%; and economic growth through the year to June of 1.0%.
One argument we see for the expected rate hike by March is that Australian rates are just too low relative to other central banks.
Figure 1 compares the movement in the effective mortgage rate for Australia and other majors.
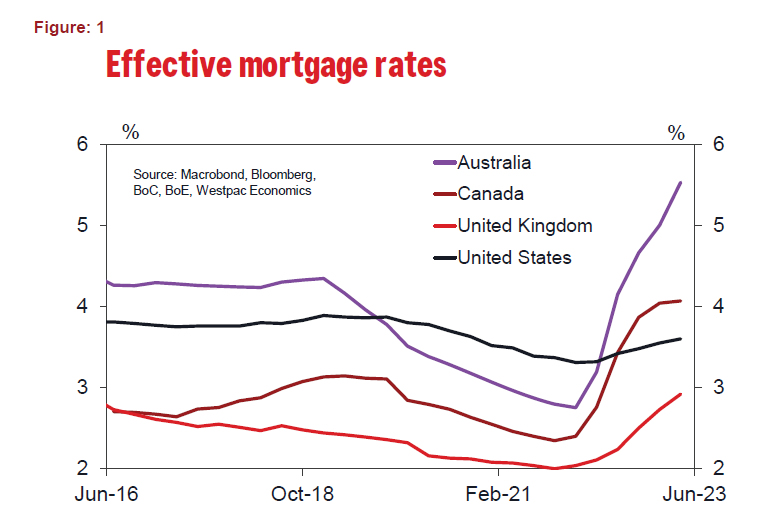
Australian borrowers have been much more sensitive to the recent sharp tightening cycle than other countries due to the low proportion of fixed rate loans – even recognising that the share reached around 35% in 2022. Effective mortgage rates have lifted from 3.3% to 3.6% in the US compared to 2.75% to 5.6% in Australia.
The impact, which from Australia's rates holding well below US rates has been through the AUD/USD, which remains fragile at US64¢.
But this negative yield differential with the US is not a new story.
The "new story" is the relentless upgrade of the growth outlook for the US economy. Earlier this year Consensus forecasts for US growth in 2023 were around 0.4%, with general expectation of a recession at some time over 2023 and into 2024. Recent Consensus and FOMC forecasts have lifted growth in the US for 2023 to 2% while talk of recession has been scaled right back.
As we show in Figure 2, the shape of the US yield curve continues to be consistent with a recession. But in recent weeks yields have risen and the curve has begun to flatten – a bear flattener where long bond rates have risen by more than short rates.
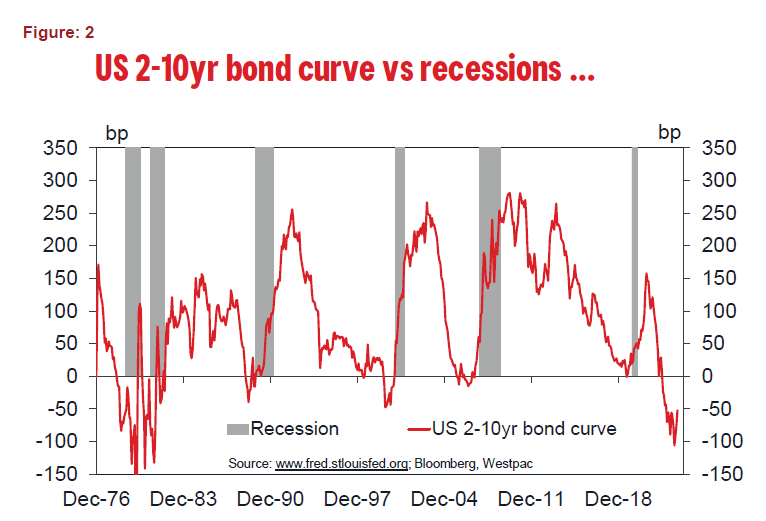
That lifting of the yield curve has also impacted the near term prospect for the RBA, but reflects, in our view, more of a curve movement driven by rising long rates than the expectation of an RBA rate hike.
The decision by the FOMC to issue guidance in its "dot plot" that there will only be two rate cuts next year rather than four has had some impact but, at this stage, surprisingly less than might have been expected. The key reason why the FOMC scaled back its rate forecasts was a reduction in its forecast for the unemployment rate by end 2024 from 4.5% to 4.1%. Westpac is more cautious on the US economy next year, expecting the unemployment rate to reach around 5%. We have therefore retained our call for four FOMC rate cuts in 2024.
However, we have sharply lifted our profile for the US ten year bond rate by end 2024 by 60bps to 4%. That still leaves a slightly inverse yield curve for the US by end 2024.
Despite the FOMC cutting rates next year bonds may be even less attractive than we are expecting. With the US economy avoiding a recession and the FOMC cutting rates the market may require a regular shaped yield curve much earlier than we are currently expecting.
That need for a regular shaped curve signals a sharp rise in bond rates. A potential outcome would pressure the equity market.The issue here is that despite the sharp tightening cycle which the FOMC has implemented equity markets have been resilient – limiting the main channel through which FOMC policy can impact the US economy.
As we saw in 2018, any major negative outcome in the US equity market is likely to trigger an aggressive response from the FOMC.
A much more rapid easing cycle from the FOMC in 2024 would take pressure off the AUD; and certainly, set the scene for the RBA to follow.
Cliff Notes: Policy on Hold as Risks Evolve
Key insights from the week that was.
The Monthly CPI Indicator rose 0.6% (5.2%yr) in August, above the 0.3% (4.9%yr) print in July but still broadly in line with a trend deceleration since the peak of 8.4%yr in December 2022. While the print for headline inflation was in line with Westpac’s forecast, the component detail provided some surprises. Inflation in the housing segment was much weaker than anticipated – up 0.1% (6.6%yr) – driven by a fall in electricity prices (–1.3%mth) associated with the Energy Bill Relief Fund rebates in Melbourne. There were some key upside surprises too, including a 9.1% lift in fuel, a 1.3% increase in alcohol and tobacco prices, and a much more muted –0.1% fall in clothing and footwear than we initially anticipated. Underlying inflation momentum remained steady in August, with the Monthly Trimmed Mean holding flat at 5.6%yr. These developments, which in part reflects a stronger oil price (via fuel prices) and a weaker AUD (via imported components) – trends which seem to have persisted through to September – point to some upside risk to inflation over the near-term.
Turning to the labour market, job vacancies were reported to have fallen by 8.9% between May and August, a pick-up from the more modest decline of 2.5% over the prior three months. The tone of the survey is consistent with other evidence on labour market conditions, which suggests that the labour market has moved past its tightest point – a consequence of the significant improvement in labour supply and a gradual moderation in labour demand from very strong levels. That said, the total stock of job vacancies remains is still 72% above pre-pandemic levels and the vacancy-to-unemployment ratio remains at a historically elevated 0.72, implying that that labour market conditions remain very tight for now and there is further scope to ease over the next year.
However, as discussed by Chief Economist Bill Evans, the Monthly CPI Indicator is unlikely to have a major influence the RBA’s decision next week at the October Board meeting. As has been the case over the past year, the Board’s preference is to inspect the more comprehensive quarterly update on inflation – due next month – so it is therefore unlikely to change policy on the basis of the Monthly Indicator in the interim. Like the last two months, the RBA should continue to view the argument for remaining on hold as being the “stronger one”. This sentiment will be supported by the constructive flow of data developments over the last week, including another subdued print for nominal retail sales, with spending rising by only 0.2% in August, and emerging signs of a turning point in the labour market, suggesting that the impact of the RBA’s rapid tightening cycle is clearly working its way through the economy. Westpac remains of the view that the RBA will remain on hold until August 2024, wherein the next rate cut cycle is expected to begin in order to restore balance to demand conditions and support growth’s return towards trend.
It was a quiet week offshore, with mostly second-tier data releases in the US.
In the US, regional surveys pointed to a mixed picture. The Chicago Fed National Activity Index suggested the economy was growing below potential with a negative reading of –0.16 in August following a positive reading in July. All sub-indicators were in the red, though August’s weakness looks to be centred on a souring in personal consumption and housing. The employment indicator remained negative for a fourth consecutive month, reflective of emerging slack in the labour market.
The Richmond Fed Manufacturing index broke a 16-month streak of negative readings, coming in at +5pts for September. On current conditions, strength came from shipments, capacity utilisation and new orders. For the region, employment in the sector was optimistic overall, with number of employees rising as wages continued its ascent. Expectations remained upbeat, but less so than August. Meanwhile, the Kansas City Fed Manufacturing index fell to –8pts in September from flat in August, although a semblance of optimism for expectations six months ahead persevered. Of note, the prices paid and received sub-indicators for current vs previous month were both positive. The rise in oil prices through September likely contributed to higher producer prices but further readings are necessary to confirm whether its impact will persist.
Durable goods orders were firmer than expected in August, headline orders rising 0.2%mth and the measure excluding transport orders lifting 0.4%mth. Most of the strength was a consequence of defence spending however – excluding this, durable goods orders declined 0.7%mth. This supports the continued pessimistic outlook for manufacturing from the private sector, with firms’ investment intentions remaining under pressure. Weakness in non-defence goods orders, alongside autoworkers' strikes, points to some downside risk for private investment in GDP for Q3.
Regarding the consumer, there was a notable slip in confidence according to the Conference Board’s September survey, from 108.7 to 103.0, to be only slightly above the optimism/pessimism threshold. Underlying this is a clear divergence between households’ views around the present situation and expectations, the former still very optimistic at 147.1, whilst the latter soured nearly 10pts into deeply pessimistic territory, at 73.7.
FOMC members were also active this week. Many, Bowman and Kashkari in particular, were advocating for an additional rate hike on the basis of inflation risks; however, comments from Barkin and Goolsbee emphasised the importance of assessing the materialising impact of policy tightening. Of note, Goolsbee spoke on the trade-off between inflation and unemployment, positing that it may be weaker in the post-COVID era and hence, there is a greater risk of over tightening.
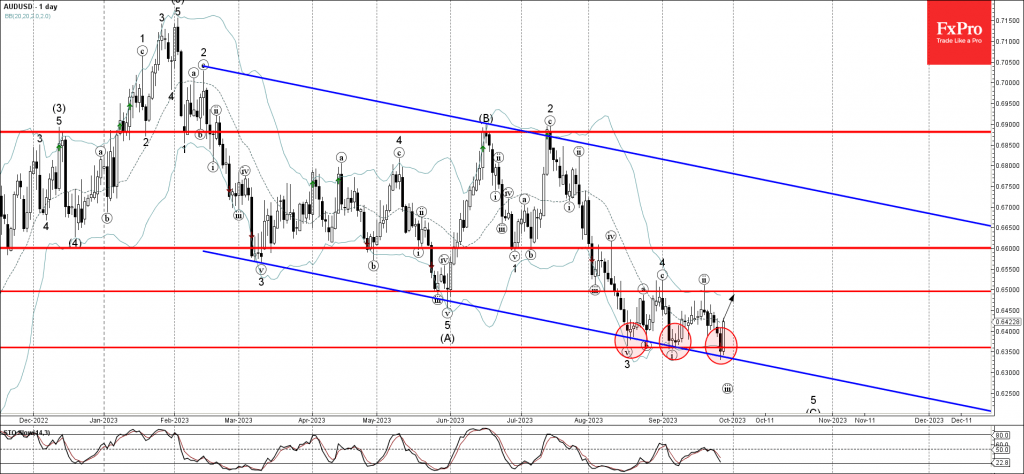
AUDUSD Wave Analysis
- AUDUSD reversed from support level 0.6350
- Likely to rise to resistance level 0.6500
AUDUSD currency pair recently reversed up from the key support level 0.6350 (which has been reversing the price from the middle of August) intersecting with the lower daily Bollinger Band and the support trendline of the wide down channel from February.
The upward reversal from the support level 0.6350 is likely to form the daily candlesticks reversal pattern Bullish Engulfing.
Given the bullish divergence on the daily Stochastic indicator, AUDUSD currency pair can be expected to rise further toward the next resistance level 0.6500 (which stopped the previous waves (a), 4 and (ii)).
CADCHF Wave Analysis
- CADCHF reversed from resistance level 0.6815
- Likely to fall to support level 0.6750
CADCHF currency pair recently reversed down from the strong resistance level 0.6815 (which previously reversed the price multiple times in June) standing near the upper daily Bollinger Band.
The downward reversal from the resistance level 0.6815 stopped the C-wave of the active ABC correction (2) from August.
Given the strongly overbought daily Stochastic and the strength of the resistance level 0.6815, CADCHF currency pair can be expected to fall further toward the next support level 0.6750.

EUR/CHF – Promising Inflation Data Ahead of Friday’s Eurozone HICP Release
- Eurozone inflation data making positive moves
- ECB unlikely to raise rates again in this tightening cycle
- EURCHF entered into key resistance zone
Inflation data from some eurozone member states was released on Thursday and there was some cause for optimism.
While the eurozone HICP release isn’t due until tomorrow, we do get some insight ahead of time from the individual country breakdowns and it’s Germany that’s offered a promising update this morning.
Headline inflation in North Rhine Westphalia fell to 4.2% this month from 5.8% in August, a huge move that will give the ECB confidence that its decision to all but declare an end to the tightening cycle a couple of weeks ago was correct.
The decline was expected due to the expiry of a transport subsidy last year which created more favourable base effects. But as we’ve seen so much over the last couple of years, until the figures drop, you can’t be too confident.
The Spanish release was less cause for celebration but the increase from 2.6% to 3.5% was in line with expectations so there was no nasty shock that could be a cause for concern among investors or at the central bank.
The euro has firmed against the dollar today but the greenback is down against a bunch of currencies following an astonishingly strong performance over the last couple of months.
Can we see a bullish breakout?
One of the currencies that the euro has performed well against recently is the Swiss franc, with the pair pulling off its lows to trade near the upper end of a descending channel.
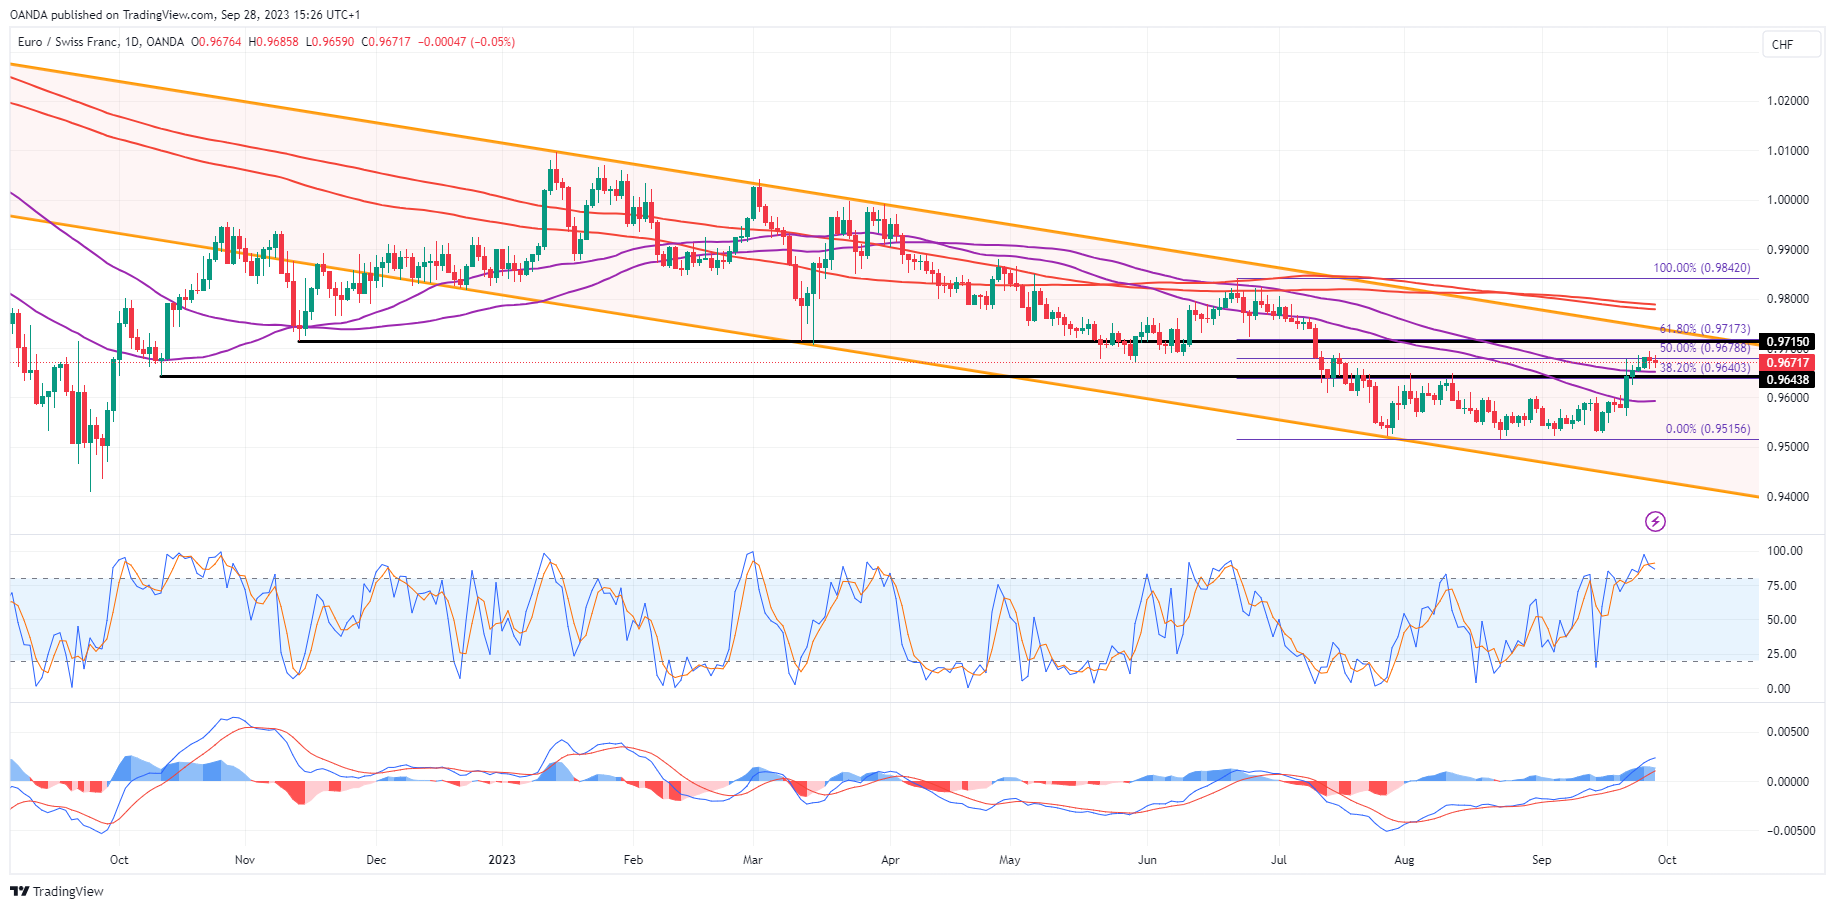
Source – OANDA on Trading View
What’s interesting here is that it’s now entered into a very interesting zone of potential resistance in which a combination of past support and resistance, and Fibonacci levels fall. The reason that’s important is the signal it would send if the price breaks above here, especially with the top of that descending channel then sitting slightly above again.
A break of that descending channel could be viewed as a very bullish shift after a prolonged downturn in the pair and so far, there doesn’t appear to be a lack of momentum. That could change of course and we could see the pair rotate lower once more and continue the slow decline, as has been the case for the rest of the year.