

Sample Category Title
Japanese Yen Gains Ground, Tokyo Core CPI Eases
- Tokyo Core CPI eases to 2.5%
- Japanese yen rises
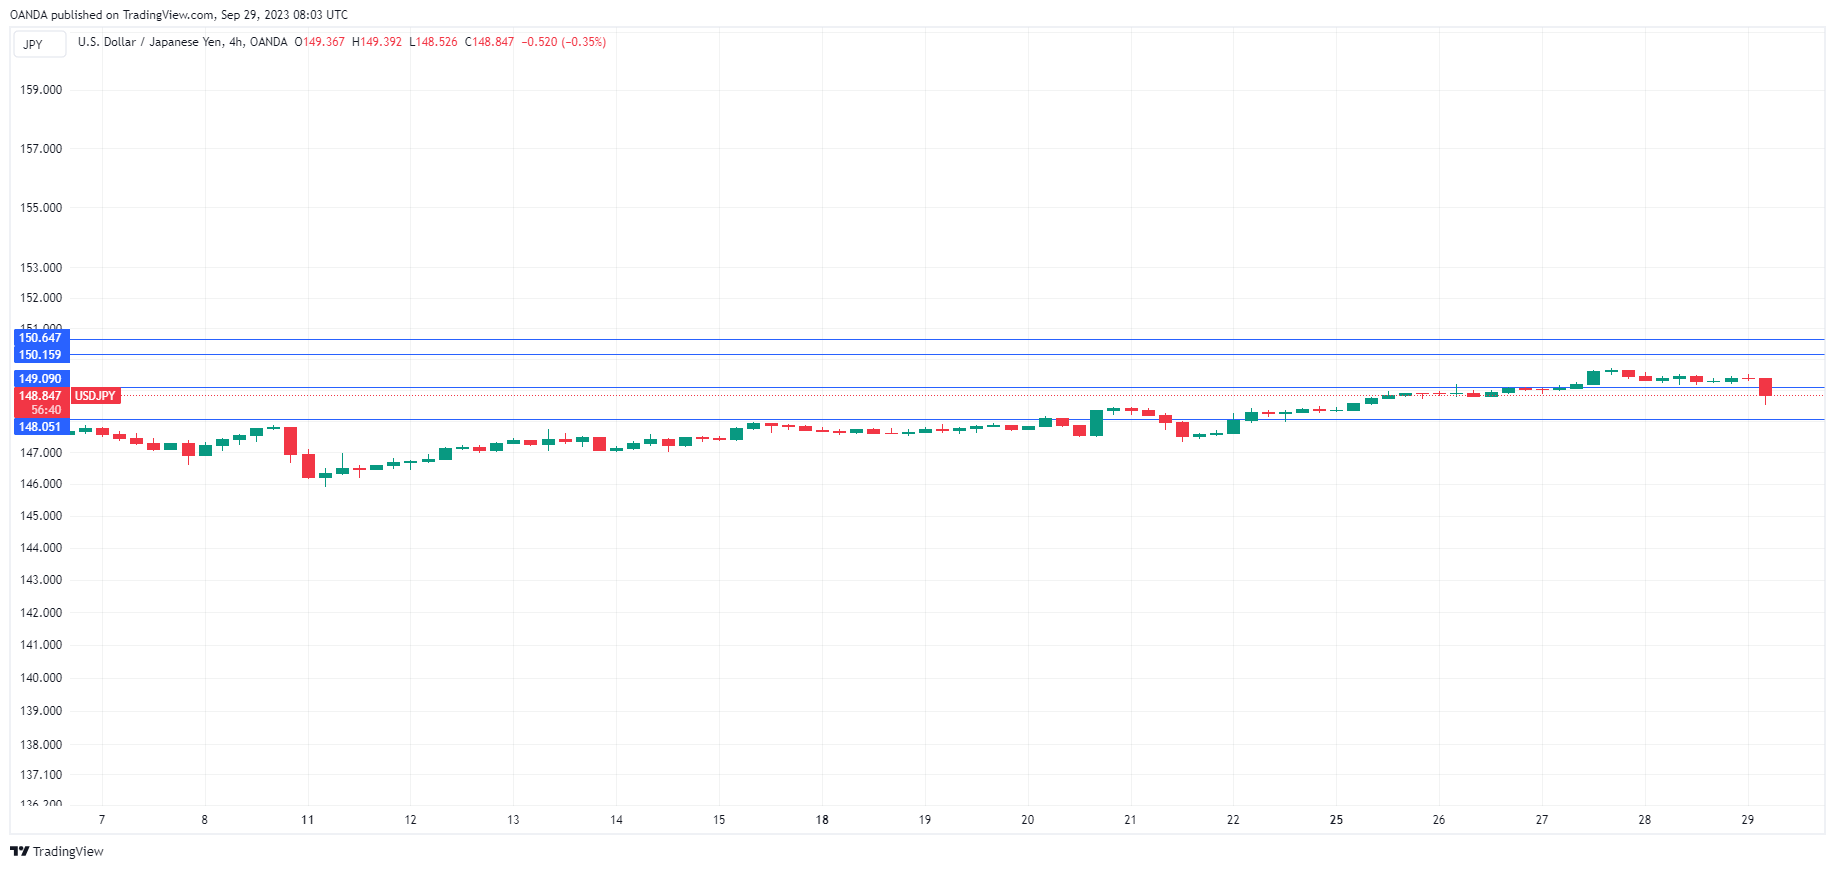
The Japanese yen is showing some life following a nasty slide earlier in the week, which saw it decline around 1.5% and come close to the symbolic 150 line. In the European session, USD/JPY is trading at 148.72, down 0.40%.
Tokyo Core CPI falls to 2.5%
Japan is experiencing higher inflation than it has known for decades, although it remains much lower than in other major economies. Tokyo Core CPI, which excludes fresh food, rose 2.5% y/y in September, down from 2.8% in August and a notch below market expectations of 2.6%. The “core core” rate, which excludes fresh food and energy, dropped from 2.6% to 2.4% y/y.
There are two observations one can make about Japanese inflation. One is that inflation has been slowing in recent months. The second is that inflation has been running above 2% for around a year and a half – in the case of Tokyo Core CPI, it has surpassed 2% for 16 straight months. That raises the question of whether Japan’s inflation is sustainable or transient. One could make a strong case for the latter, as inflationary pressures have persisted for a very long period.
The Bank of Japan has dismissed this argument, insisting that wage growth will have to climb before the BoJ acknowledges that inflation is sustainably around the 2% target. Until then, the BoJ will not shift its policy, or so it says. The markets have been burned by the BoJ more than once, and there has been constant speculation that the BoJ will phase out its massive stimulus sooner rather than later, despite the messages coming out of the central bank.
Another concern for market participants is the value of the yen, which has depreciated sharply in recent months. The yen has lost around 7% since early July, when it was trading around 139 to the dollar. This has raised concerns about currency intervention in order to prop up the yen, which occurred about a year ago. The yen’s slide has resulted in verbal intervention from Tokyo, and if the yen breaches the 150 level, traders should be on alert for a possible intervention.
USD/JPY Technical
- USD/JPY is testing support at 149.19. Below, there is support at 148.79
- There is resistance at 148.10 and 147.65
USDCAD Vulnerable to More Downside
- USDCAD gives up weekly gains; might be due to a pullback
- Potential support could next emerge near 1.3400
- US core PCE inflation index on the agenda
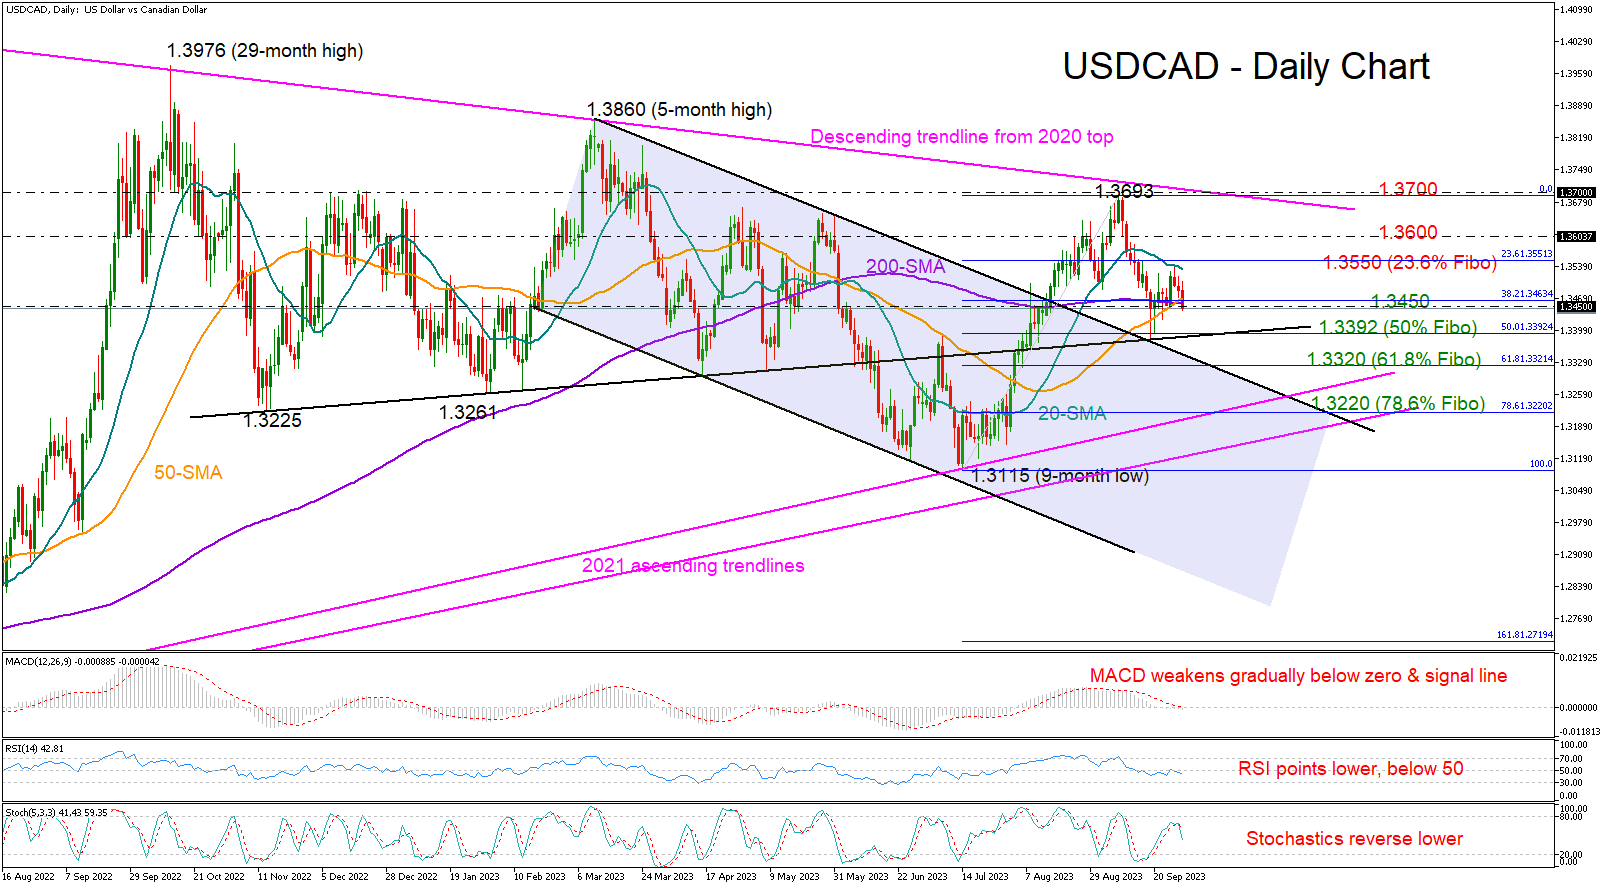
USDCAD erased Tuesday’s bounce as the 20-day simple moving average (SMA) obstructed progress, forcing the price to ease towards its 50- and 200-day SMAs at 1.3450. This is also where the 38.2% Fibonacci mark of the previous upleg is placed.
Market sentiment is neutral-to-bearish according to the technical indicators. The MACD is marginally below its zero and signal lines, while the RSI has resumed its negative slope below 50, but is still above its previous lows. Likewise, the stochastic oscillator has also rotated southwards.
If sellers persist, the nearest pivot point could develop around the 50% Fibonacci of 1.3392 and the important almost flat constraining line drawn from November 2022. Additional declines from there could encounter the upper band of the broken bearish channel as well as the 61.8% Fibonacci mark of 1.3320. A clear close lower could confirm another correction towards the 2021 ascending trendline currently intersecting the 78.6% Fibonacci of 1.3220.
On the upside, the focus will be on the 20-day SMA and the 23.6% Fibonacci level of 1.3550. A successful penetration higher could initially stabilize near the 1.3600 psychological number before accelerating towards September’s high of 1.3693 and the long-term descending trendline from the 2020 top at 1.3700.
In summary, USDCAD is displaying signs of softening, bringing the 1.3400 area next on the limelight.
GBPJPY Consolidates After Pullback Pauses
- GBPJPY slid below 50-day SMA last week after BoE’s unexpected decision to hold rates steady
- Found its feet at the lower end of the Ichimoku cloud and has been directionless since then
- Are the bulls ready to re-take charge?
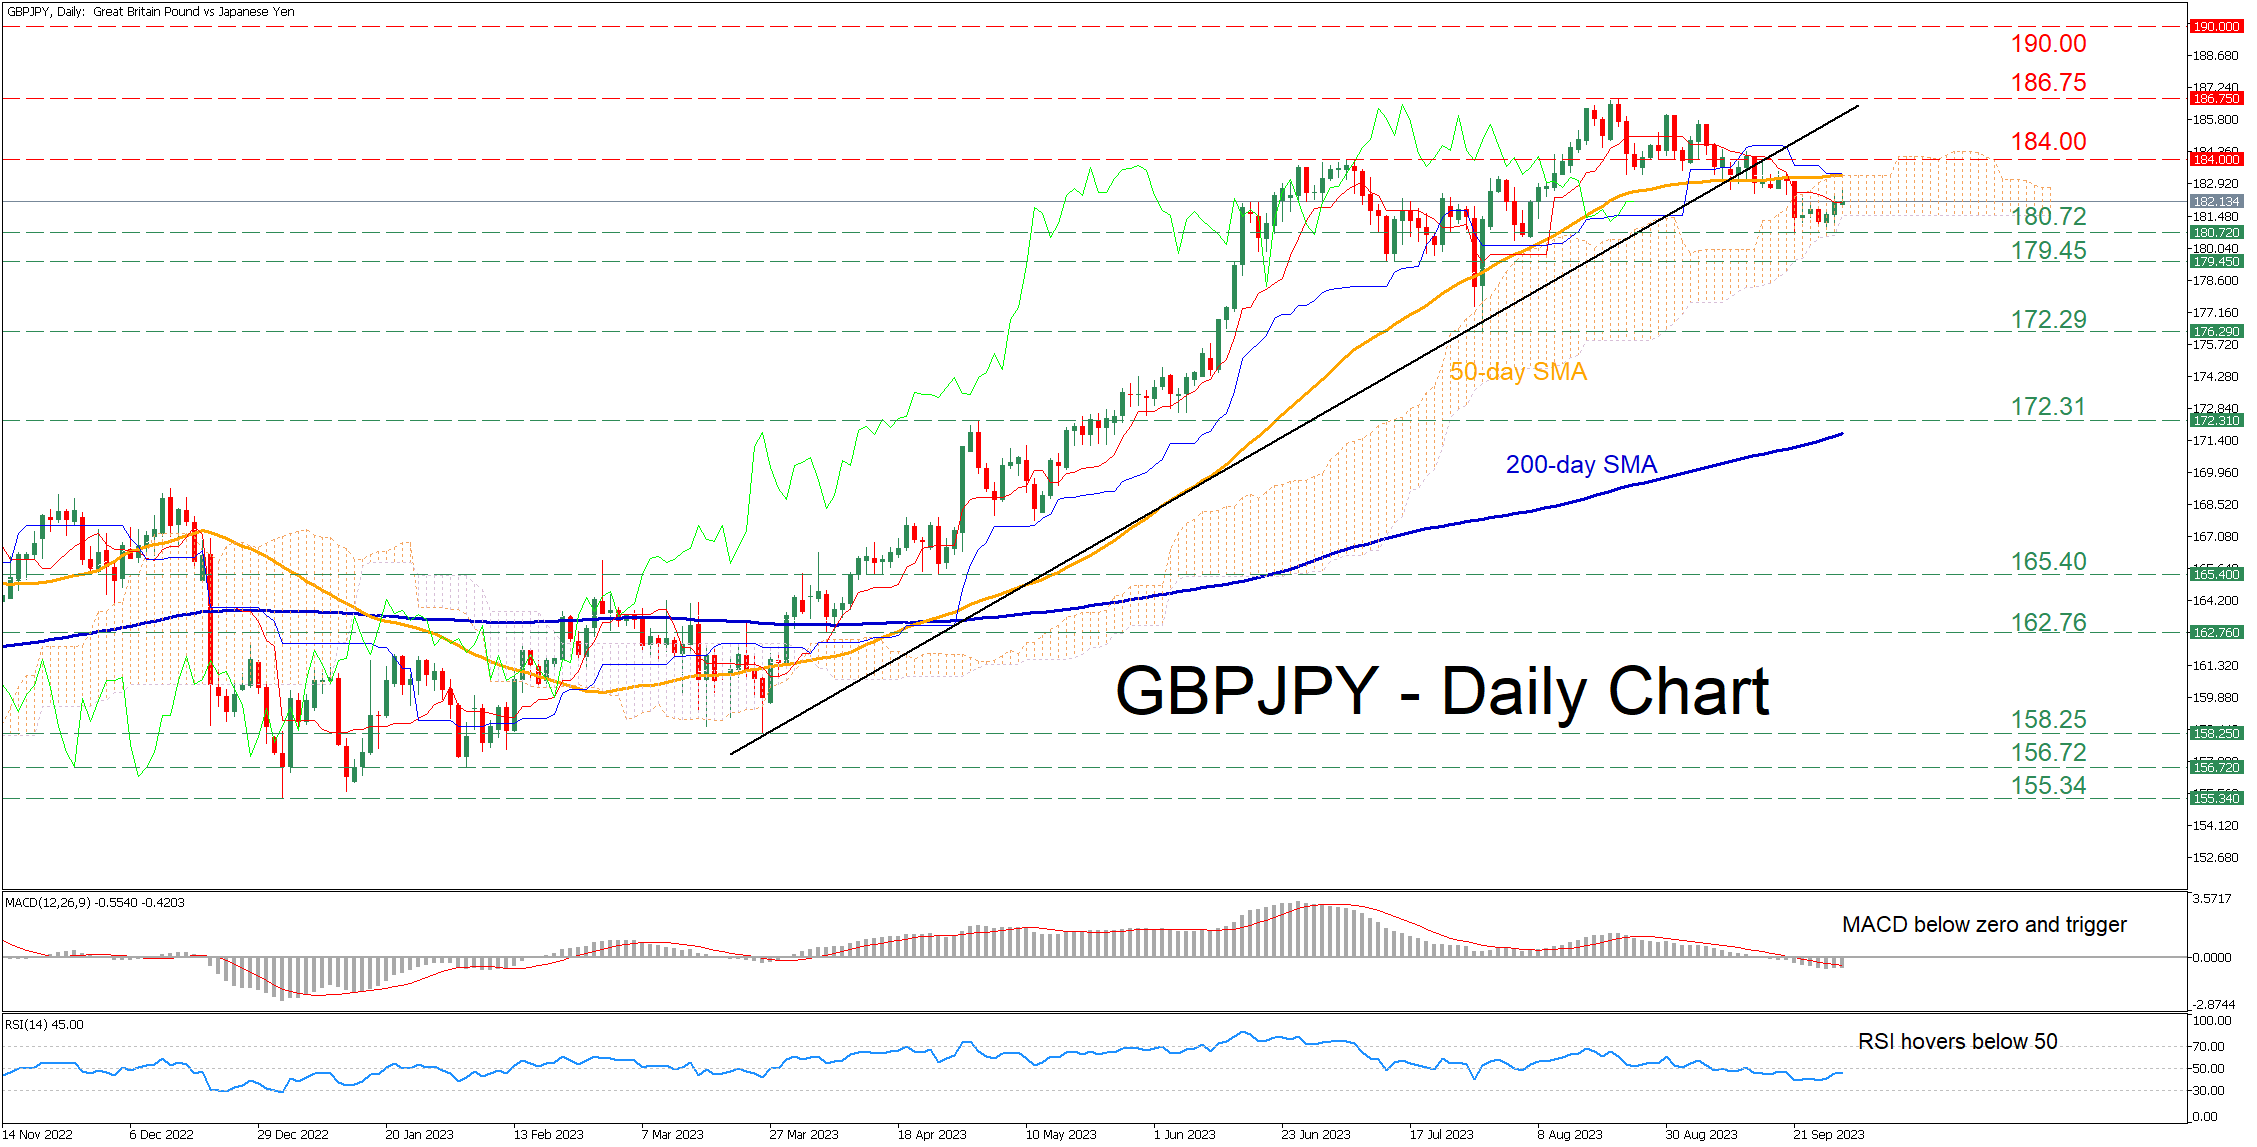
GBPJPY had been stuck in a prolonged uptrend since January, posting an eight-year high of 186.75 on August 22. However, the pair has been experiencing a downside correction in the past month which has stalled for now as the short-term oscillators currently suggest that bullish pressures are slowly re-emerging.
Should the price march higher and reclaim its 50-day simple moving average (SMA), immediate resistance could be met at the July peak of 184.00. Piercing through that wall, the pair could revisit its eight-year high of 186.75. If that hurdle also fails, the price could ascend to fresh multi-year highs, where the 190.00 psychological mark might curb further advances.
On the flipside, if selling interest persists, the bears could attack the recent support of 180.72. Even lower, the July barrier of 179.45 could provide additional downside protection. Breaking below that level, the price might face the July bottom of 172.29.
In brief, GBPJPY has been undergoing a strong pullback, which appears to be fading. Nevertheless, the bulls should not get excited until the price conquers the 50-day SMA.
Swiss KOF dips to 95.9, cooling economy for end of the year
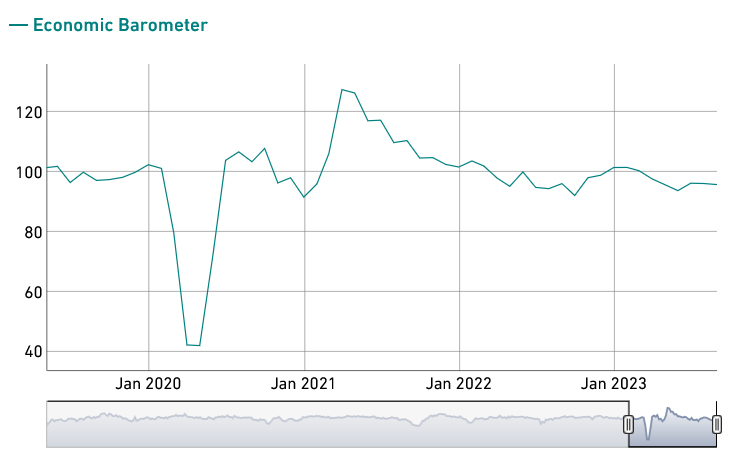
Swiss KOF Economic Barometer registered a drop in September, moving from 96.2 to 95.9. Although this decline was milder than the anticipated fall to 90.5, the barometer still positions below its historical average. This suggests a deceleration in the Swiss economy as 2023 comes to a close.
KOF said: "The slight decline is primarily attributable to bundles of indicators from the manufacturing and other services sectors. Indicators from the finance and insurance sector and the construction industry are sending positive signals."
DXY Dropped to 106.224 But Without Compromising Upward Sloping Trend Channel
Markets
Another abrupt and sharp sell-off in core bonds initially hurled yields in the US almost 10 bps higher yesterday. The long end underperformed. This happened despite economic data, excluding weekly jobless claims, coming in on the weak side of expectations. Things shifted when US traders were fully warmed up. They couldn’t resist and swooped in on the battered Treasuries. Bonds in the end closed the day higher with net daily yield changes ranging between -1.5 bps (30-y) and -7.8 bps (2-y). German Bunds underperformed Treasuries with yields rallying well into the double digits. Here too data would have suggested otherwise. German HICP rose slightly less than expected by 0.2% m/m to 4.3% y/y. Missing out partially on the UST comeback, German rates still finished 4.2 bps (2-y) to 8.7 bps (10-y) higher. The 10-y yield hit a new cycle high north of 2.9% and the European 10-y swap rate (+8.2 bps) took out the previous cycle high of 3.41%. European peripheral spreads were on the rise with Italy hitting 200 bps before calm returned. Equity markets posted decent gains (EuroStoxx50 +0.72%, US indices between +0.35-0.83%). They weren’t even that bothered with the initial yield surge to begin with. The dollar fell in what looks like a profit-taking move after a sharp rally. EUR/USD rebounded from important support between 1.0484 and 1.0516 to end at 1.0566. USD/JPY eased marginally to 149.31. DXY dropped to 106.224 but without compromising the upward sloping trend channel. Sterling saw a chance to lock in some gains as the risk environment turned less hostile and gilts underperformed but had to forfeit on all of them. EUR/GBP closed slightly higher at 0.8658 after hitting an intraday low of 0.863. The likes of oil turned in about half of the sharp gains a day earlier. Brent finished at $95.38/b.
Core bonds enter much calmer waters currently and the dollar eases further. Asian markets look for a positive close of the week and quarter, Japan being the exception. China is closed and will remain so next week (Golden Week holidays). Today’s economic calendar is centered around European inflation (seen at 0.5% m/m and 4.5% y/y) and an (outdated) US PCE deflator. Yesterday’s (exhaustion) moves, however, strongly hint at a short-term correction lower in core bond yields, regardless of the outcome. In the same logic we expect the USD to stay in the defensive today. EUR/USD may move further north of 1.0484/0516 support but has some way to go before meeting a first meaningful resistance (1.0674, 23.6% recovery on the Q3 decline).
News and views
The Banco de Mexico unanimously decided to leave its policy rate unchanged at 11.25%. Headline and core inflation eased further at 4.44% and 5.78% respectively in early September. Since the previous monetary policy decision, (medium and long-term) government bond yields increased. The Mexican peso exhibited volatility and depreciated. Economic activity shows resilience and the labor market remains strong. The bank assesses that the effects of the shocks continue to affect inflation, especially in services, in an environment where economic activity is more resilient than previously anticipated. In this context, forecasts for headline and core inflation have been revised upwards for the entire horizon. Inflation now is only expected to converge to the 3.0% target in the second quarter of 2025. In the previous forecast both measures were seen at 3.1% in Q4 of 2024. The bank concludes that it will be necessary to maintain the reference rate at its current level for an extended period. This suggests that a first rate cut might only come in 2024. The peso yesterday intraday rebounded from USD/MXN 17.72 to close at 17.54. This was mainly due to an overall USD correction, but the CB decision added to the momentum.
Inflation in Tokyo eased slightly further in September. The measure excluding fresh food declined from 2.8% to 2.5%. The core measure excluding fresh food and energy also eased from 4.0% to 3.8%, but remains elevated. Headline inflation is also mitigated by government measures to cap the impact from higher utility prices. Even so, the modest decline in inflation buys the BOJ time to assess further tweaks in its monetary policy. Other data published today indicated modest production activity (0.0% M/M, but better than expected) and growing retail spending (0.1% M/M and 7.0% Y/Y). Despite slowing inflation, Japanese long term yields continue to set new cycle top levels. (10-y 0.77%). The yen remains in the defensive with USD/JPY holding above 149.
EUR/USD Daily Outlook
Daily Pivots: (S1) 1.0512; (P) 1.0545; (R1) 1.0600; More...
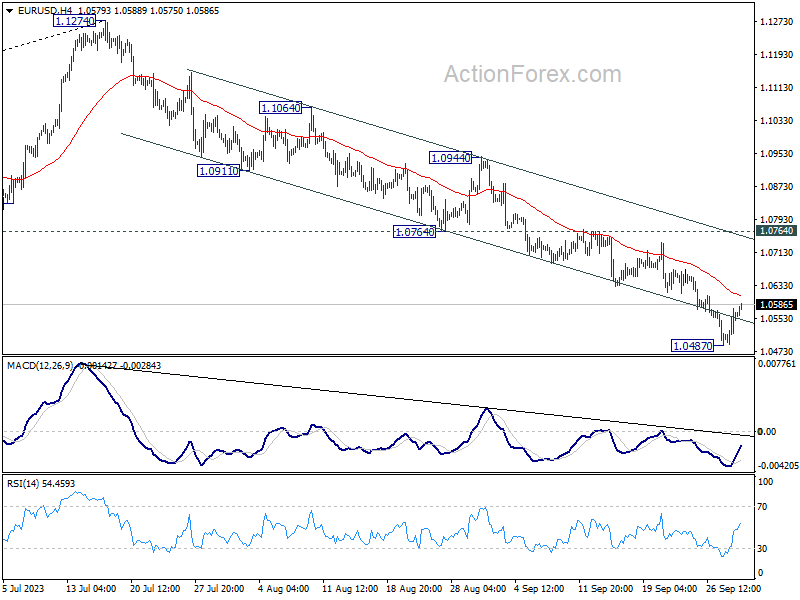
Intraday bias in EUR/USD remains neutral as consolidation from 1.0487 is extending. Stronger recovery cannot be ruled out. But risk will stay on the downside as long as 1.0764 support turned resistance holds. Break of 1.0487 will resume the fall from 1.1274 to 1.0199 fibonacci level.
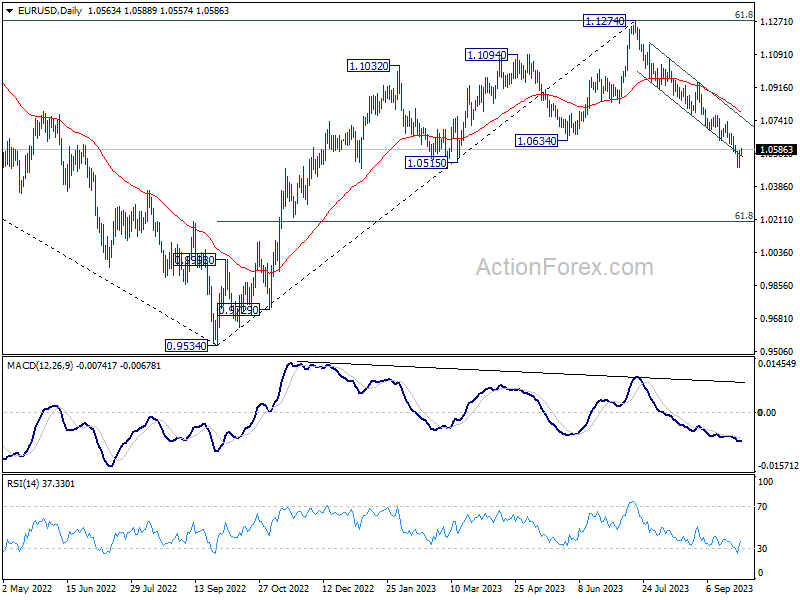
In the bigger picture, fall from 1.1274 medium term top could still be a correction to rise from 0.9534 (2022 low). But chance of a complete trend reversal is rising. In either case, firm break of 1.0515 support will target 61.8% retracement of 0.9534 to 1.1274 at 1.0199. For now, risk will stay on the downside as long as 55 D EMA (now at 1.0786) holds, in case of rebound.
GBP/USD Daily Outlook
Daily Pivots: (S1) 1.2141; (P) 1.2183; (R1) 1.2246; More...
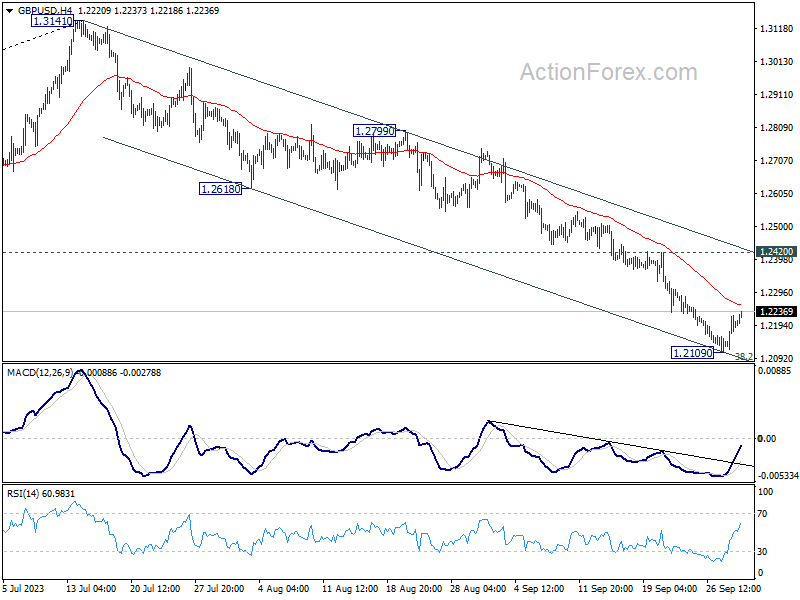
Intraday bias in GBP/USD remains neutral as consolidation from 1.2109 is extending. Stronger recovery cannot be ruled out. But near term risk will stay on the downside as long as 1.2420 turned resistance holds,. On the downside, decisive break of 1.2075 fibonacci level would carry larger bearish implication and target 1.1801 support next.
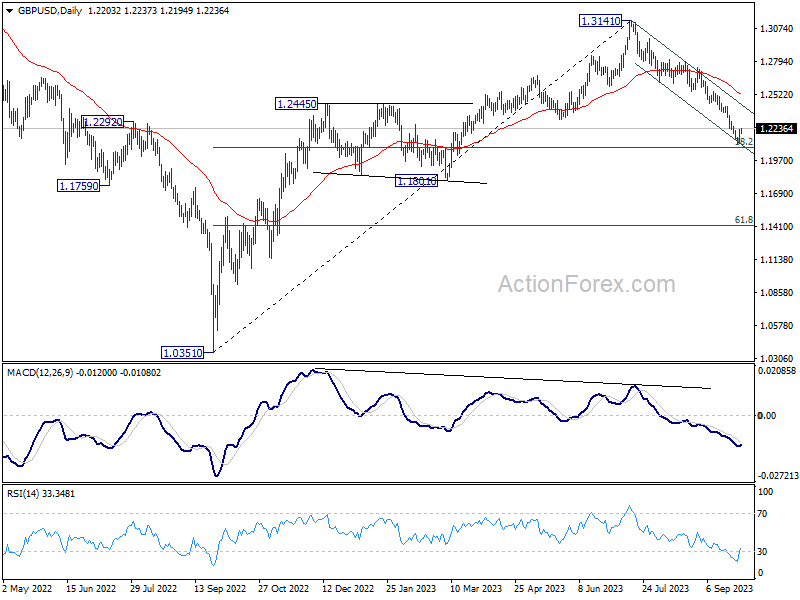
In the bigger picture, fall from 1.3141 medium term top could still be a correction to up trend from 1.0351 (2022 low) only. But risk of complete trend reversal is rising. Sustained break of 38.2% retracement of 1.0351 to 1.3141 at 1.2075 will pave the way to 61.8% retracement at 1.1417. For now, risk will stay on the downside as long as 55 D EMA (now at 1.2526) holds, in case of rebound.
USD/CHF Daily Outlook
Daily Pivots: (S1) 0.9125; (P) 0.9171; (R1) 0.9195; More....
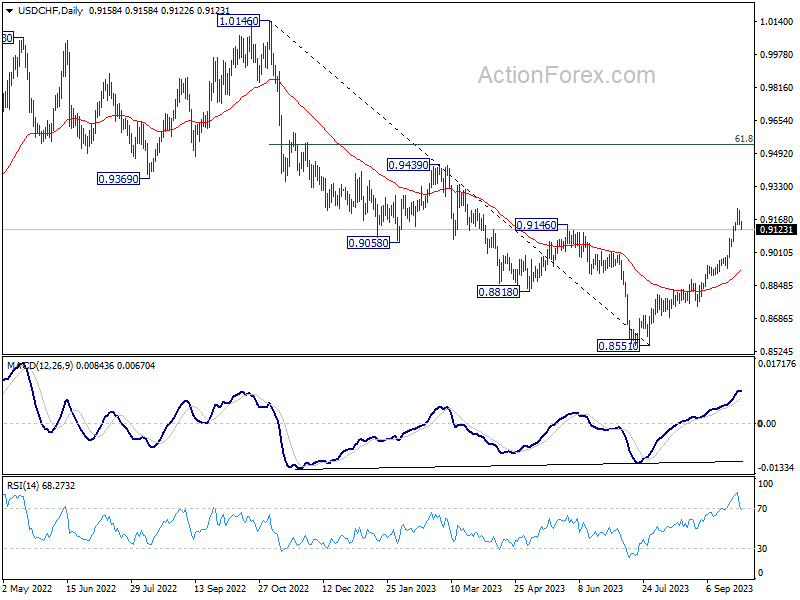
Intraday bias in USD/CHF remains neutral for the moment. Some consolidations would be seen and deeper retreat cannot be ruled out. But risk will stay on the upside as long as 0.9019 support holds. Break of 0.9224 will resume the rally from 0.8551 to 0.9439 resistance next.
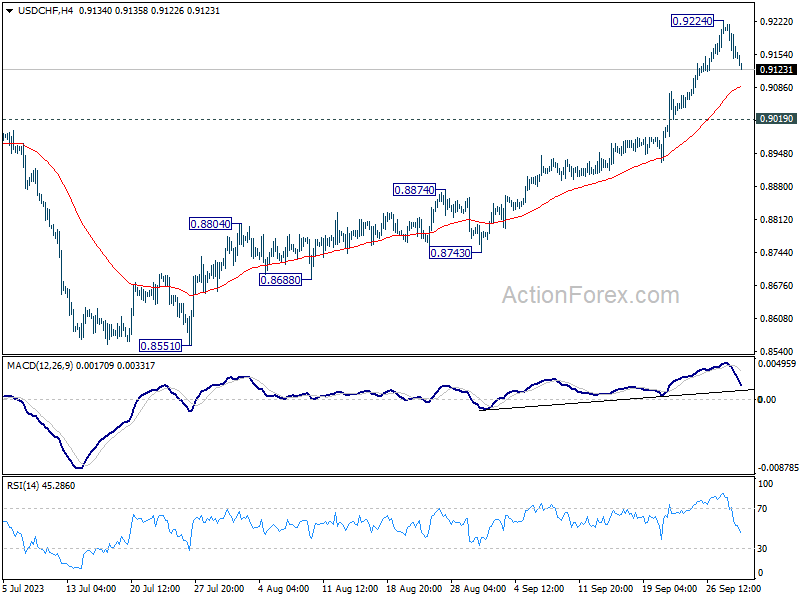
In the bigger picture, current development indicates that rise from 0.8551 is reversing whole down trend from 1.0146. Further rally would then be seen to 61.8% retracement at 0.9537 and above. For now, this will be the favored case as long as 55 D EMA (now at 0.8917) holds, even in case of deep pullback.
USD/JPY Daily Outlook
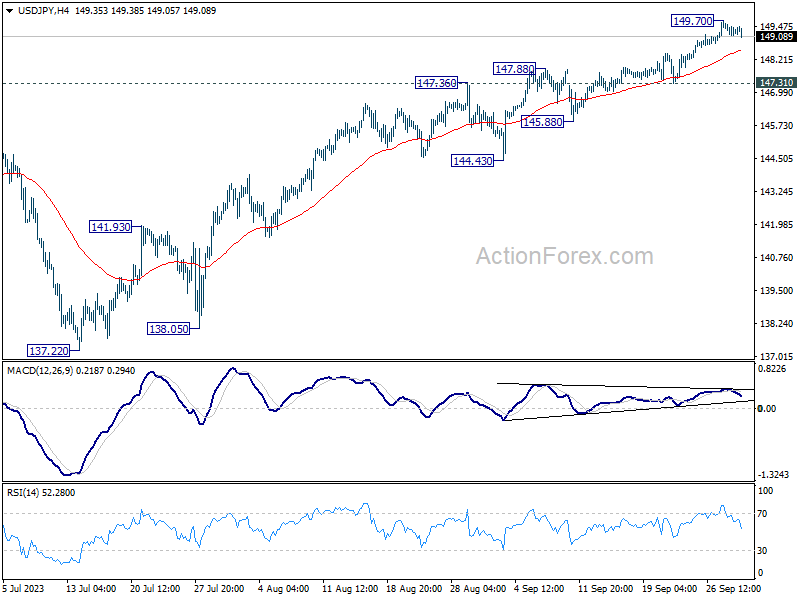
Daily Pivots: (S1) 149.07; (P) 149.38; (R1) 149.62; More...
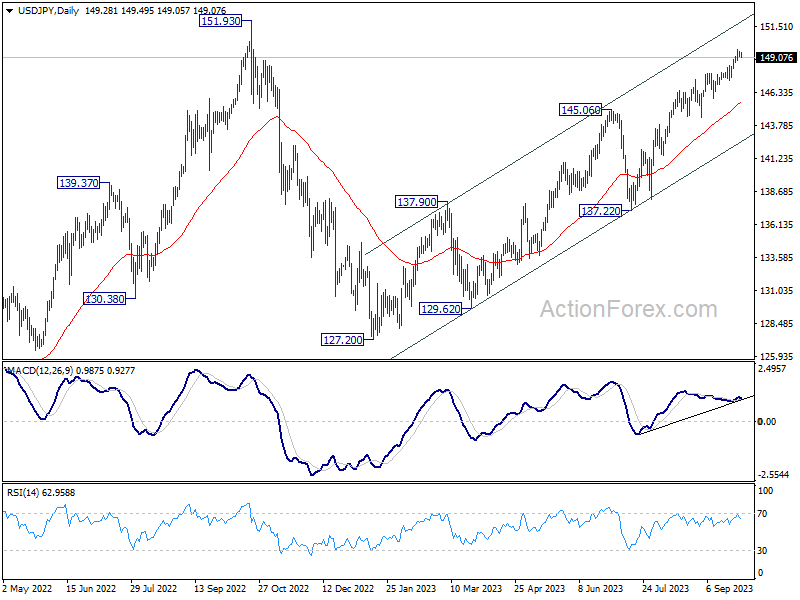
Intraday bias in USD/JPY remains neutral for the moment. Consolidation from 149.70 could extend further and deeper retreat cannot be ruled out. But near term outlook will stay bullish as long as 145.88 support holds. Above 149.70 will resume larger rise from 127.20 to retest 151.93 high.
In the bigger picture, while rise from 127.20 is strong, it could still be seen as the second leg of the corrective pattern from 151.93 (2022 high). Rejection by 151.93, followed by break of 145.06 resistance turned support will be the first sign that the third leg of the pattern has started. However, sustained break of 151.93 will confirm resumption of long term up trend.
Nasdaq 100 Technical: Potential Counter Trend Rebound as 10-Year UST Yield Retreated
- The 10-week decline of the Nasdaq 100 has almost reached a key medium-term support of 14,300.
- The rising 10-year US Treasury yield is a significant factor that led to the recent decline of the Nasdaq 100.
- A daily bearish “Shooting Star” candlestick sighted yesterday on the 10-year US Treasury yield may trigger a counter trend rebound in the Nasdaq 100.
The price actions of the US Nas 100 Index (a proxy for the Nasdaq 100 futures) have indeed shaped the expected decline and broke below the short-term support of 14,750. Thereafter, it continued to tumble and printed an intraday low of 14,445 on Wednesday, 29 September.
The Index has now recorded a September month-to-date decline of -4.92% at this time of the writing which is on track for the worst monthly performance since December 2022.
In the lens of technical analysis, price actions do not move in a vertical direction as there tend to be several episodes of counter trend/mean reversion oscillations that go against a longer-term trending phase due to potential profit-taking activities, and reassessment of the current situation by market participants as key time periods approach such as month-end and quarterly-end closings (today is month-end as well as third quarter-end).
10-year US Treasury yield has shaped a daily bearish reversal candlestick
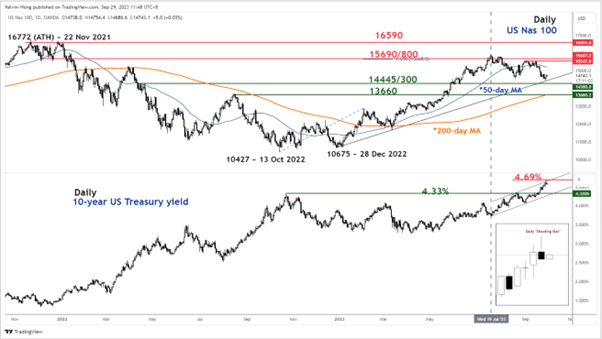
Fig 1: US Nas 100 medium-term trend with 10-year UST yield as of 29 Sep 2023 (Source: TradingView, click to enlarge chart)
Since 19 July 2023, the decline seen in the US Nas 100 Index has moved in an indirect lock-step movement with the longer-term 10-year US Treasury yield where the yield rallied to a 16-year high to print an intraday high of 4.69% yesterday, 28 September.
In a nutshell, in the past ten weeks, the rising 10-year US Treasury yield representing higher long-term borrowing costs is a significant factor contributing to the decline seen in the US Nas 100 Index as it falls under the “long-duration” risk asset classification; the present values of the longer-term revenue flows of the technology and meg-cap stocks of the Nasdaq 100 (Apple, Amazon, Alphabet, Meta, Microsoft, Tesla & Nvidia) are vulnerable to a higher interest rate environment.
Interestingly, the 10-year US Treasury yield formed a daily bearish reversal “Shooting Star” candlestick pattern yesterday right at the upper boundary of its medium-term ascending channel which suggests a potential corrective pull-back or retreat in the Treasury yield within its medium-term and major uptrend phases.
The formation of the daily bearish reversal “Shooting Star” seen in the 10-year US Treasury yield coincided with the price actions of the US Nas 100 hitting the medium-term support zone of 14,445/14,300 (also the ascending trendline from 28 December 2023 low).
Therefore, a potential impending pull-back in the 10-year US Treasury yield may lead to at least a short-term counter trend rebound in the US Nas 100 Index based on their recent significant indirect correlation.
Short-term momentum bullish breakout
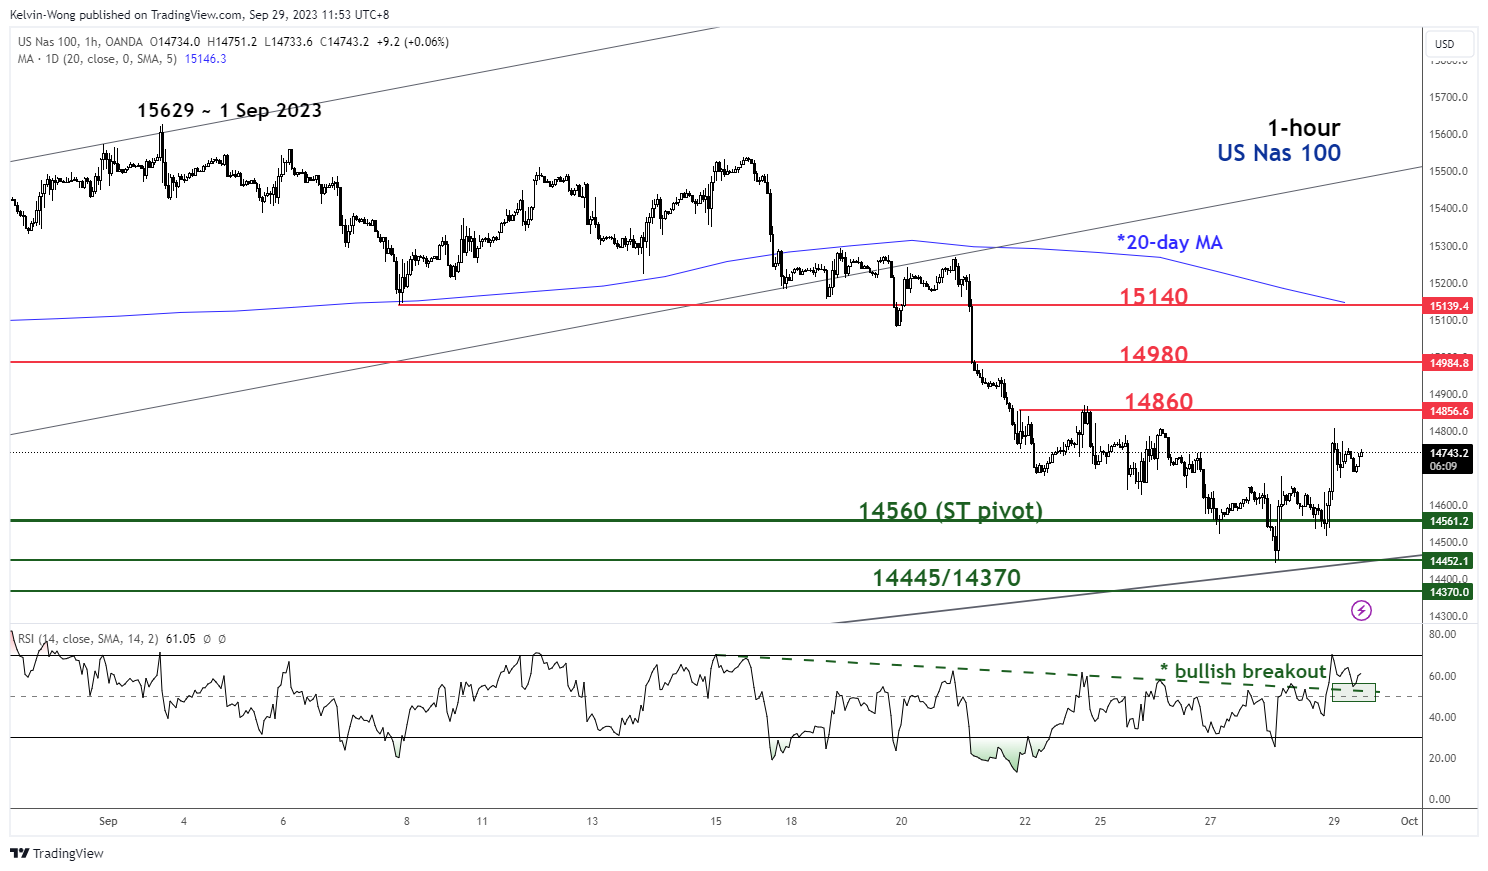
Fig 2: US Nas 100 minor short-term trend as of 29Sep 2023 (Source: TradingView, click to enlarge chart)
As seen on the shorter-term 1-hour chart, the hourly RSI of the US Nas 100 Index has staged a bullish breakout above the 50 level which suggests the recent downside momentum of the minor downtrend in place since the 15 September 2023 high has dissipated.
These observations also support a potential counter trend rebound scenario. Watch the 14,560 key short-term pivotal support with the next immediate resistances coming in at 14,860 and 14,980 (38.2% & 50% Fibonacci retracement of the recent minor downtrend from 15 September 2023 high to 28 September 2023 low).
However, a break below 14,560 invalidates the bullish tone for a slide to test the 14,445/14,370 key medium-term support zone.