

Sample Category Title
Gold: Spooked by the Death Cross, maybe heading to $1800
The price of a troy ounce of gold fell 1.4% on Wednesday to $1875, its most significant drop since early June, building this week’s loss to 2.7%. Gold has not been so cheap in Dollars since the first half of March when the problems of US regional banks triggered a surge in interest in the metal. That situation put pressure on the dollar, but the picture has changed dramatically.
US government bonds are experiencing a solid capital inflow from domestic investors, for whom the current yield levels look very attractive. Against this backdrop, the gold bulls are capitulating.
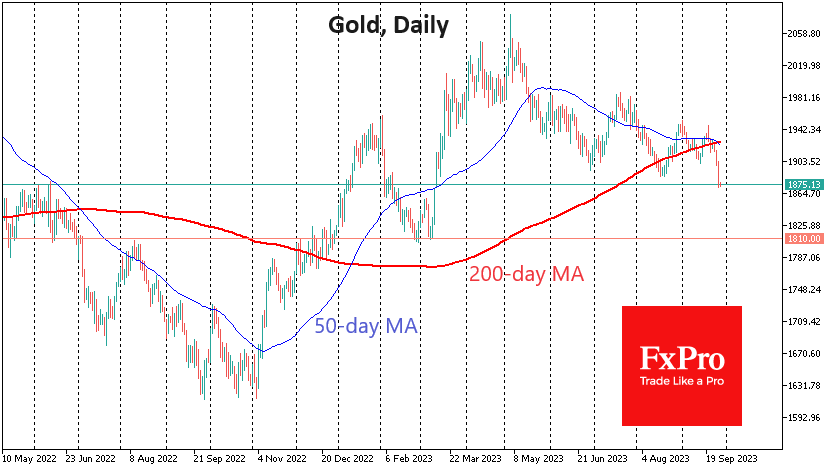
Technical factors partly support the sell-off. Gold formed a “death cross” yesterday when the 50-day moving average crossed below the 200-day moving average—however, the fast MA has acted as stiff resistance since last Monday.
While Wednesday’s move in gold was impressive, history suggests that this is unlikely to be the final leg of the decline. The case of the previous death cross in July 2022 is very similar to the current one. And back then, the price was down 7%. Even earlier, in February 2021, the sell-off stopped after only a 9% drop; in August of the same year, it was down almost 7%.
In all these cases, gold pulled back to a previous significant support area before we saw a corrective pullback. The following considerable pivot area in the current situation was $1805-1810.
Mirroring how quickly gold gained $100 from $1810 in March, we could now see an equally quick landing.
But this is where longer-term forces could come into play. The 200-week moving average runs through here. Approaching or briefly dipping below it has attracted big buyers over the past six years.
However, it is essential to note that the $1800 area may become where only some bearish gold positions are fixed. It will be necessary to monitor financial market sentiment very closely. With equity indices continuing to fall and long-term yields rising, a further price fall is quite realistic.
AUDUSD Still Waits for Support After New Lows
- AUDUSD extends downtrend
- Short-term outlook is gloomy, but recovery attempts still likely
- Eyes on 0.6300 ahead of RBA meeting
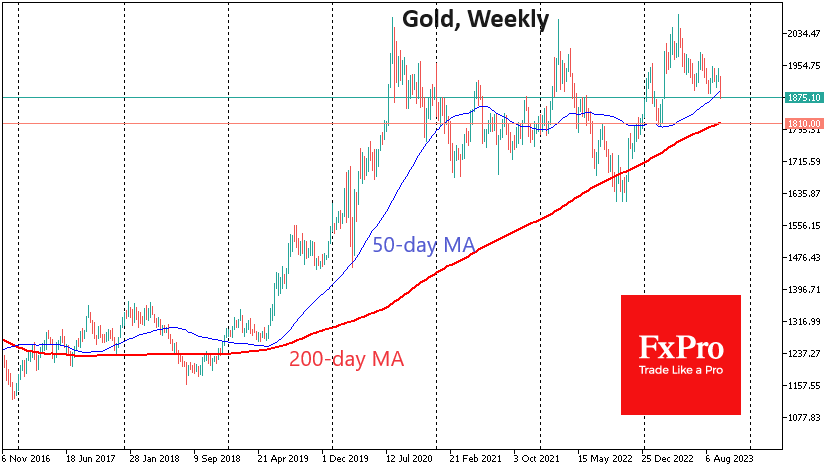
AUDUSD plunged to a new 10-month low of 0.6330 on Wednesday, putting the downtrend from July back into play ahead of RBA’s policy decision on Tuesday.
The clear bearish breakout below the 2020 support trendline has further worsened the short-term outlook. Despite that, the price hasn't deviated significantly below its September-August lows, and it's still hovering around the lower Bollinger band. This leaves a ray of hope that an upside correction could still happen. Note that the RSI is pushing for a rebound near its recent lows, while the stochastic oscillator is entering the oversold region.
If downside forces resurface, the focus will immediately fall on the strong support line from last December at 0.6300. An extension lower, and more importantly, a close beneath the 0.6280 base from November 3 could press the price towards the 0.6200 round level. Then, the bears could head for the 0.6120-0.6100 former constraining zone if the 2022 trough of 0.6169 gives way.
On the upside, traders will look for a rebound above the 0.6415-0.6450 zone, which encapsulates the 20-day exponential moving average (EMA) and the broken 2020 support trendline. Should July's descending trendline and the 50-day EMA prove easy to overcome, the recovery might stretch up to the 0.6520 resistance. Even higher, the caution area around 0.6570 and the 200-day EMA could be the next challenge.
In brief, the short-term risk for AUDUSD remains skewed to the downside, but the bulls might put up another fight as key support levels are nearby. Otherwise, selling interest is expected to intensify below 0.6280-0.6300.
Dollar Index: Partial Profit-Taking Seen as Positioning for Fresh Advance
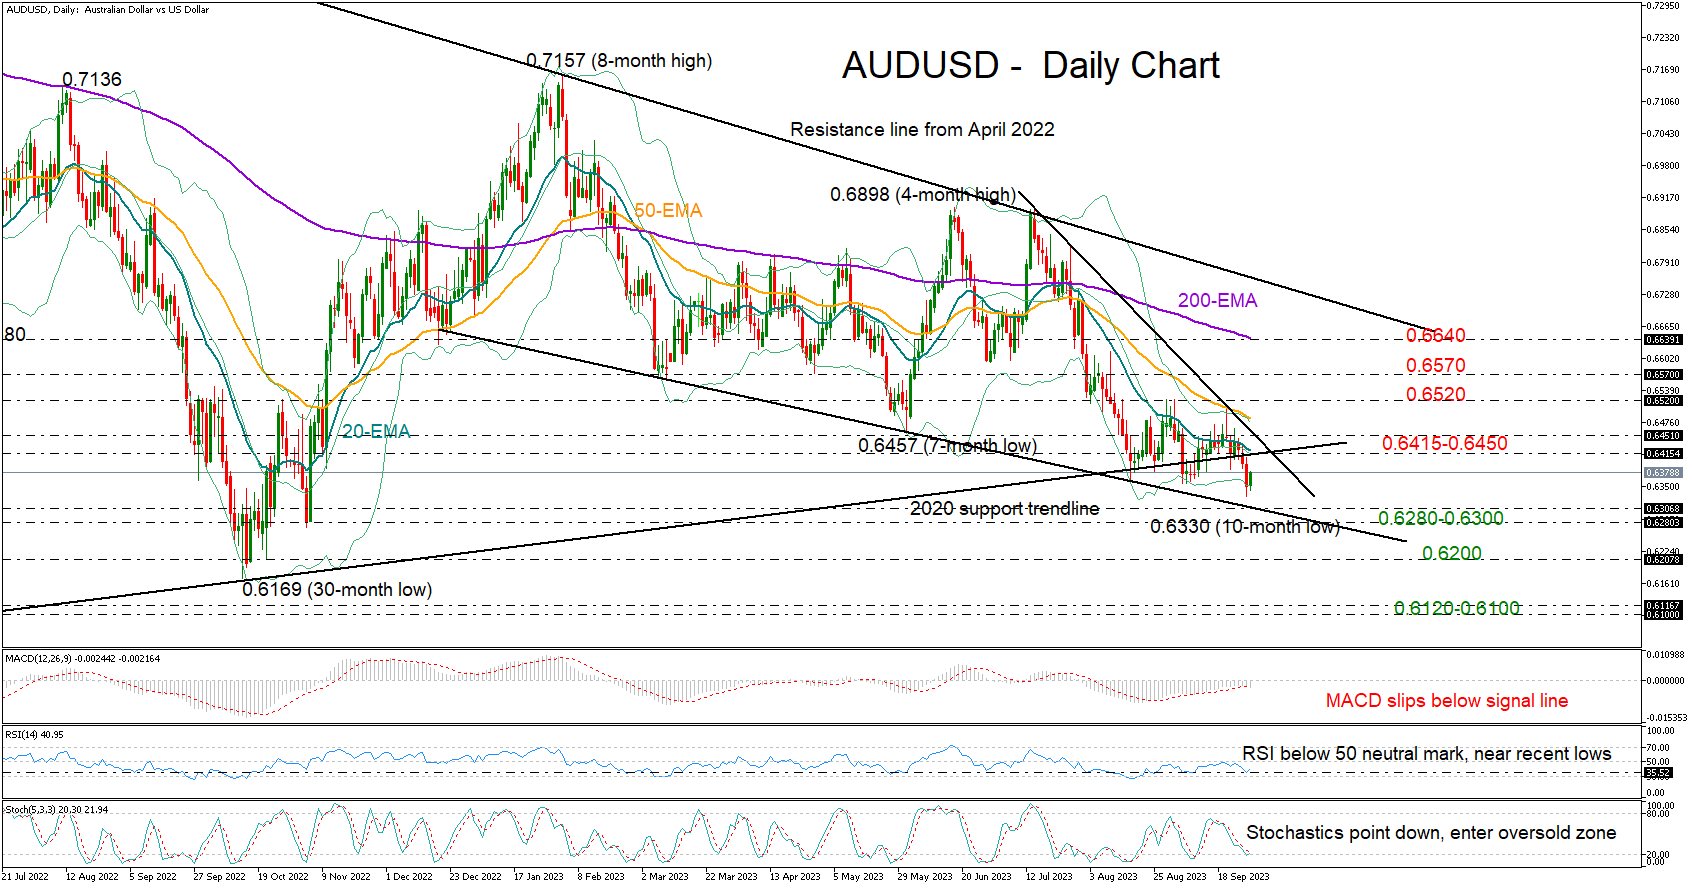
The dollar index eases from new 2023 high (106.52) on Thursday, as bulls faced headwinds from overbought condition on daily chart and top of thickening weekly Ichimoku cloud (106.61).
The greenback remains well supported by better than expected conditions of the US economy and signals that the Fed would likely hike again and keep high interest rates for longer period, which sets scope for further advance.
Pullback on partial profit-taking was so far seen as positioning for fresh push higher as the index is in uninterrupted uptrend for the eleventh straight week and is about to register the second consecutive monthly gain, with the notion being supported by formation of reversal pattern after a bear trap on monthly chart.
Daily studies, on the other hand, show space for corrective dip, which should be ideally contained by bull-trendline drawn off 99.20 (July 18 low) currently at 105.38, reinforced by rising 10DMA and weekly cloud base.
Break through weekly cloud top and nearby 50% retracement of 114.72/99.20 (106.96) to generate fresh bullish signal for extension of larger uptrend and expose target at 108.79 (Fibo 61.8%).
Res: 106.61; 106.96; 107.88; 108.79.
Sup: 105.85; 105.38; 105.13; 105.00.
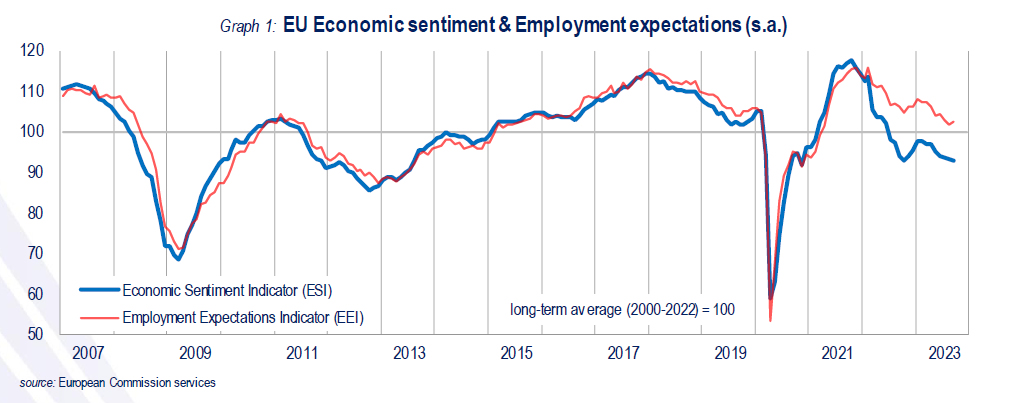
Eurozone economic sentiment fell to 93.3, EU down to 92.8
Eurozone Economic Sentiment Indicator dropped slightly from 93.6 to 93.3 in September, down for the fifth month. Employment Expectation indicator rose from 102.2 to 102.7. Economic Uncertainty Indicator rose from 19.8 to 21.5.
Eurozone industry confidence rose from -9.9 to -9.0. Services confidence dropped from 4.3 to 4.0. Consumer confidence fell from -16.0 to -17.8. Retail trade confidence dropped from -5.1 to -5.7. Construction confidence fell from -5.4 to -6.2.
EU Economic Sentiment Indicator rose from 93.2 to 92.8. Amongst the largest EU economies, the ESI deteriorated in Spain (-3.2) and Italy (-2.2), while it improved in France (+2.7). Sentiment in Germany (+0.3), the Netherlands (+0.3) and Poland (-0.1) remained virtually stable.
Australian Dollar Steadies, Retail Sales Dip
- Australia’s retail sales decelerate to 0.2%
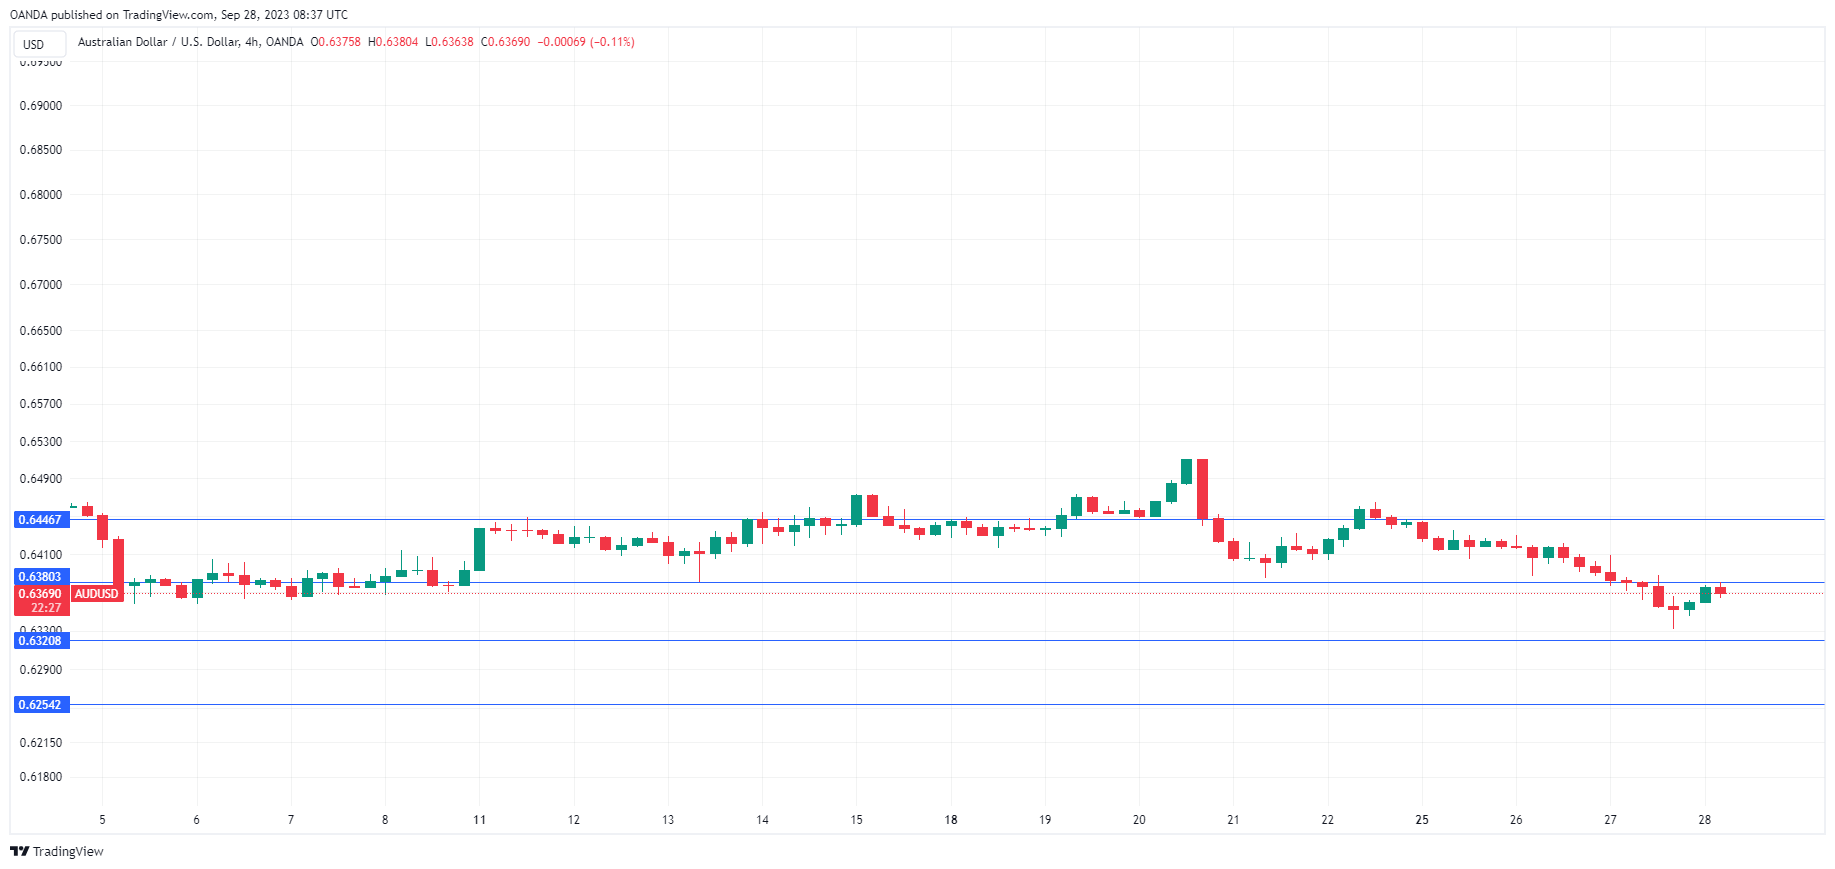
The Australian dollar is in positive territory on Thursday after three straight daily losses in which AUD/USD lost over 1% and hit an 11-month low. In the European session, AUD/USD is trading at 0.6367, up 0.23%.
Australia retail sales rise slightly
Australian consumer spending, a key driver of economic growth, has been showing cracks. Consumers have been squeezed by high borrowing costs and elevated inflation. These difficulties were reflected in today’s weak retail sales report for August, which showed a gain of 0.2% m/m. This was down from 0.5% m/m in July and missed the consensus estimate of 0.3% m/m. The reading would have been even weaker if not for the FIFA Women’s World Cup, which was held in Australia and New Zealand and boosted sales of merchandise and eating establishments.
For the Reserve Bank of Australia, the soft retail sales report adds support for a fourth straight pause. The RBA meets again in October and a key question is whether interest rates have peaked at the current benchmark rate of 4.10%. The RBA’s new governor, Michelle Bullock, has not made any splashy moves, instead opting to stick to the script of Philip Lowe, her predecessor. Bullock has said that upcoming rate decisions will be based on key data and has warned that rate hikes remain on the table.
Bullock’s hawkish stance is understandable, as inflation, which rose in August to 5.2%, remains way above the Bank’s 2% target. Bullock does not want to lose credibility by saying rates have peaked and then having to raise rates if inflation continues to move higher. The markets are viewing the uptick in inflation as a temporary blip and expect the overall downward trend to continue, and have priced in a rate cut for May 2024.
AUD/USD Technical
- AUD/USD is testing support at 0.6380. The next support line is 0.6320
- There is resistance at 0.6446 and 0.6506
USD/JPY: Psychological 150 Barrier Under Increased Pressure
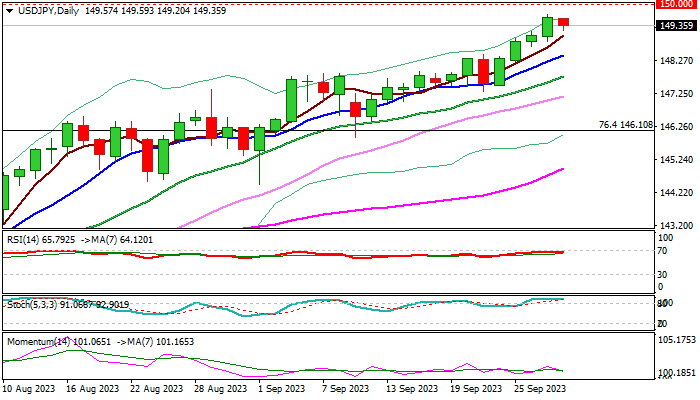
USD/JPY edged lower from new multi-month high in early Thursday’s trading, as bulls approached psychological 150 barrier and started to face headwinds.
Overbough daily studies and possibility that Japanese officials may intervene around 150 level, make traders more cautious, pushing the price lower.
The action so far looks like positioning for final attack at 150 barrier, break of which would expose next key level at 151.94 (2022 peak, the highest in over three decades).
Corrective dips should find ground above daily Tenkan-sen (148.51) to keep larger bulls intact) for fresh push higher.
Caution on deeper drop and violation of daily Kijun-sen (147.07) which would put bulls on hold and risk stronger correction.
Res: 150.00; 151.04; 151.94; 152.89.
Sup: 149.20; 148.51; 147.80; 147.07.
Crypto Needs Financial Chaos for Growth
Market picture
Crypto market capitalisation rose 0.7% in 24 hours to 1.053 trillion. This is a return to the levels seen at the end of last week. Cryptocurrencies saw increased buying when equity markets were under the most pressure and the dollar was gaining momentum. However, this momentum didn’t last long.
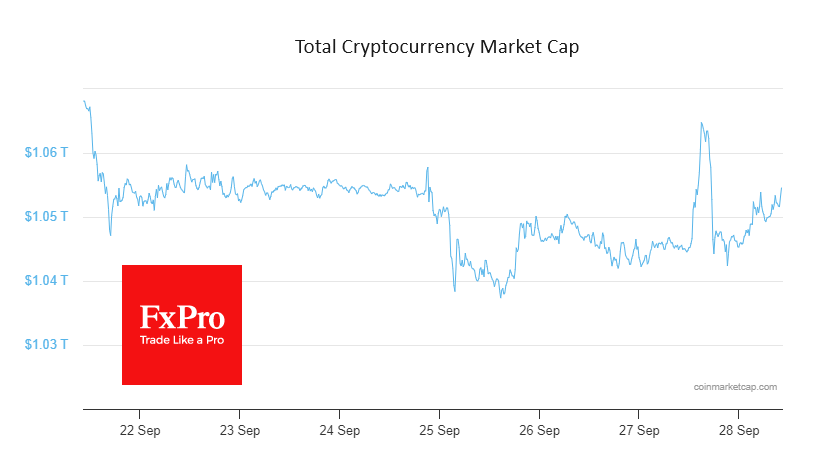
Bitcoin briefly rose to $26.7K but again found resistance at the 50-day moving average, which had already fallen to the abovementioned level. These growth impulses promise to remain a bull trap, offering the best opportunity to sell on the upside.
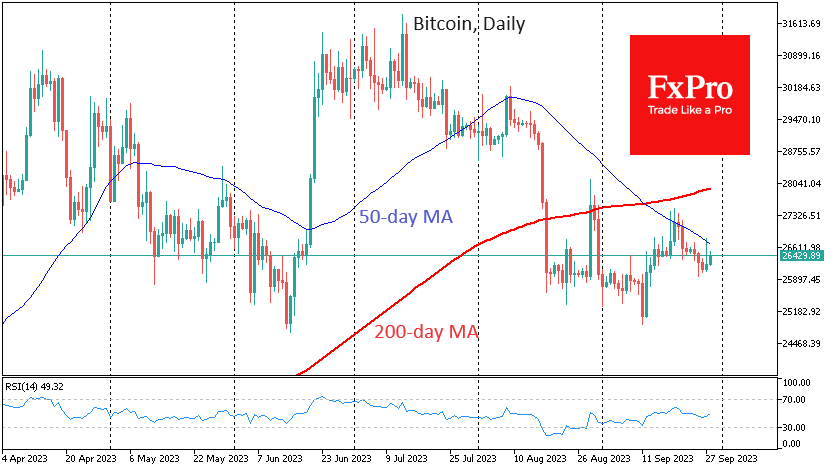
Cryptocurrencies need banking problems or uncertainty about the solvency of governments to generate sustainable growth momentum. Recent moves in bond markets show that something like this is brewing. But it’s too early to call cryptocurrencies a safe haven from the chaos of the traditional financial system.
News background
The SEC has delayed until the 10th of January 2024 a decision on spot bitcoin ETF applications from ARK Invest and 21Shares and until the 21st of November 2023 for Global X Bitcoin Trust ETF. The regulator cited the need for “sufficient time to review the documents”.
Stablecoins are vulnerable in times of large-scale turmoil in the cryptocurrency market and could cause instability in the broader financial system, the New York Fed said in a study.
Forbes noted that the crypto market had responded positively to global financial uncertainty and remains resilient amid rising bond market volatility. Therefore, investing in Bitcoin or Ethereum could be a safer choice on the cusp of a possible recession.
According to the Wall Street Journal, US authorities have been investigating Binance for a year and could face criminal charges and billions of dollars in fines.
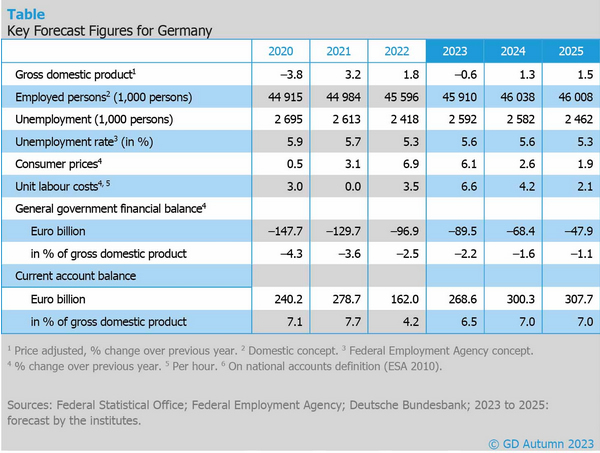
German institutes forecast -0.6% GDP contraction this year, but downturn to subside by year-end
In the Joint Economic Forecast by five leading economic institutes, Germany is bracing for an economic contraction of -0.6% in 2023, a significant downward adjustment by 0.9% from the spring 2023 prediction. Nevertheless, the silver lining comes in the form of anticipated rebounds in the following years: Growth of 1.3% in 2024 and 1.5% in 2025. Notably, the 2024 figure represents a mere 0.2% adjustment from their spring forecast.
On the inflation front, CPI is expected to moderate from 2022's staggering 6.9% to a still elevated 6.1% in 2023, before cooling off substantially to 2.6% in 2024 and 1.9% in 2025. Labor market is anticipated to feel a slight pinch with unemployment ticking up from 5.3% in 2022 to 5.6% in both 2023 and 2024, before retracting to 5.3% in 2025.
The report highlights, "Business sentiment has recently deteriorated again, not least because of heightened political uncertainty." The third quarter of 2023 experienced a noticeable fall in production, attributed to the waning business sentiment.
Despite the bleak outlook, there are silver linings. The tailwind of wage increases following the price hike, declining energy prices, and exporters partially offsetting their higher costs offers a semblance of balance, and as a result, purchasing power is making a comeback.
"Therefore, the downturn is expected to subside by the end of the year, and the degree of capacity utilisation will rise again going forward," adds the report.
This biannual Joint Economic Forecast is commissioned by German Federal Ministry for Economic Affairs and Climate Action. Contributors to this report comprise of eminent institutes including DIW Berlin, ifo Institute, IfW Kiel, IWH, and RWI.
EUR/USD: Further Weakness Expected After Limited Consolidation
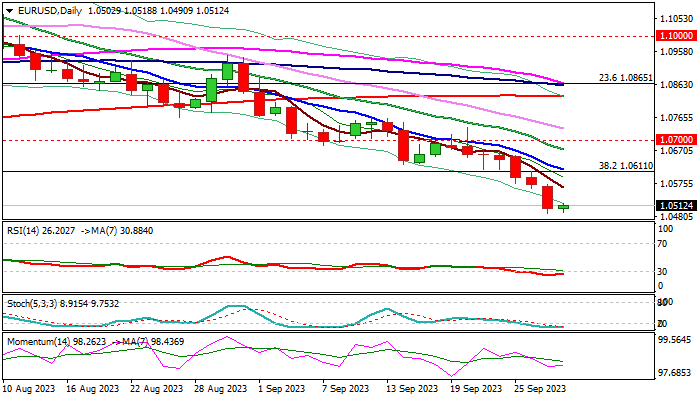
Bears are taking a breather just above 2023 low (1.0483) following steep bearish acceleration in past six days (the pair was down 1.7%), as daily indicators fell deep in oversold territory, prompting traders to collect some profits.
Overall technical picture on daily chart is firmly bearish and points to further losses, as fundamentals are also negative, with strong dollar on Fed’s higher for longer rate prospect, weighing on a single currency.
Recovery attempts should be limited in such environment and offer better selling opportunities.
Initial resistance lays at 1.0570 zone (falling 5DMA / Wednesday’s high), followed by more significant barriers at 1.0611/17 (broken Fibo 38.2% of 0.9535/1.1275 / falling 10DMA) which should cap extended upticks.
Break of annual low (posted in January) would spark fresh weakness and expose targets at 1.0405 (50% retracement), 1.0284 (weekly cloud base) and 1.0200 (Fibo 61.8% retracement of 0.9535/1.1275).
The pair is on track for the eleventh consecutive weekly loss and also for the biggest monthly drop since April 2022, which adds to negative outlook.
Res: 1.0565; 1.0617; 1.0673; 1.0700.
Sup: 1.0483; 1.0405; 1.0284; 1.0200.
Oil Surges to a New High of the Year
As the chart shows, the day before yesterday, a barrel of WTI cost USD 87.87, but this morning, the price exceeded the level of USD 93. That is, the growth was more than 6% in just 2 days.
The main driver of such growth remains the voluntary reduction in oil production by OPEC+ countries. Added to this was the market's reaction to yesterday's news about the reduction in oil reserves in the United States (expected = -0.7 million barrels, actual = -2.2 million). Inventories are approaching historical lows, according to Reuters. Probably, the US authorities, by releasing oil from storage, are trying to reduce the impact of its high price on inflation, but the graph shows that these efforts are unlikely to give the desired result.
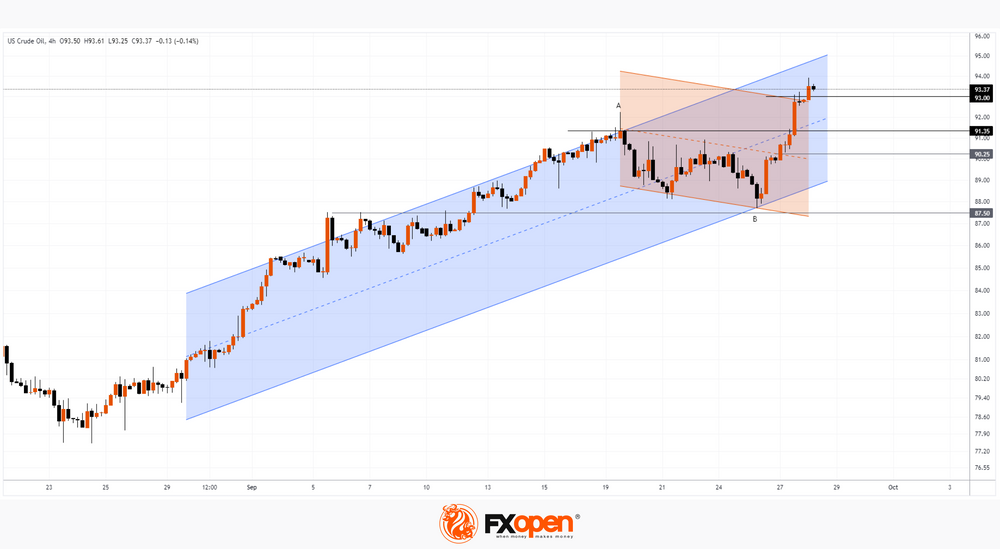
The A→B decline in oil prices observed since September 19 was merely a correction (shown in red) within a longer-term uptrend (shown in blue). Wherein:
→ the price sharply pushed off from the lower border of the blue channel around 87.5 - we wrote about this scenario earlier;
→ after a short respite, it broke through the median line of the red channel at around 90.25;
→ confidently overcame the level of 91.35, where growth clearly slowed down 10 days ago when approaching point A;
→ exceeded the upper limit of the red channel.
Now it is important for the bulls to gain a foothold at the achieved highs around USD 93. But if the upward impulse has not exhausted itself, then we may witness continued growth towards the upper border of the blue channel.
On the other hand: overbought market, the desire to lock in profits from long positions before the weekend, a possible reaction at the level of statements from the US authorities — all these can become factors contributing to the formation of a correction (for example, to the median line of the blue channel).
This article represents the opinion of the Companies operating under the FXOpen brand only. It is not to be construed as an offer, solicitation, or recommendation with respect to products and services provided by the Companies operating under the FXOpen brand, nor is it to be considered financial advice.