

Sample Category Title
USD/JPY Daily Outlook
Daily Pivots: (S1) 149.10; (P) 149.41; (R1) 149.95; More...
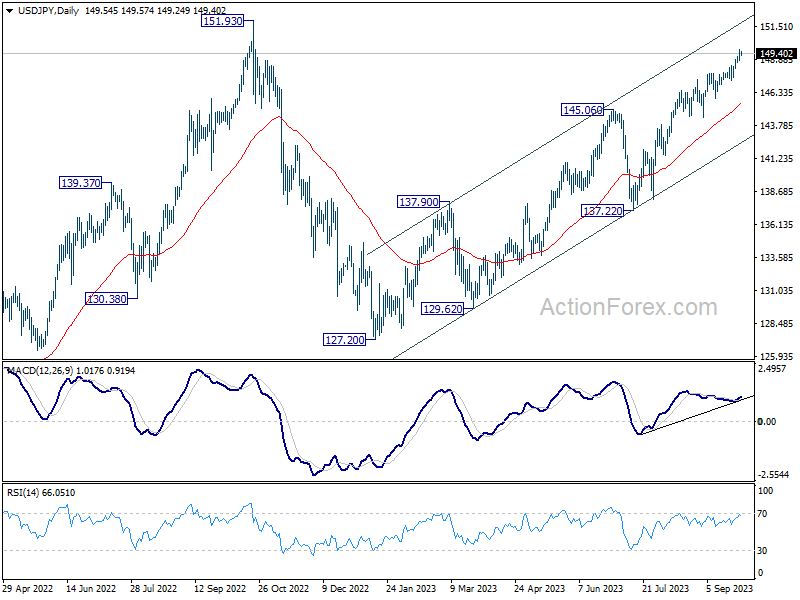
No change in USD/JPY's outlook and intraday bias stays on the upside at this point. Current rise from 127.20 should target a retest of 151.93 high. On the downside, below 148.75 minor support will turn intraday bias neutral first. But outlook will now stay bullish as long as 145.88 support holds, in case of retreat.
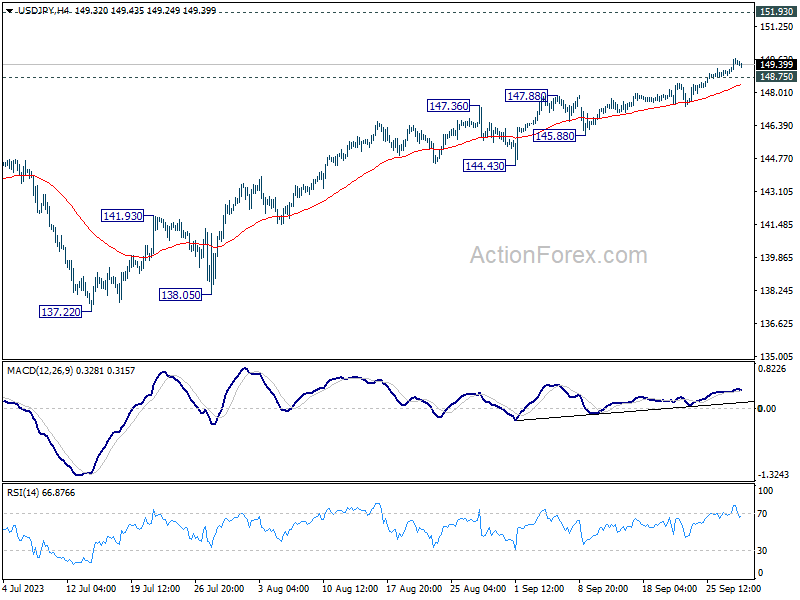
In the bigger picture, while rise from 127.20 is strong, it could still be seen as the second leg of the corrective pattern from 151.93 (2022 high). Rejection by 151.93, followed by break of 137.22 support will indicate that the third leg of the pattern has started. However, sustained break of 151.93 will confirm resumption of long term up trend.
Violent Market Moves Reverberate Through Asian Dealings
Markets
An eerie calm over bond markets yesterday ended abruptly. Yields suddenly shot up, erasing the few basis points they lost up until that moment. Moves in the US ranged between +4.4 and +8.3 bps with the belly underperforming the wings. Yields in Germany added 1.3-4.1 bps. The intraday turnaround more or less coincided with an acceleration in the oil price rally. Inventories of the commodity keep falling rapidly in the US, IEA data showed. A report noting that stockpiles at a major US storage hub in Cushing (Oklahoma) dropped to critical levels added fuel to the fire. Brent oil yesterday surged from $94.12 to 96.55/b, the highest since November last year. Currencies including the CAD and NOK benefited. The US dollar remained very strong as well even as the yield craze didn’t filter through on equity markets as much as they did earlier this week (Wall Street finished marginally in the green). DXY advanced from 106.23 to 106.66. USD/JPY closed near its daily highest, at 149.63. EUR/USD fell off a cliff. It lost the lower bound of the downward trading channel and came extremely close in testing the 1.0484 critical support level. The pair eventually closed at 1.0503, down from 1.0572 a day earlier. Rising spreads in the European periphery, Italy in particular, increasingly grab attention and have started to weigh as well. Moves in EUR/USD, once again, saved sterling from losing EUR/GBP 0.87 support. The pair finished at 0.8655.
Yesterday’s violent market moves reverberate through Asian dealings this morning. Both the dollar and core bond yields take a breather but stocks trade mostly negative. Japan underperforms. China trades mixed while moving into a week of holidays starting tomorrow. European investors on the other hand have their hands full. Several national September inflation readings are due, from Spain over Belgium to Germany. Consensus for the latter is set at 0.3% m/m and 4.5% y/y vs 0.4% and 6.4% last month. The sharp drop reflects large favourable base effects as reduced public transport costs from June-August last year drop out of the comparison. Rising oil prices offer counterweight. The bar for markets to price in additional ECB hikes right now is high but we do think today’s outcome is to underscore the higher-for-longer narrative. That offers downside protection to yields. We stay cautious on the euro though. It doesn’t look good at all from a technical perspective. EUR/USD 1.0484/1.0516 has to survive or the 1.04 big figure is next.
News Headlines
The Italian government yesterday approved a new framework that indicates higher budget deficits for this and next year amid substantially lower-than-expected economic growth. The 2023 deficit was upwardly revised to 5.3% from a previous target of 4.5%. 2024 was raised to 4.3% from a 3.7% estimate in April. At the same time growth for this and next year was downwardly revised to respectively 0.8% (from 1.0%) and 1.2% from 1.5%. In the new scenario the Italian debt-to-GDP ratio is expected to stay near 140% through 2026. According to the government slower growth and the deterioration in the budget outlook is mainly the result of restrictive monetary policy of the ECB and the war in Ukraine. However, a higher than expected budgetary cost from tax credits/incentives for energy-saving home improvements is also responsible. Italy has to present its budget plans to the European Commission by October 15. Near 1.95%, the 10-year spread between Italy and Germany reached the highest levels since March.
The Czech National Bank (CNB) yesterday as expected left its policy rate unchanged at 7.0%, which currently is still seen as appropriate to reach the inflation target. The internal debate on future interest rate cuts has started and Governor Michl said they have a strategy in place. However, ‘at its meetings ahead, the Bank Board will base its decisions on the new forecast and an assessment of newly available data. An evaluation of the persistence of the disinflationary trend, an analysis of the labour market situation, and the evolution of domestic and external demand will be crucial […]. The Bank Board expects the interest rate path to be higher than in the baseline scenario of the current forecast in the coming quarters’, the statement reads. Inflation fell in line with the CNB’s forecast and is expected to decline further in September. Oil prices and an increase in excise duty on diesel are upside factors. CNB takes notice of the recent decline in the koruna but indicates that it stays stronger than a year ago. Board member Jan Prochazka later indicated that CNB will try to avoid surprising with its policy moves. Despite a fragile risk sentiment, the koruna yesterday strengthened from about EUR/CZK 24.48 to close near 24.35.
Crude Oil Jumps, Dollar Rallies, Bonds Fall
The selloff in bonds continues on US government drama. The sell-off in US 10-year papers accelerated yesterday and the 10-year yield spiked to 2.64%. The 2-year yield however, which captures the expectations on Federal Reserve (Fed) actions remain steady a touch above the 5% mark, as even though the Fed’s once-dove-now-hawk Neel Kashkari said that the US may need more than one more rate hike to tame inflation, the looming government shutdown talks, the Detroit strikes and a few weak economic data released lately regarding the US melting savings and fading confidence hint that it may be ambitious to bet on more rate hikes before the dust settles. But you never know, the US will reveal its latest GDP update and it is expected to be revised higher. If that’s the case, we will likely see more choppiness in bond markets.
Volatility in US bond markets is rising, though we are far from alarming levels, while the US dollar continues to amass major safe haven demands. Nothing stands before the US dollar’s safe haven dominance. Gold slipped below the $1900 per ounce; rising yields increase the opportunity cost of holding the non-interest bearing gold, and thus, should keep a sustainable pressure on the precious metal even after the US government shutdown show ends, as the Fed remains sufficiently decided to keep rates higher for longer, and the US Treasury will be issuing more bonds, paying better yields in the next few months.
Energy and technology stocks helped the S&P500 limit losses yesterday. The energy sector was up on a fresh jump in oil prices after US inventories at Cushing and Oklahoma fell to critical levels, hinting at growing supply deficit in global energy space. AI stocks were up as US President Joe Biden said that he will sign an executive action on AI this fall, and Meta announced to introduce AI features in Instagram, Messenger, and WhatsApp. Earlier this week, Amazon announced to buy a $4 billion stake in Anthropic, similar to Microsoft’s creator of ChatGPT (which by the way is now valued at around $90bn, whereas it was worth $30bn at the beginning of this year). Amazon is also making a move into the AI’s magical world, aiming to give its AWS customers access to AI. Microsoft told investors in the latest earnings call that the AI would increase Azure’s revenue by around 2%, Anthropic should help drive similar revenue for AWS. Now, unfortunately for Amazon, investors didn’t react with the same excitement than they did with Microsoft’s investment in ChatGPT. Maybe a new DoJ probe was responsible for it, or it was just the rising yields. But somehow, Amazon follows its MAMAA peers with a certain lag, the e-commerce wing of the business is certainly responsible for that, in an environment full of worries regarding an imminent slowdown in spending.
Zooming out, the S&P500 remains under pressure. Despite insatiable appetite for AI, the rising yields threaten valuations. There is an important support zone near 4180/4200 region, which shelters the 200-DMA and the major 38.2% Fibonacci retracement on last year’s rally. If that support is pulled out, the index will step into a mid-term bearish consolidation zone, and selloff could deepen into yearend. In the short run, the risks remain tilted to the downside, as JP Morgan’s Hedged Equity Fund apparently holds tens of thousands of protective puts aimed to protect the long-stock product from selloff and volatility. Those put options will expire on Friday, and their strike price are said to be not far from the actual levels. If exercised, we could see an additional negative pressure on Wall Street stocks.
Spanish and German Inflation Data to Set the Direction for European Markets
Market movers today
In the euro area, we receive inflation data from Spain and Germany which will give some clues ahead of the aggregate euro area inflation print tomorrow.In the US, Powell hosts a town hall speech at 22:00 CET with Q&As. There are several ECB speeches today including Holzman as well as a couple of speeches by the Riksbank members.
The 60 second overview
The oil price keeps rising as an unexpected decline in China's inventory added to the speculation of a "deficit" in the supply versus demand as US stockpiles are also running low. Rising energy prices will add to the inflationary pressure and supports the view that central banks will be "higher for longer".
Federal Reserves Kashkari stated in various interviews yesterday that he believes that more than one hike could be necessary should the past tightening not have the desired effect. On the other hand, a potential US government shut-down could have the opposite effect.
The main event in the European markets today is the Spanish and German inflation data where inflation is expected to have risen to 0.6% m/m in September relative to 0.5% m/m in August (and 3.3% y/y vs. 2.6% y/y). German inflation is expected to rise 0.3% m/m relative to 0.4% in August (4.5% y/y vs. 6.4% y/y).
Equities: Global equities were marginally higher yesterday but with huge regional and sector differences. There were two big drivers yesterday, higher yields primarily in the long end of the curve and higher oil prices. Energy sector as the best performer is no surprise under those circumstances. However, the sector shifts out defensives into industrials and other cyclicals was more surprising as investors currently see higher yields as a challenge for the economic backdrop. In the US: Dow -0.2%, S&P 500 +0.02%, Nasdaq +0.2% and Russell 2000 +1.0%. Markets in Asia are quite negative today as the oil price continues to march towards 100 dollar per barrel. US and European futures are mixed this morning.
FI: Yields rose significantly yesterday after an initial decline and thus follow the rise we have been seeing after the central banks meetings during the past weeks. There was a very modest bullish flattening as well as a modest tightening of the 10Y Italian-German yield spread after a significant widening for most of September, where the spread moved from 160-165bp to 190-195bp.
FX: New year-highs for both broad USD and oil prices. EUR/NOK broke below the 200D-MA on the back of the oil price rally. EUR/GBP went below 0.87 once again on a generally weak day for the EUR. The SEK continues to perform, although with signs that downside momentum might start to abate soon.
Credit: Credit indices continued to drift wider yesterday where iTraxx Xover widened 7bp further and Main 1bp. While primary market activity picked up, investors seem more price sensitive as reflected in a lower travel from IPT to final pricing.
Nordic macro
In Norway, retail sales is expected to have stabilised from April through to June but dropped 0.8% in July. Low real wage growth, higher mortgage rates and a shift towards consumption of services are presenting huge headwinds for retailers, so we expect a further decrease of around 0.5% in August.
USD/CHF Daily Outlook
Daily Pivots: (S1) 0.9162; (P) 0.9193; (R1) 0.9245; More....
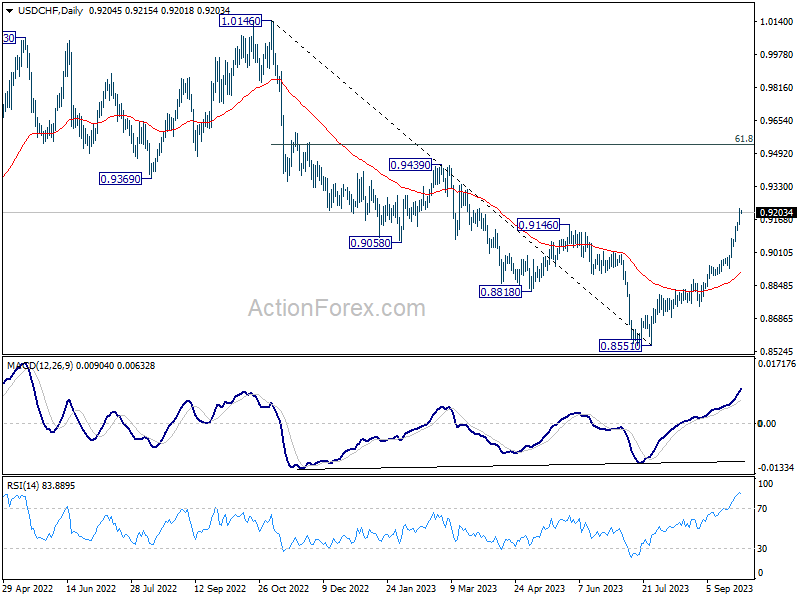
USD/CHF's rally continues and hit as high as 0.9224. Intraday bias stays on the upside for 0.9439 resistance next. On the downside, below 0.9152 minor support will turn intraday bias neutral and bring consolidations, before staging another rally.
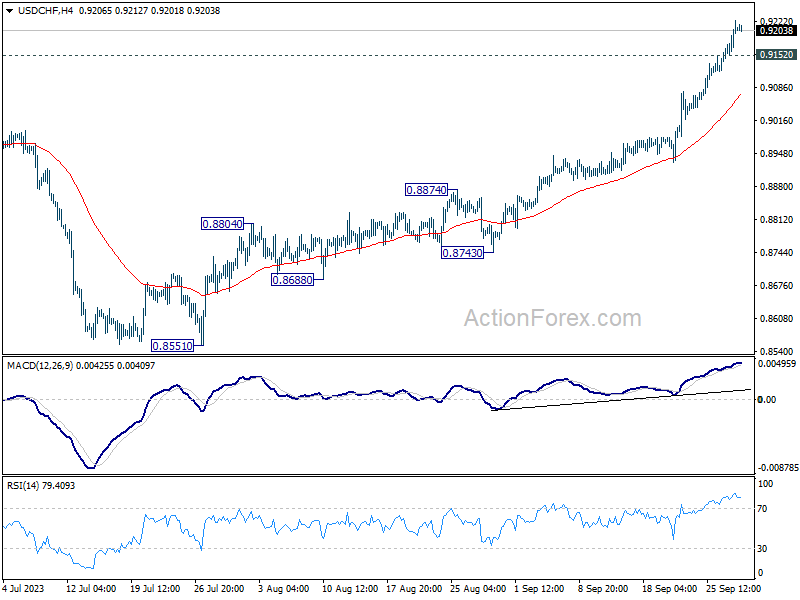
In the bigger picture, current development indicates that rise from 0.8551 is reversing whole down trend from 1.0146. Further rally would then be seen to 61.8% retracement at 0.9537 and above. For now, this will be the favored case as long as 55 D EMA (now at 0.8917) holds, even in case of deep pullback.
Dollar Soars on Sky-High Yields, Gold Plummets
Dollar's strength remains unabated, particularly against its European counterparts and Yen. The greenback rose alongside 10-year yield, which soared past the 4.6% mark overnight, a level unseen in over 15 years. The surging global treasury yields are a clear indicator of the market's expectation for a prolonged period of restrictive monetary policies by central banks across the globe. This comes as the market grapples with the looming shadow of a potential U.S. government shutdown, adding another layer of complexity to the fiscal equation.
However, this bullish momentum for Dollar is somewhat stymied against commodity currencies. Canadian Dollar emerging as the second strongest for the week so far, spurred by soaring oil prices. New Zealand Dollar is not far behind, buoyed by speculation of another interest rate hike by RBNZ in the fourth quarter. Conversely, the Australian Dollar trails the pack among its commodity-based peers.
Swiss Franc continues its underperformance against Euro and Sterling. Yen paints a mixed picture, as Japanese authorities seem to be adeptly employing verbal interventions, effectively slowing the currency's decline by putting potential Yen sellers on alert.
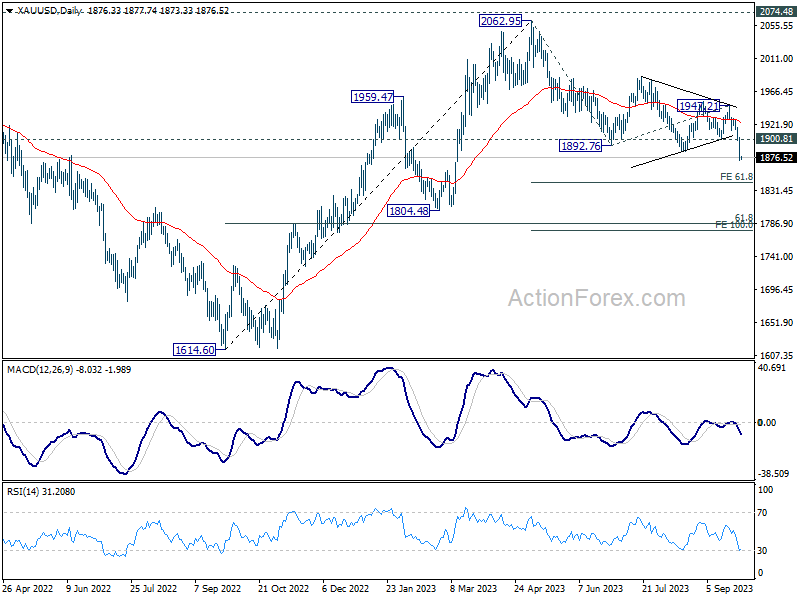
Technically, Gold's accelerated decline confirms resumption of whole down trend from 2062.95. Near term outlook will now stay bearish as long as 1900.81 support turned resistance holds. Next target is 61.8% projection of 2062.95 to 1892.76 from 1947.21 at 1842.03. This decline from 2062.95 is viewed as a medium term move inside the long term pattern from 2074.84 (2020 high). Break of 1842.03 will target 100% projection at 1777.02 and below.
In Asia, Nikkei closed down -1.55%. Hong Kong HSI is down -1.20%. China Shanghai SSE is up 0.17%. Singapore Strait Times is up 0.13%. Japan 10-year JGB yield is up 0.0124 at 0.752. Overnight, DOW dropped -0.20%. S&P 500 rose 0.02%. NASDAQ rose 0.22%. 10-year yield rose 0.068 to 4.626.
Mixed signals in New Zealand business confidence, ANZ anticipates another RBNZ hike
September has seen a noteworthy rebound in New Zealand's ANZ Business Confidence, rising from -3.7 to 1.5. However, a closer examination of the details offers a more nuanced picture.
Metrics such as own activity output experienced a slight decline, dropping from 11.2 to 10.9. More alarmingly, export intentions plummeted from a positive 7.5 to a -0.4. There were also declines in investment intentions (from -1.3 to -4.1) and employment intentions (from 4.6 to 1.2).
On the inflation front, cost expectations edged upwards from 75.3 to 78.6, while profit expectations showed an improvement, moving from -17.6 to -13.2. Pricing intentions rose from 44.0 to 47.1, but inflation expectations took a downward turn, shifting from 5.06 to 4.95.
ANZ provided their insights on this mixed bag of indicators, stating, "The New Zealand economy is certainly patchy, and the rebound in activity indicators – that's been evident since the start of the year – may be running out of steam."
They further highlighted the complexities in the inflation scenario: "Inflation pressures are gradually waning in the big picture, but not rapidly nor in a straight line, and the jury remains out on whether it's occurring fast enough to bring core inflation pressures down in a timely fashion."
Looking ahead, ANZ anticipates further action from RBNZ to ensure inflation is reined in effectively, with a 25 bps hike expected in November.
Australian retail sales see modest 0.2% mom rise amid cost-of-living pressures
The latest retail statistics out of Australia show a muted picture of consumer spending, with retail sales turnover in August rising only 0.2% mom (in seasonally adjusted terms) to AUD 35.4B, falling short of the anticipated 0.3% increase. Through the year, sales turnover was up 1.5% yoy.
According to Ben Dorber, the head of retail statistics at the Australian Bureau of Statistics (ABS), this modest rise indicates a notable restraint in consumer spending. Dorber noted, "The modest rise in August shows consumers continued to restrain their retail spending."
The trend growth in retail sales paints an even starker image. "In trend terms, retail turnover rose 0.1 per cent, and was up only 1.3 per cent compared to August 2022 - the smallest trend growth over 12 months in the history of the series," Dorber added.
Dorber highlighted, "Considering how high inflation and strong population growth have added to retail turnover in the past year, the historically low trend growth highlights just how much consumers have pulled back in response to cost-of-living pressures."
Oil prices hit yearly high on shrinking inventories, WTI in march to 100
Oil prices saw a sharp ascent overnight, extending their gains into Asian trading session today and marking their highest point in over a year. With technical indicators pointing to a potential acceleration, WTI oil is on the march towards 100 psychological level.
A factor propelling this surge is the pronounced drop in US crude stocks, amplifying concerns about tightening global supply in light of OPEC+ production cuts, spearheaded by Saudi Arabia. Yesterday's data revealed that oil inventories dipped by -2.2m barrels last week, settling at 416.3m barrels.
Furthermore, the stockpiles at Cushing, Oklahoma, a crucial storage hub and the delivery point for US crude futures, saw a reduction of -943k barrels over the week, dropping to just under 22m barrels, lowest since July 2022. Significantly, these reserves at Cushing have been on decline for seven consecutive weeks. Many market participants view these current levels as bordering on the minimum required for operational functionality of the storage tanks.
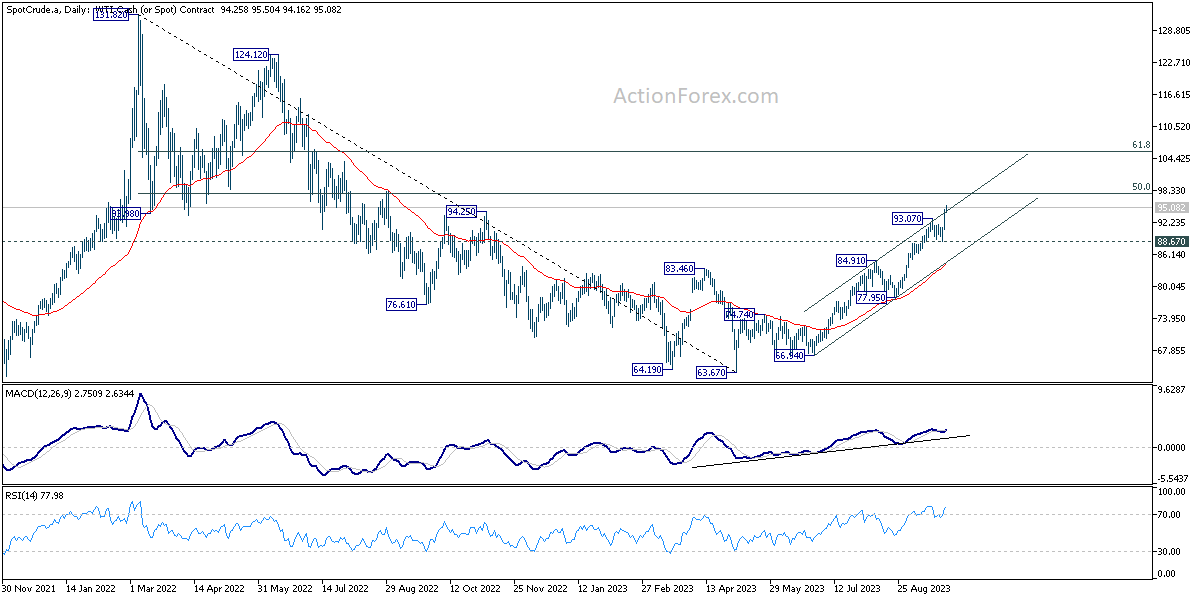
Technically, WTI crude oil's recent up trend resumed after brief consolidations and surged through 95 handle. There is sign of upside acceleration with break of the rising channel resistance. Near term outlook will stay bullish as long as 88.67 support holds. Next target is 50% retracement of 131.82 to 63.67 at 97.74. Decisive break there could pave the way through 100 psychological to 61.8% retracement at 105.78.
Looking ahead
ECB monthly bulletin and Eurozone economic sentiment indicator will be released in European session. Germany will publish CPI flash. Later in the day, US jobless claims and pending home sales will be featured along with Q2 GDP final.
USD/CHF Daily Outlook
Daily Pivots: (S1) 0.9162; (P) 0.9193; (R1) 0.9245; More....
USD/CHF's rally continues and hit as high as 0.9224. Intraday bias stays on the upside for 0.9439 resistance next. On the downside, below 0.9152 minor support will turn intraday bias neutral and bring consolidations, before staging another rally.
In the bigger picture, current development indicates that rise from 0.8551 is reversing whole down trend from 1.0146. Further rally would then be seen to 61.8% retracement at 0.9537 and above. For now, this will be the favored case as long as 55 D EMA (now at 0.8917) holds, even in case of deep pullback.
Economic Indicators Update
| GMT | Ccy | Events | Actual | Forecast | Previous | Revised |
|---|---|---|---|---|---|---|
| 00:00 | NZD | ANZ Business Confidence Sep | 1.5 | -3.7 | ||
| 01:30 | AUD | Retail Sales M/M Aug | 0.20% | 0.30% | 0.50% | |
| 08:00 | EUR | ECB conomic Bulletin | ||||
| 09:00 | EUR | Eurozone Economic Sentiment Indicator Sep | 92.5 | 93.3 | ||
| 09:00 | EUR | Eurozone Industrial Confidence Sep | -10.5 | -10.3 | ||
| 09:00 | EUR | Eurozone Services Sentiment Sep | 3.5 | 3.9 | ||
| 09:00 | EUR | Eurozone Consumer Confidence Sep F | -17.8 | -17.8 | ||
| 12:00 | EUR | Germany CPI M/M Sep P | 0.30% | 0.30% | ||
| 12:00 | EUR | Germany CPI Y/Y Sep P | 4.60% | 6.10% | ||
| 12:30 | USD | Initial Jobless Claims (Sep 22) | 200K | 201K | ||
| 12:30 | USD | GDP Annualized Q2 F | 2.30% | 2.10% | ||
| 12:30 | USD | GDP Price Index Q2 F | 2.00% | 2.00% | ||
| 14:00 | USD | Pending Home Sales M/M Aug | 0.20% | 0.90% | ||
| 14:30 | USD | Natural Gas Storage | 90B | 64B |
USDJPY Elliott Wave Impulsive Structure Remains In Play
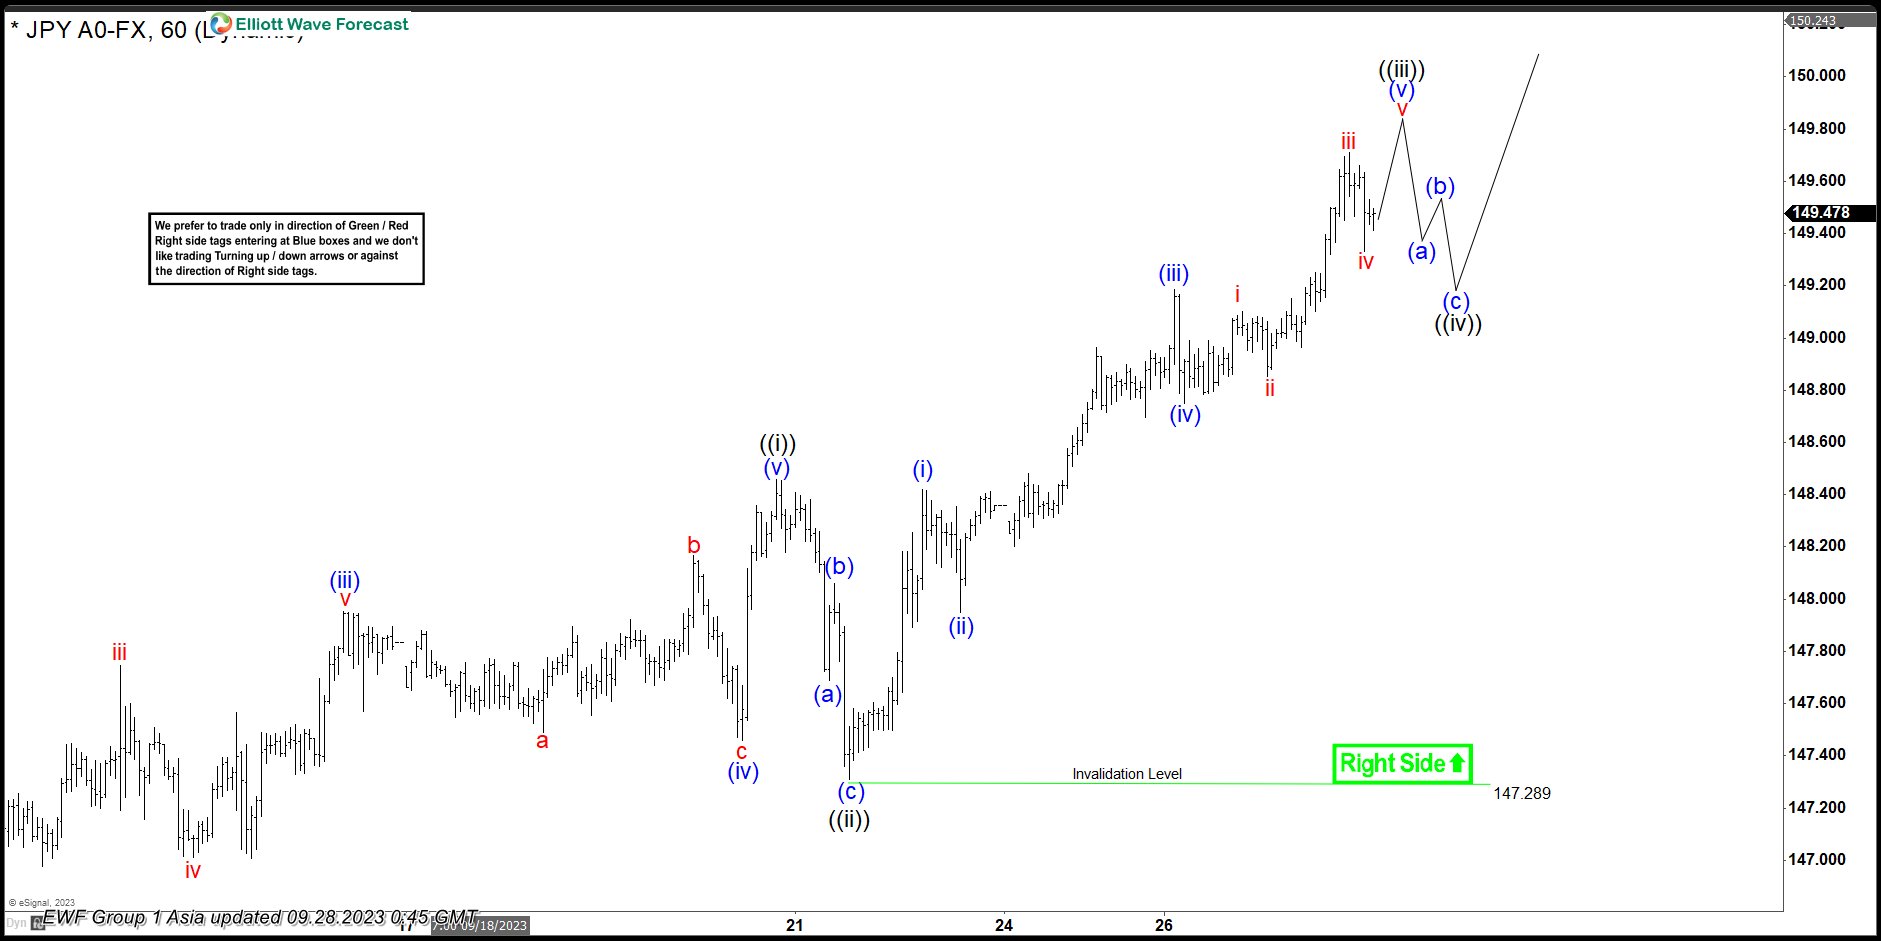
Short term Elliott Wave view suggests the USDJPY is trading to the upside in a wave 3 following an impulse structure. Up from wave 2 at 9.11.2023 low, wave ((i)) ended at 148.46 as a leading diagonal. Wave ((ii)) made a zig zag correction (a), (b), and (c) ended at 147.29 low. From here, the pair continued the rally trading higher in wave ((iii)). 1 hour chart below shows wave ((iii)) of 3 should be near to end. Up from wave ((ii)), wave (i) ended at 148.42 and pullback in wave (ii) ended at 147.96. USDJPY resumed rally ended at 149.19 which completed wave (iii).
Small pullback as wave (iv) ended at 148.76. Then, the pair resumed higher in wave (v) of ((iii)). We can see that wave (v) is extended and actually is trading in wave v of (v). The structure suggest that we need one more high to complete wave v of (v) and that will complete wave (v) of ((iii)) and wave ((iii)). Once wave ((iii)) is completed, USDJPY should enter in a correction as wave ((iv)); therefore, we expect 3, 7 or 11 swings lower to end wave ((iv)) before turning higher again in wave ((v)) of 3. Near term, as far as pivot at 147.29 low stays intact, expect pair to see further upside
USDJPY 60 Minutes Elliott Wave Chart
USDJPY Elliott Wave Video
https://www.youtube.com/watch?v=bE9GPsJ9rLg
Technical Outlook and Review
DXY:
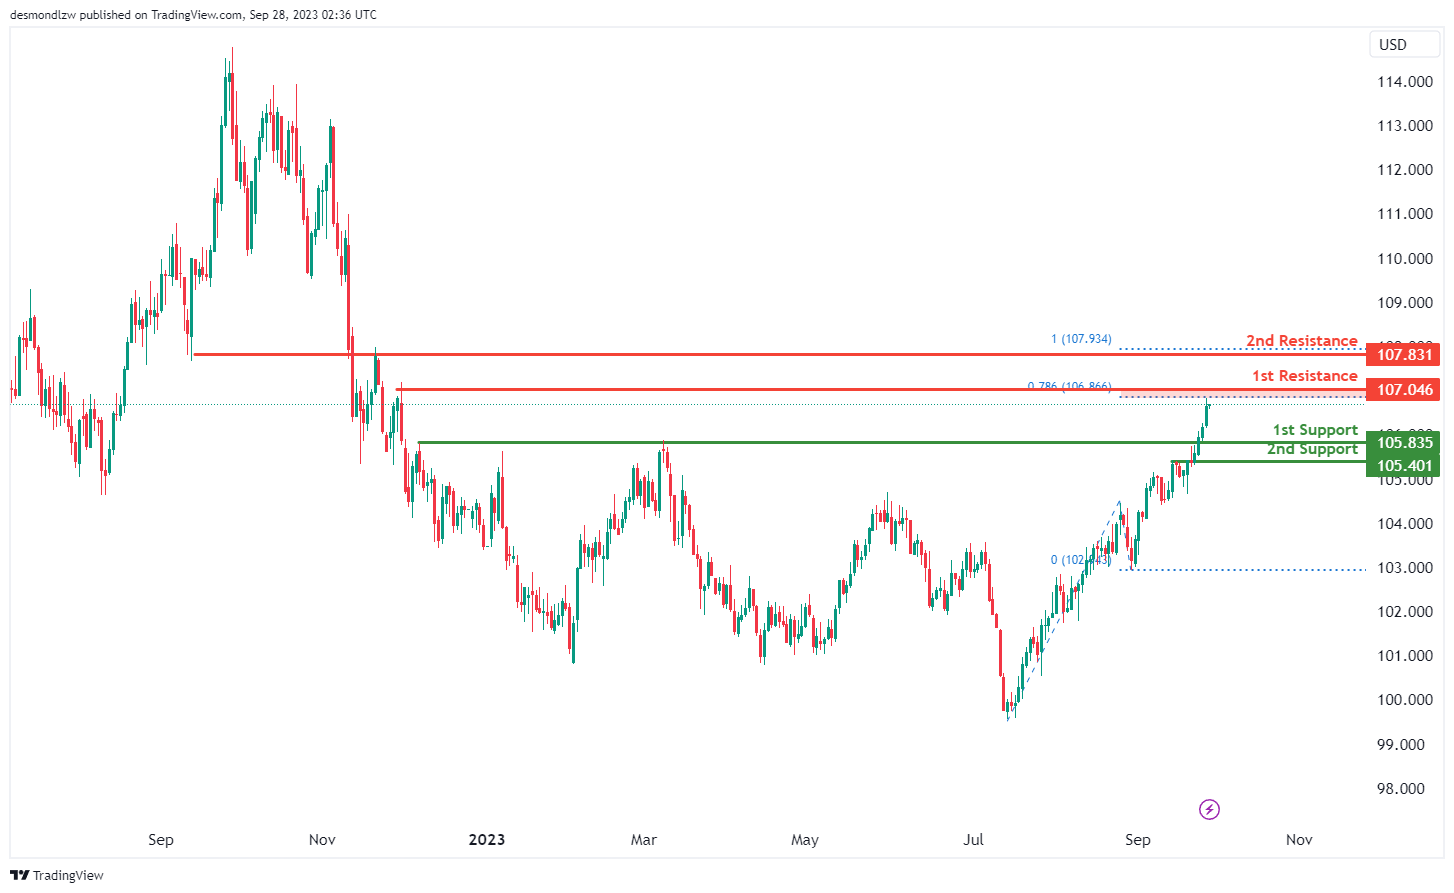
The DXY chart currently exhibits a bullish momentum, with a potential short-term drop to the 1st support at 105.83, identified as a pullback support, before potentially rising towards the 1st resistance. The 2nd support level is at 105.40, marked as an overlap support, serving as another potential floor for prices.
On the resistance side, the 1st resistance is at 107.04, a crucial swing high resistance level that aligns with the 78.60% Fibonacci Projection. Beyond this, the 2nd resistance stands at 107.83, another swing high resistance level coinciding with the 100% Fibonacci Projection, marking significant potential barriers to upward price movements
EUR/USD:
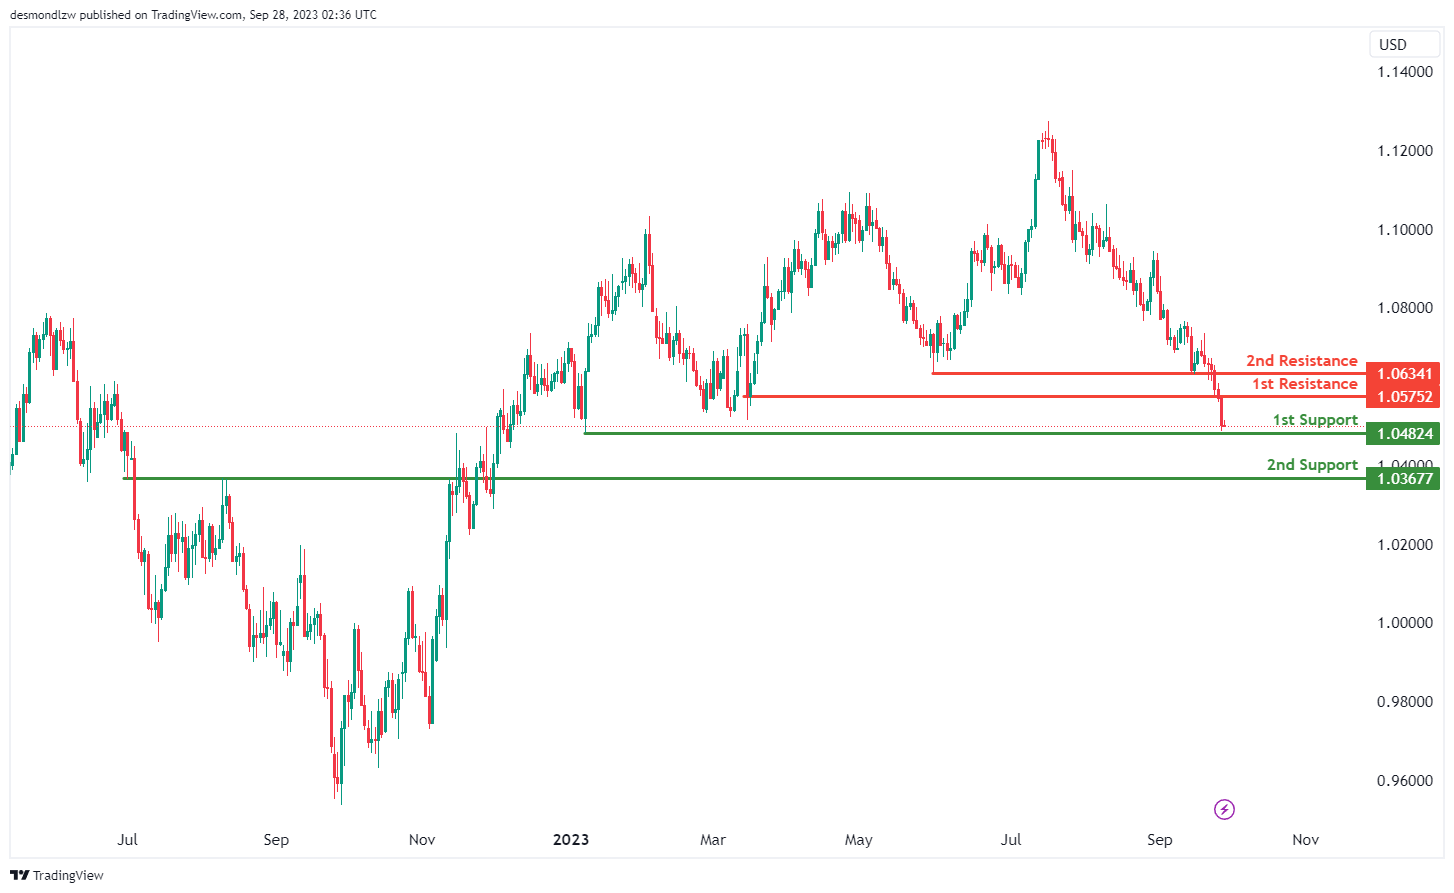
The EUR/USD chart is currently experiencing bearish momentum, with expectations of a potential bullish bounce off the 1st support level at 1.0482. This level, identified as a swing low support, is reinforced by the presence of a 127.20% Fibonacci Extension, providing a solid foundation for the price. There is also a 2nd support level at 1.0367, categorized as a pullback support, which further underpins the price.
In terms of resistance, the 1st resistance level is situated at 1.0575 and acts as a pullback resistance that might initially limit upward movements. Further up, the 2nd resistance at 1.0634, also serving as a pullback resistance, represents another potential cap to bullish advancements in the price.
EUR/JPY:
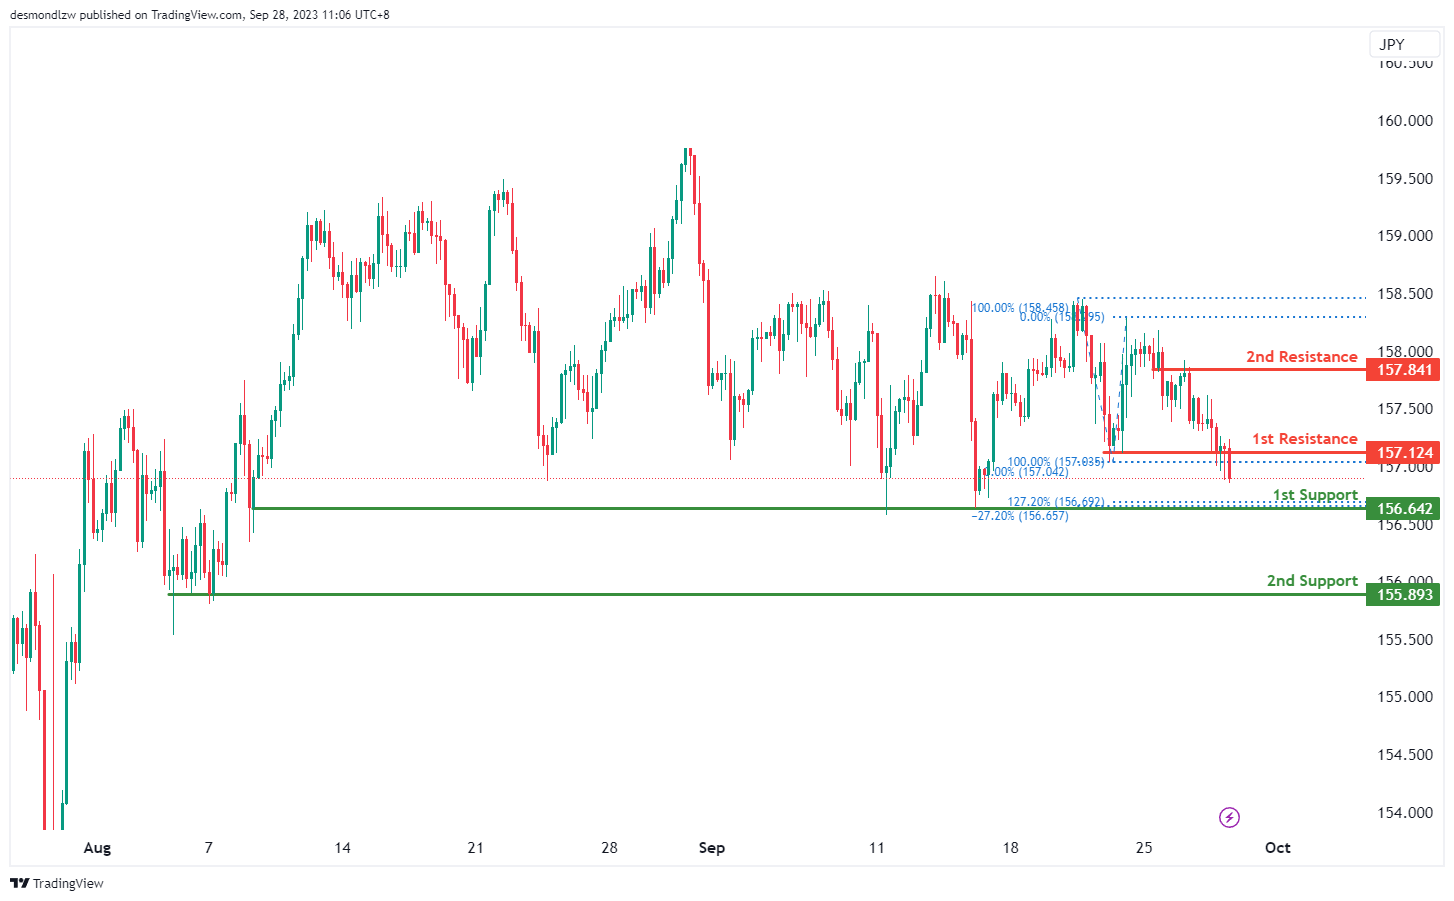
The EUR/JPY chart currently displays a bearish momentum, suggesting a potential continuation of the bearish trend.
The 1st support level at 156.64 is significant for several reasons. It is a multi-swing low support and is reinforced by the presence of a 127.20% Fibonacci Extension and a -27% Fibonacci Expansion, indicating a strong confluence of support factors. This level may serve as a crucial area where price could find support, and traders may anticipate a potential bounce or stabilization.
Slightly below, the 2nd support at 155.89 is another multi-swing low support, adding to the overall significance of this area. If the bearish pressure continues, this level might become relevant.
On the flip side, the 1st resistance level at 157.12 is marked as a pullback resistance, which could act as a barrier to any upward price movement.
Above that, the 2nd resistance at 157.84 is identified as an overlap resistance, further strengthening its potential as a significant level where sellers might step in.
EUR/GBP:
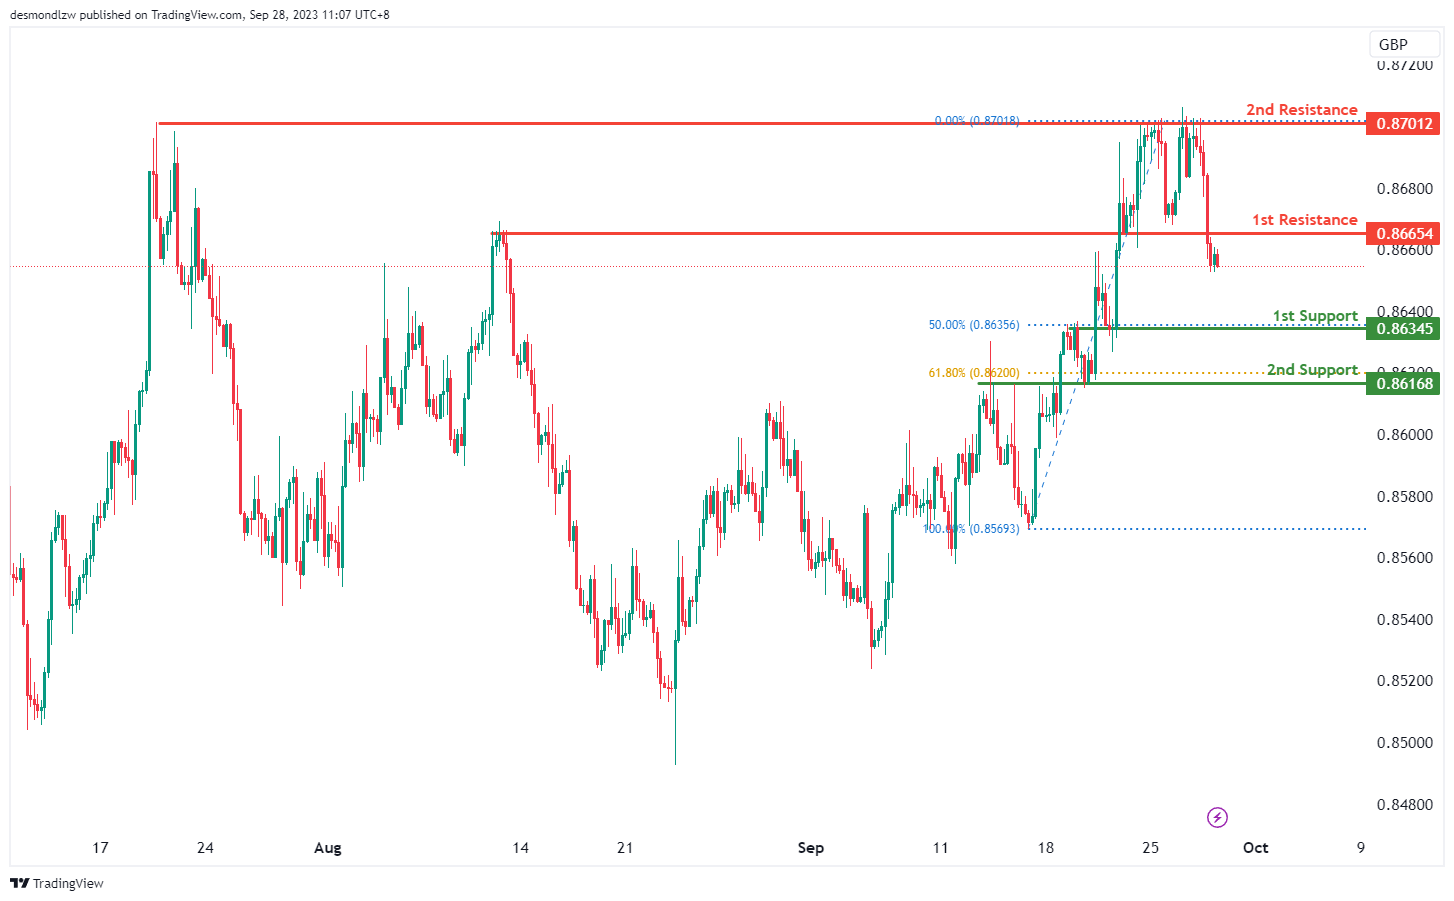
The EUR/GBP chart is currently exhibiting a bearish overall momentum, suggesting the potential for a further bearish continuation.
The 1st support level at 0.8634 is notable for several reasons. It represents an overlap support, which means it has previously acted as a significant price level where buying interest emerged. Additionally, this level coincides with the 50% Fibonacci Retracement, further reinforcing its significance. Traders may look to this level as a potential area where price could find support and reverse some of the bearish pressure.
Slightly lower, the 2nd support at 0.8616 is another overlap support, this time corresponding with the 61.80% Fibonacci Retracement. Such confluence of support factors makes this level an important area to watch for potential price reactions.
On the resistance side, the 1st resistance level at 0.8665 is marked as a pullback resistance. It could act as a barrier to any bullish attempts.
Above that, the 2nd resistance at 0.8701 is identified as a multi-swing high resistance, further strengthening its potential as a significant level where sellers might be active.
GBP/USD:
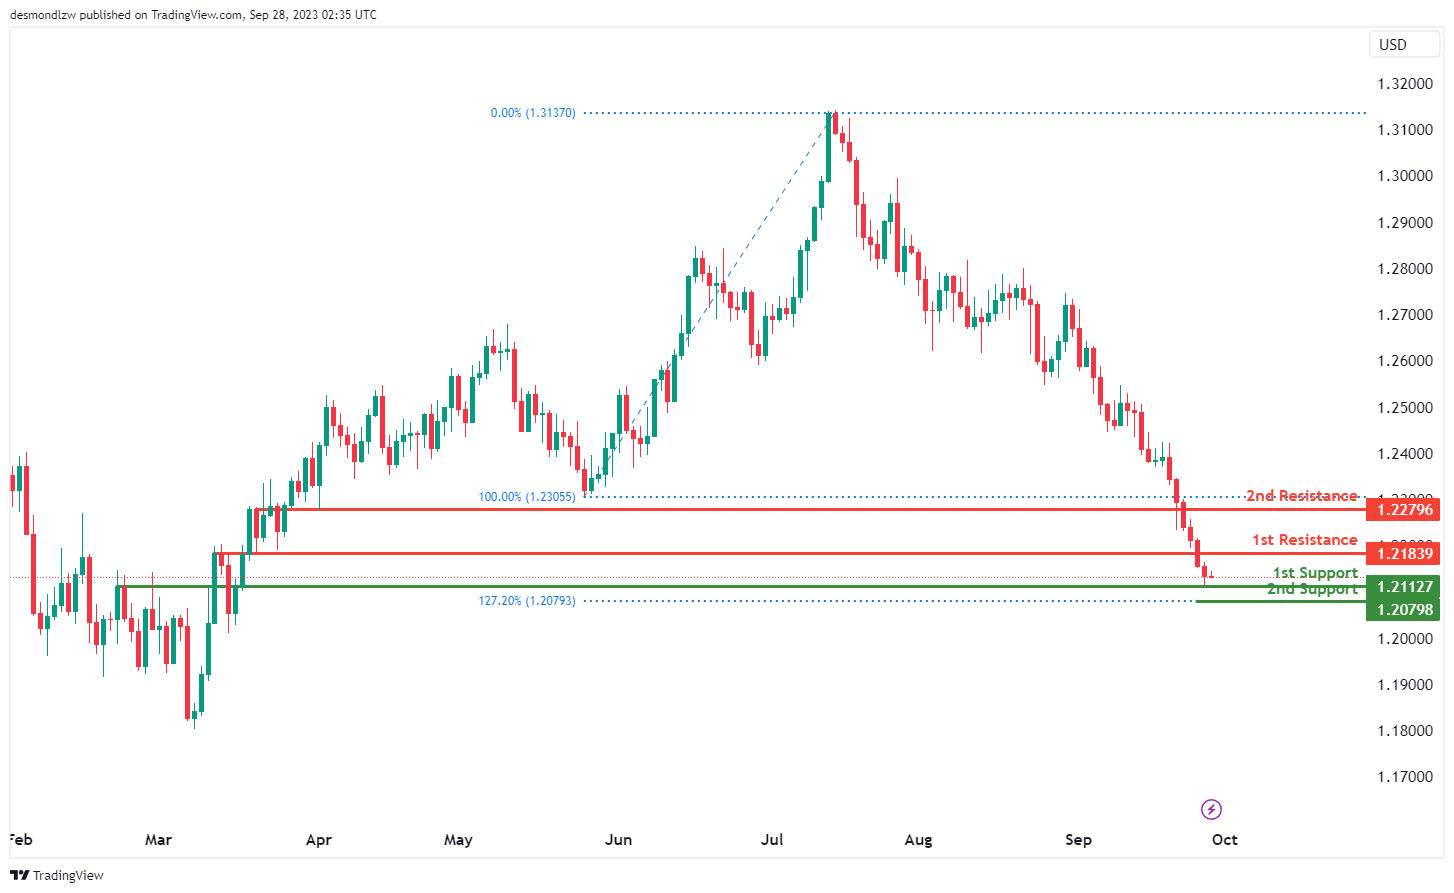
The GBP/USD chart currently signals bearish momentum but there’s anticipation for a bullish bounce from the 1st support at 1.2112, heading towards the 1st resistance. The 1st support level, which acts as an overlap support, is a crucial area where the price might find support and start ascending. Furthermore, the 2nd support at 1.2079, associated with the 127.20% Fibonacci Extension, also represents a significant support zone, reinforcing the likelihood of upward price movement from these levels.
On the resistance side, the chart has the 1st resistance at 1.2183, recognized as a pullback resistance, which might limit the price’s upward motion temporarily. Beyond this, the 2nd resistance level is at 1.2279, also a pullback resistance, marking another significant area that could act as a barrier to the price’s further ascent.
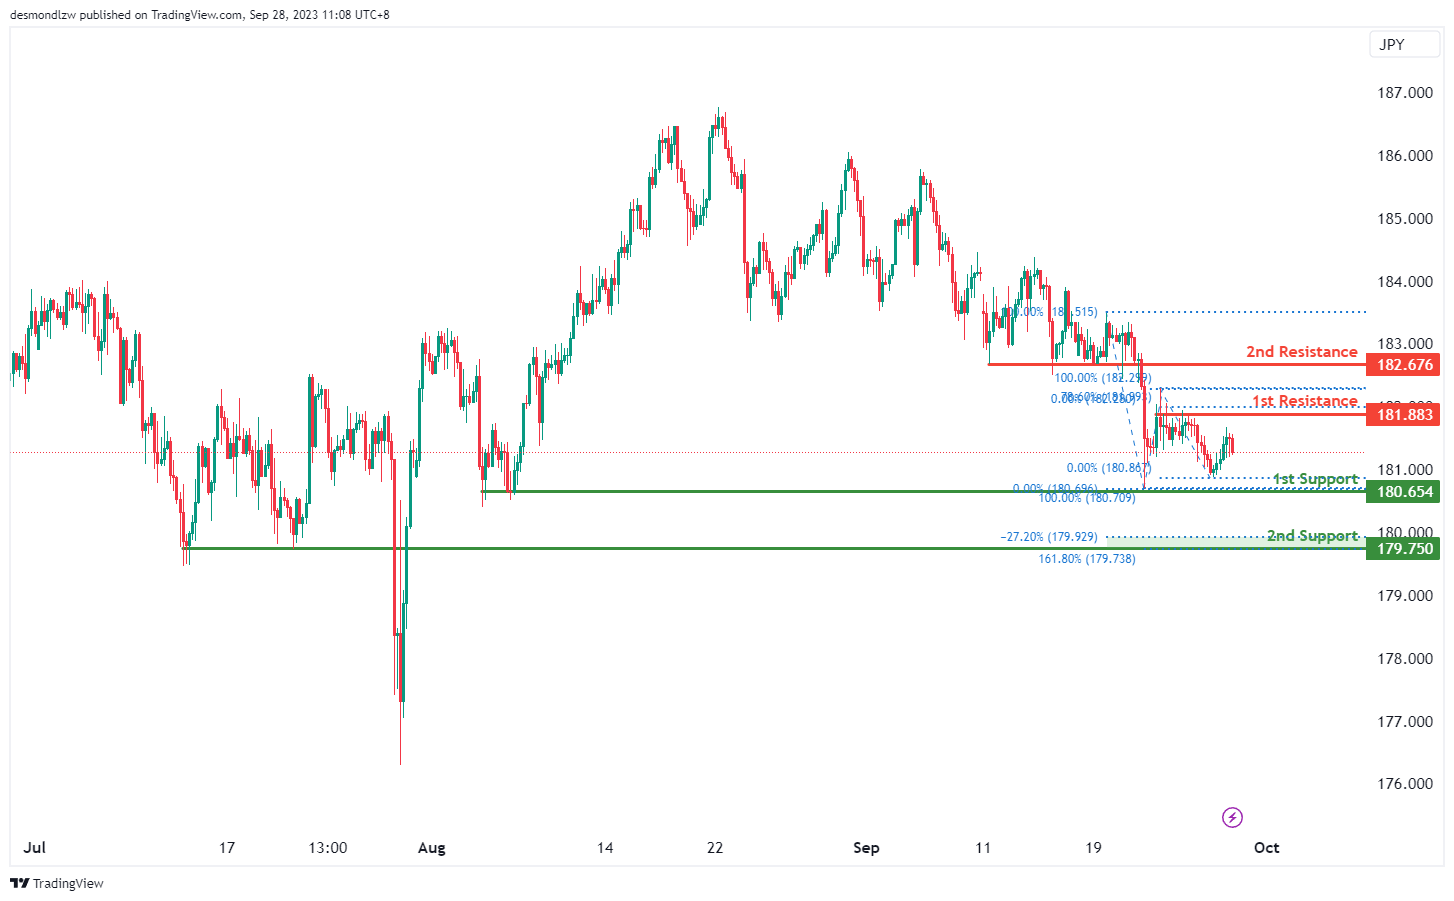
GBP/JPY:
The GBP/JPY chart is currently exhibiting a bearish overall momentum, indicating the potential for a further bearish continuation.
The 1st support level at 180.65 is considered a multi-swing low support. This suggests that it has previously served as a significant level where buyers have stepped in. Traders will be watching this level closely for potential signs of a bounce or a reversal in the bearish trend.
Below that, the 2nd support at 179.75 offers additional reinforcement for potential support. It not only represents a pullback support but also aligns with the -27% Fibonacci Expansion and the 161.80% Fibonacci Extension. The confluence of these factors makes this level an important area to monitor for potential reversals or a pause in the bearish movement.
On the resistance side, the 1st resistance level at 181.88 is a multi-swing high resistance. This level could act as a barrier to any bullish attempts, serving as a point where sellers might be active.
Above that, the 2nd resistance at 182.67 is identified as a pullback resistance, further reinforcing the potential for bearish continuation.
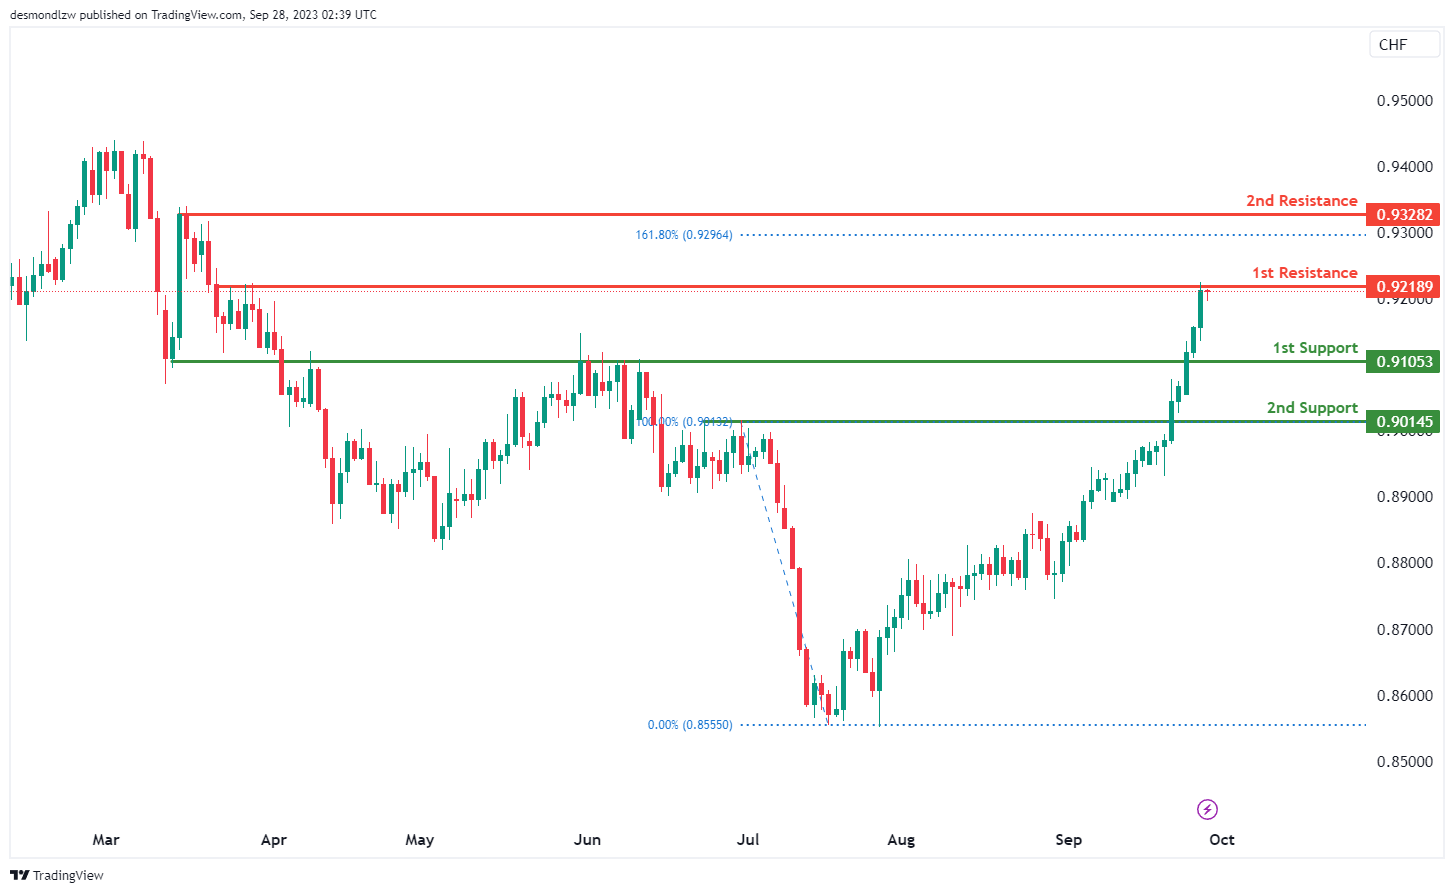
USD/CHF:
The USD/CHF chart currently demonstrates a bullish momentum. There is a potential scenario where the price might break above the intermediate resistance level and make a bullish continuation towards the 1st resistance level.
The intermediate resistance level at 0.9186 is identified as a pullback resistance while the 1st resistance level at 0.9206 is also marked as a pullback resistance. Additionally, the 2nd resistance level at 0.9251 is identified as a pullback resistance, a potential barrier for further price increases.
To the downside, the intermediate support level at 0.9143 is identified as a pullback support while the 1st support level at 0.9078 is also marked as a pullback support. Additionally, the 2nd support level at 0.9013 is identified as a pullback support.
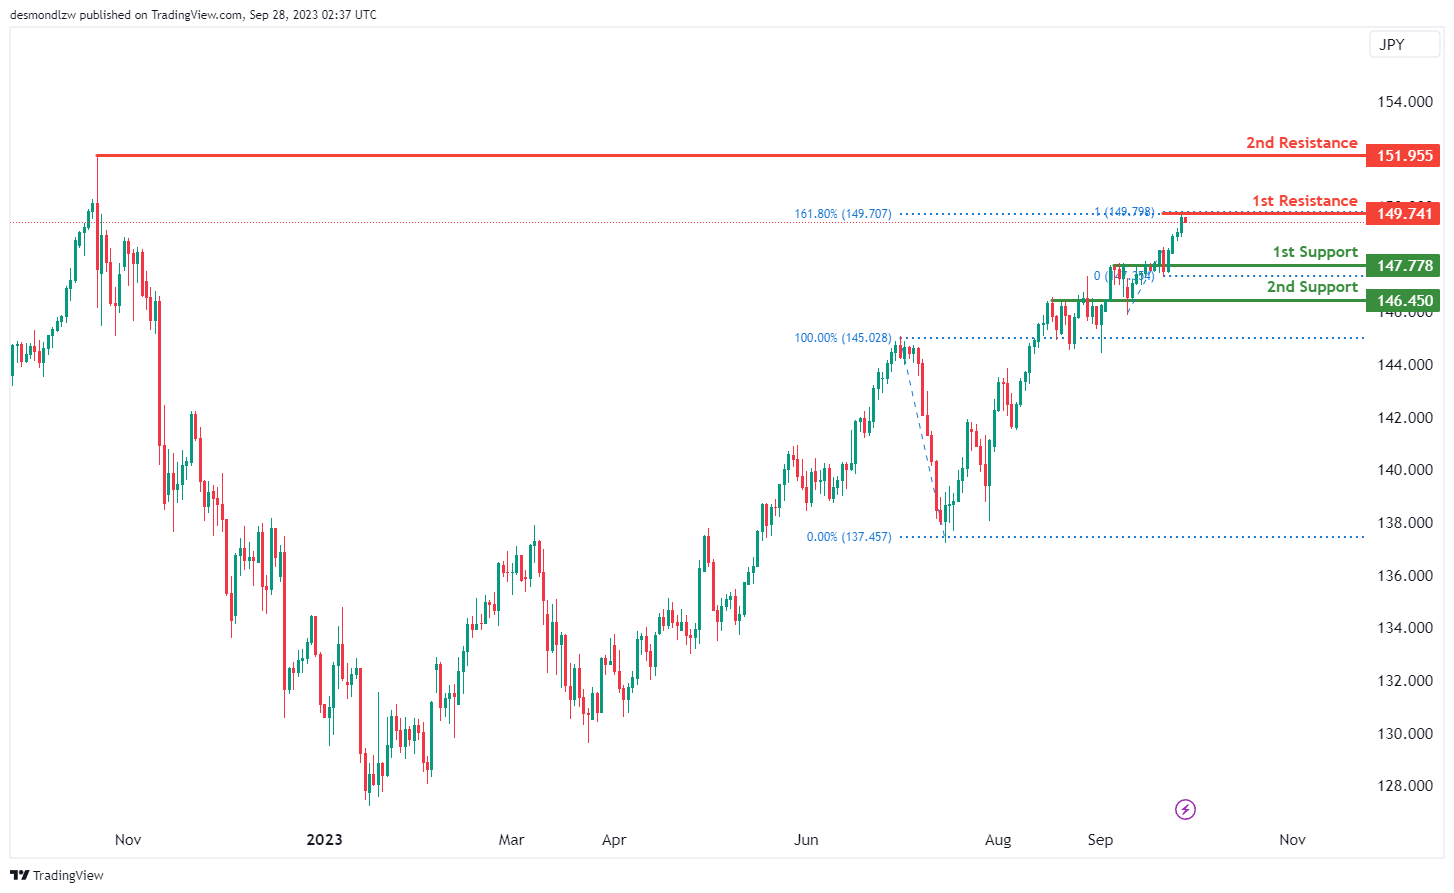
USD/JPY:
The USD/JPY chart is presently showing bearish momentum, with a forecasted bearish reaction off the 1st resistance at 149.74, leading to a potential drop to the 1st support at 147.77. The 1st support level is significant, serving as a pullback support where the price might find necessary support. Additionally, the 2nd support at 146.45, identified as an overlap support, offers another potential zone to halt further declines.
On the resistance side, the 1st resistance at 149.74 is crucial, with the convergence of the 161.80% Fibonacci Extension and 100% Fibonacci Projection, indicating a Fibonacci confluence and underlining its importance as a potential resistance zone. Beyond this, the 2nd resistance level at 151.95, recognized as a swing high resistance, further delineates a barrier for potential upward movements.
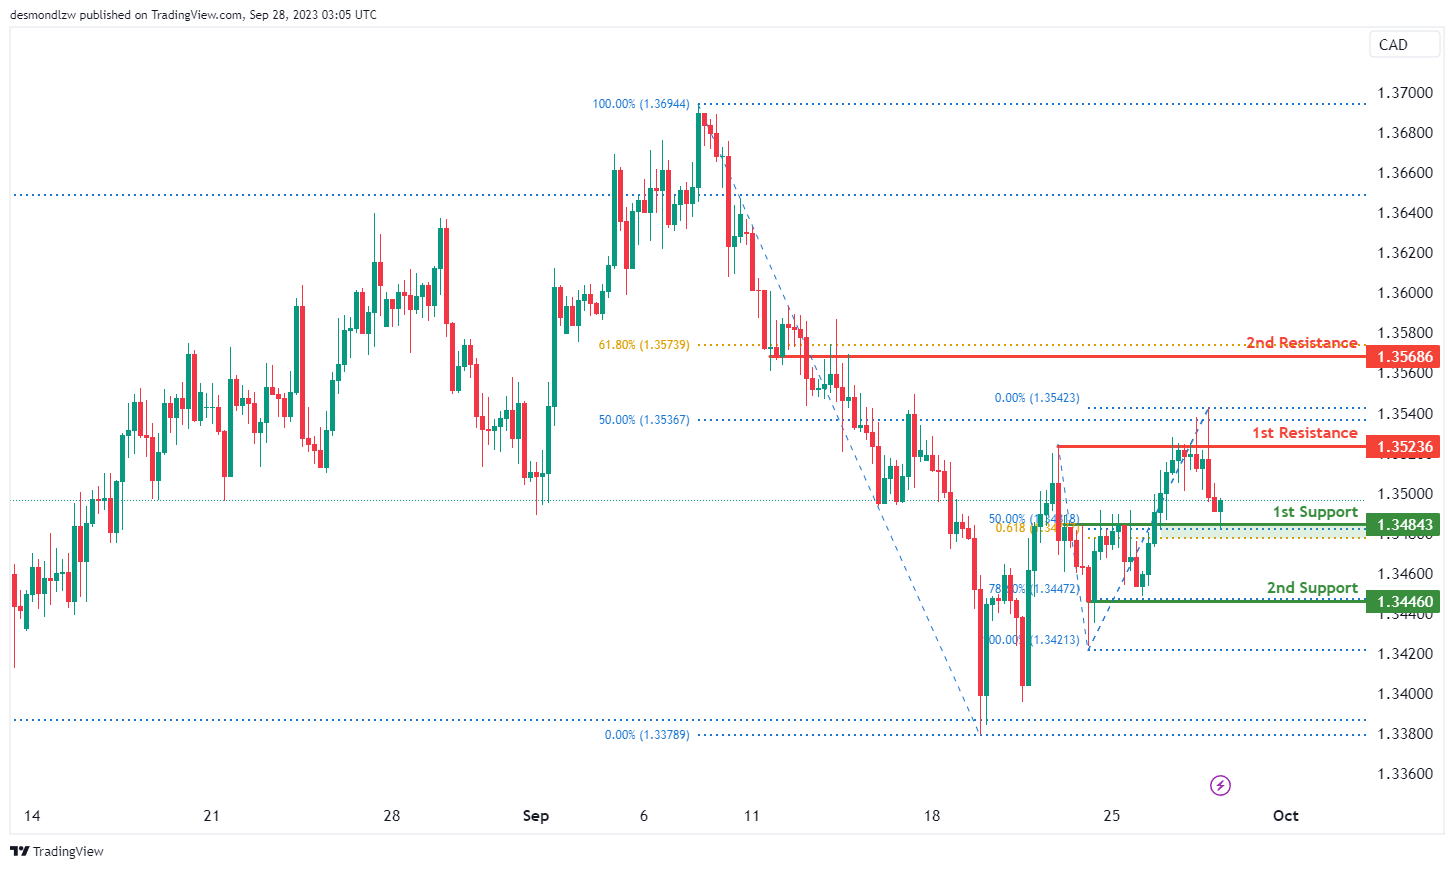
USD/CAD:
The chart for USD/CAD is currently indicating an overall bullish momentum. In this scenario, there is a potential for a bullish continuation towards the 1st resistance level.
The 1st resistance level at 1.3524 is identified as a pullback resistance that aligns close to the 50.00% Fibonacci retracement level. Additionally, the 2nd resistance level at 1.3569 is marked as a pullback resistance that aligns with the 61.80% Fibonacci retracement level.
To the downside, the 1st support level at 1.3484 is identified as an overlap support that aligns with a confluence of Fibonacci levels i.e. the 50.00% retracement and the 61.80% projection levels. Further below, the 2nd support level at 1.3446 is also noted as a pullback support that aligns with the 78.60% Fibonacci retracement level.
AUD/USD:
The AUD/USD chart is currently displaying an overall bullish momentum, suggesting that price may continue its bullish movement towards the 1st resistance level should price break above the intermediate resistance.
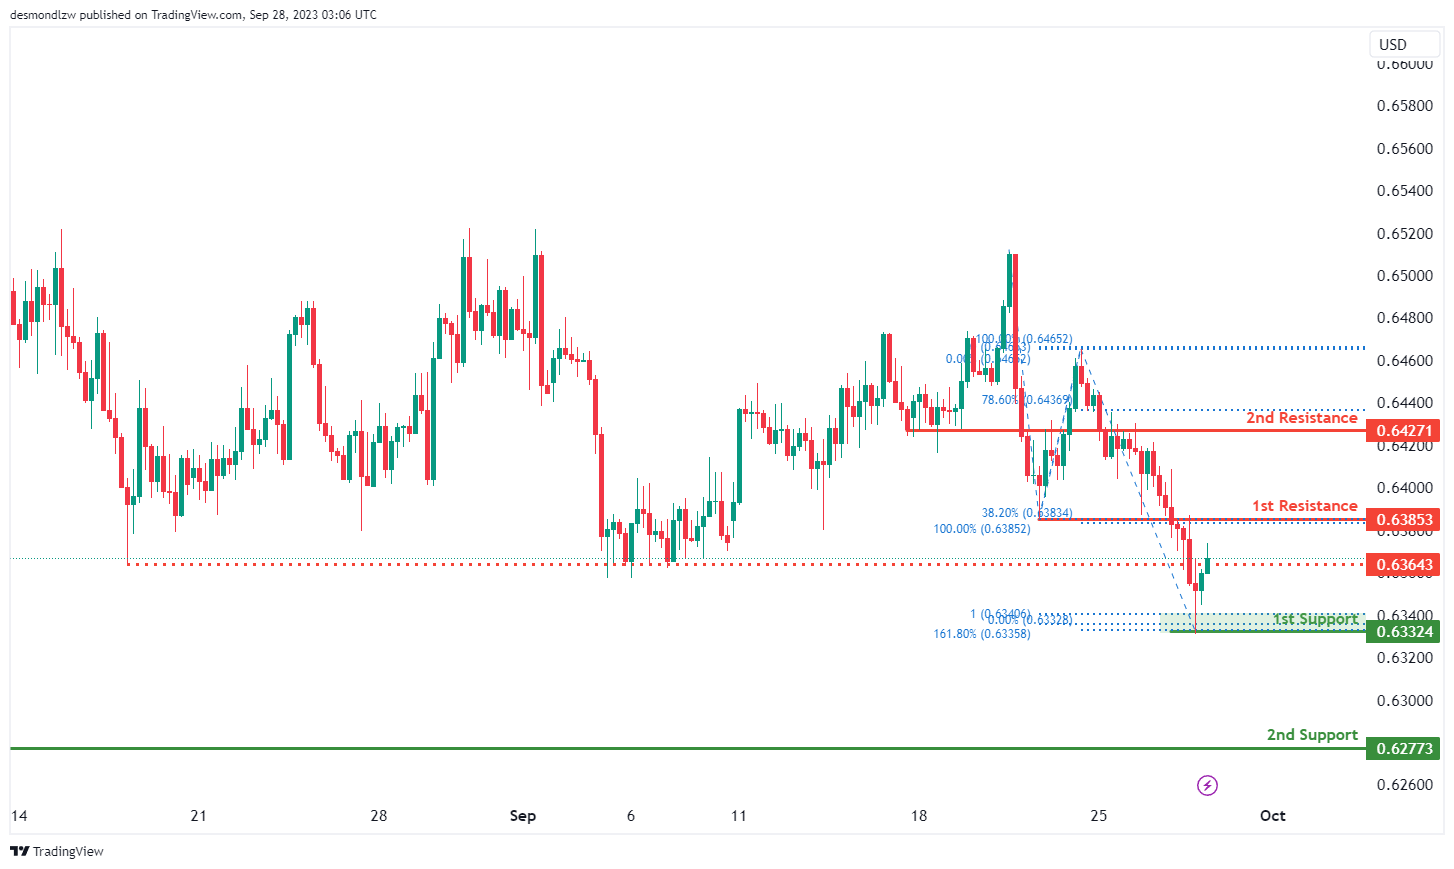
The intermediate resistance level at 0.6364 is identified as a pullback resistance while the 1st resistance level at 0.6385 is also marked as a pullback resistance that aligns with the 38.20% Fibonacci retracement level. Further up, the 2nd resistance level at 0.6427 is identified as an overlap resistance that aligns close to the 78.60% Fibonacci retracement level.
To the downside, the 1st support level at 0.6332 is identified as a swing-low support that aligns with a confluence of Fibonacci levels i.e. the 161.80% extension and the 100.00% projection levels. Additionally, the 2nd support level at 0.6277 is also noted as a multi-swing-low support.
NZD/USD
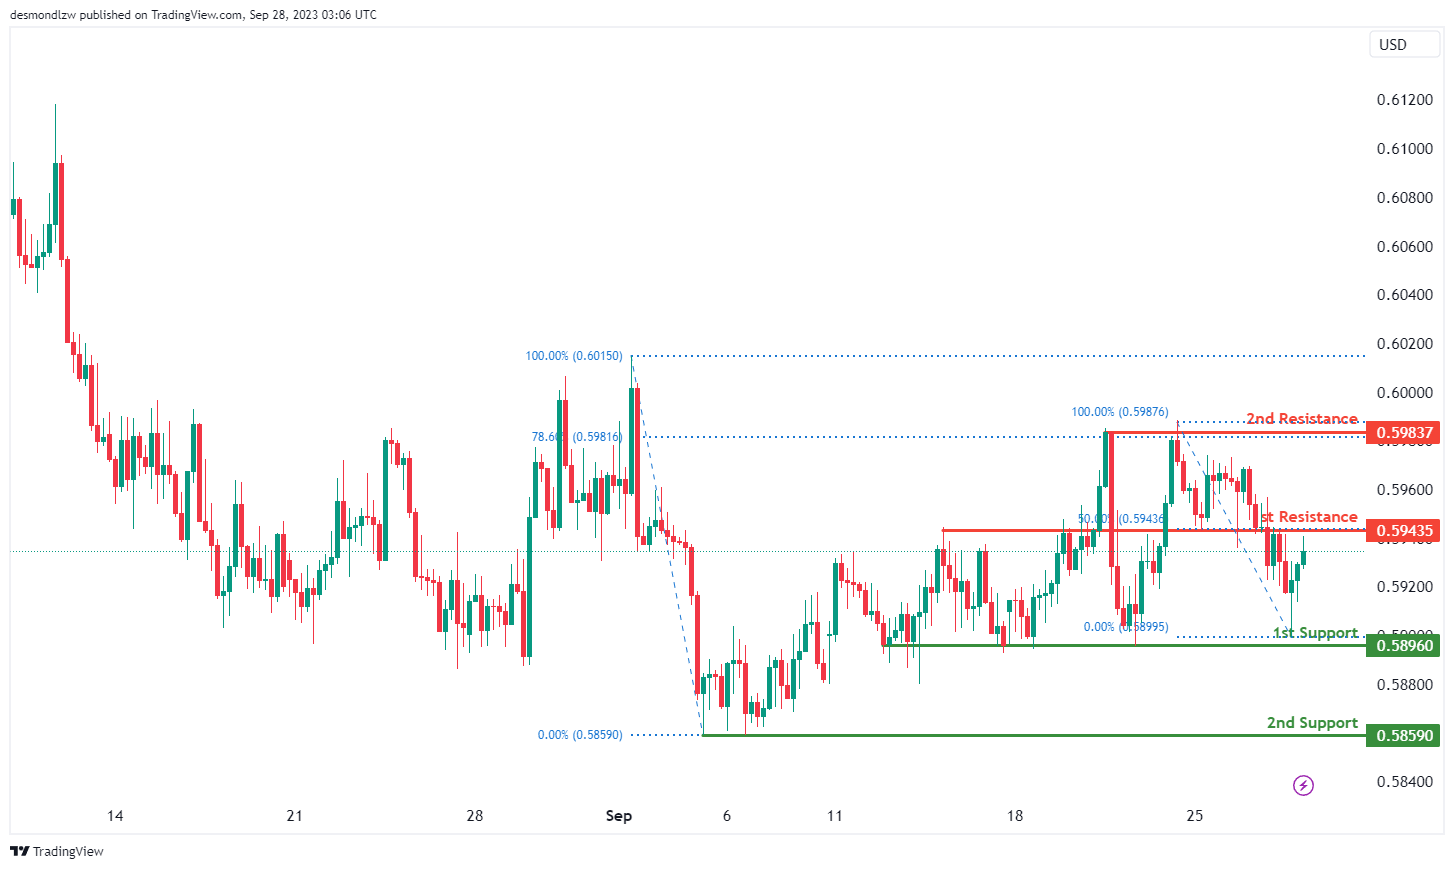
The NZD/USD chart is currently showing an overall bullish momentum, suggesting that the price may rise towards the 1st resistance level.
The 1st resistance level at 0.5944 is identified as an overlap resistance that aligns with the 50.00% Fibonacci retracement level. Further up, the 2nd resistance level at 0.5984 is marked as a pullback resistance that coincides with the 78.60% Fibonacci retracement level.
To the downside, the 1st support level at 0.5896 is identified as a pullback support while the 2nd support level at 0.5859 is also marked as a pullback support which could potentially act as a major support zone.
DJ30:
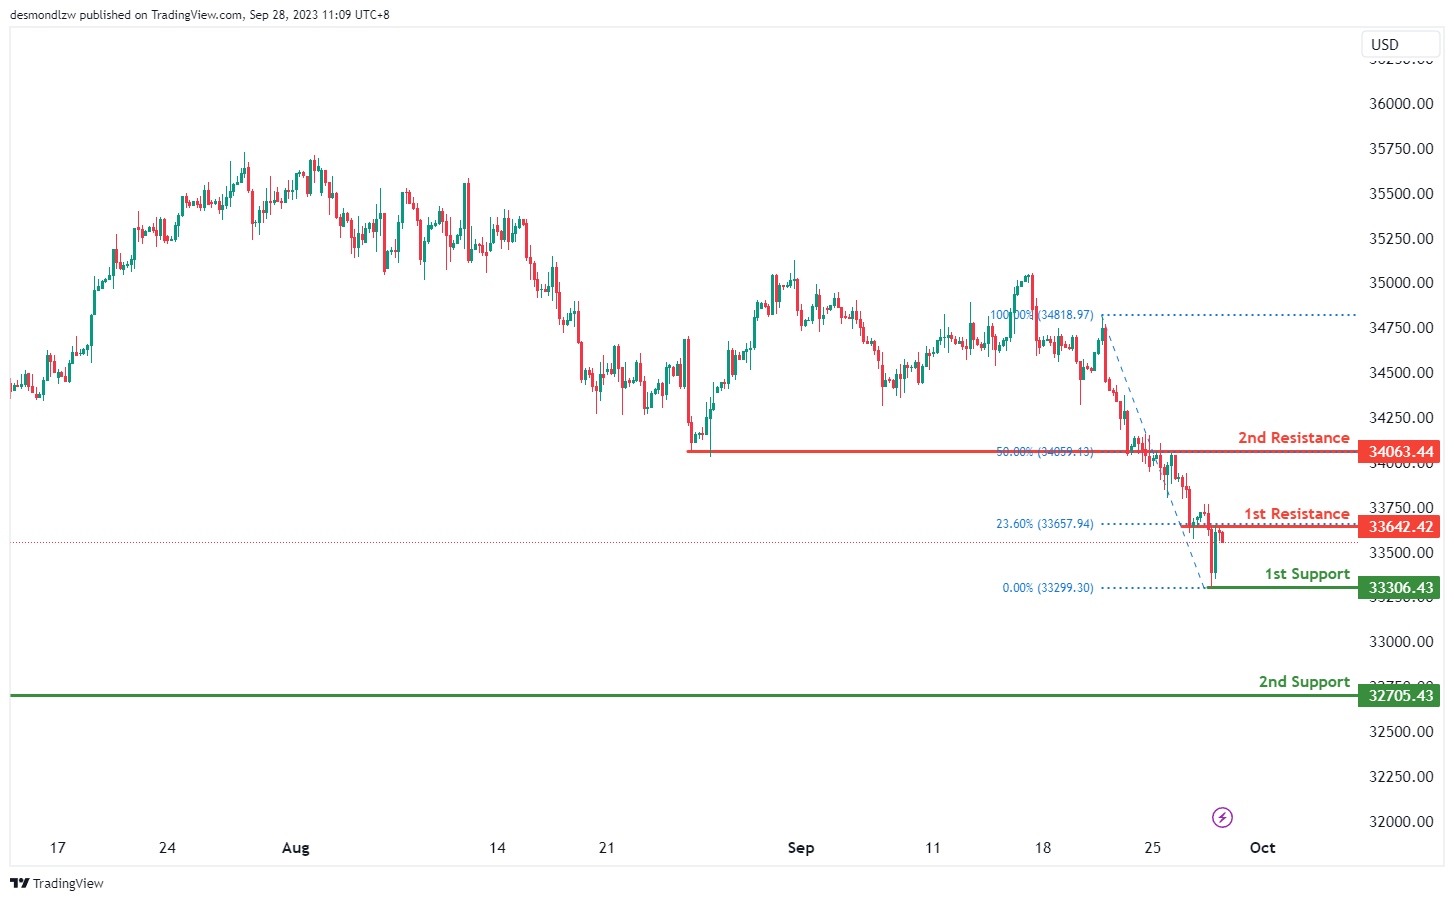
The DJ30, representing the Dow Jones Industrial Average, currently maintains a bearish overall momentum on the chart.
In the upcoming price action, there is potential for a bearish scenario, where the price of DJ30 may experience a bearish reaction upon approaching the 1st resistance level. Subsequently, it could decline, targeting the 1st support level.
The 1st support level, located at 33306.43, holds significance due to its historical role as a swing low support. This indicates that in the past, this level has acted as a substantial area of buying interest, potentially providing support and preventing further declines.
An intermediate support level is also noted at 32705.43, signifying a multi-swing low support. Such a support level carries weight as it suggests a history of multiple instances where buyers have intervened, reinforcing its significance as a potential area of price support.
On the resistance side, the 1st resistance is marked at 33642.42. This resistance level is justified by its status as an overlap resistance, indicating a point where selling pressure has historically emerged. Additionally, it aligns with the 23.60% Fibonacci Retracement level, further enhancing its significance as a potential area of resistance.
The 2nd resistance level, positioned at 34063.44, is also noteworthy, as it represents another overlap resistance.
GER30:
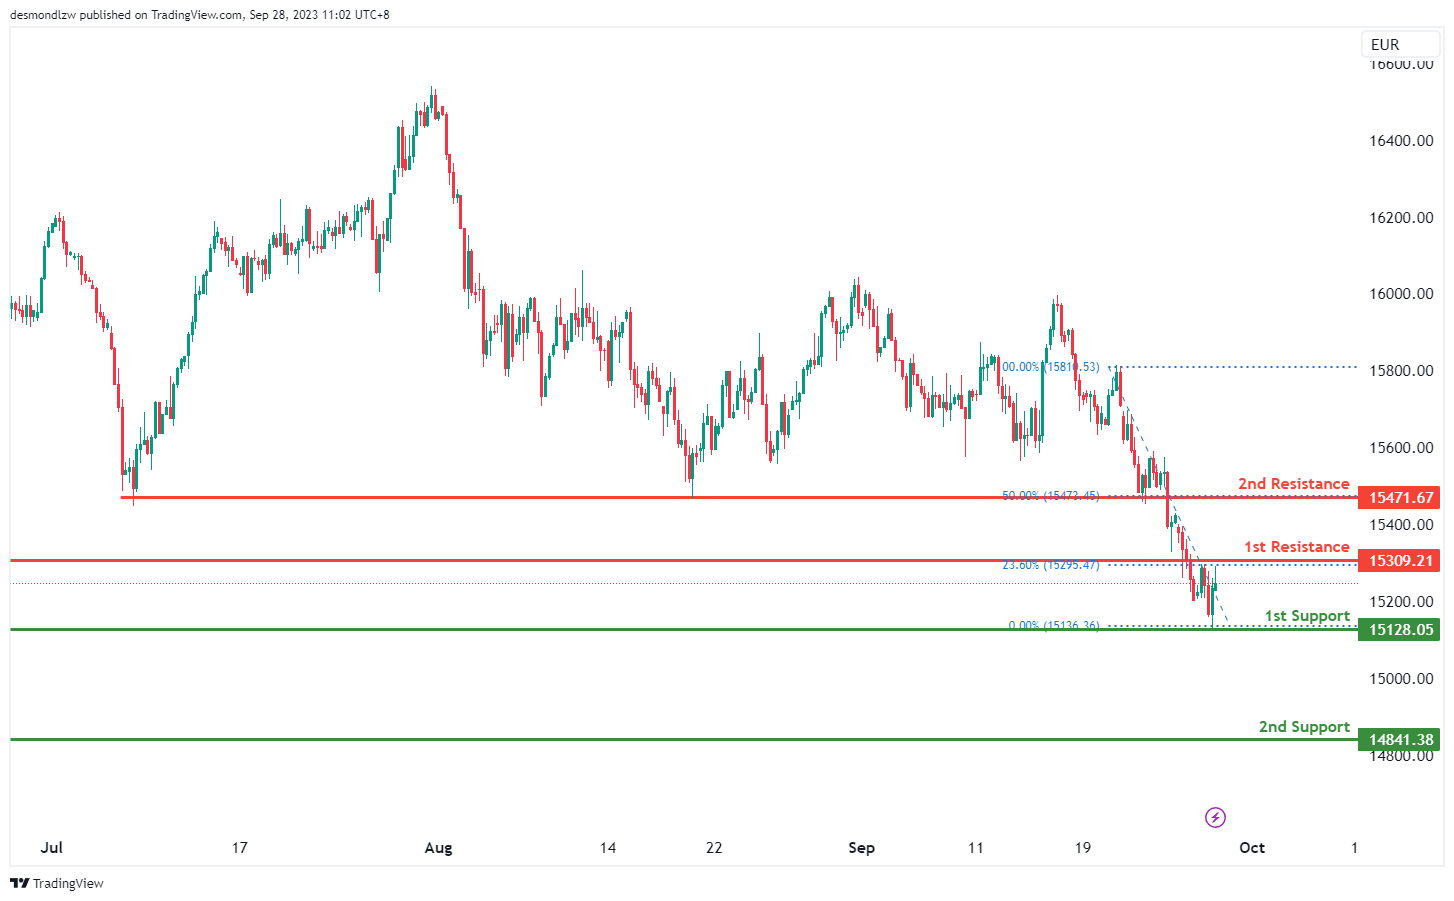
The GER30, representing the Germany 30 (DAX) index, currently exhibits a bearish overall momentum on the chart. There is a potential scenario in which the price may experience a bearish reaction upon reaching the 1st resistance level and subsequently decline towards the 1st support level.
The 1st support level, situated at 15128.05, holds significance as it represents a multi-swing low support. This level has historically acted as a strong area of buying interest, indicating a potential zone where buyers may step in to support the price.
Additionally, the 2nd support level at 14841.38 is worth noting, as it corresponds to a swing low support. Such support levels, particularly those with a history of multiple instances of buying activity, can be robust areas of price support.
On the resistance side, the 1st resistance level is marked at 15309.21. This resistance is justified by its role as a pullback resistance and aligns with the 23.60% Fibonacci Retracement level. This confluence of resistance factors enhances the significance of this level as a potential area where selling pressure may emerge.
The 2nd resistance level, positioned at 15471.67, is another notable level as it also represents a pullback resistance. Moreover, it coincides with the 50% Fibonacci Retracement level, reinforcing its importance as a potential area of strong selling interest.
US500
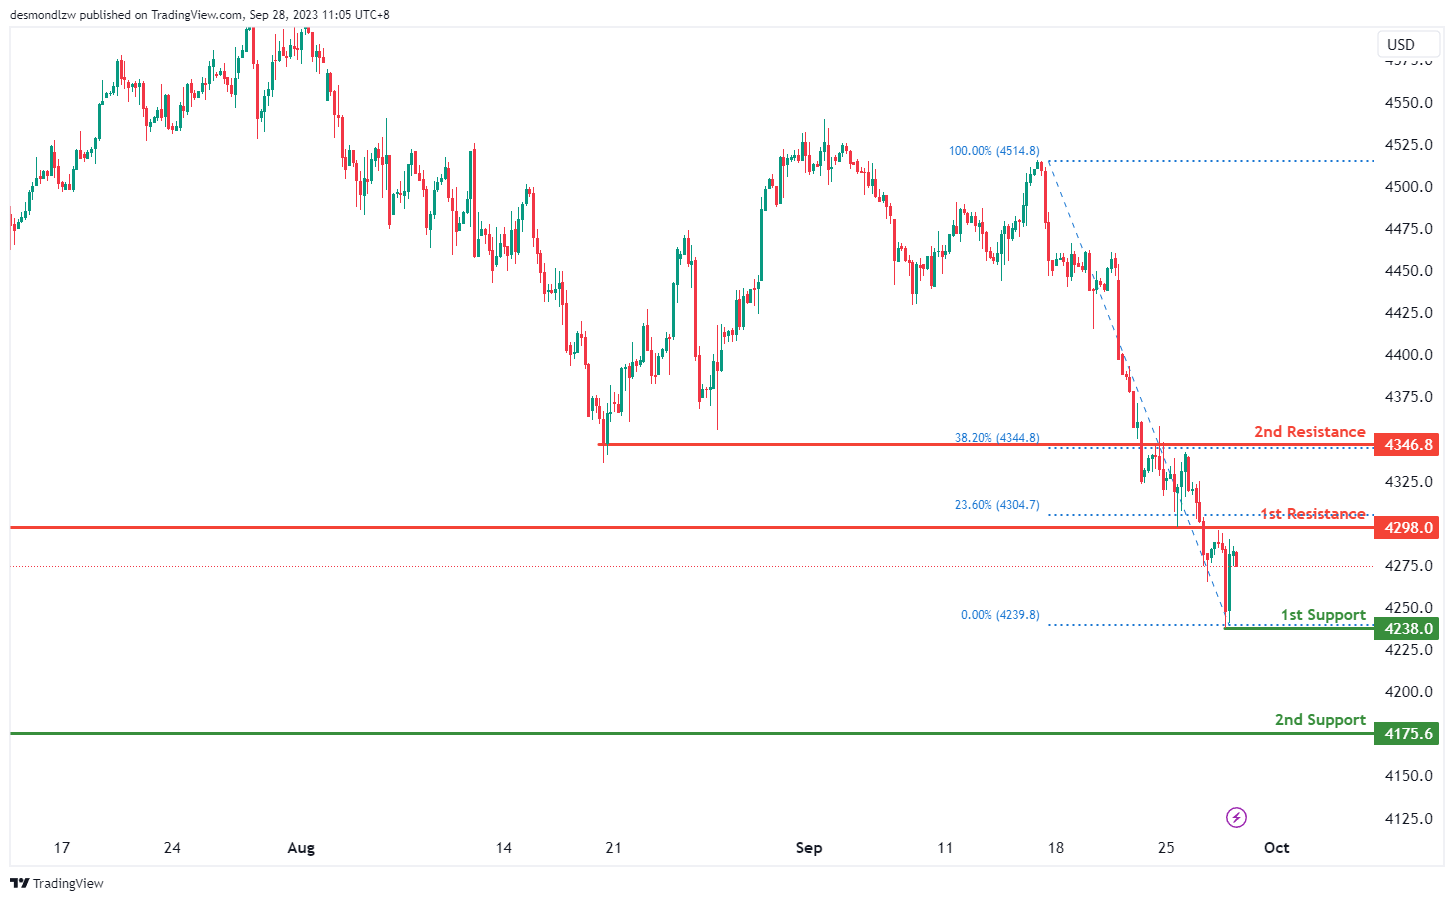
The US500 chart currently exhibits a bearish momentum, with contributing factors indicating a potential bearish continuation. Price action may target the 1st support level at 4238.0, which is characterized by a swing low support. This level could act as a key area where buyers may step in to provide some stability.
Further down, the 2nd support at 4175.6, also identified as a swing low support, represents an additional layer of potential support and could serve as a significant level if the bearish momentum persists.
On the upside, the 1st resistance level at 4298.0 presents a barrier to upward movement. This resistance is marked by a pullback resistance and is further strengthened by the presence of a 23.60% Fibonacci Retracement.
Beyond that, the 2nd resistance level at 4346.8 is characterized as an overlap resistance, with an additional confluence of a 38.20% Fibonacci Retracement, making it a potentially strong resistance area for any bullish attempts.
BTC/USD:
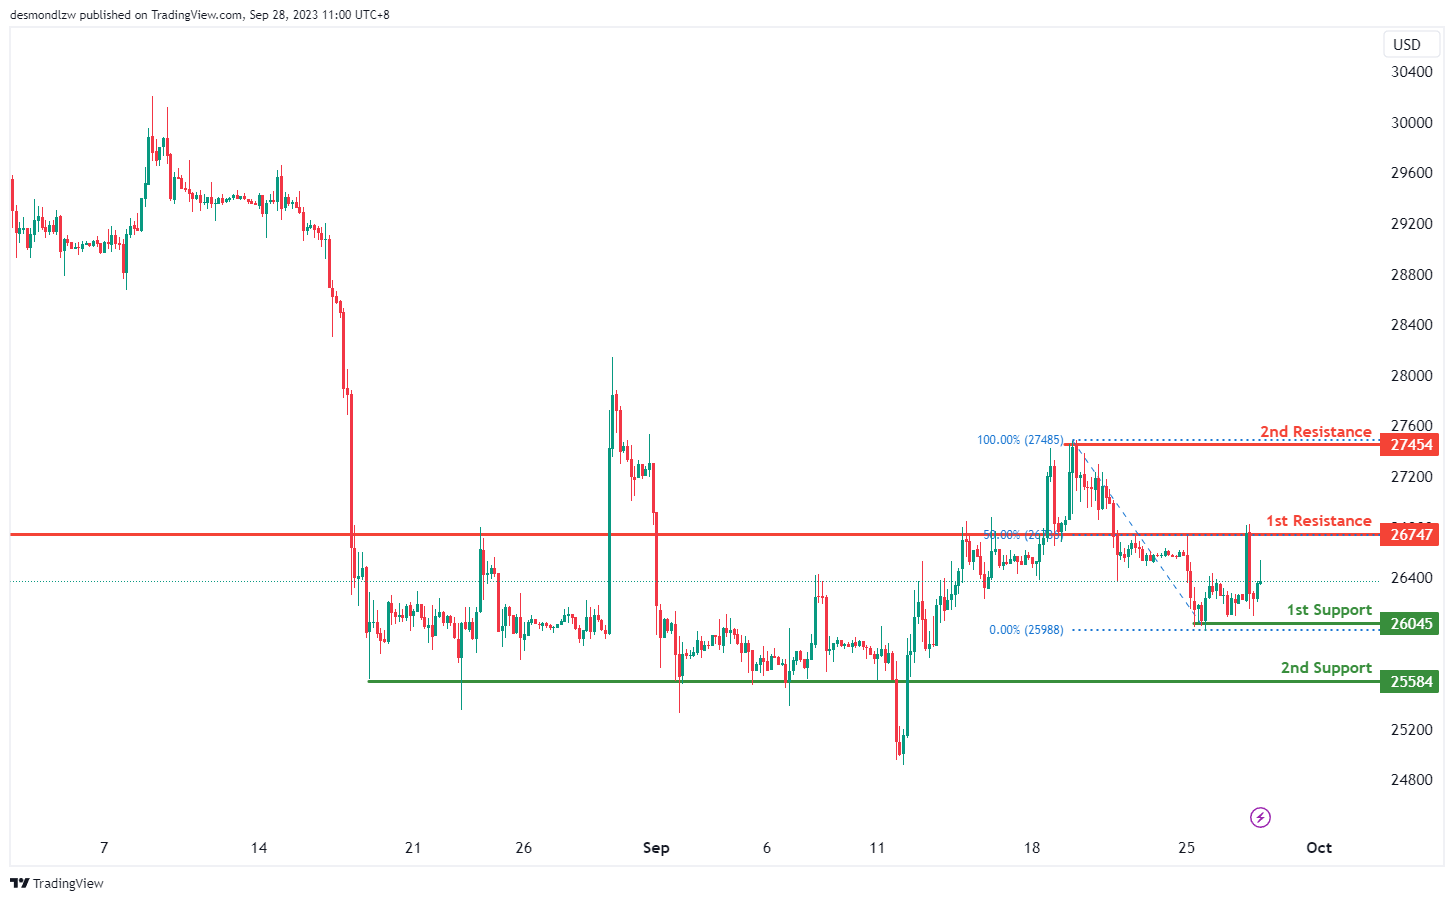
The instrument BTC/USD currently exhibits a neutral overall momentum on the chart, with factors contributing to this neutrality.
There’s a potential scenario where the price could fluctuate between the 1st resistance and 1st support levels.
The 1st support at 26045 is considered strong because it functions as a multi-swing low support, suggesting it has held up as a reliable support level in the past.
The 2nd support at 25584 is also noteworthy as it acts as a pullback support, indicating a level where buyers may step in.
On the resistance side, we have the 1st resistance at 26747, which is significant because it represents an overlap resistance and coincides with the 50% Fibonacci Retracement level. This makes it a formidable resistance level.
Furthermore, the 2nd resistance at 27454 is notable as it represents a swing high resistance.
ETH/USD:
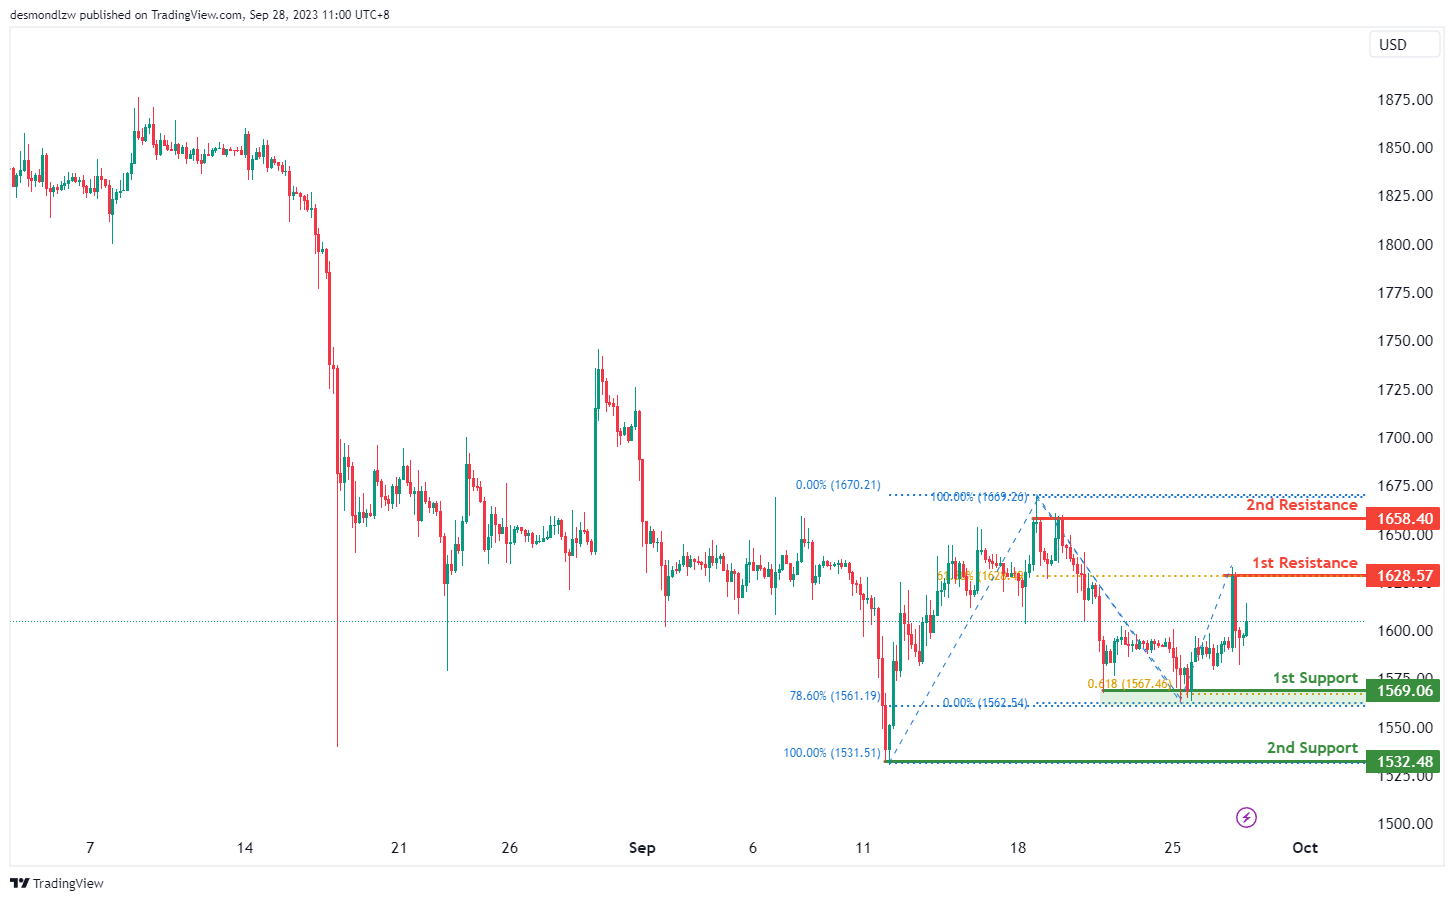
For the instrument ETH/USD, the overall momentum of the chart currently stands at a neutral position. This is supported by various factors contributing to this sense of neutrality.
In the foreseeable future, there is a potential scenario where the price of ETH/USD may exhibit a fluctuation pattern, primarily oscillating between the 1st resistance and the 1st support levels.
The 1st support level, quantified at 1569.06, holds significance due to several compelling reasons. Firstly, it functions as a multi-swing low support, signifying its historical importance as a level where buying interest has emerged. Moreover, this support level aligns with both the 61.80% Fibonacci Projection and the 78.60% Fibonacci Retracement levels, showcasing a robust Fibonacci confluence.
The 2nd support, situated at 1532.48, is noteworthy as well, being a swing low support. This implies that it has served as a substantial level of support in past price movements.
Conversely, on the resistance side, we have the 1st resistance marked at 1628.57. This resistance is substantiated by its role as a swing high resistance, historically capping further upward price movements.
Furthermore, the 2nd resistance positioned at 1658.40 carries significance as it represents a multi-swing high resistance.
WTI/USD:
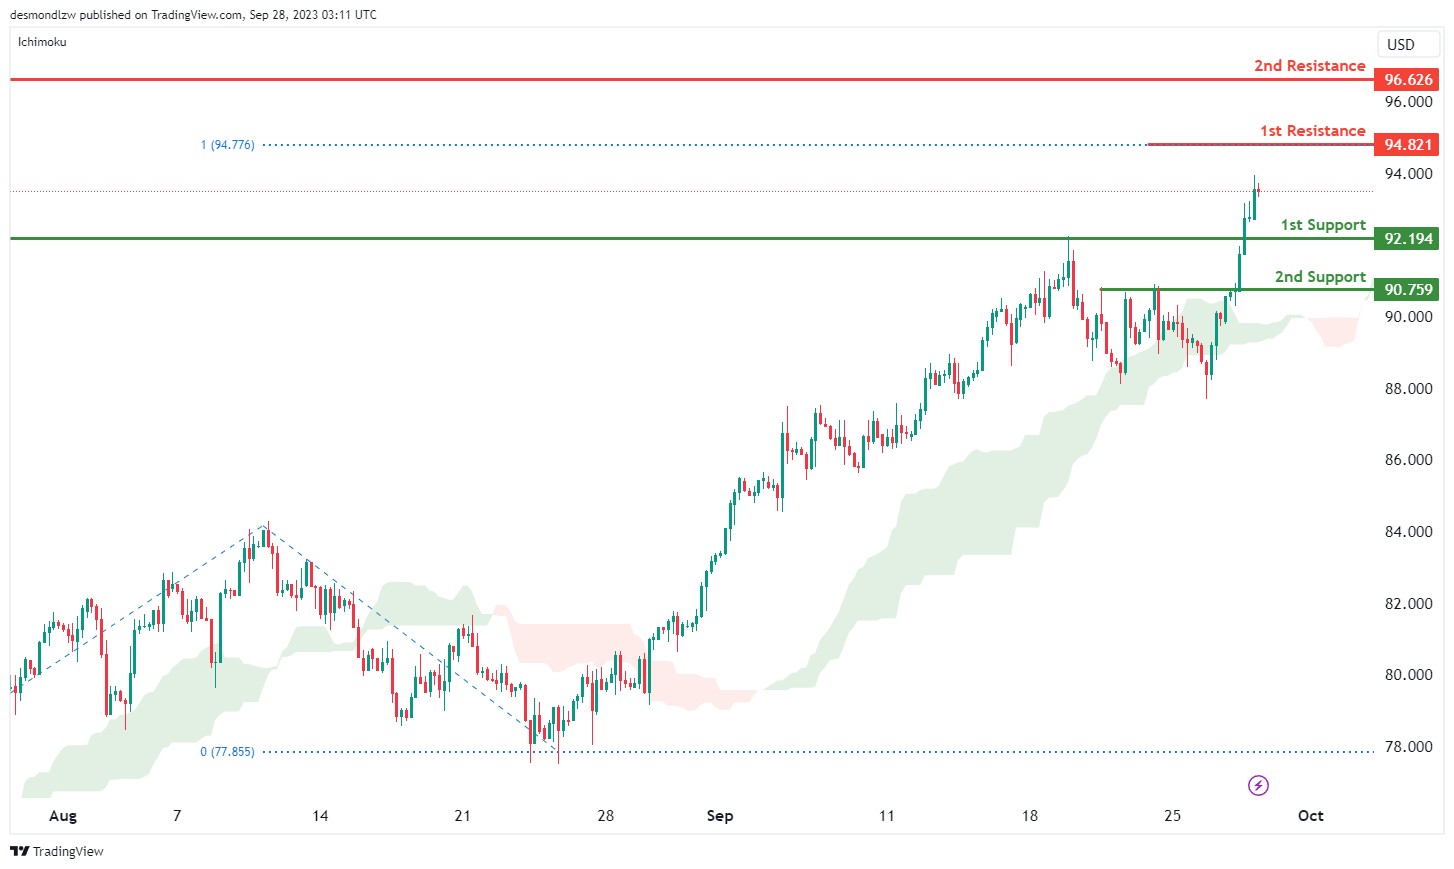
The WTI (West Texas Intermediate) chart currently exhibits a bullish momentum with price trading above the bullish Ichimouku cloud. There is a potential for price to make a bullish continuation towards the 1st resistance level.
The 1st resistance level at 94.82 is identified as a resistance level that aligns with the 100.00% Fibonacci projection level while the 2nd resistance level at 96.63 is noted as a swing-high resistance where price could run into a significant barrier.
To the downside, the 1st support level at 92.19 is identified as a pullback support while the 2nd support level at 90.76 is also marked as a pullback support, suggesting a potential strong support level in the past.
XAU/USD (GOLD):
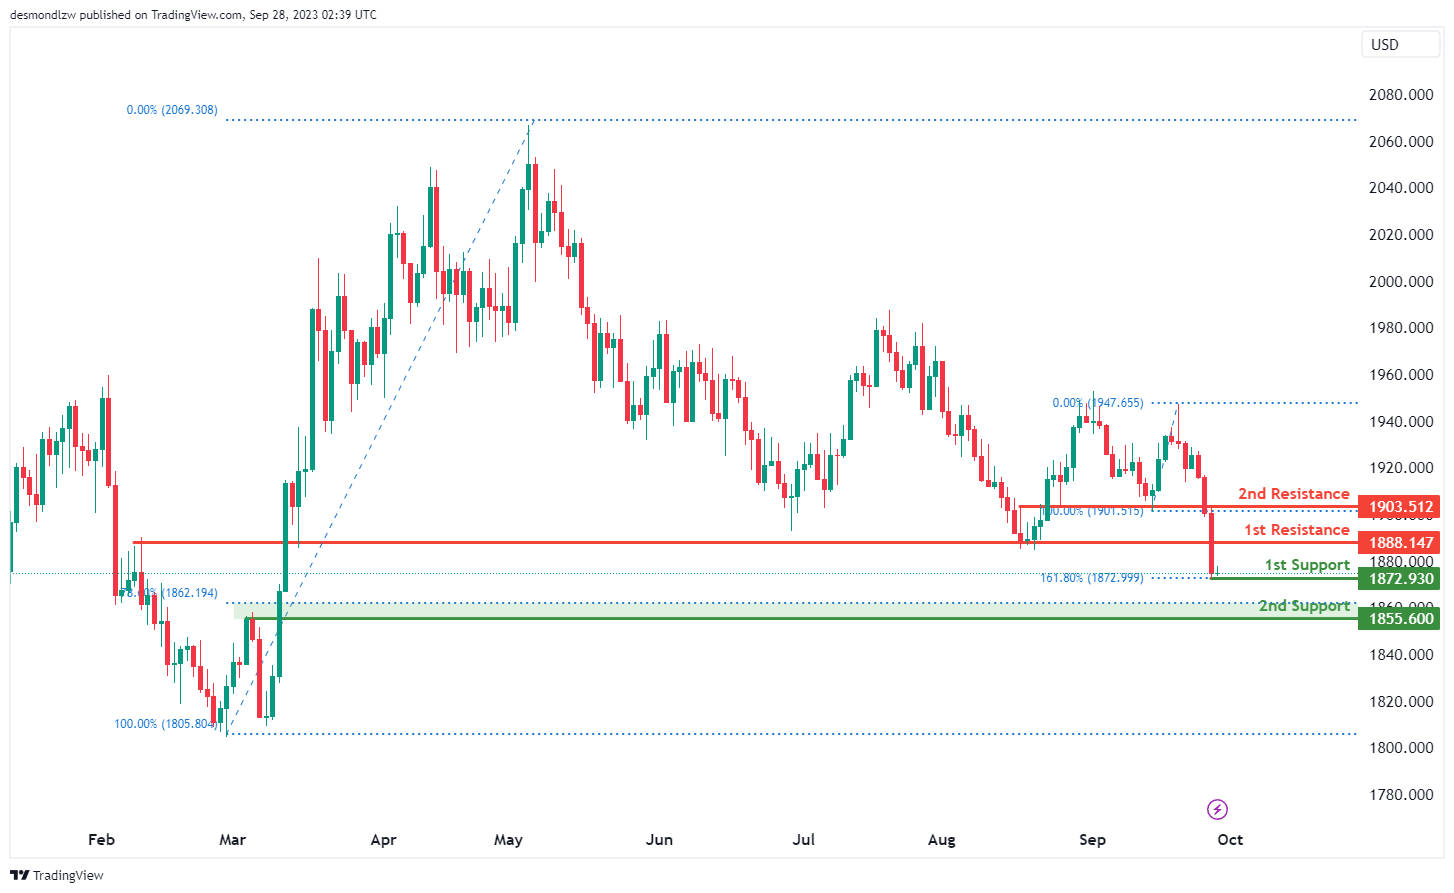
The XAUUSD chart currently has a weak bullish momentum with low confidence. A potential scenario is a bullish bounce off the 1st support at 1872.93, heading towards the 1st resistance at 1888.14. The 1st support is significant, aligning with the 161.80% Fibonacci Extension, making it a crucial level for potential upward movements. Additionally, the 2nd support at 1855.60 acts as a pullback support, with the 78.60% Fibonacci Retracement enhancing its role as a key support level.
On the resistance side, the 1st resistance at 1888.14 and the 2nd resistance at 1903.51 are both identified as pullback resistances, providing potential barriers to price increases.
Oil prices hit yearly high on shrinking inventories, WTI in march to 100
Oil prices saw a sharp ascent overnight, extending their gains into Asian trading session today and marking their highest point in over a year. With technical indicators pointing to a potential acceleration, WTI oil is on the march towards 100 psychological level.
A factor propelling this surge is the pronounced drop in US crude stocks, amplifying concerns about tightening global supply in light of OPEC+ production cuts, spearheaded by Saudi Arabia. Yesterday's data revealed that oil inventories dipped by -2.2m barrels last week, settling at 416.3m barrels.
Furthermore, the stockpiles at Cushing, Oklahoma, a crucial storage hub and the delivery point for US crude futures, saw a reduction of -943k barrels over the week, dropping to just under 22m barrels, lowest since July 2022. Significantly, these reserves at Cushing have been on decline for seven consecutive weeks. Many market participants view these current levels as bordering on the minimum required for operational functionality of the storage tanks.
Technically, WTI crude oil's recent up trend resumed after brief consolidations and surged through 95 handle. There is sign of upside acceleration with break of the rising channel resistance. Near term outlook will stay bullish as long as 88.67 support holds. Next target is 50% retracement of 131.82 to 63.67 at 97.74. Decisive break there could pave the way through 100 psychological to 61.8% retracement at 105.78.
NZD/USD Could Rally If It Clears This Resistance, US GDP Next
Key Highlights
- NZD/USD is attempting a recovery wave above the 0.5920 level.
- A major bearish trend line is forming with resistance near 0.5950 on the 4-hour chart.
- EUR/USD is accelerating lower toward the 1.0500 level.
- The US Gross Domestic Product could grow 2.1% in Q2 2023.
NZD/USD Technical Analysis
The New Zealand Dollar started a fresh decline from the 0.5985 resistance against the US Dollar. NZD/USD traded below the 0.5950 support to enter a bearish zone.
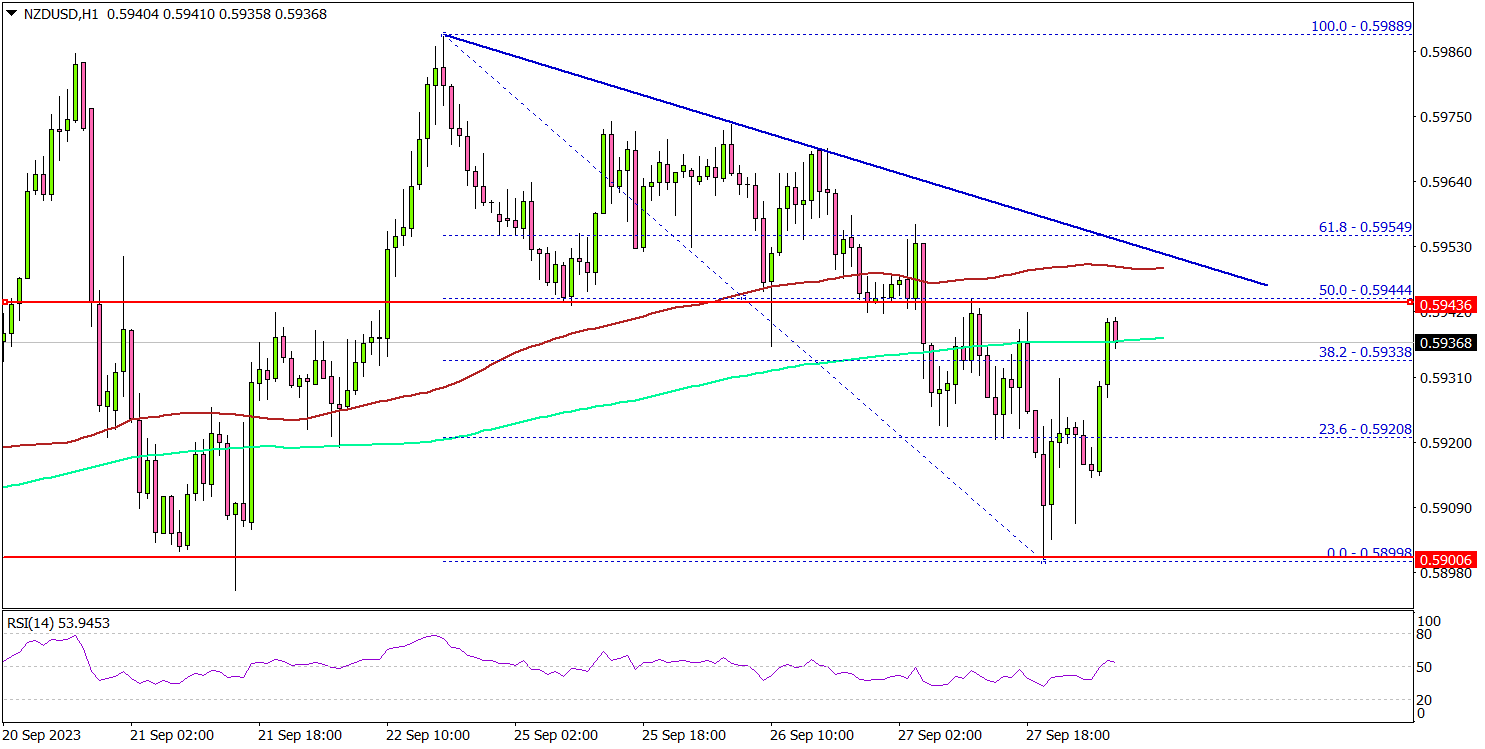
Looking at the 4-hour chart, the pair settled below the 0.5940 level, the 100 simple moving average (red, 4 hours), and the 200 simple moving average (green, 4 hours).
It traded as low as 0.5899 and recently started a minor upside correction. There was a move above the 0.5920 level. The pair is now facing resistance near the 0.5945 level and the 100 simple moving average (red, 4 hours).
There is also a major bearish trend line forming with resistance near 0.5950 on the same chart. A close above 0.5950 could start a steady increase toward 0.5985.
Any more gains might send NZD/USD toward the 0.6050 resistance. On the downside, initial support is near the 0.5920 level. The next key support is seen near the 0.5885 level, below which it could test 0.5850. Any more losses might send the pair toward the 0.5800 level.
Looking at EUR/USD, the pair remained in a bearish zone and might continue to move down below the 1.0500 level.
Economic Releases
- US Initial Jobless Claims - Forecast 215K, versus 201K previous.
- US Gross Domestic Product for Q2 2023 – Forecast 2.1% versus previous 2.1%.