

Sample Category Title
USD/CHF Mid-Day Outlook
Daily Pivots: (S1) 0.9130; (P) 0.9145; (R1) 0.9174; More....
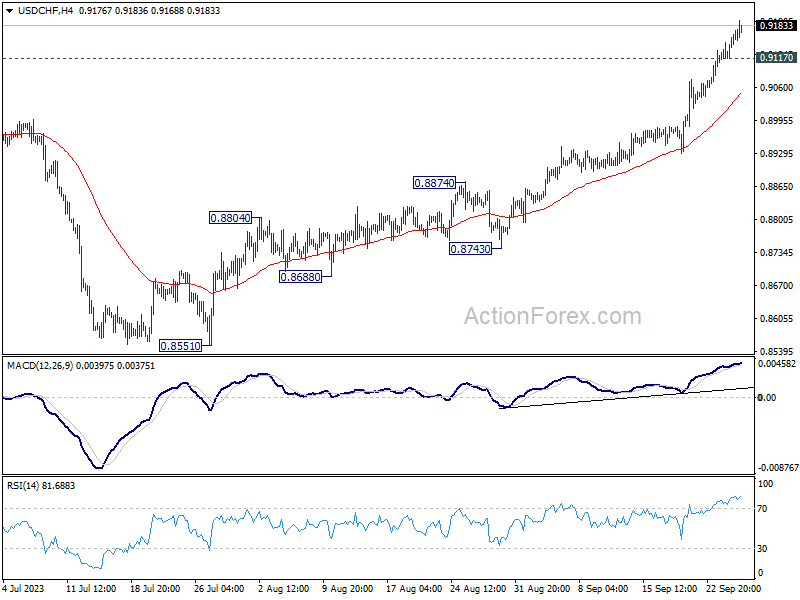
Intraday bias in USD/CHF stays on the upside at this point. Current rally should target 0.9439 resistance next. On the downside, below 0.9117 minor support will turn intraday bias neutral and bring consolidations, before staging another rally.
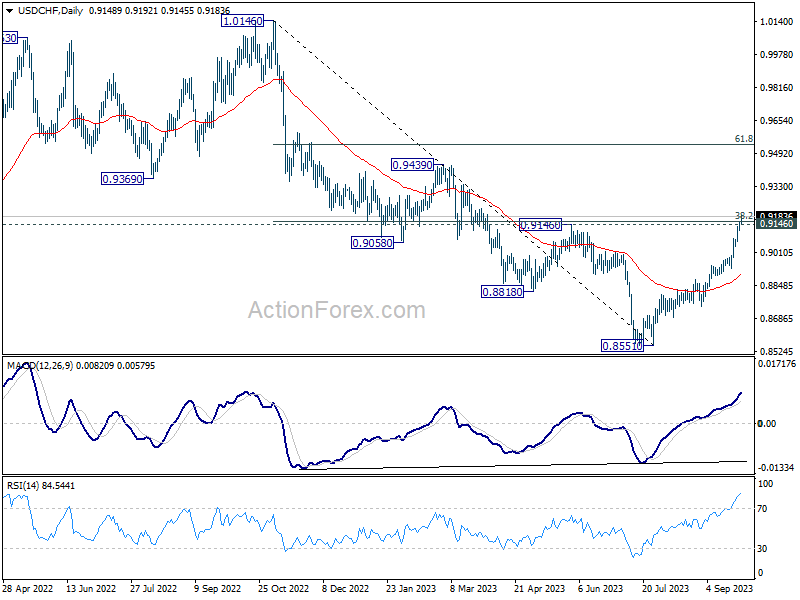
In the bigger picture, sustained trading above 0.9146 cluster resistance (38.2% retracement of 1.0146 to 0.8551 at 0.9160) will argue that rise from 0.8551 is reversing whole down trend from 1.0146. Further rally would then be seen to 61.8% retracement at 0.9537 and above. For now, this will be the favored case as long as 55 D EMA (now at 0.8905) holds.
GBP/USD Mid-Day Outlook
Daily Pivots: (S1) 1.2134; (P) 1.2175; (R1) 1.2198; More...
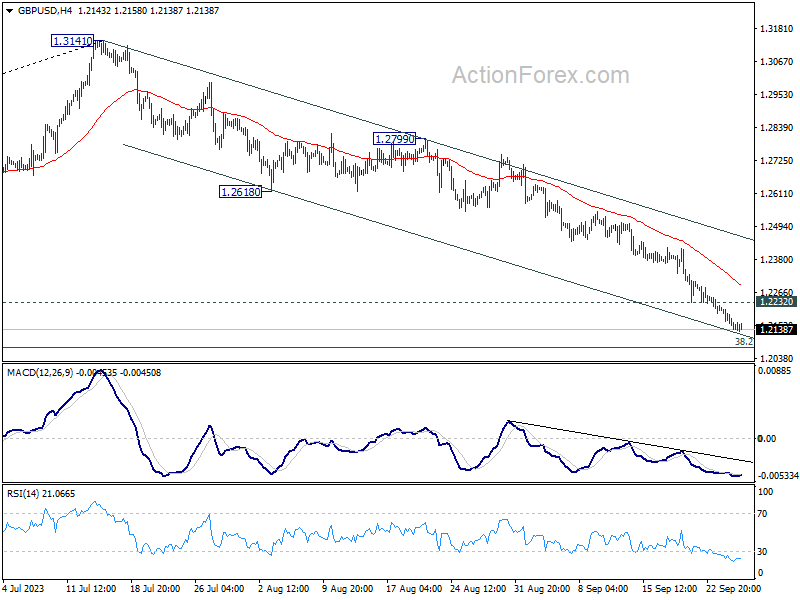
GBP/USD's decline is still in progress and intraday bias stays on the downside. Fall from 1.3141 should target 1.2075 fibonacci level. Decisive break there would carry larger bearish implication and target 1.1801 support next. On the upside, above 1.2232 minor resistance will turn intraday bias neutral and bring consolidations. But near term outlook will stay bearish as long as 1.2618 support turned resistance holds, in case of strong recovery.
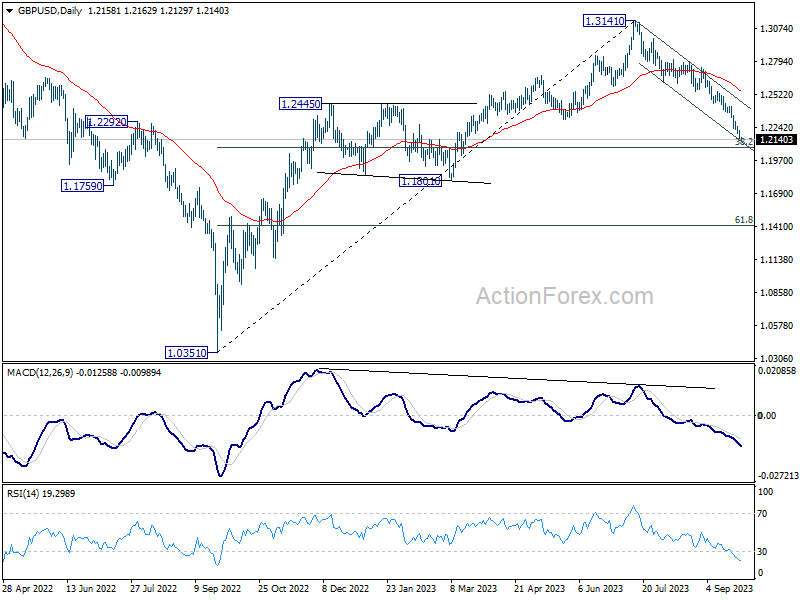
In the bigger picture, fall from 1.3141 medium term top could still be a correction to up trend from 1.0351 (2022 low) only. But risk of complete trend reversal is rising. Sustained break of 38.2% retracement of 1.0351 to 1.3141 at 1.2075 will pave the way to 61.8% retracement at 1.1417. For now, risk will stay on the downside as long as 55 D EMA (now at 1.2541) holds, in case of rebound.
EUR/USD Mid-Day Outlook
Daily Pivots: (S1) 1.0553; (P) 1.0581; (R1) 1.0600; More...
Intraday bias in EUR/USD remains on the downside for the moment. Current fall from 1.1274 is in progress for 1.0515 support. Firm break there will pave the way to next fibonacci level at 1.0199. On the upside, above 1.0615 minor resistance will turn intraday bias neutral and bring consolidations. But outlook will stay bearish as long as 1.0764 support turned resistance holds.
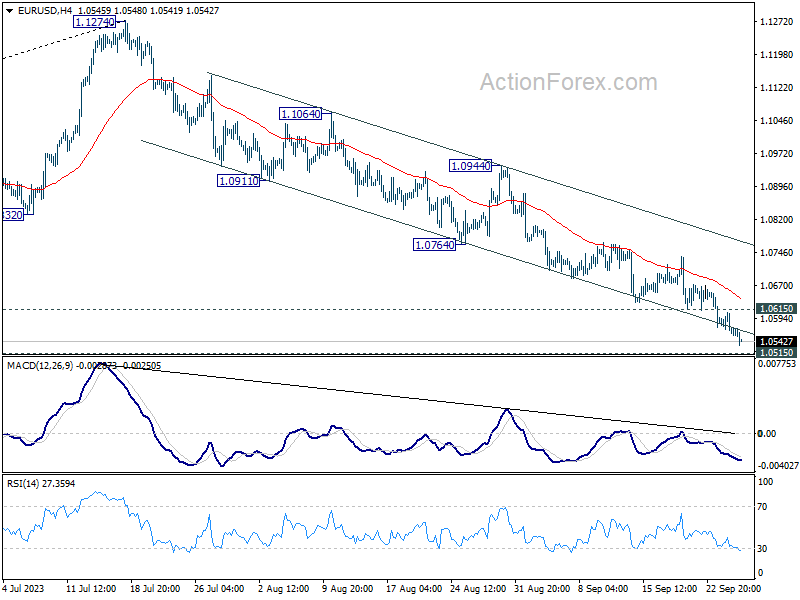
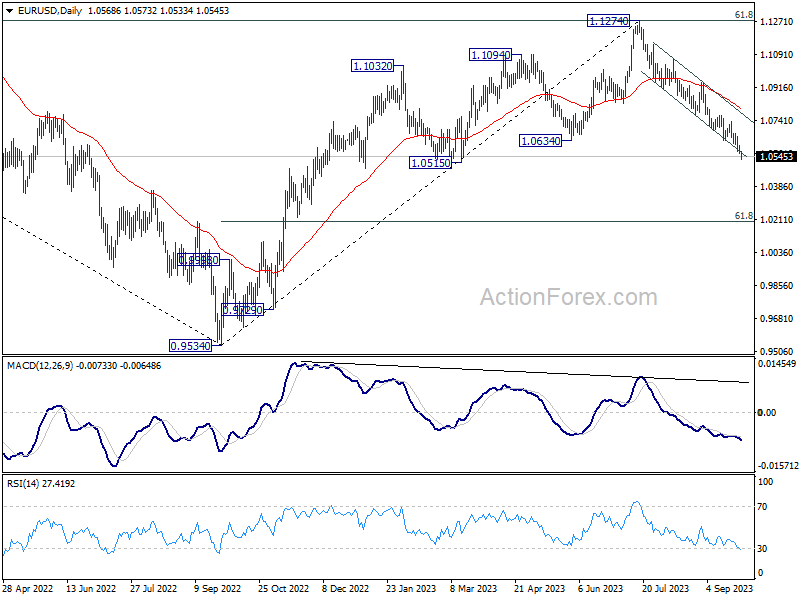
In the bigger picture, fall from 1.1274 medium term top could still be a correction to rise from 0.9534 (2022 low). But chance of a complete trend reversal is rising. In either case, firm break of 1.0515 support will target 61.8% retracement of 0.9534 to 1.1274 at 1.0199. For now, risk will stay on the downside as long as 55 D EMA (now at 1.0798) holds, in case of rebound.
Dollar Rises Further after Durable Goods Orders, Aussie Falters on Evergrande Crisis
Dollar rally shows no signs of stopping in early US session, and the greenback it buoyed slightly by stronger than expected data on durable goods orders. Yet, looming in the background is the potential for the fourth US government shutdown in the last ten years, a scenario that's only days away. Minneapolis Fed President Neel Kashkari weighed in on the situation, stating a shutdown could "slow the economy," suggesting that Fed "might then have to do less" to fight inflation. However, there's another side to the coin: a delay in the release of economic data could complicate Fed's decision-making process. All eyes are now turned to Washington, keenly observing the next moves.
In the wider currency markets, Australian Dollar is struggling, particularly after the news that China Evergrande Group's chairman has been put under police watch, as per Bloomberg reports. This adds another layer of uncertainty about the company's future, and by extension, impacts sentiment towards China's broader property sector, subsequently placing pressure on Aussie. European currencies are also navigating choppy waters, with Swiss Franc being notably weaker. Contrarily, Canadian Dollar trails just behind Dollar in terms of strength, followed by Japanese Yen.
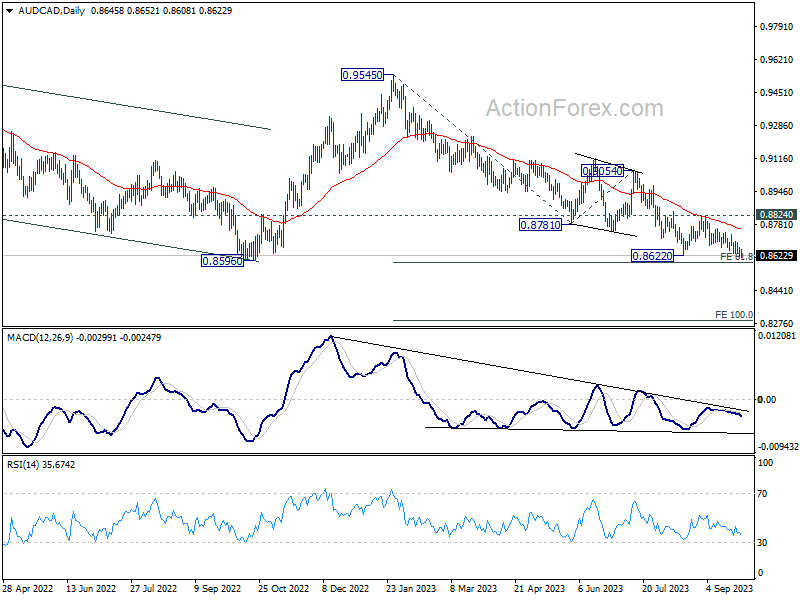
Technically, AUD/CAD is resuming recent down trend by breaking through 0.8622 support. Next target the key support zone between 0.8569 and 61.8% projection projection of 0.9545 to 0.8781 from 0.9054 at 0.8582. Decisive break there could prompt downside acceleration towards 100% projection at 0.8290. The unfolding scenario is intrinsically tied to sentiment shifts in China and the stability of oil prices, factors that will critically influence the pair's directional momentum.
In Europe, at the time of writing, FTSE is up 0.01%. DAX is down -0.01%. CAC is up 0.11%. Germany 10-year yield is down -0.0025 at 2.783. Earlier in Asia, Nikkei rose 0.18%. Hong Kong HSI rose 0.83%. China Shanghai SSE rose 0.16%. Singapore Strait Times dropped -0.47%. Japan 10-year JGB yield dropped -0.0062 to 0.740.
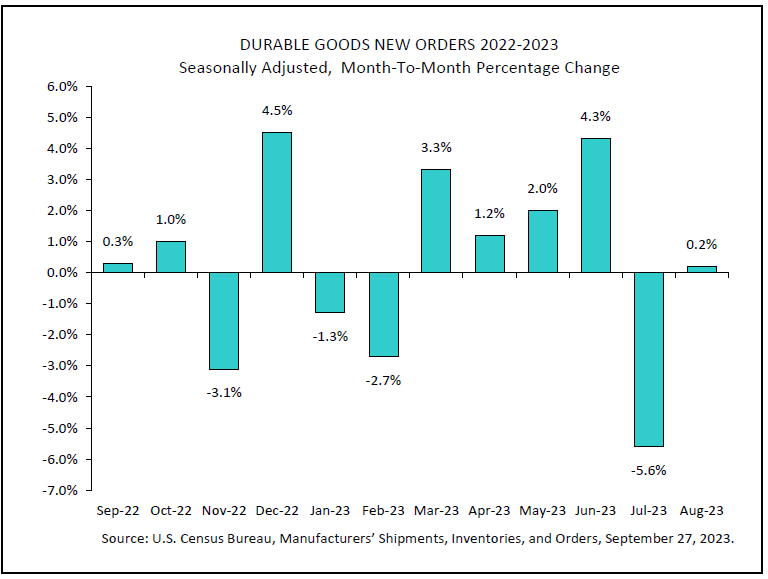
US durable goods orders rose 0.2% mom in Aug, above expectations
US durable goods orders rose 0.2% mom to USD 284.7B in August, much better than expectation of -0.4% mom decline.Ex-transport orders dropped rose 0.4% mom to USD 187.0B, above expectation of 0.2% mom. Ex-defense orders dropped -0.7% mom to USD 267.2B. Machinery rose 0.5% mom to USD 37.8B.
ECB's Elderson: Policy rates have peaked? Not necessarily
In an MNI interview, ECB Executive Board Member Frank Elderson responded to the speculation on whether interest rates have reached their pea. He noted, "Does that mean policy rates have peaked? Not necessarily. There is still a lot of uncertainty."
Elderson emphasized the efficacy of the decisions taken by ECB, remarking, "we consider that, with the decisions we've made and on the basis of our current assessment, the current interest rate levels will make a substantial contribution to us reaching our inflation target in the medium term."
Refraining from speculation, he underscored the bank's methodical approach: "we take these decisions meeting by meeting, on a data-dependent basis. Making any predictions about what we will do next would not be consistent with that approach."
Highlighting the challenges in the euro area's economic performance, Elderson revealed, "What we're seeing is a more protracted period of sluggish growth than we were expecting." He pointed out several contributing factors to this slowdown, including "lower demand for euro area exports, the impact of tighter financing conditions, lower residential and business investment, and the weakening services sector."
Yet, not all indicators spell caution. Offering a balanced view, Elderson noted the resilience in certain sectors. "On the other hand, labour markets are still strong and disposable income is expected to rise, which would have a stabilising effect on overall GDP growth."
German Gfk consumer sentiment fell to -26.5, chance of recovery probably fallen to zero
Germany's Gfk Consumer Sentiment for October fell from -25.6 to -26.5. In September, economic expectations rose from -6.2 to -3.4. Income expectations ticked up from -11.5 to -11.3. Propensity to buy rose slightly from -17.0 to -16.4. Propensity to save jumped from 0.5 to 8.0, highest since April 2011.
"This means that the chances of a recovery in consumer sentiment this year have probably fallen to zero," explains Rolf Bürkl, GfK consumer expert. "The reasons for this are a persistently high inflation rate due to sharply rising food and energy prices. Consequently, private consumption will not be able to positively contribute to overall economic development this year."
Australia's monthly CPI rose to 5.2%, led by housing and transport
Australia CPI for August rose from 4.9% yoy to 5.2% yoy, in line with market expectations.
Digging into the specifics, the sectors showing the most substantial annual gains were housing, which surged by 6.6%, followed by transport at 7.4%. Additionally, food and non-alcoholic beverages reported an increase of 4.4%. Notably, insurance and financial services marked the highest significant rise of 8.8%.
On the other hand, when considering CPI that excludes volatile items such as holiday travel, there was a slight dip from 5.8% yoy to 5.5% yoy. Meanwhile, the Annual trimmed mean CPI, which gives a clearer picture by removing the most volatile items, remained steady at 5.6% yoy.
BoJ minutes reveal diverging views on future policy direction
The minutes from BoJ meeting held on July 27 and 28 have unveiled differing perspectives among board members regarding the future direction of monetary policy. While a consensus was apparent on the immediate need to sustain ultra-low interest rates, members were divided on how to approach the medium to long term.
One member stated, "there was still a significantly long way to go before revising the negative interest rate policy, and the framework of yield curve control needed to be maintained".
The same member emphasized the importance of patience and consistency, suggesting that "it should carefully nurture the long-awaited signs of change in firms' behavior by patiently continuing with monetary easing."
Another participant weighed the risks of delaying versus hastening monetary tightening. In their perspective, the "risk of missing a chance to achieve the 2 percent target due to a hasty monetary tightening outweighed the risk of the inflation rate continuing to exceed 2 percent if monetary tightening fell behind the curve."
Yet another member presented a more optimistic outlook on the inflation target, noting that the "achievement of 2 percent inflation in a sustainable and stable manner seemed to have clearly come in sight." They further suggested that between January and March 2024, it might be feasible to evaluate the Bank's success in achieving the inflation target.
Despite the differences in outlook, BoJ decided to persist with its current easing policy settings but also opted to grant long-term borrowing costs more flexibility to rise.
EUR/USD Mid-Day Outlook
Daily Pivots: (S1) 1.0553; (P) 1.0581; (R1) 1.0600; More...
Intraday bias in EUR/USD remains on the downside for the moment. Current fall from 1.1274 is in progress for 1.0515 support. Firm break there will pave the way to next fibonacci level at 1.0199. On the upside, above 1.0615 minor resistance will turn intraday bias neutral and bring consolidations. But outlook will stay bearish as long as 1.0764 support turned resistance holds.
In the bigger picture, fall from 1.1274 medium term top could still be a correction to rise from 0.9534 (2022 low). But chance of a complete trend reversal is rising. In either case, firm break of 1.0515 support will target 61.8% retracement of 0.9534 to 1.1274 at 1.0199. For now, risk will stay on the downside as long as 55 D EMA (now at 1.0798) holds, in case of rebound.
Economic Indicators Update
| GMT | Ccy | Events | Actual | Forecast | Previous | Revised |
|---|---|---|---|---|---|---|
| 23:50 | JPY | BoJ Minutes | ||||
| 01:30 | AUD | Monthly CPI Y/Y Aug | 5.20% | 5.20% | 4.90% | |
| 06:00 | EUR | Germany Gfk Consumer Confidence Oct | -26.5 | -25.5 | -25.5 | -25.6 |
| 08:00 | CHF | Credit Suisse Economic Expectations Sep | -27.6 | -38.6 | ||
| 08:00 | EUR | Eurozone M3 Money Supply Y/Y Aug | -1.30% | -1.00% | -0.40% | |
| 12:30 | USD | Durable Goods Orders Aug | 0.20% | -0.40% | -5.20% | -5.60% |
| 12:30 | USD | Durable Goods Orders ex Transportation Aug | 0.40% | 0.20% | 0.40% | |
| 14:30 | USD | Crude Oil Inventories | -0.7M | -2.1M |
US durable goods orders rose 0.2% mom in Aug, above expectations
US durable goods orders rose 0.2% mom to USD 284.7B in August, much better than expectation of -0.4% mom decline.Ex-transport orders dropped rose 0.4% mom to USD 187.0B, above expectation of 0.2% mom. Ex-defense orders dropped -0.7% mom to USD 267.2B. Machinery rose 0.5% mom to USD 37.8B.
WTI’s Rally May Recharge Near $93
Global markets are in sell-off mode, but oil has quickly recovered and is rising for the second day after a shallow correction. The dollar index added for the 11th week in a row – one of the most persistent rallies in its history. But oil has been in a rally for even longer – 13 weeks – adding 35%, albeit with brief interruptions.
The rising dollar is putting pressure on the markets, and it’s easy to see this in key stock indices and even gold. Oil often falls with an even greater amplitude than stocks or other commodities.
But in recent weeks, oil has been aided by geopolitics, which has helped it climb in the form of tighter monetary policy and a slowdown in consumption in most countries.
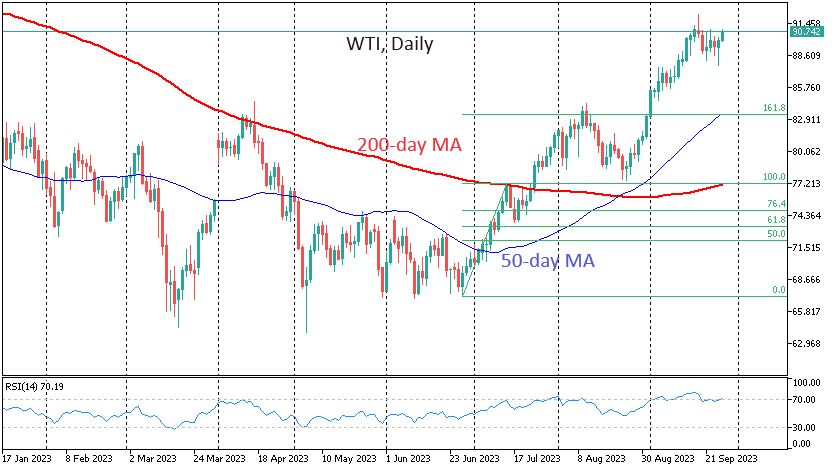
The rise since the end of June can be divided into several phases with brief corrections at the end. The increase in the price of a barrel of WTI from $67 to $77 was the first stage. The second stage lost strength in early August on the approach to $84, fitting nicely into a Fibonacci pattern with a 161.8% rise from the first impulse. The corrective pullback was halted on the path to the previous peak.
The next milestone is reaching 261.8% of the first impulse, just above $93. Last year’s October and November peaks are located near the same level. We should expect a significant intensification of the struggle between bulls and bears on the approach to this level. Large speculative buyers may want to lock in profits at the end of the month and quarter after a stunning rally against the general market weakening. This will also let off steam in an overheated market, making it attractive to new buyers.
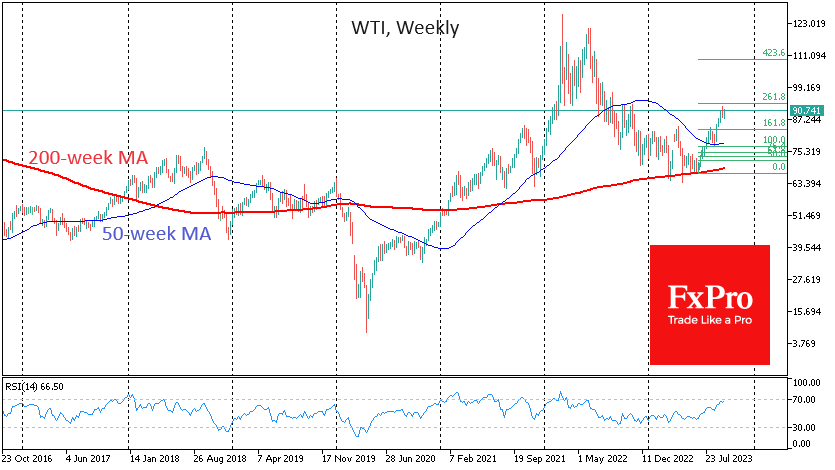
That said, we believe in oil’s long-term bullish outlook given its strong support from the market and authorities on touching crucial technical levels – the 200- and 50-week moving averages. This promises the world a prolonged fight against inflation, which must be fought through slowing demand, not by falling prices of the key commodity. We got the same signal in 2019, but COVID-19 provided a historic chance for bulls to buy even lower.
EUR/GBP in Extended Sideways Mode and Looks for Fresh Direction Signal
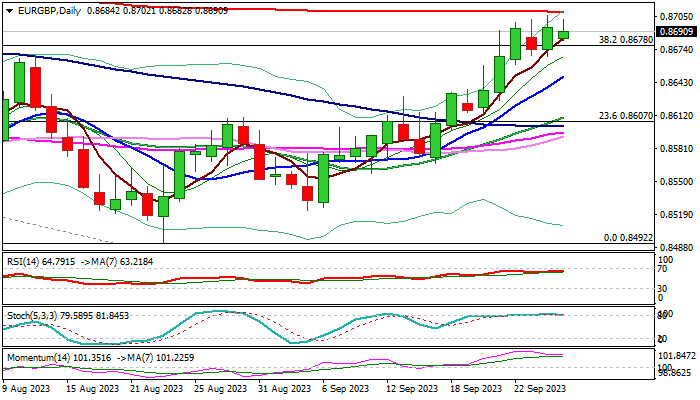
EURGBP keeps bullish stance but a multiple failure under 200DMA (0.8709) warn that bulls face strong headwinds and keep larger rally on hold.
The price has stayed below 200DMA indicator since early May that adds to signals of stall, as bullish momentum on daily chart is fading, stochastic is overbought and candlesticks of past four days have long upper shadows.
On the other hand, the downside was so far protected by broken Fibo 38.2% / 200WMA (0.8678), keeping the near-term action within a consolidation range and without clear direction.
Firm break of this support would generate initial bearish signal and open way for deeper correction towards 0.8650/0.8600 zone.
Neutral scenario prolonged sees sideways mode between 200DMA and 200WMA, while clear break of 200DMA pivot would generate initial signal of bullish continuation and expose targets at 0.8735 (50% retracement of 0.8978/0.8492) and 0.8763 (weekly cloud base).
Res: 0.8709; 0.8735; 0.8763; 0.8792.
Sup: 0.8678; 0.8648; 0.8610; 0.8596.
Australian Dollar’s Decline Continues
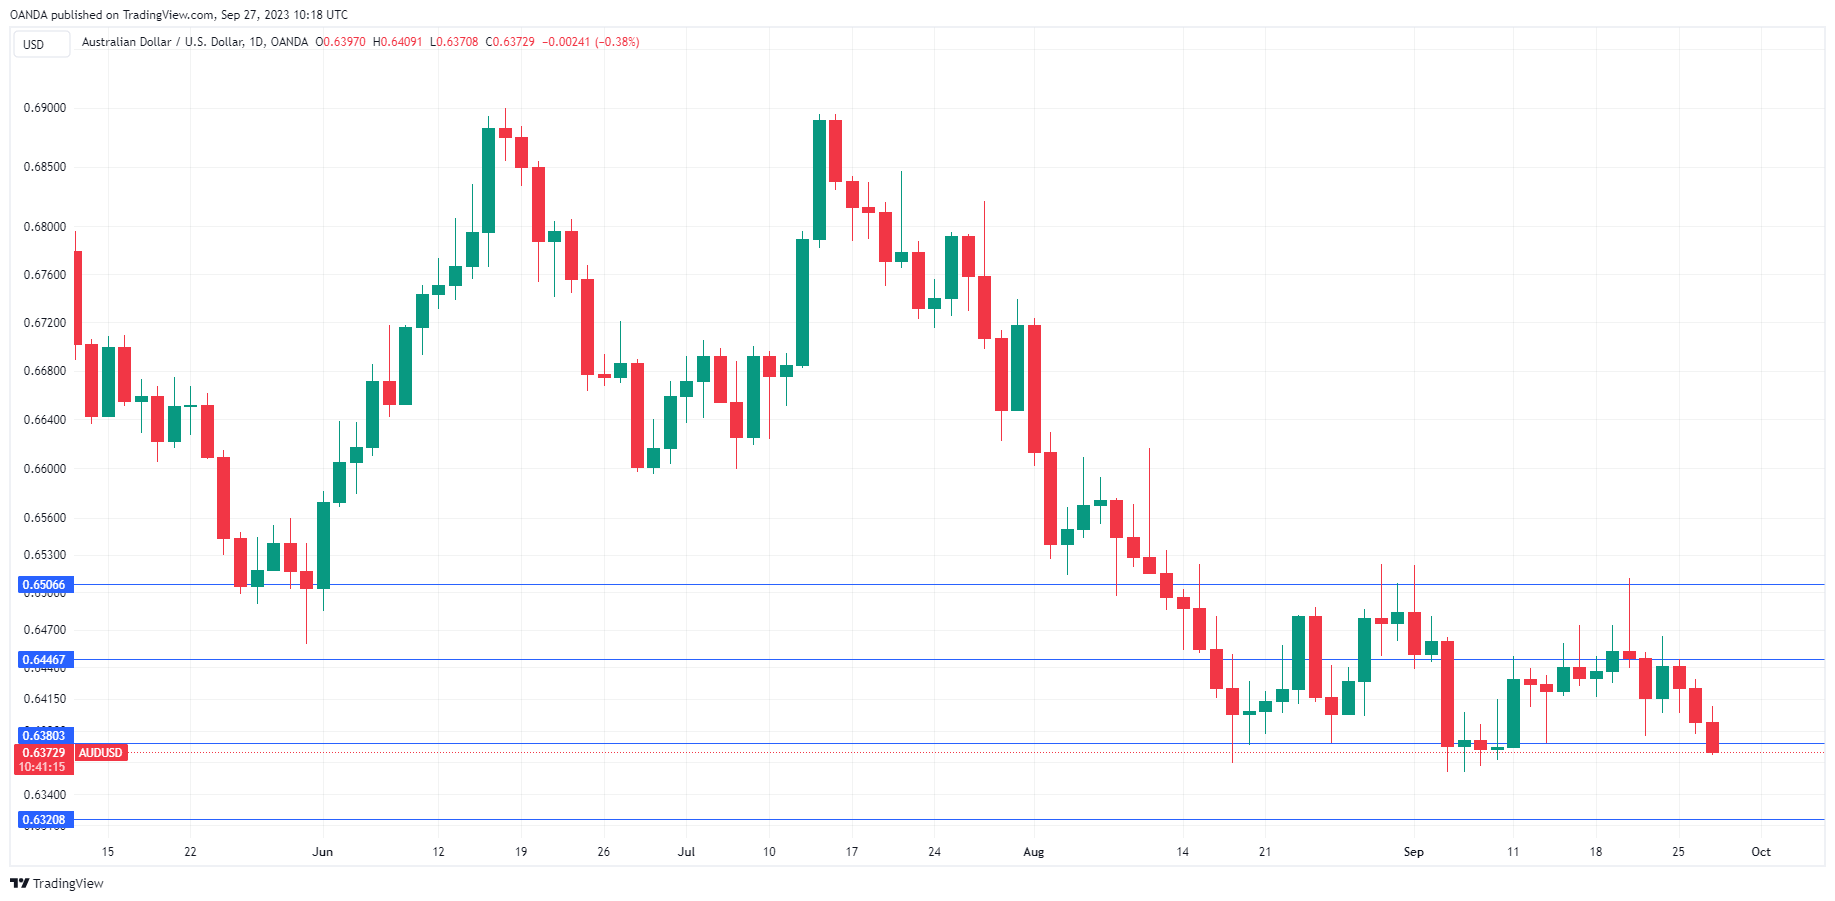
The Australian dollar has extended its losses on Wednesday and has dropped 1% on the week. In the European session, AUD/USD is trading at 0.6374, down 0.35%. The Australian dollar finds itself perilously close to 0.6357, an 11-month low.
Australian inflation rises due to higher fuel costs
Australia’s inflation rate rose 5.2% y/y in August, up from 4.9% y/y in July and matching the consensus estimate. This marked the first acceleration in inflation since April, due in large part to higher fuel prices, which also contributed to a high monthly reading of 0.8%, up from 0.3% in July. A key core inflation indicator eased to 5.5% y/y, down from 5.8% y/y in July.
The inflation data didn’t have much of an effect on the markets, which are widely expecting a fourth straight pause from the Reserve Bank of Australia in October. The markets are viewing the uptick in inflation as a temporary blip and expect the overall downward trend to continue, with expectations for a rate hike in May 2024.
The RBA meets next week, the first meeting since Michelle Bullock took over as the RBA Governor. Bullock has stressed that the door is open to further rate hikes and rate decisions will depend on the data. This stance is not surprising as the central bank does not want to state that rates have peaked while inflation remains well above the 2% inflation target. I expect the RBA to reiterate this view at the meeting.
A key question is whether Bullock will stick to hawkish rhetoric but continue to pause, or will she deliver one final rate hike before the end of the year. That decision will largely be based on economic data, such as the third-quarter inflation report in the last week of October.
AUD/USD Technical
- AUD/USD is testing support at 0.6380. The next support line is 0.6320
- There is resistance at 0.6446 and 0.6506
Gold Tumbles Below 1,900 But Looks Oversold
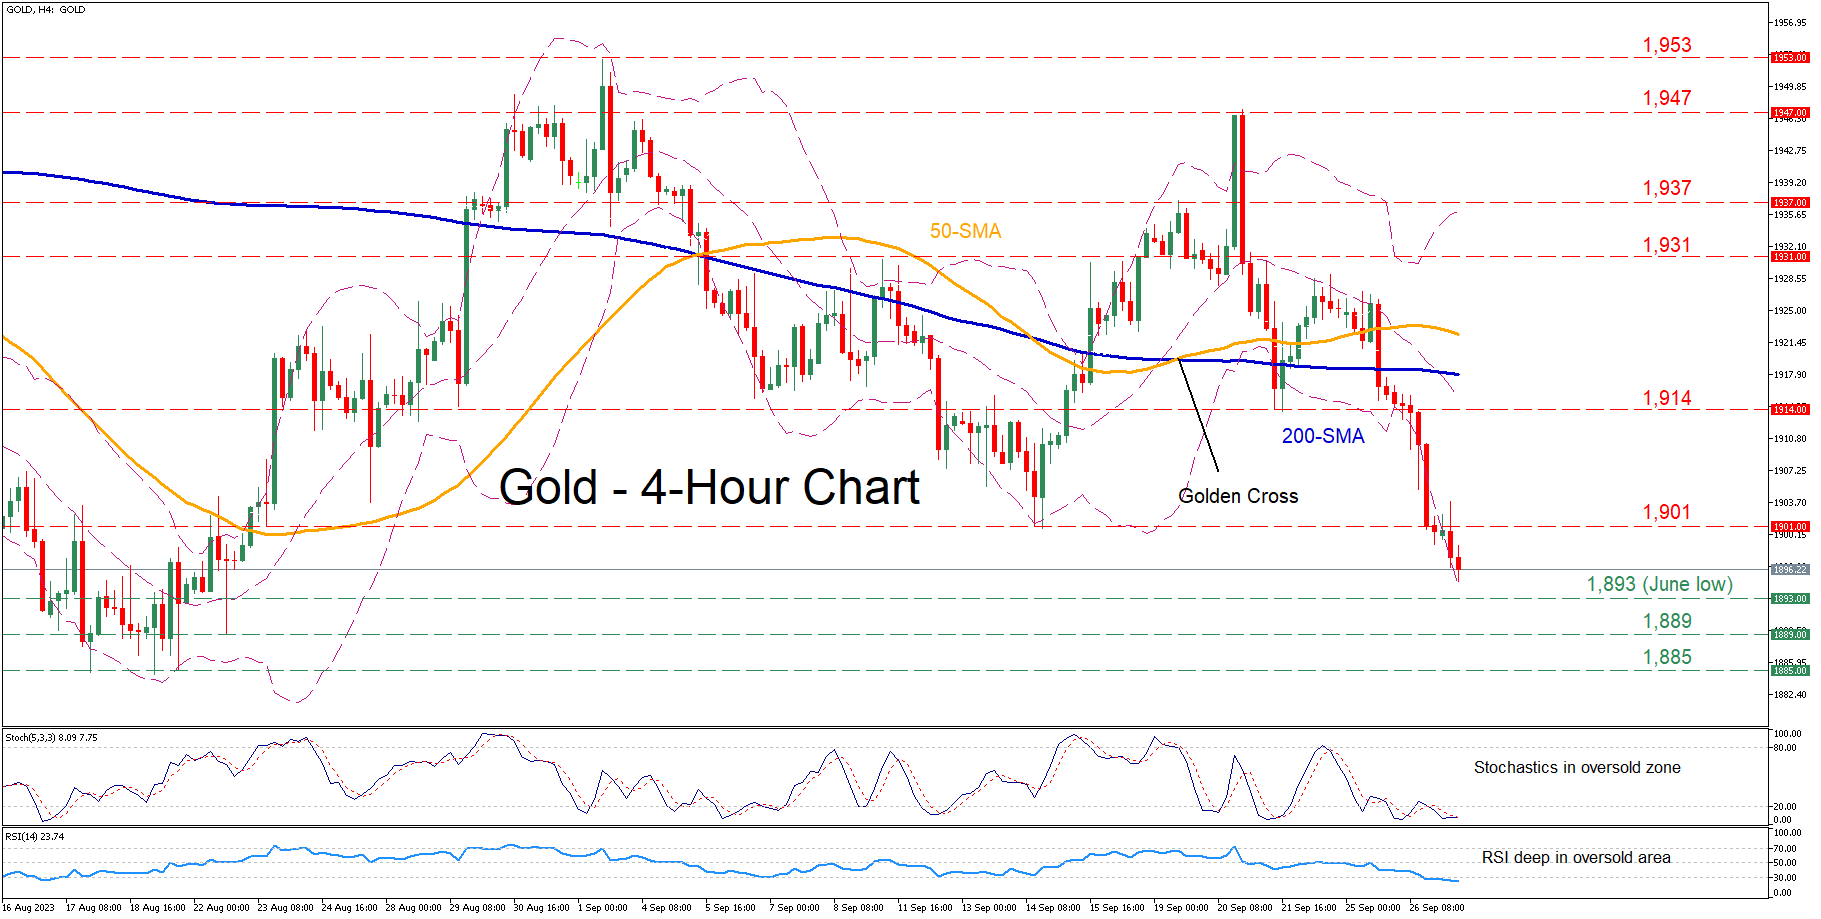
- Gold retreats below the 1,900 handle to its lowest level in a month
- Decline shows no signs of easing, while widening Bollinger bands point to high volatility
- Momentum indicators deep in their oversold territories, hinting at potential bounce
Gold has been in a solid downtrend in the four-hour chart, violating both its 50- and 200-period simple moving averages (SMAs) and falling below the 1,900 psychological mark. However, the short-term oscillators currently suggest that the dip could be overstretched, thus a rebound should not be ruled out.
If the bears attempt to push the price lower, immediate support could be met at the June low of 1,893. Falling to halt there, bullion could descend towards the August support of 1,889. Further declines may then cease at the August bottom of 1,885, which is the lowest level observed since March.
Alternatively, an imminent bounce might initially stall at the September support of 1,901, which might serve as resistance in the future. Surpassing that region, the price could face 1,914 ahead of the September resistance of 1,931.
All in all, gold seems to be under relentless downside pressure, which has pushed the price into oversold conditions. Can the bulls strike back?
EUR/USD Takes Hit While USD/CHF Surges
EUR/USD started a fresh decline below the 1.0615 support. USD/CHF is rising and might aim a move toward the 0.9220 resistance.
Important Takeaways for EUR/USD and USD/CHF Analysis Today
- The Euro struggled to clear the 1.0670 resistance and declined against the US Dollar.
- There is a major bearish trend line forming with resistance near 1.0585 on the hourly chart of EUR/USD at FXOpen.
- USD/CHF is gaining pace above the 0.9135 resistance zone.
- There is a key bullish trend line forming with support near 0.9150 on the hourly chart at FXOpen.
EUR/USD Technical Analysis
On the hourly chart of EUR/USD at FXOpen, the pair failed to clear the 1.0670 resistance. The Euro started a fresh decline below the 1.0615 support against the US Dollar, as mentioned in the previous analysis.
There was a move below the 50-hour simple moving average and 1.0600. The bears were able to push the pair below the 1.0585 pivot level. The pair traded as low as 1.0556 and is currently showing a lot of bearish signs.
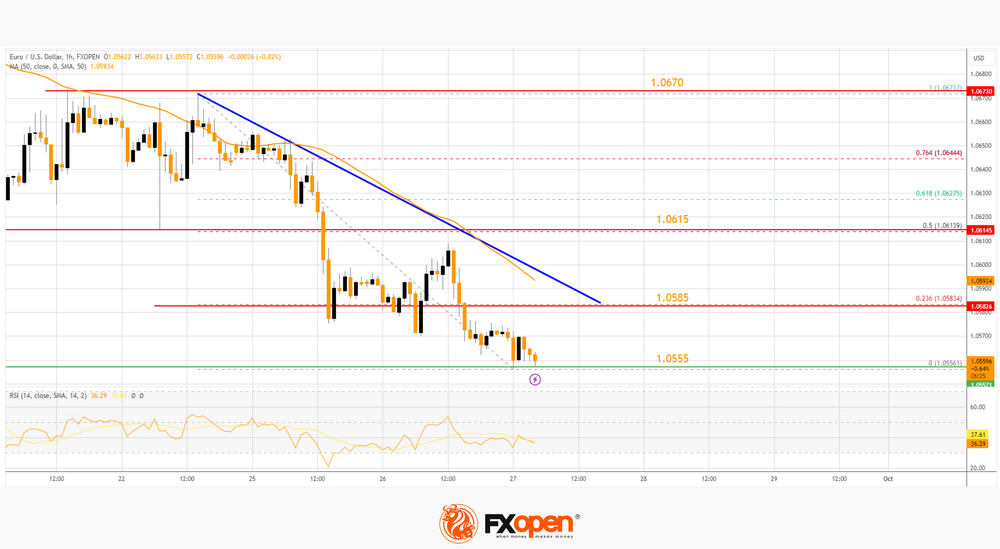
Immediate resistance on the upside is near the 23.6% Fib retracement level of the downward move from the 1.0671 swing high to the 1.0556 low. There is also a major bearish trend line forming with resistance near 1.0585 and the 50-hour simple moving average.
The first major resistance is near the 50% Fib retracement level of the downward move from the 1.0671 swing high to the 1.0556 low at 1.0615. An upside break above the 1.0615 level might send the pair toward the 1.0670 resistance. Any more gains might open the doors for a move toward the 1.0720 level.
On the downside, immediate support on the EUR/USD chart is seen near 1.0555. The next major support is near the 1.0540 level. A downside break below the 1.0540 support could send the pair toward the 1.0500 level.
USD/CHF Technical Analysis
On the hourly chart of USD/CHF at FXOpen, the pair started a decent increase from the 0.8930 support. The US Dollar climbed above the 0.9010 resistance zone against the Swiss Franc.
The bulls were able to pump the pair above the 50-hour simple moving average and 0.9135. A high is formed near 0.9174 and the pair is still showing signs of more upsides. On the upside, the pair is now facing resistance near 0.9175.
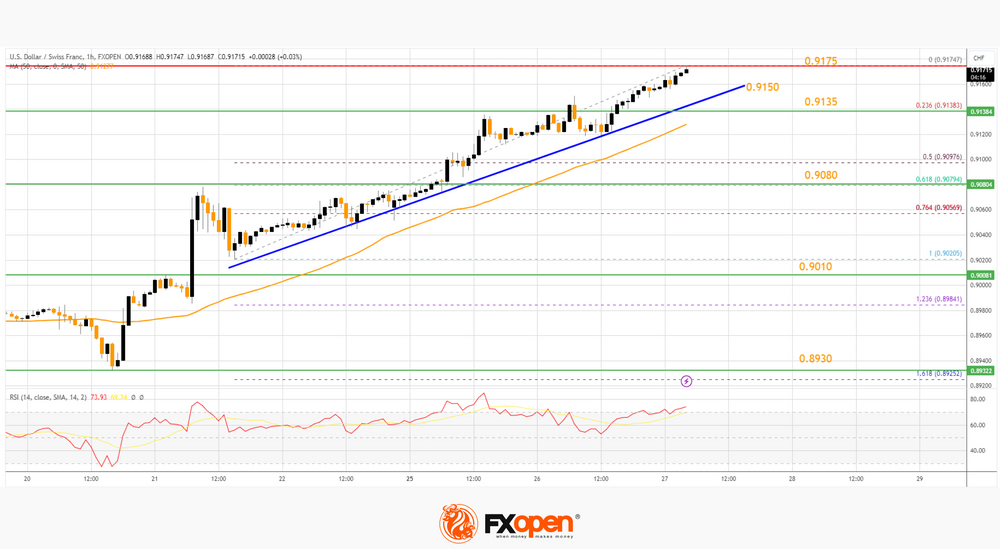
The next major resistance is at 0.9200. The main resistance is now near 0.9220. If there is a clear break above the 0.9220 resistance zone and the RSI climbs above 80, the pair could start another increase. In the stated case, it could test 0.9300.
If not, there could be a downside correction. On the downside, immediate support on the USD/CHF chart is near a key bullish trend line at 0.9150.
The first major support is near the 50-hour simple moving average and the 23.6% Fib retracement level of the upward move from the 0.9020 swing low to the 0.9174 high at 0.9135. A downside break below 0.9135 might spark bearish moves.
The next major support is near the 61.8% Fib retracement level of the upward move from the 0.9020 swing low to the 0.9174 high at 0.9080. Any more losses may possibly open the doors for a move toward the 0.9010 level in the near term.
This article represents the opinion of the Companies operating under the FXOpen brand only. It is not to be construed as an offer, solicitation, or recommendation with respect to products and services provided by the Companies operating under the FXOpen brand, nor is it to be considered financial advice.