Sample Category Title
USD/CHF Daily Outlook
Daily Pivots: (S1) 0.9130; (P) 0.9145; (R1) 0.9174; More....
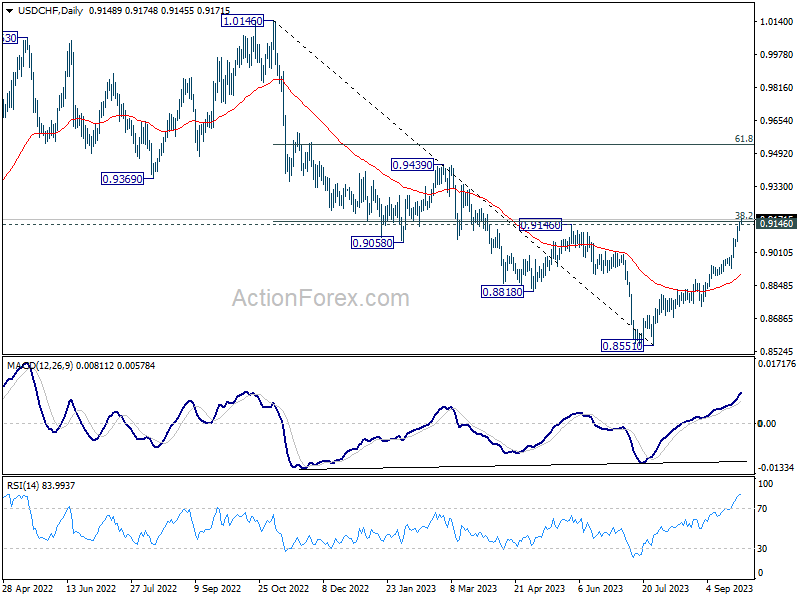
USD/CHF's rally continues today and breaks 0.9146/60 cluster resistance. There is no sign of topping yet, and intraday bias stays on the upside. Next target is 0.9439 resistance. On the downside, below 0.9117 minor support will turn intraday bias neutral and bring consolidations, before staging another rally.
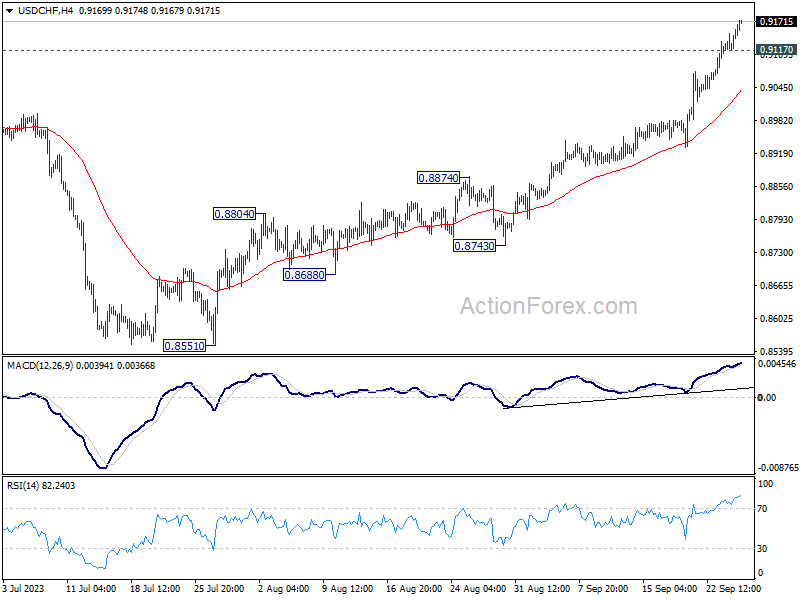
In the bigger picture, sustained trading above 0.9146 cluster resistance (38.2% retracement of 1.0146 to 0.8551 at 0.9160) will argue that rise from 0.8551 is reversing whole down trend from 1.0146. Further rally would then be seen to 61.8% retracement at 0.9537 and above. For now, this will be the favored case as long as 55 D EMA (now at 0.8905) holds.
Dollar Rally Continues With Tailwinds from Risk Aversion
Amid the backdrop of surging treasury yields, Dollar has pressed on, extending its recent rally. The mounting sentiment of risk aversion has provided additional tailwinds for the greenback, especially after the DOW experienced its sharpest decline since March. For now, Yen emerges as the day's runner-up in strength, shadowed closely by Canadian Dollar. Conversely, Australian and New Zealand Dollars trail behind. Euro and Sterling are holding their ground in a muddled middle, their positions buffered to some extent by Swiss Franc's selloff.
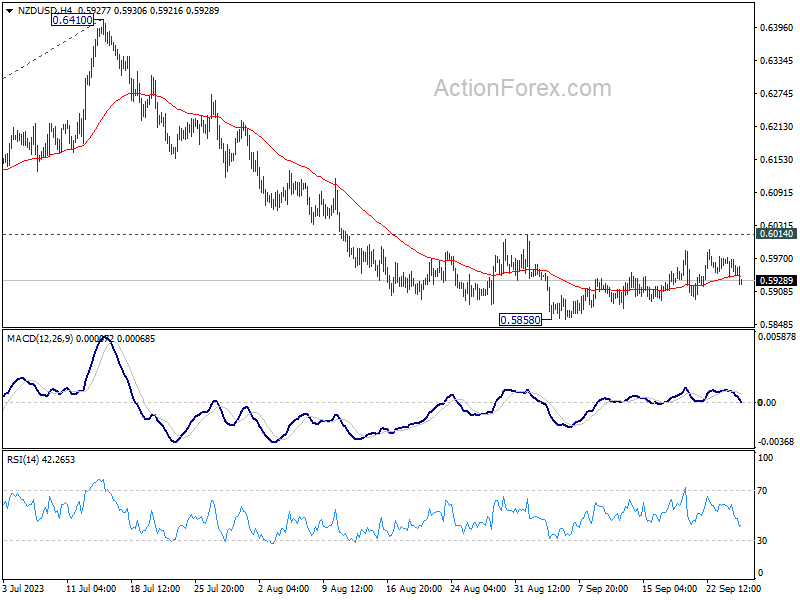
From a technical standpoint, Dollar's might against commodity currencies appears to be held in check. For the greenback to truly showcase its dominance, it would necessitate AUD/USD to decisively break 0.6356 support level. Similarly, NZD/USD would have to pierce 0.5858 support to reinitiate its recent down trend. At the same time, USD/CAD will need to break through 1.3548 resistance to confirm complete of its near term pull back from 1.5693. Attention is now on whether the Dollar can achieve these milestones before the close of September.
In Asia, at the time of writing, Nikkei is down -0.18%. Hong Kong HSI is up 0.54%. China Shanghai SSE is up 0.19%. Singapore Strait Times is down -0.82%. 10-year JGB yield is down -0.001 at 0.745. Overnight, DOW dropped -1.14%. S&P 500 dropped -1.47%. NASDAQ dropped -1.57%. 10-year yield rose 0.016 to 4.558.
Australia's monthly CPI rose to 5.2%, led by housing and transport
Australia CPI for August rose from 4.9% yoy to 5.2% yoy, in line with market expectations.
Digging into the specifics, the sectors showing the most substantial annual gains were housing, which surged by 6.6%, followed by transport at 7.4%. Additionally, food and non-alcoholic beverages reported an increase of 4.4%. Notably, insurance and financial services marked the highest significant rise of 8.8%.
On the other hand, when considering CPI that excludes volatile items such as holiday travel, there was a slight dip from 5.8% yoy to 5.5% yoy. Meanwhile, the Annual trimmed mean CPI, which gives a clearer picture by removing the most volatile items, remained steady at 5.6% yoy.
BoJ minutes reveal diverging views on future policy direction
The minutes from BoJ meeting held on July 27 and 28 have unveiled differing perspectives among board members regarding the future direction of monetary policy. While a consensus was apparent on the immediate need to sustain ultra-low interest rates, members were divided on how to approach the medium to long term.
One member stated, "there was still a significantly long way to go before revising the negative interest rate policy, and the framework of yield curve control needed to be maintained".
The same member emphasized the importance of patience and consistency, suggesting that "it should carefully nurture the long-awaited signs of change in firms' behavior by patiently continuing with monetary easing."
Another participant weighed the risks of delaying versus hastening monetary tightening. In their perspective, the "risk of missing a chance to achieve the 2 percent target due to a hasty monetary tightening outweighed the risk of the inflation rate continuing to exceed 2 percent if monetary tightening fell behind the curve."
Yet another member presented a more optimistic outlook on the inflation target, noting that the "achievement of 2 percent inflation in a sustainable and stable manner seemed to have clearly come in sight." They further suggested that between January and March 2024, it might be feasible to evaluate the Bank's success in achieving the inflation target.
Despite the differences in outlook, BoJ decided to persist with its current easing policy settings but also opted to grant long-term borrowing costs more flexibility to rise.
Gold at 1900 key support zone as selloff intensifies
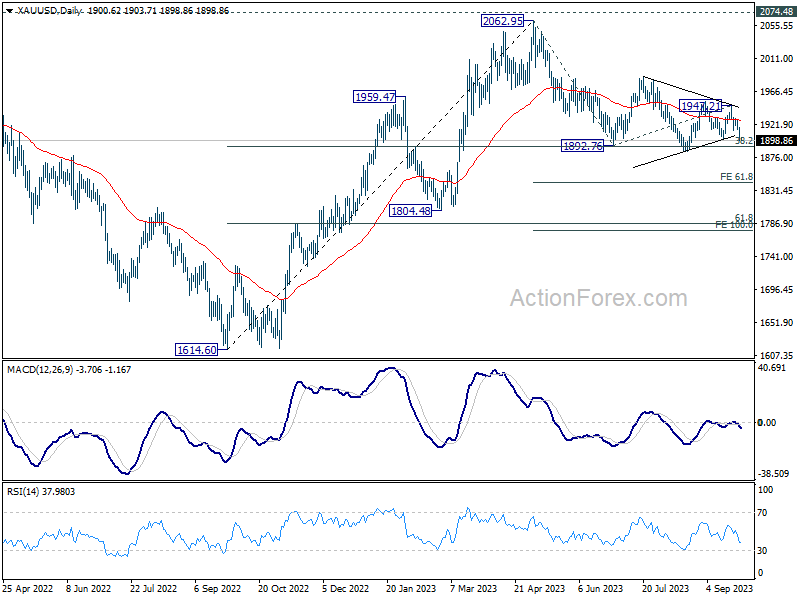
Gold is under intensifying selling pressure this week. The prominent drivers behind this selloff are strengthening Dollar and, crucially, surging treasury yields. As a result, the yellow metal finds itself back at a crucial support zone around 1900 mark.
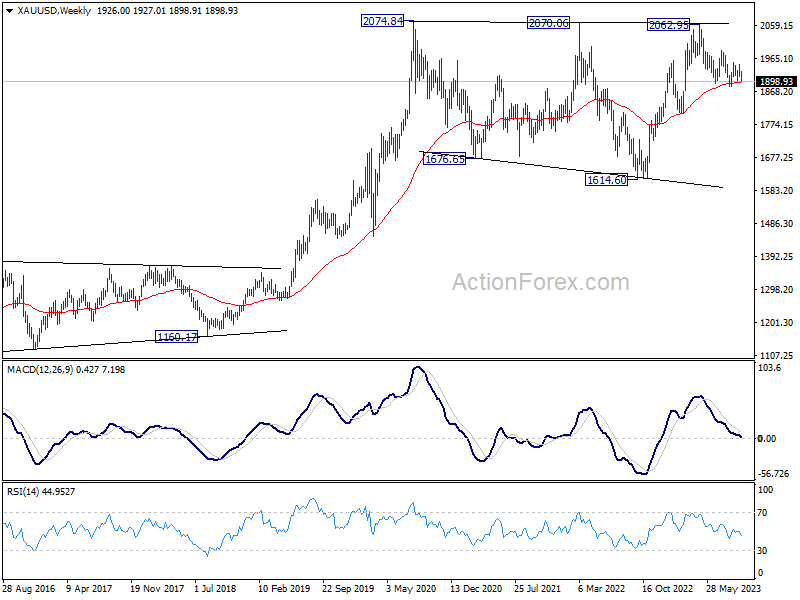
Within this critical support region lies 38.2% retracement of 1614.60 (2022 low) to 2062.95 at 1891.68, as well as 55 W EMA (now at 1896.68). A clear break below this pivotal range would underscore the notion that whole rally originating from 1614.60 has completed at 2062.95 already, stopping short of 2020 high of 2074.84. This descent from 2062.95 could then be interpreted as a medium-term fall trend, as one of the falling legs inside the long term consolidation pattern from 2074.84.
For now, risk will stay on the downside as long as 1947.21 resistance holds. Sustained break of 1884.83 support will pave the way to 61.8% projection of 2062.95 to 1892.76 from 1947.21 at 1842.03 in the near term. 100% projection at 1777.02 and below will be the medium term target.
Drawing parallels with other markets, the extended decline in Gold, if realized, would be consistent with Dollar Index surging towards 108/110 zone.
Looking ahead
Germany Gfk consumer sentiment, Swiss Credit Suisse economic expectations and Eurozone M3 money supply will be released in European session. Later in the day, US durable goods orders will take center stage.
USD/CHF Daily Outlook
Daily Pivots: (S1) 0.9130; (P) 0.9145; (R1) 0.9174; More....
USD/CHF's rally continues today and breaks 0.9146/60 cluster resistance. There is no sign of topping yet, and intraday bias stays on the upside. Next target is 0.9439 resistance. On the downside, below 0.9117 minor support will turn intraday bias neutral and bring consolidations, before staging another rally.
In the bigger picture, sustained trading above 0.9146 cluster resistance (38.2% retracement of 1.0146 to 0.8551 at 0.9160) will argue that rise from 0.8551 is reversing whole down trend from 1.0146. Further rally would then be seen to 61.8% retracement at 0.9537 and above. For now, this will be the favored case as long as 55 D EMA (now at 0.8905) holds.
Economic Indicators Update
| GMT | Ccy | Events | Actual | Forecast | Previous | Revised |
|---|---|---|---|---|---|---|
| 23:50 | JPY | BoJ Minutes | ||||
| 01:30 | AUD | Monthly CPI Y/Y Aug | 5.20% | 5.20% | 4.90% | |
| 06:00 | EUR | Germany Gfk Consumer Confidence Oct | -25.5 | -25.5 | ||
| 08:00 | CHF | Credit Suisse Economic Expectations Sep | -38.6 | |||
| 08:00 | EUR | Eurozone M3 Money Supply Y/Y Aug | -1.00% | -0.40% | ||
| 12:30 | USD | Durable Goods Orders Aug | -0.40% | -5.20% | ||
| 12:30 | USD | Durable Goods Orders ex Transportation Aug | 0.20% | 0.40% | ||
| 14:30 | USD | Crude Oil Inventories | -0.7M | -2.1M |
Australia: August Monthly CPI Indicator
The Monthly CPI lifted 0.6% in August as expected. Inflation was restrained by various government energy rebates but there is still an upside risk to both our CPI and Trimmed Mean forecasts.
As reported by the ABS, the Monthly CPI Indicator rose 5.2% in the year to August, up from 4.9%yr in July but still a moderation from the peak of 8.4%yr in December 2022. This was in line with Westpac’s, and the market median forecast, of 5.2%yr.
As we noted in the preview, if the Monthly CPI Indicator printed as expected it would be pointing to some upside risk to our current forecast for the September quarter CPI of 0.9%qtr/5.1%yr.
It is also worth noting that the Monthly Indicator Trimmed Mean printed 5.6%yr, flat with the July print and so still a moderation from the peak of 7.2% in December 2022. This also suggests there is some upside risk to our current Trimmed Mean forecast for the September quarter of 0.8%qtr/4.7%yr.
In annual terms, the most significant contributors to the August increase were housing (6.6%), transport (7.4%), food & non-alcoholic beverages (4.4%) and insurance & financial services (8.8%).
The ABS noted that the rate of inflation for housing, at 6.6%yr, was lower than it was in July (7.3%). New dwelling prices are up 4.8%yr, the lowest annual pace since August 2021, as price increases for building materials continued to ease, reflecting improved supply conditions. Rents are up 7.8%yr, slightly higher than July’s 7.6%yr print, as the rental market continues to tighten.
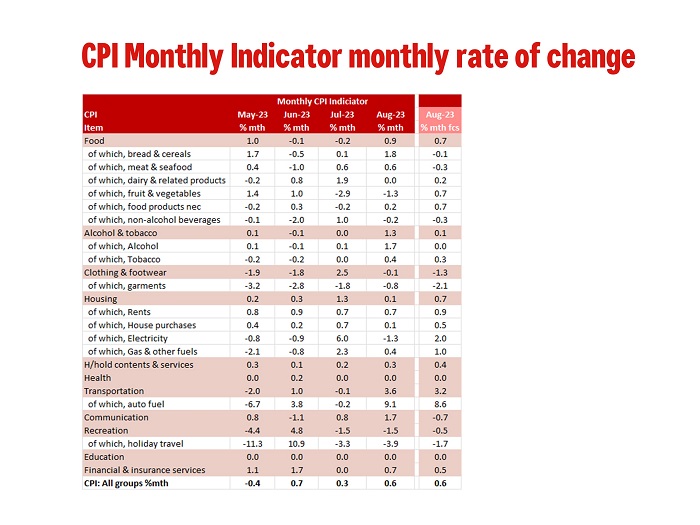
As readers will know we prefer to look at the monthly changes to give us a better guide of what we think the current quarter will look like for inflation. In August, the Monthly CPI Indicator lifted 0.6%, in line with our forecast and consistent with our overall view on inflation momentum. There were, however, some interesting divergences in the components.
Food prices were broadly in line with expectations, but alcohol & tobacco were stronger at 1.3% vs 0.1% forecast, as was clothing & footwear (–0.1% vs –1.3% forecast).
The larger surprise for us was housing, which rose just 0.1% vs our forecast of 0.7% due to softer than expected rents (0.7% vs 0.9% forecast), dwelling purchase costs (0.1% vs. 0.5% forecast) while electricity prices fell (–1.3%) due to the impact of government rebates compared to our forecast for a modest increase (2.0%). Gas & other household fuels also rose more modestly than expected (0.4% vs 1.0% forecast).
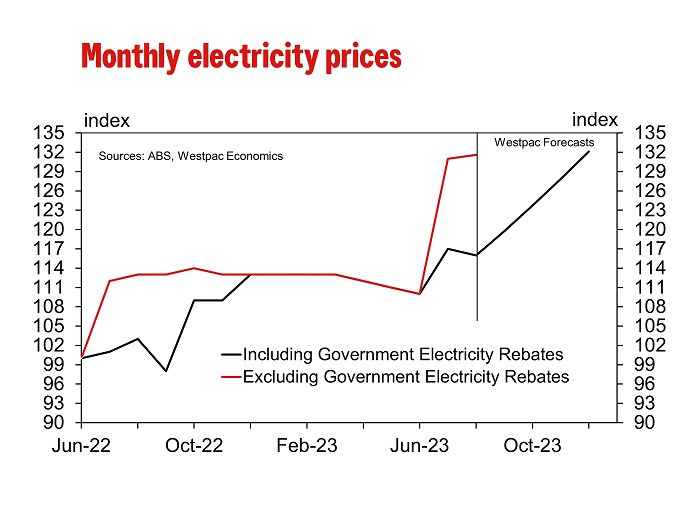
The ABS provided some detail around the rebates. The fall in August was due the introduction of rebates from the Energy Bill Relief fund for concession households in Melbourne. Without the Energy Bill Relief Fund rebates in Melbourne, electricity prices would have risen 0.5% in August. Energy Bill Relief Fund rebates, introduced in July 2023, continue to reduce electricity bills for concession households in Sydney, Adelaide, Hobart, Darwin and Canberra and for all households in Brisbane and Perth this month.
Looking forward, the ABS notes that in addition to concession households, households newly eligible for the Energy Bill relief fund will likely see these rebates reflected in energy bills from October for Sydney, Adelaide, Hobart, Darwin and Canberra. For Melbourne, rebates for newly eligible households will be reflected from November 2023. As such, the level of electricity prices is unlikely to get to the level it is without rebates before December this year, or it could extend into the first quarter of 2024.
We are currenting revising our CPI forecast in light of this data including the critical update of the quarterly services prices. But we can note that in our preview, we suggested that if the monthly indicator printed as expected it would point to some upside risk to our current Q3 CPI forecast of 0.9%qtr/5.1%yr.
Technical Outlook and Review
DXY:
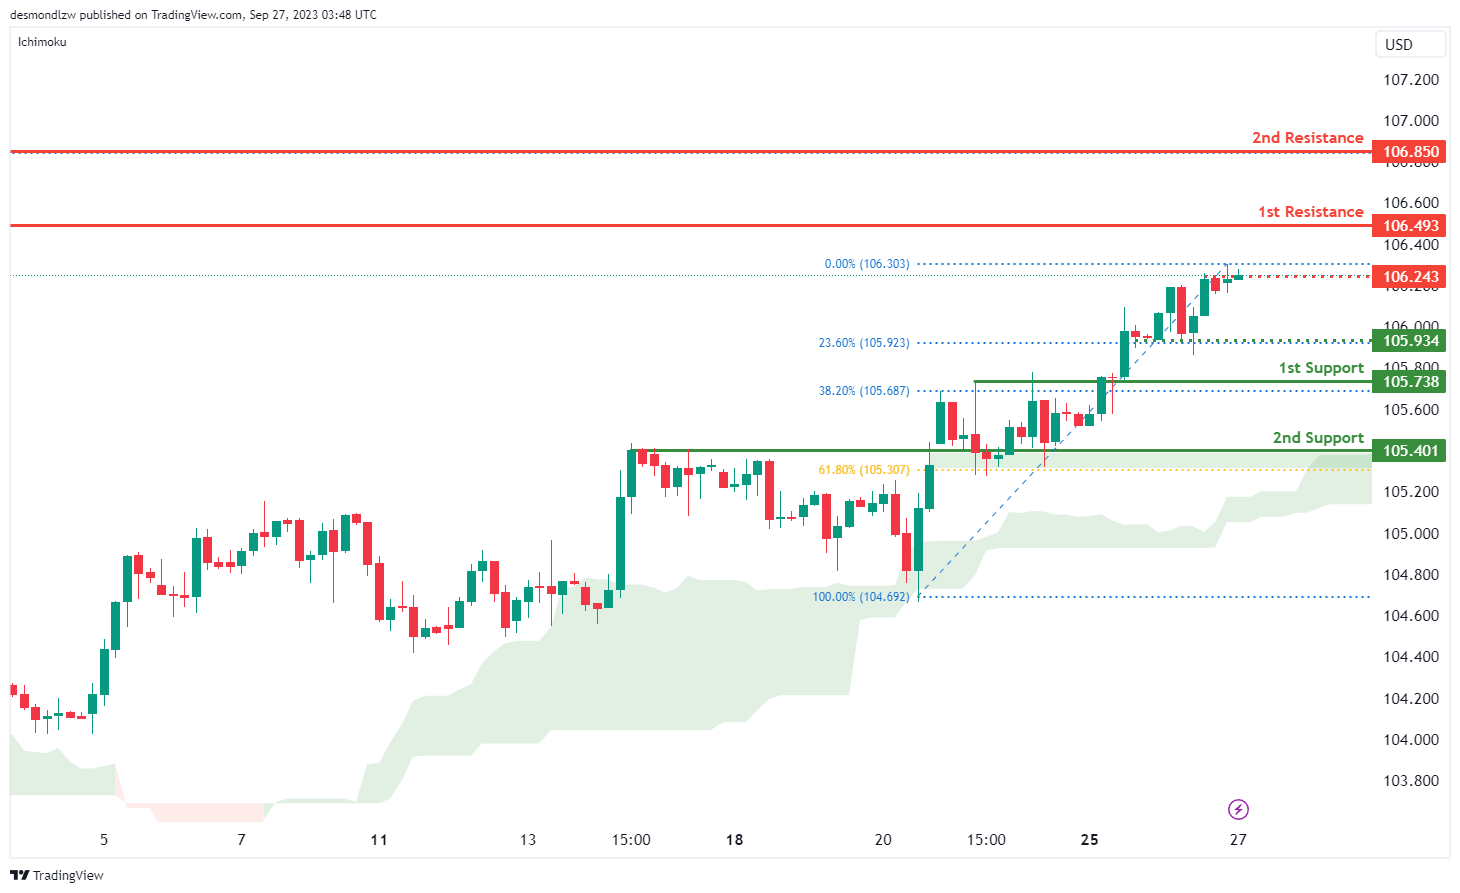
The DXY chart currently displays bullish momentum, as the price is above the bullish Ichimoku cloud, suggesting a potential bullish continuation towards the 1st resistance.
The 1st support at 105.73, noted as an overlap support, aligns with the 38.20% Fibonacci Retracement, enhancing its significance as a strong support zone. Similarly, the 2nd support at 105.40 is another overlap support, coinciding with the 61.80% Fibonacci Retracement, bolstering its importance as a key support level.
On the resistance side, the 1st resistance is found at 106.49, identified as a pullback resistance, acting as a potential barrier to upward movements. Above this, the 2nd resistance at 106.85 is a swing high resistance, associated with the 78.60% Fibonacci Projection, further marking its importance as a significant resistance level. An intermediate resistance is also present at 106.24, recognized as a multi-swing high resistance, underscoring its potential role in the current bullish scenario.
EUR/USD:
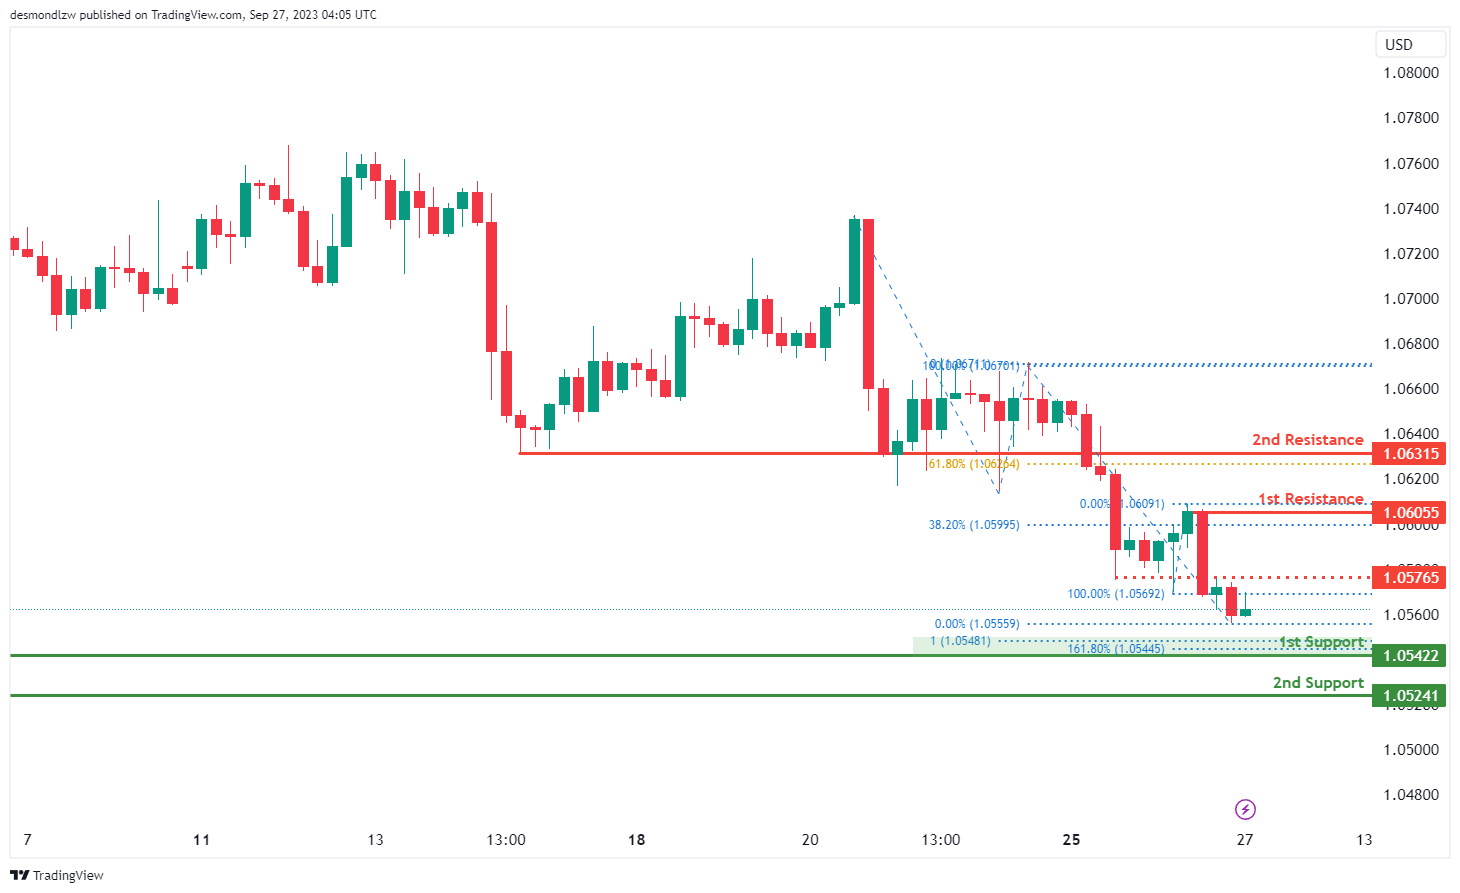
The EUR/USD chart is presently demonstrating bearish momentum, with the expectation of a potential bearish continuation heading towards the 1st support. The 1st support at 1.0542 is noteworthy, acting as a swing low support with both a 161.80% Fibonacci Extension and a 100% Fibonacci Projection, exhibiting Fibonacci confluence. The 2nd support is identified at 1.0524 and is distinguished as another crucial swing low support.
On the resistance end, the 1st resistance level is located at 1.0695, recognized as a swing high resistance and aligning with the 38.20% Fibonacci Retracement, indicating its potential significance in the market’s dynamic. Following this, the 2nd resistance at 1.0631 serves as a pullback resistance, aligning with the 61.80% Fibonacci Retracement, further reinforcing its importance. An intermediate resistance is also pinpointed at 1.0576, acknowledged as an overlap resistance
EUR/JPY:
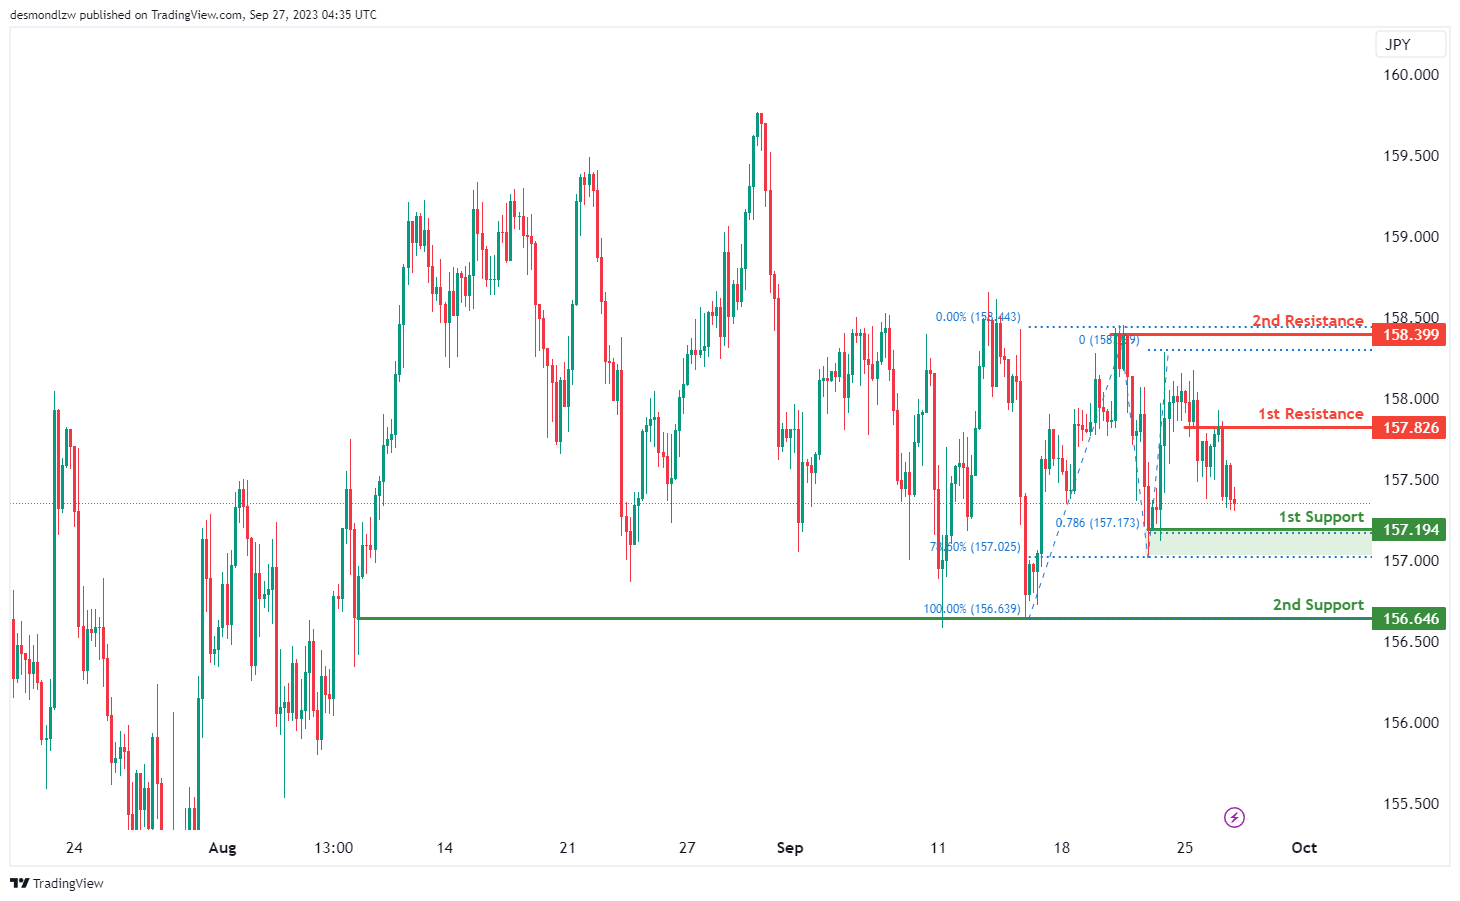
The instrument EUR/JPY currently indicates a bearish overall momentum on the chart, and there’s potential for a bearish continuation towards the 1st support.
The 1st support at 157.91 is considered strong due to several factors, including its nature as a swing low support and the fact that it coincides with both the 78.60% Fibonacci Projection and the 78.60% Fibonacci Retracement. This indicates a significant area of Fibonacci confluence, making it a compelling support level.
The 2nd support at 156.64 is also noteworthy as it acts as a multi-swing low support.
On the resistance side, we have the 1st resistance at 157.82, which is significant because it represents an overlap resistance.
Furthermore, the 2nd resistance at 158.39 is notable as it functions as a swing high resistance.
EUR/GBP:
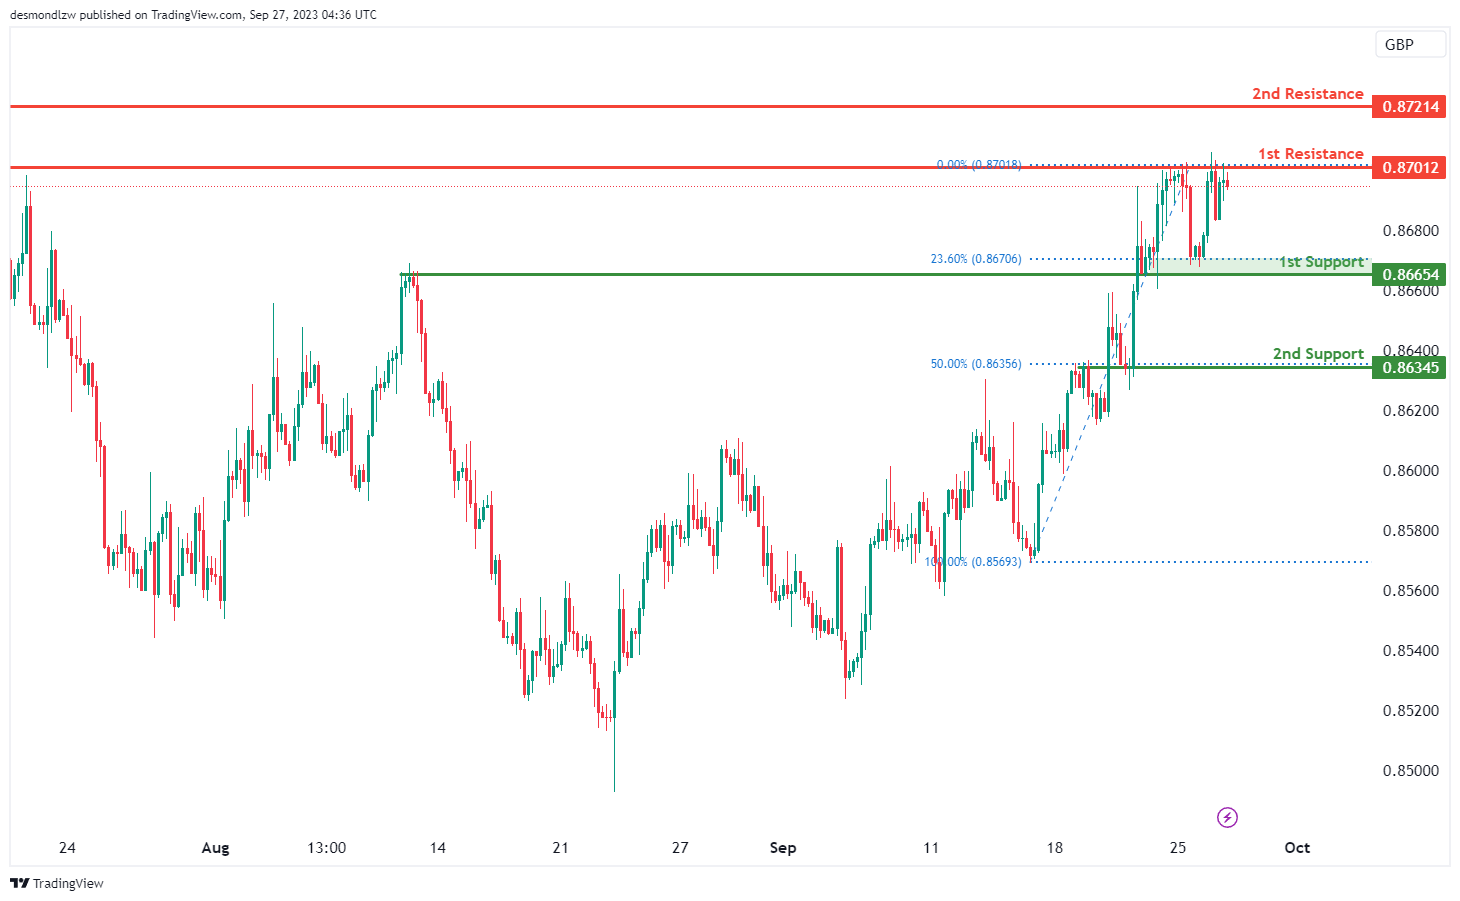
The instrument EUR/GBP currently has a bearish overall momentum on the chart, and there’s potential for a bearish reaction off the 1st resistance and a drop towards the 1st support.
The 1st support at 0.8665 is considered strong due to several factors. It acts as an overlap support and coincides with the 23.60% Fibonacci Retracement level, indicating a significant area of support.
The 2nd support at 0.8634 is also notable as it serves as an overlap support and corresponds to the 50% Fibonacci Retracement level.
On the resistance side, we have the 1st resistance at 0.8701, which is significant because it represents a multi-swing high resistance.
Furthermore, the 2nd resistance at 0.8721 is noteworthy as it acts as an overlap resistance.
GBP/USD:
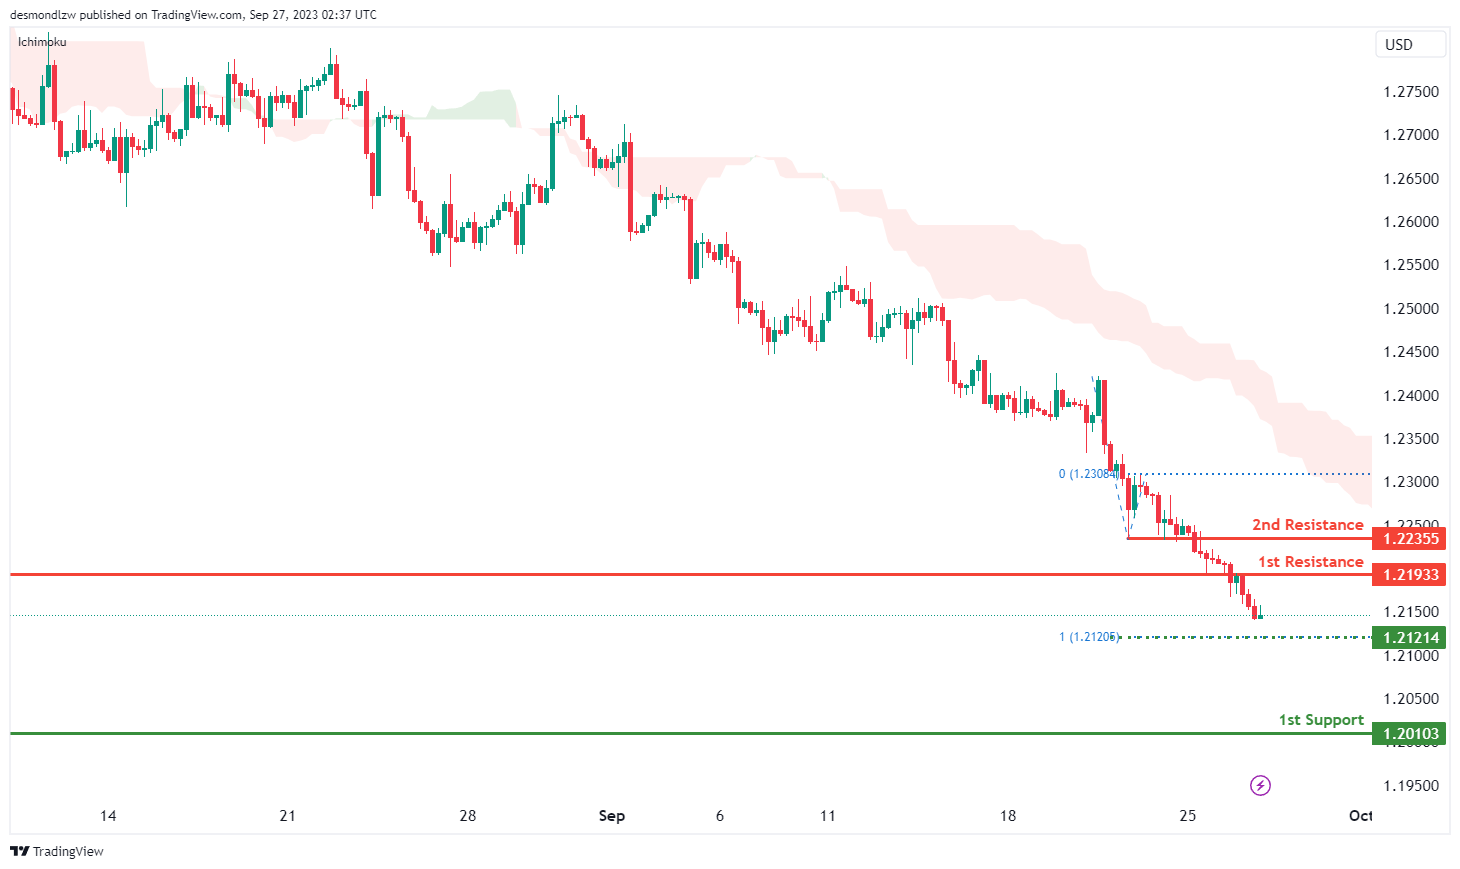
The GBP/USD chart currently indicates a bearish momentum, influenced by the price being below the bearish Ichimoku cloud. The price could break below the intermediate support level and make a bearish continuation towards the 1st support level.
The intermediate support level at 1.2121 is identified as a level that aligns with the 100.00% Fibonacci projection level while the 1st support level at 1.2010 is marked as a swing-low support.
On the resistance side, the 1st resistance level at 1.2193 is identified as an overlap resistance. Additionally, the 2nd resistance level at 1.2236 is noted as pullback resistance, indicating a potential barrier for further price increases.
GBP/JPY:
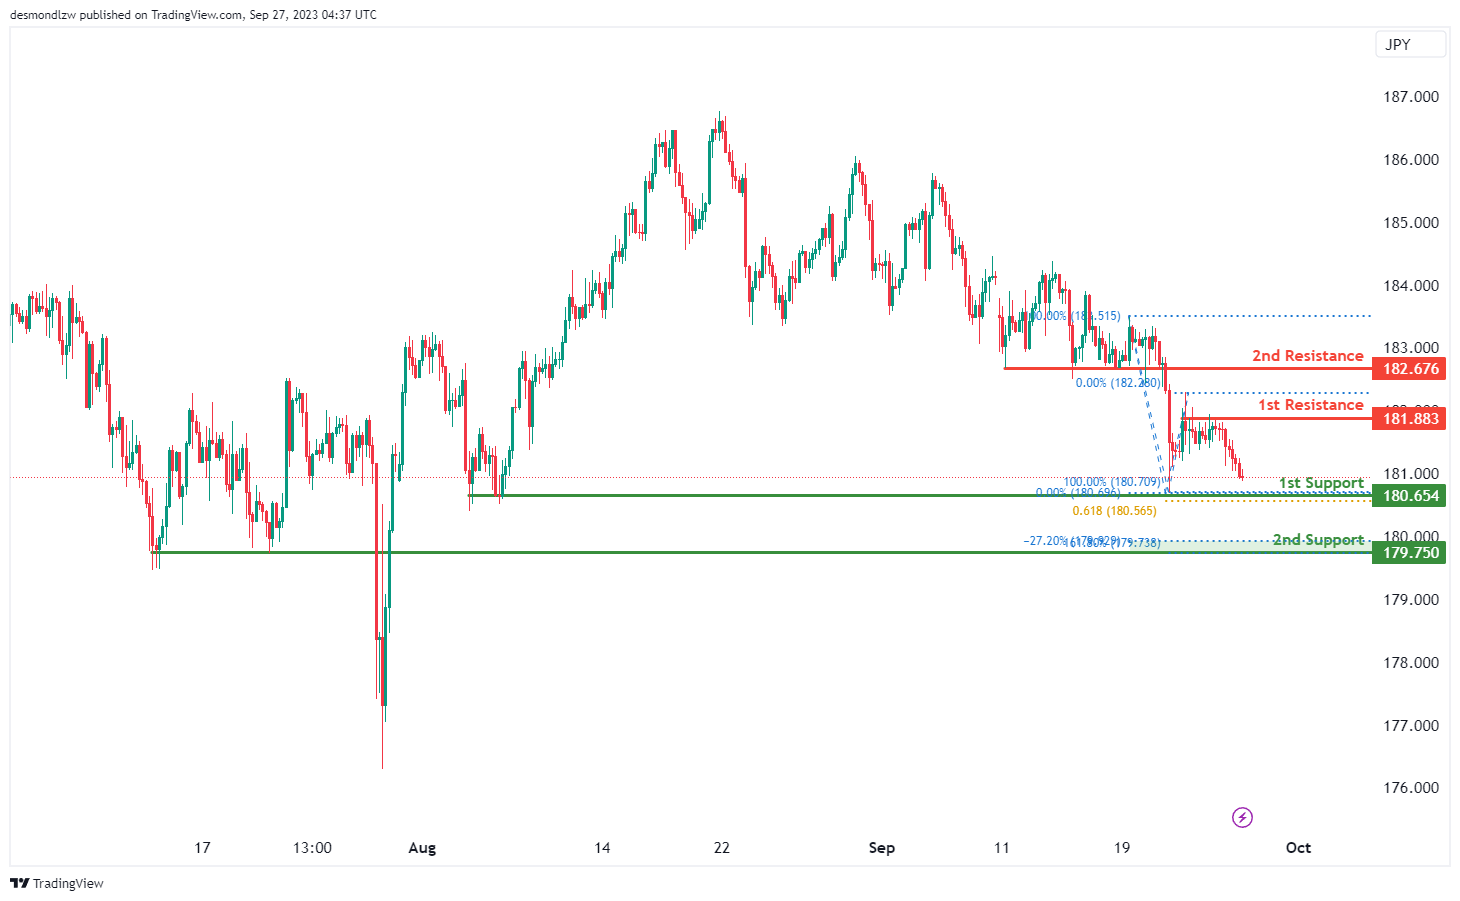
The instrument GBP/JPY currently indicates a bearish overall momentum on the chart, and there’s potential for a bearish continuation towards the 1st support.
The 1st support at 180.65 is considered strong due to several factors. It acts as a multi-swing low support and coincides with the 61.80% Fibonacci Projection, indicating a significant area of Fibonacci confluence, making it a compelling support level.
The 2nd support at 179.75 is also noteworthy as it serves as a pullback support and corresponds to the -27% Fibonacci Expansion as well as the 161.80% Fibonacci Extension, indicating another area of Fibonacci confluence and support.
On the resistance side, we have the 1st resistance at 181.88, which is significant because it represents a multi-swing high resistance.
Furthermore, the 2nd resistance at 182.67 is notable as it acts as a pullback resistance.
USD/CHF:
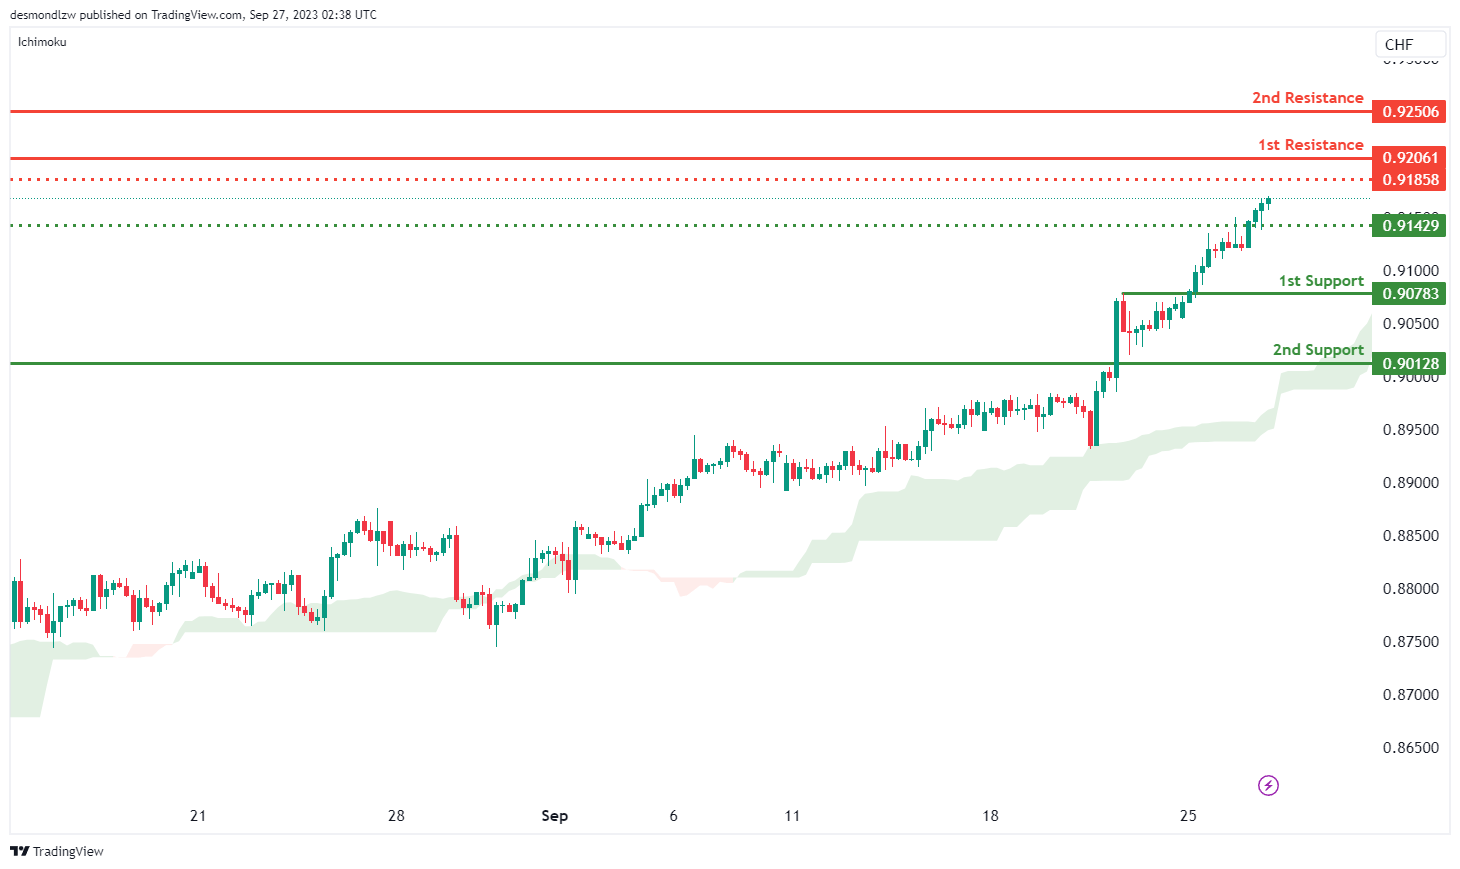
The USD/CHF chart currently demonstrates a bullish momentum. There is a potential scenario where the price might break above the intermediate resistance level and make a bullish continuation towards the 1st resistance level.
The intermediate resistance level at 0.9186 is identified as a pullback resistance while the 1st resistance level at 0.9206 is also marked as a pullback resistance. Additionally, the 2nd resistance level at 0.9251 is identified as a pullback resistance, a potential barrier for further price increases.
To the downside, the intermediate support level at 0.9143 is identified as a pullback support while the 1st support level at 0.9078 is also marked as a pullback support. Additionally, the 2nd support level at 0.9013 is identified as a pullback support.
USD/JPY:
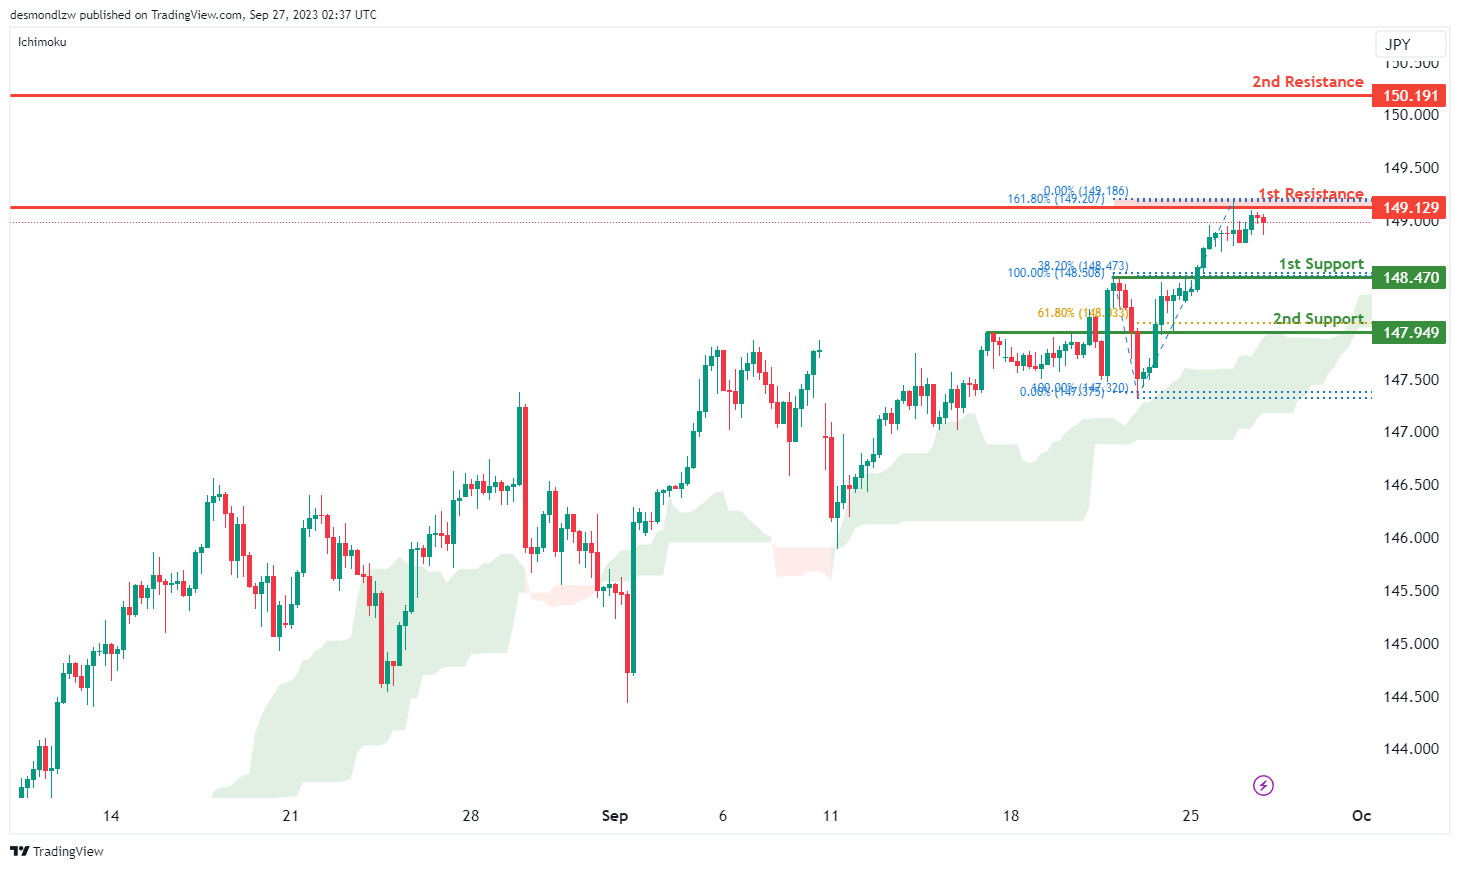
The USD/JPY chart is currently showing a bullish trend. There is a possibility that the price might experience a bullish continuation towards the 1st resistance level.
The 1st resistance level at 149.13 is identified as a pullback resistance that aligns with the 161.80% Fibonacci projection level. Further up, the 2nd resistance level at 150.19 is marked as a swing-high resistance.
To the downside, the 1st support level at 148.47 is identified as a pullback support that aligns with the 38.20% Fibonacci retracement level. Further below, the 2nd support level at 147.95 is noted as an overlap support that aligns with the 61.80% Fibonacci retracement level.
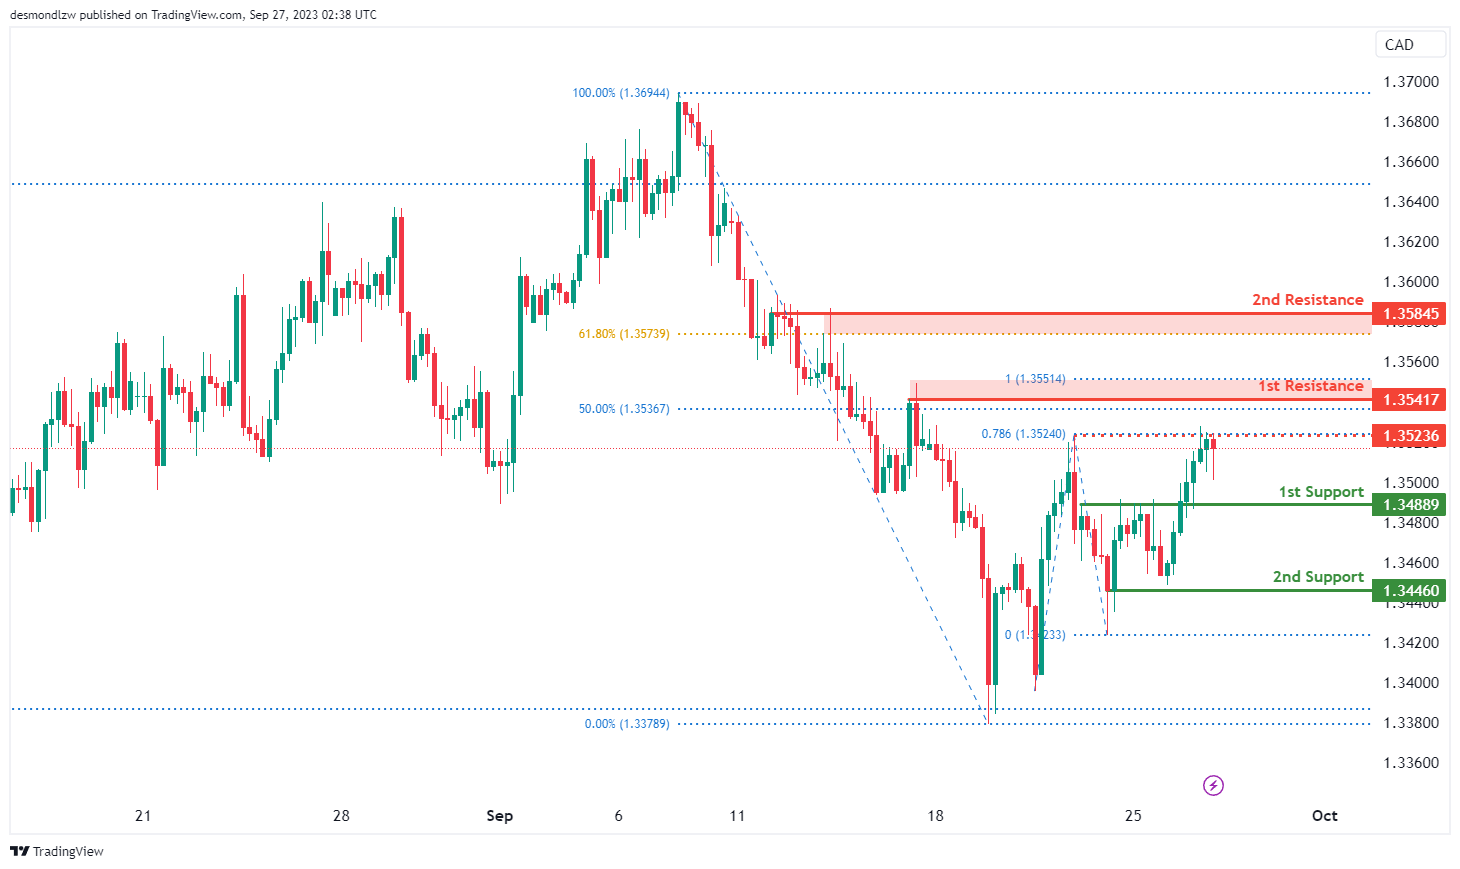
USD/CAD:
The chart for USD/CAD is currently indicating an overall bullish momentum. In this scenario, there is a potential for a bullish continuation towards the 1st resistance level should price break above the intermediate resistance level.
The intermediate resistance level at 1.3524 is identified as a pullback resistance that aligns with the 78.60% Fibonacci projection level while the 1st resistance level at 1.3542 is noted as a pullback resistance that aligns with a confluence of Fibonacci levels i.e. the 50.00% retracement and the 100.00% projection levels. Additionally, the 2nd resistance level at 1.3585 is marked as a pullback resistance that aligns with the 61.80% Fibonacci retracement level.
To the downside, the 1st support level at 1.3489 is identified as a pullback support. Further below, the 2nd support level at 1.3446 is also noted as a pullback support, suggesting a potential strong support level in the past.
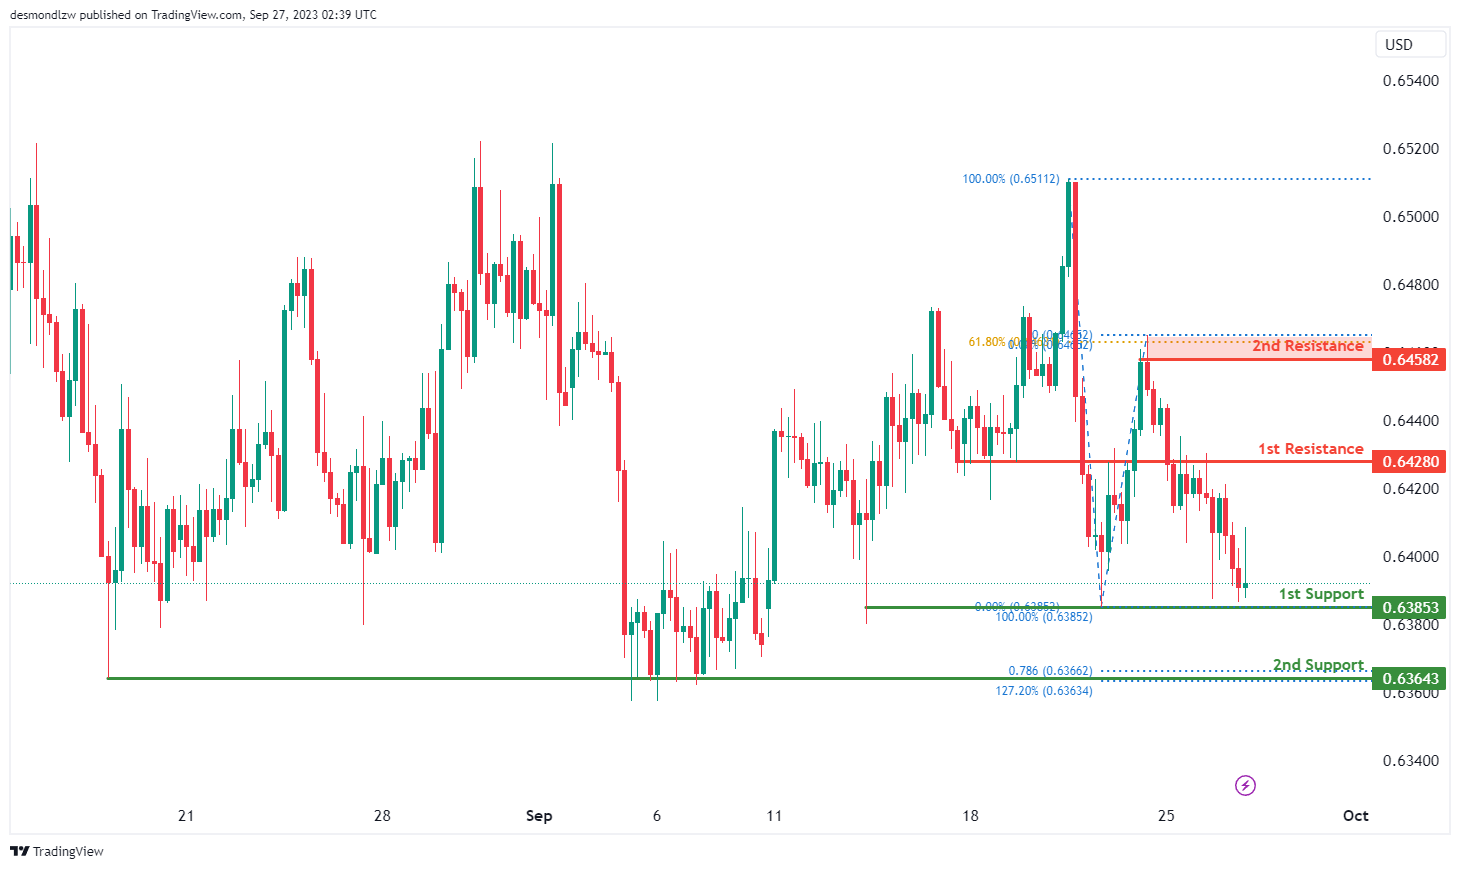
AUD/USD:
The AUD/USD chart is currently displaying an overall bearish momentum, suggesting that price may continue its bearish movement towards the 1st support level.
The 1st support level at 0.6385 is identified as a pullback support while the 2nd support level at 0.6364 is also noted as a pullback support that aligns with a confluence of Fibonacci levels i.e. the 127.20% extension and 78.60% projection levels.
To the upside, the 1st resistance level at 0.6428 is identified as an overlap resistance. Further up, the 2nd resistance level at 0.6458 is marked as a swing-high resistance that aligns with the 61.80% Fibonacci retracement level.
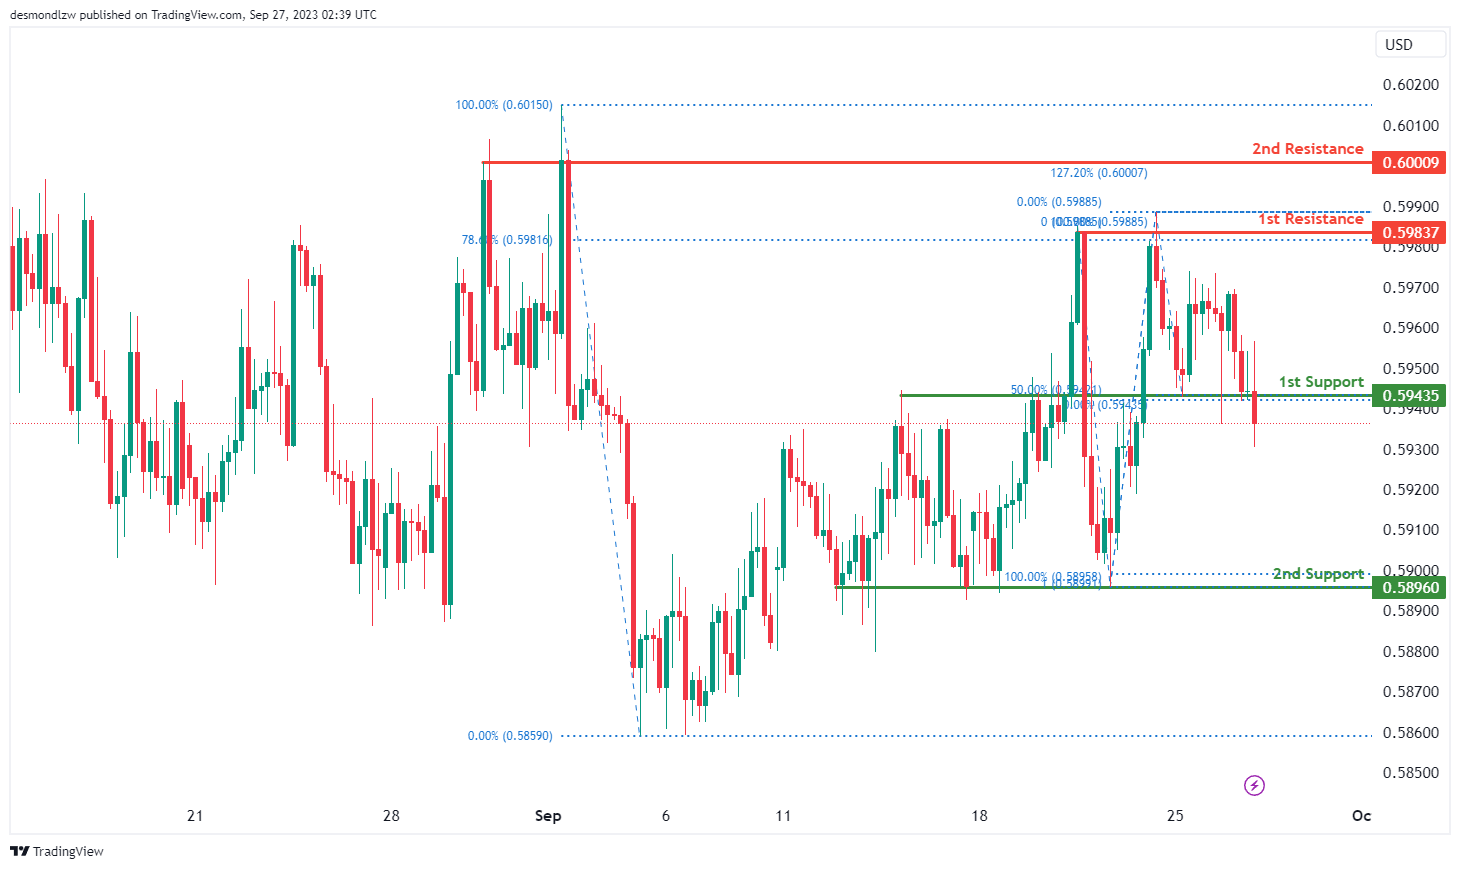
NZD/USD
The NZD/USD chart is currently showing an overall bearish momentum, suggesting that the price may break below the 1st support level and make a bearish continuation towards the 2nd support level.
The 1st support level at 0.5944 is identified as an overlap support that aligns with the 50.00% Fibonacci retracement level. Additionally, the 2nd support level at 0.5896 is marked as a pullback support which could potentially act as a major support zone.
To the upside, the 1st resistance level at 0.5984 is identified as a multi-swing-high resistance that aligns with the 78.60% Fibonacci retracement level. Further up, the 2nd resistance level at 0.6001 is also marked as a multi-swing-high resistance that coincides with the 127.20% Fibonacci extension level.
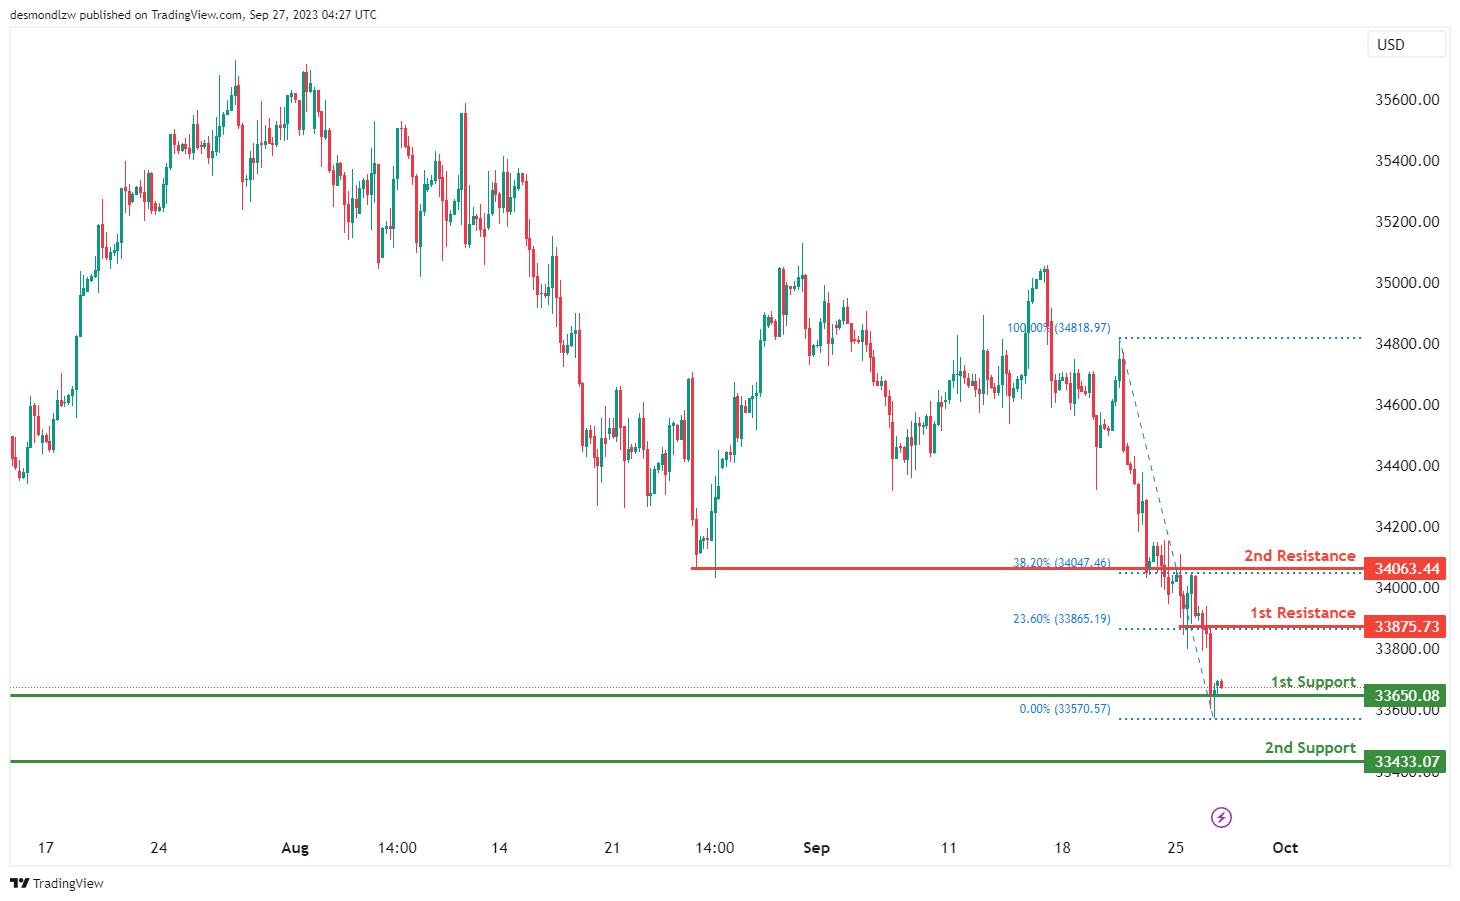
DJ30:
The instrument DJ30 currently indicates a bullish overall momentum on the chart, and there’s potential for a bullish bounce off the 1st support and a move towards the 1st resistance.
The 1st support at 33650.08 is considered good due to its nature as a multi-swing low support.
There is also an intermediate support at 33433.07, which is significant because it acts as a swing low support, providing an additional layer of potential support.
On the resistance side, we have the 1st resistance at 33875.73, which is significant because it represents a pullback resistance and is associated with the 23.60% Fibonacci Retracement.
Furthermore, the 2nd resistance at 34063.44 is noteworthy as it functions as an overlap resistance and is linked to the 38.20% Fibonacci Retracement. These resistance levels suggest potential barriers to further bearish movement at these levels, supporting the idea of a bullish bounce off the 1st support.
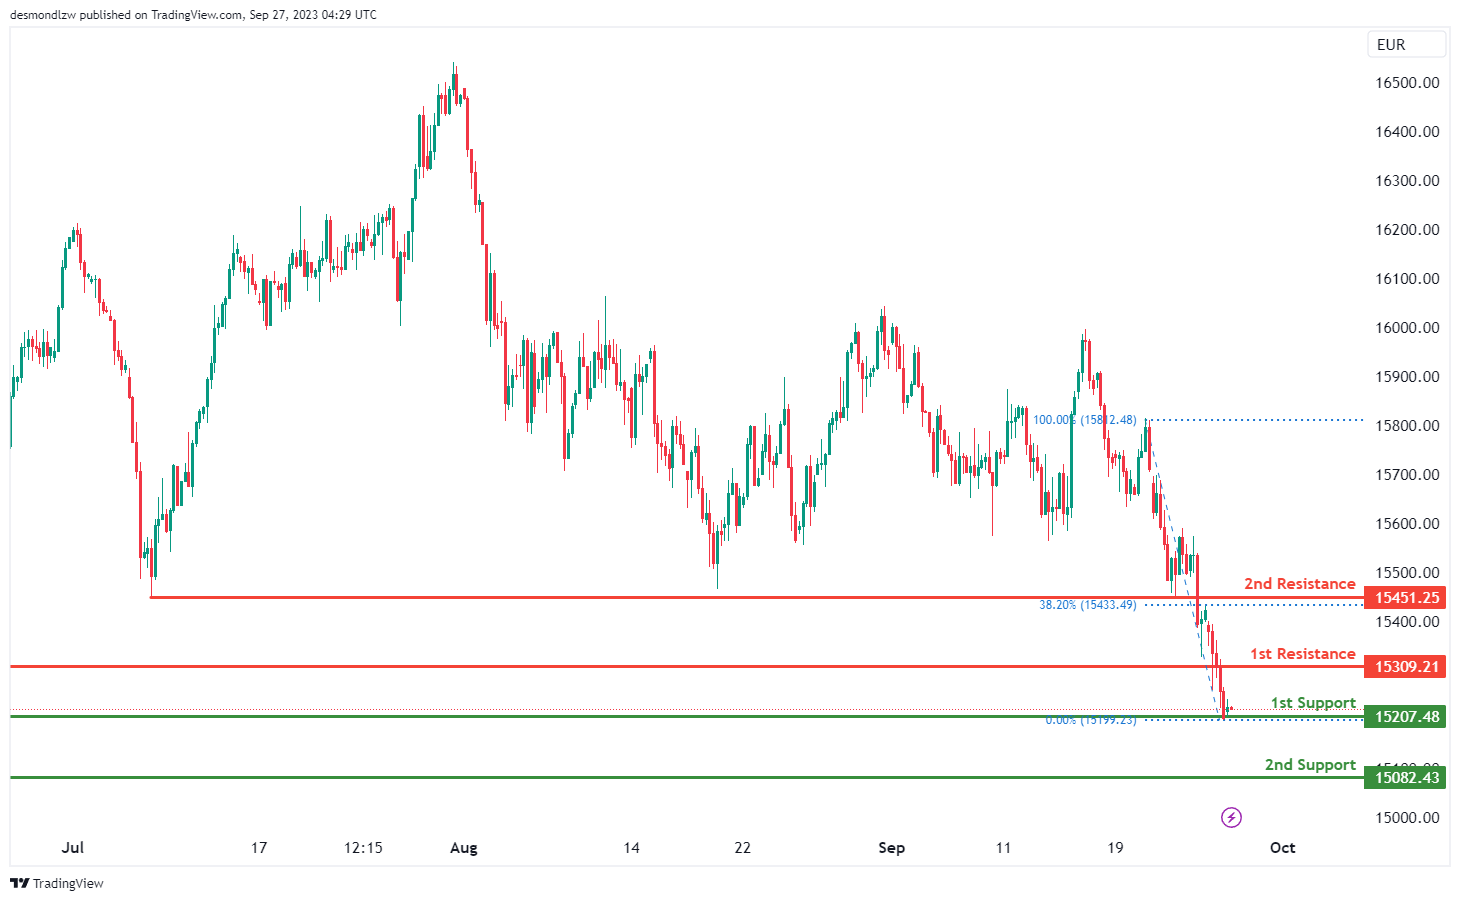
GER30:
The instrument GER30 currently indicates a bullish overall momentum on the chart, and there’s potential for a bullish bounce off the 1st support and a move towards the 1st resistance.
The 1st support at 15201.48 is considered good due to its nature as an overlap support.
The 2nd support at 15082.43 is also notable as it acts as a swing low support.
On the resistance side, we have the 1st resistance at 15309.21, which is significant because it represents a pullback resistance and is associated with the 23.60% Fibonacci Retracement.
Furthermore, the 2nd resistance at 15451.25 is noteworthy as it functions as a pullback resistance and is linked to the 61.80% Fibonacci Retracement.
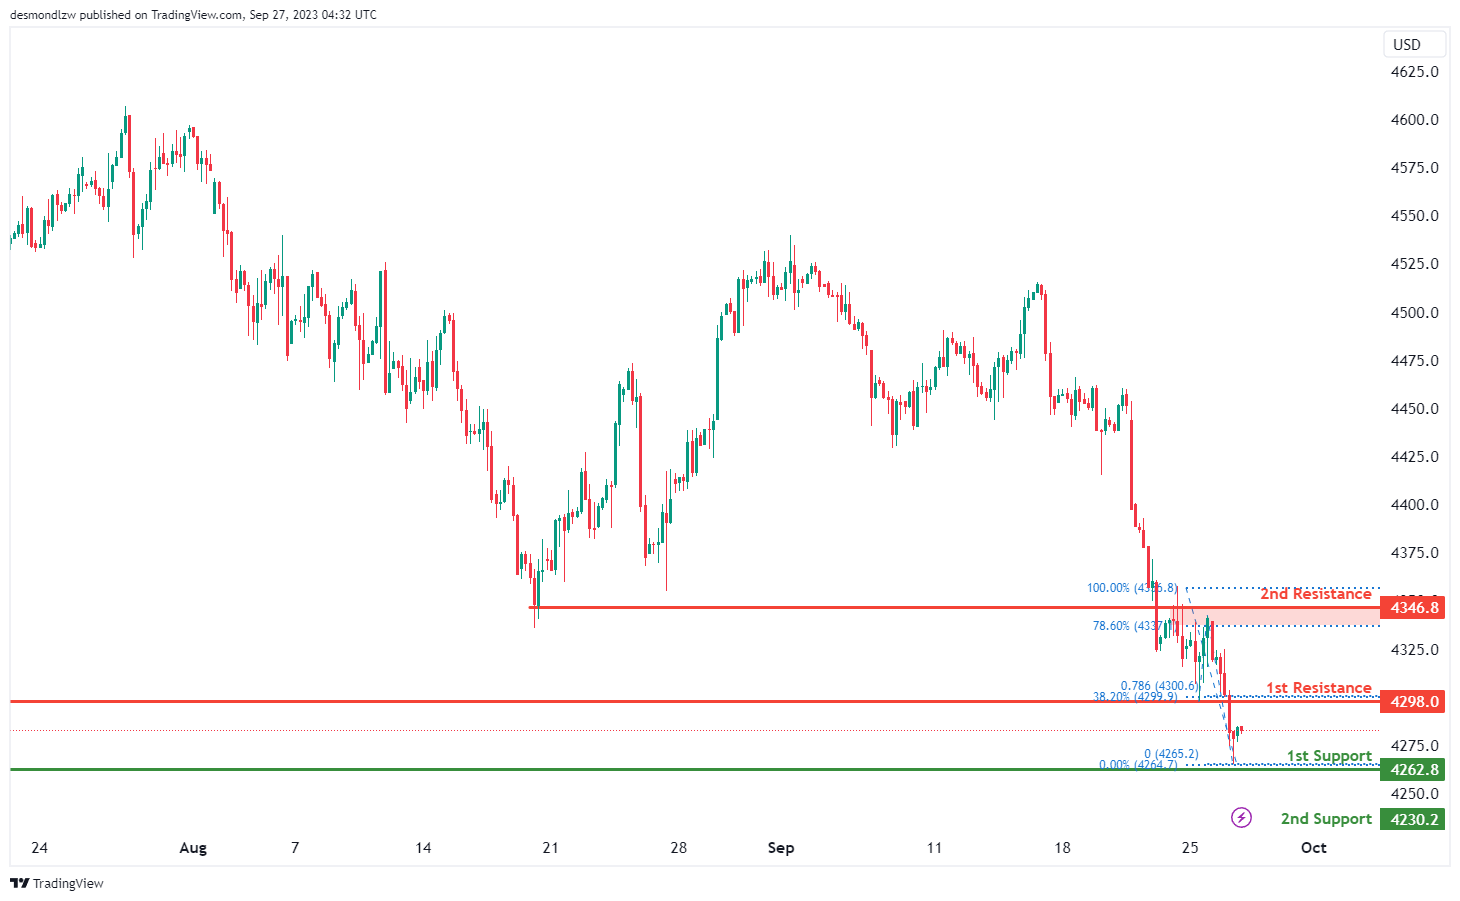
US500
The instrument US500 currently indicates a bearish overall momentum on the chart, and there’s potential for a short-term rise towards the 1st resistance before reversing off it and dropping towards the 1st support.
The 1st support at 4262.8 is considered good due to its nature as a multi-swing low support.
The 2nd support at 4256.0 is also notable as it acts as a pullback support.
On the resistance side, we have the 1st resistance at 4298.0, which is significant because it represents a pullback resistance and is associated with both the 38.20% Fibonacci Retracement and the 78.60% Fibonacci Projection, indicating a potential area of Fibonacci confluence and providing strong resistance.
Similarly, the 2nd resistance at 4346.8 is noteworthy as it functions as an overlap resistance and is linked to the 78.60% Fibonacci Retracement.
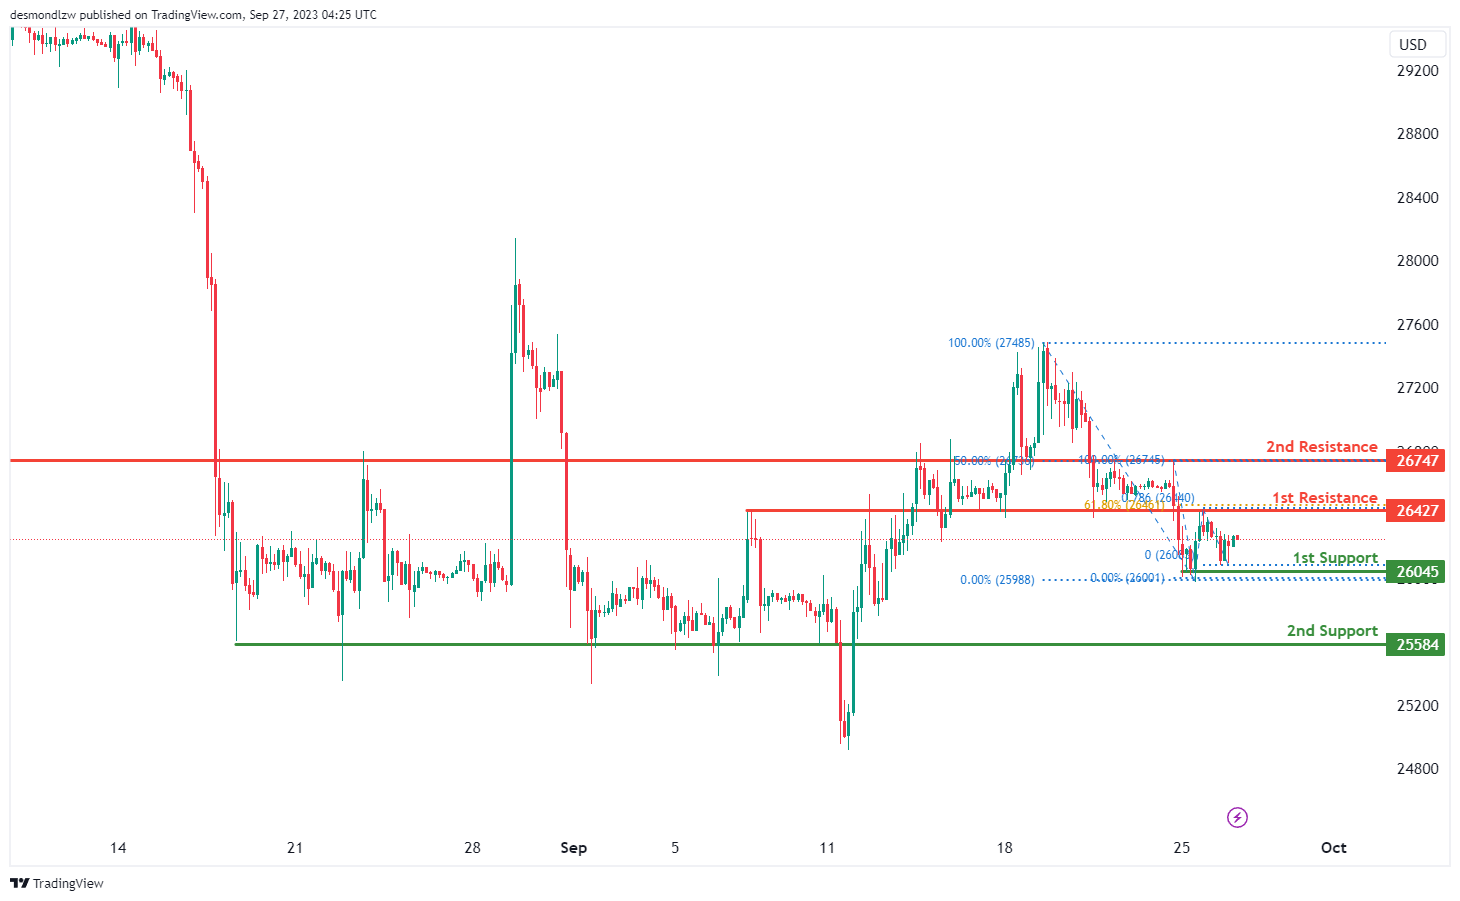
BTC/USD:
The instrument BTC/USD currently indicates a bearish overall momentum on the chart, with factors contributing to this momentum.
There’s potential for the price to make a short-term rise towards the 1st resistance before reversing off it and dropping towards the 1st support.
The 1st support at 26045 is considered good due to its nature as an overlap support.
The 2nd support at 25584 is also notable as it acts as a pullback support.
On the resistance side, we have the 1st resistance at 26427, which is significant because it represents an overlap resistance and is associated with both the 61.80% Fibonacci Retracement and the 78.60% Fibonacci Projection, indicating a potential area of Fibonacci confluence and providing strong resistance.
Similarly, the 2nd resistance at 26747 is noteworthy as it functions as an overlap resistance and is linked to the 50% Fibonacci Retracement, suggesting potential barriers to further bullish movement at these levels and supporting the idea of a reversal off the 1st resistance.
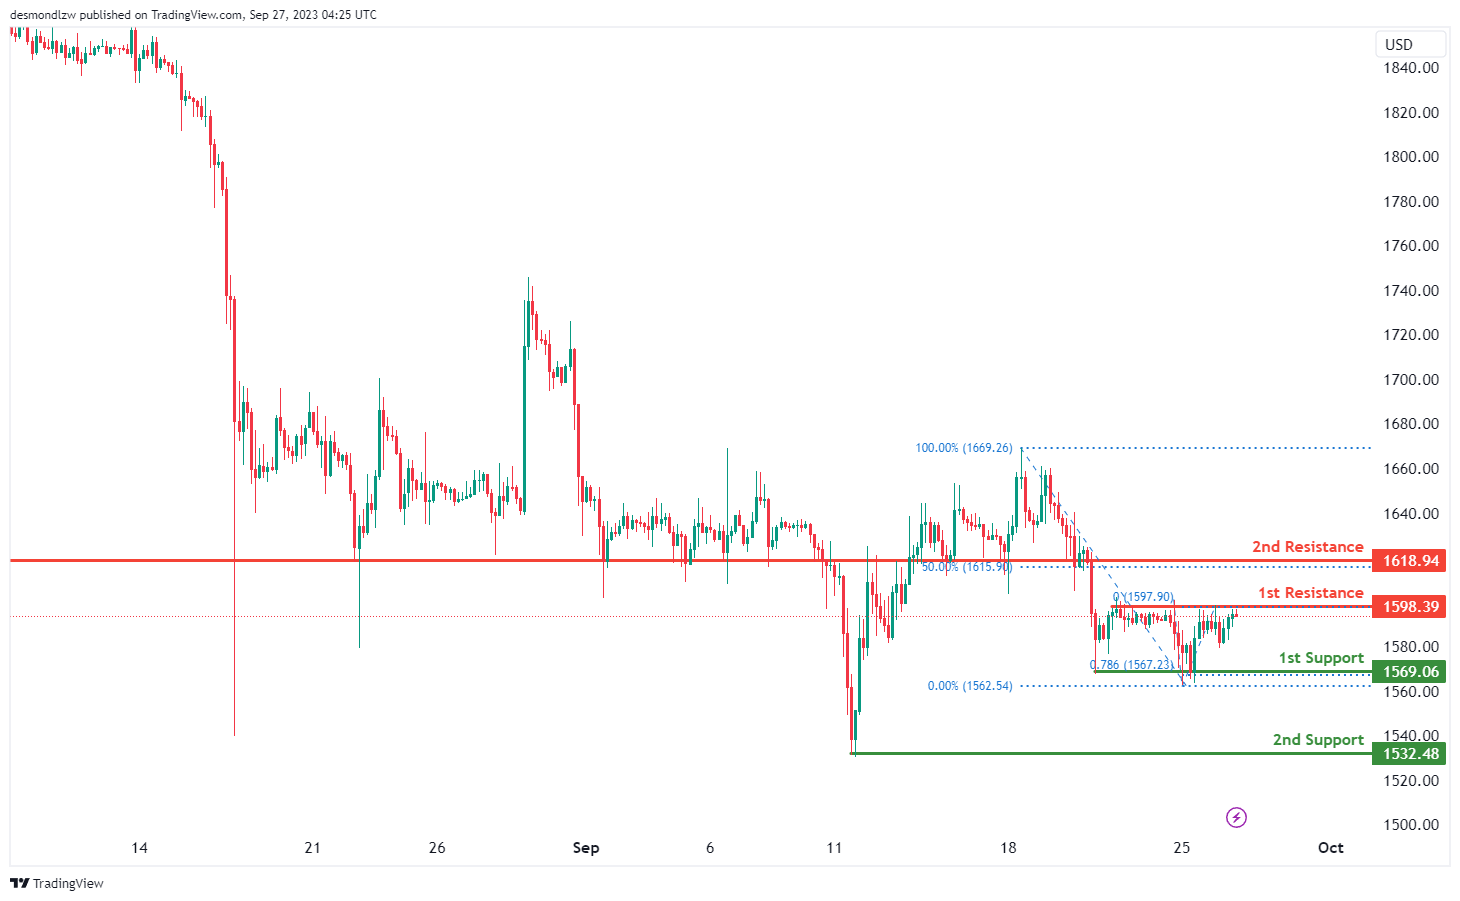
ETH/USD:
The instrument ETH/USD currently indicates a bearish overall momentum on the chart, and there’s potential for a bearish reaction off the 1st resistance and a drop towards the 1st support.
The 1st support at 1569.06 is considered good due to its nature as a multi-swing low support.
The 2nd support at 1532.48 is also notable as it acts as a swing low support.
On the resistance side, we have the 1st resistance at 1598.39, which is significant because it represents a multi-swing high resistance and is associated with the 50% Fibonacci Retracement.
Similarly, the 2nd resistance at 1618.94 is noteworthy as it functions as a pullback resistance and is linked to the 50% Fibonacci Retracement.
WTI/USD:
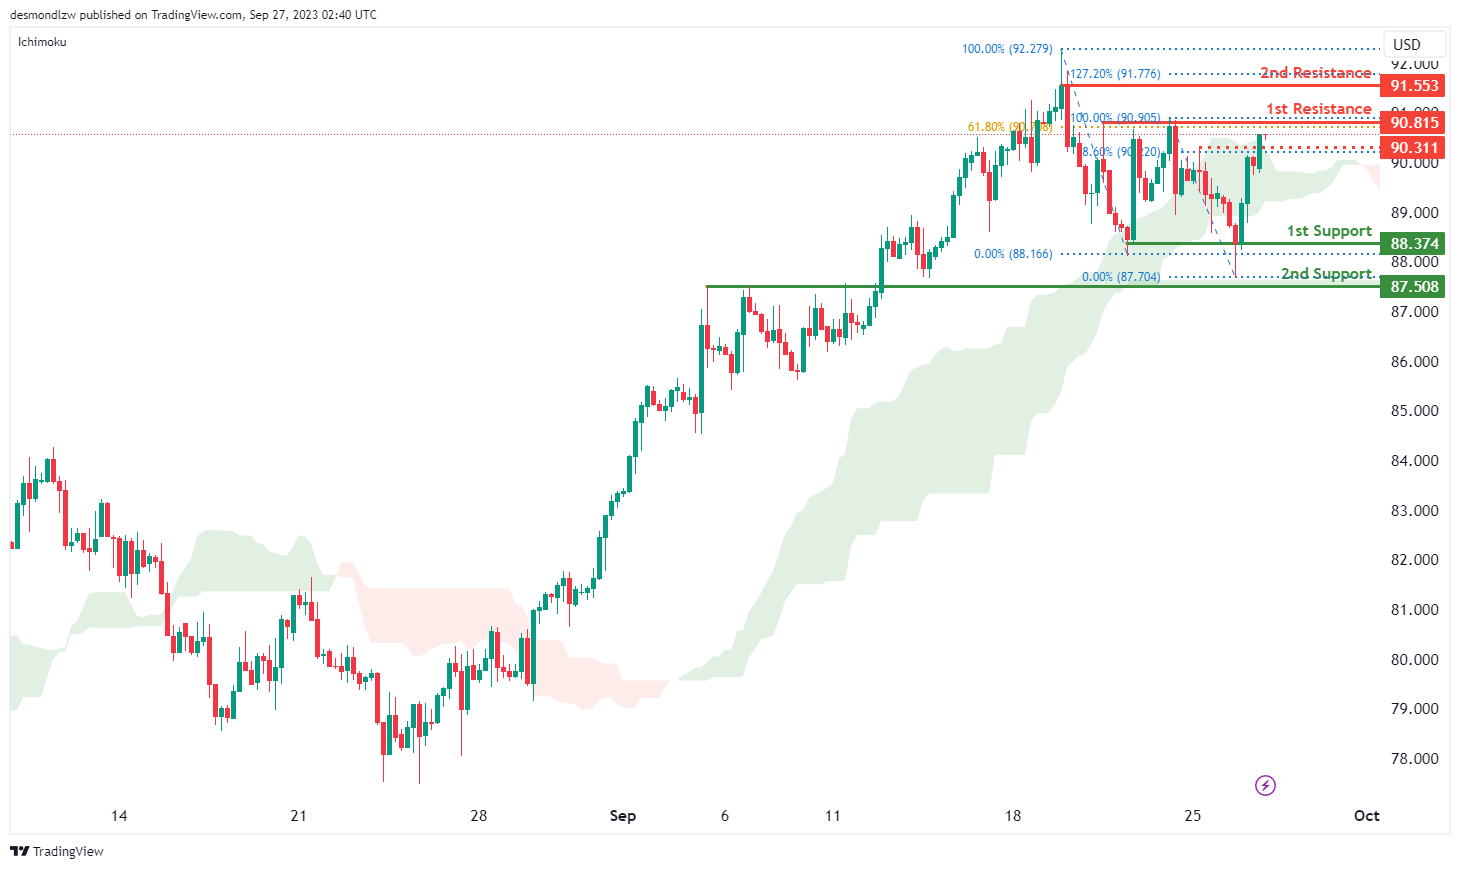
The WTI (West Texas Intermediate) chart currently exhibits a bullish momentum with price potentially breaking above the intermediate resistance level and making a bullish continuation towards the 1st resistance level.
The intermediate resistance level at 90.31 is identified as a pullback resistance that aligns with the 78.60% Fibonacci retracement level while the the 1st resistance level at 90.82 is also noted as a pullback resistance that aligns with the 61.80% Fibonacci retracement level. Additionally, the 2nd resistance level at 91.55 is marked as a swing-high resistance that aligns with the 127.20% Fibonacci extension level.
To the downside, the 1st support level at 88.37 is identified as a pullback support while the 2nd support level at 87.51 is also marked as a pullback support, suggesting a potential strong support level in the past.
XAU/USD (GOLD):
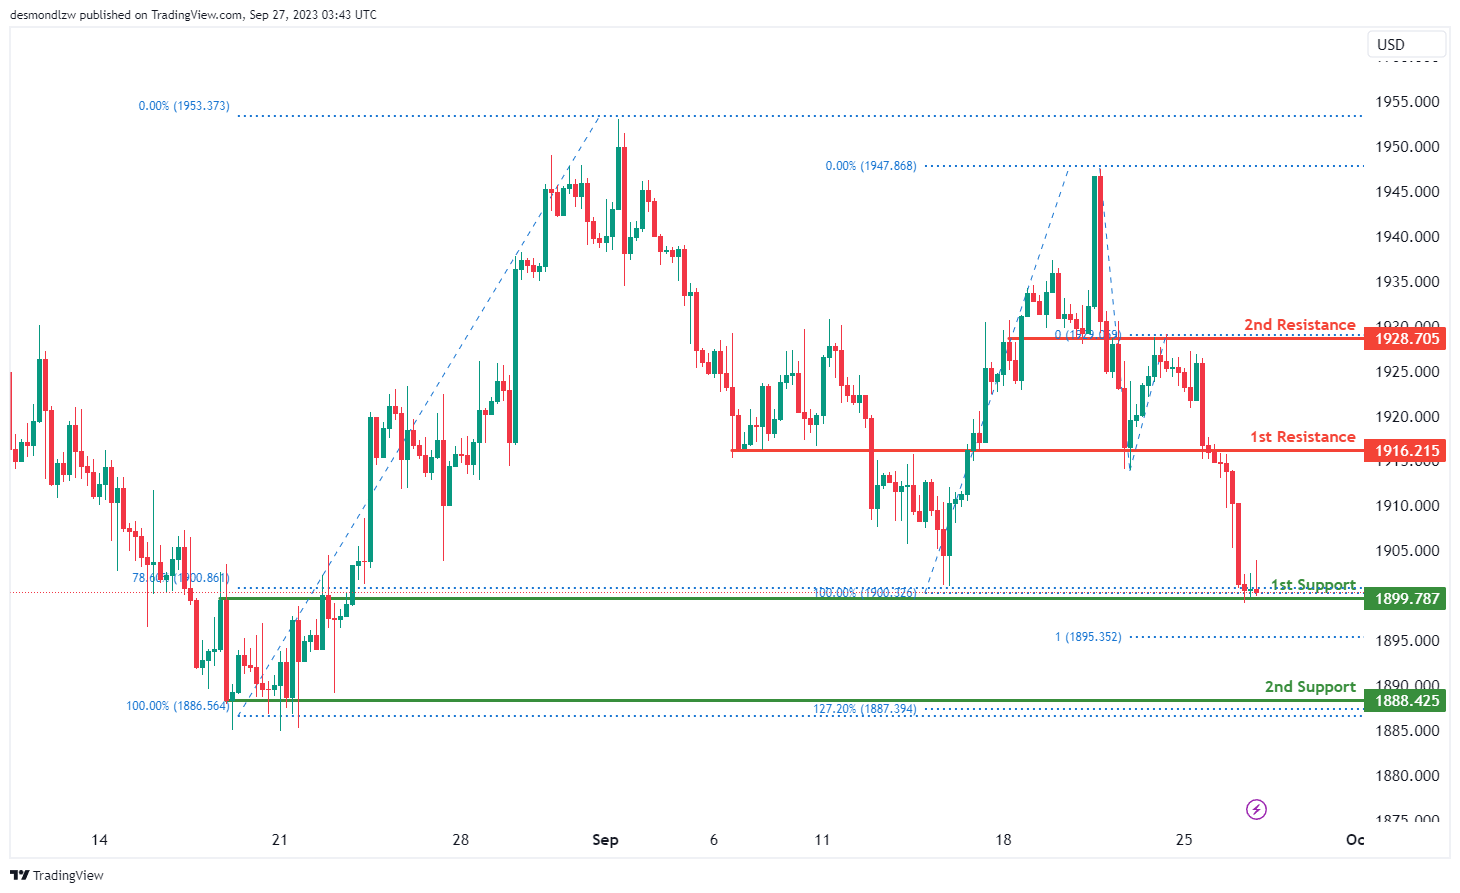
The XAUUSD chart currently signals bullish momentum, anticipating a potential bullish bounce off the 1st support heading towards the 1st resistance. The 1st support is set at 1899.78, acting as an overlap support and aligning with the 78.60% Fibonacci Retracement, underlining its significant supportive role. Furthermore, the 2nd support is located at 1888.42, distinguished as a multi-swing low support and coinciding with the 127.20% Fibonacci Extension, amplifying its importance.
On the flip side, resistance levels are mapped out with the 1st resistance at 1915.43, identified as a pullback resistance, playing a crucial role in potential price reversal scenarios. Beyond this, the 2nd resistance is pegged at 1928.70, acknowledged as an overlap resistance.
Gold at 1900 key support zone as selloff intensifies
Gold is under intensifying selling pressure this week. The prominent drivers behind this selloff are strengthening Dollar and, crucially, surging treasury yields. As a result, the yellow metal finds itself back at a crucial support zone around 1900 mark.
Within this critical support region lies 38.2% retracement of 1614.60 (2022 low) to 2062.95 at 1891.68, as well as 55 W EMA (now at 1896.68). A clear break below this pivotal range would underscore the notion that whole rally originating from 1614.60 has completed at 2062.95 already, stopping short of 2020 high of 2074.84. This descent from 2062.95 could then be interpreted as a medium-term fall trend, as one of the falling legs inside the long term consolidation pattern from 2074.84.
For now, risk will stay on the downside as long as 1947.21 resistance holds. Sustained break of 1884.83 support will pave the way to 61.8% projection of 2062.95 to 1892.76 from 1947.21 at 1842.03 in the near term. 100% projection at 1777.02 and below will be the medium term target.
Drawing parallels with other markets, the extended decline in Gold, if realized, would be consistent with Dollar Index surging towards 108/110 zone.
BoJ minutes reveal diverging views on future policy direction
The minutes from BoJ meeting held on July 27 and 28 have unveiled differing perspectives among board members regarding the future direction of monetary policy. While a consensus was apparent on the immediate need to sustain ultra-low interest rates, members were divided on how to approach the medium to long term.
One member stated, "there was still a significantly long way to go before revising the negative interest rate policy, and the framework of yield curve control needed to be maintained".
The same member emphasized the importance of patience and consistency, suggesting that "it should carefully nurture the long-awaited signs of change in firms' behavior by patiently continuing with monetary easing."
Another participant weighed the risks of delaying versus hastening monetary tightening. In their perspective, the "risk of missing a chance to achieve the 2 percent target due to a hasty monetary tightening outweighed the risk of the inflation rate continuing to exceed 2 percent if monetary tightening fell behind the curve."
Yet another member presented a more optimistic outlook on the inflation target, noting that the "achievement of 2 percent inflation in a sustainable and stable manner seemed to have clearly come in sight." They further suggested that between January and March 2024, it might be feasible to evaluate the Bank's success in achieving the inflation target.
Despite the differences in outlook, BoJ decided to persist with its current easing policy settings but also opted to grant long-term borrowing costs more flexibility to rise.
Australia’s monthly CPI rose to 5.2%, led by housing and transport
Australia CPI for August rose from 4.9% yoy to 5.2% yoy, in line with market expectations.
Digging into the specifics, the sectors showing the most substantial annual gains were housing, which surged by 6.6%, followed by transport at 7.4%. Additionally, food and non-alcoholic beverages reported an increase of 4.4%. Notably, insurance and financial services marked the highest significant rise of 8.8%.
On the other hand, when considering CPI that excludes volatile items such as holiday travel, there was a slight dip from 5.8% yoy to 5.5% yoy. Meanwhile, the Annual trimmed mean CPI, which gives a clearer picture by removing the most volatile items, remained steady at 5.6% yoy.
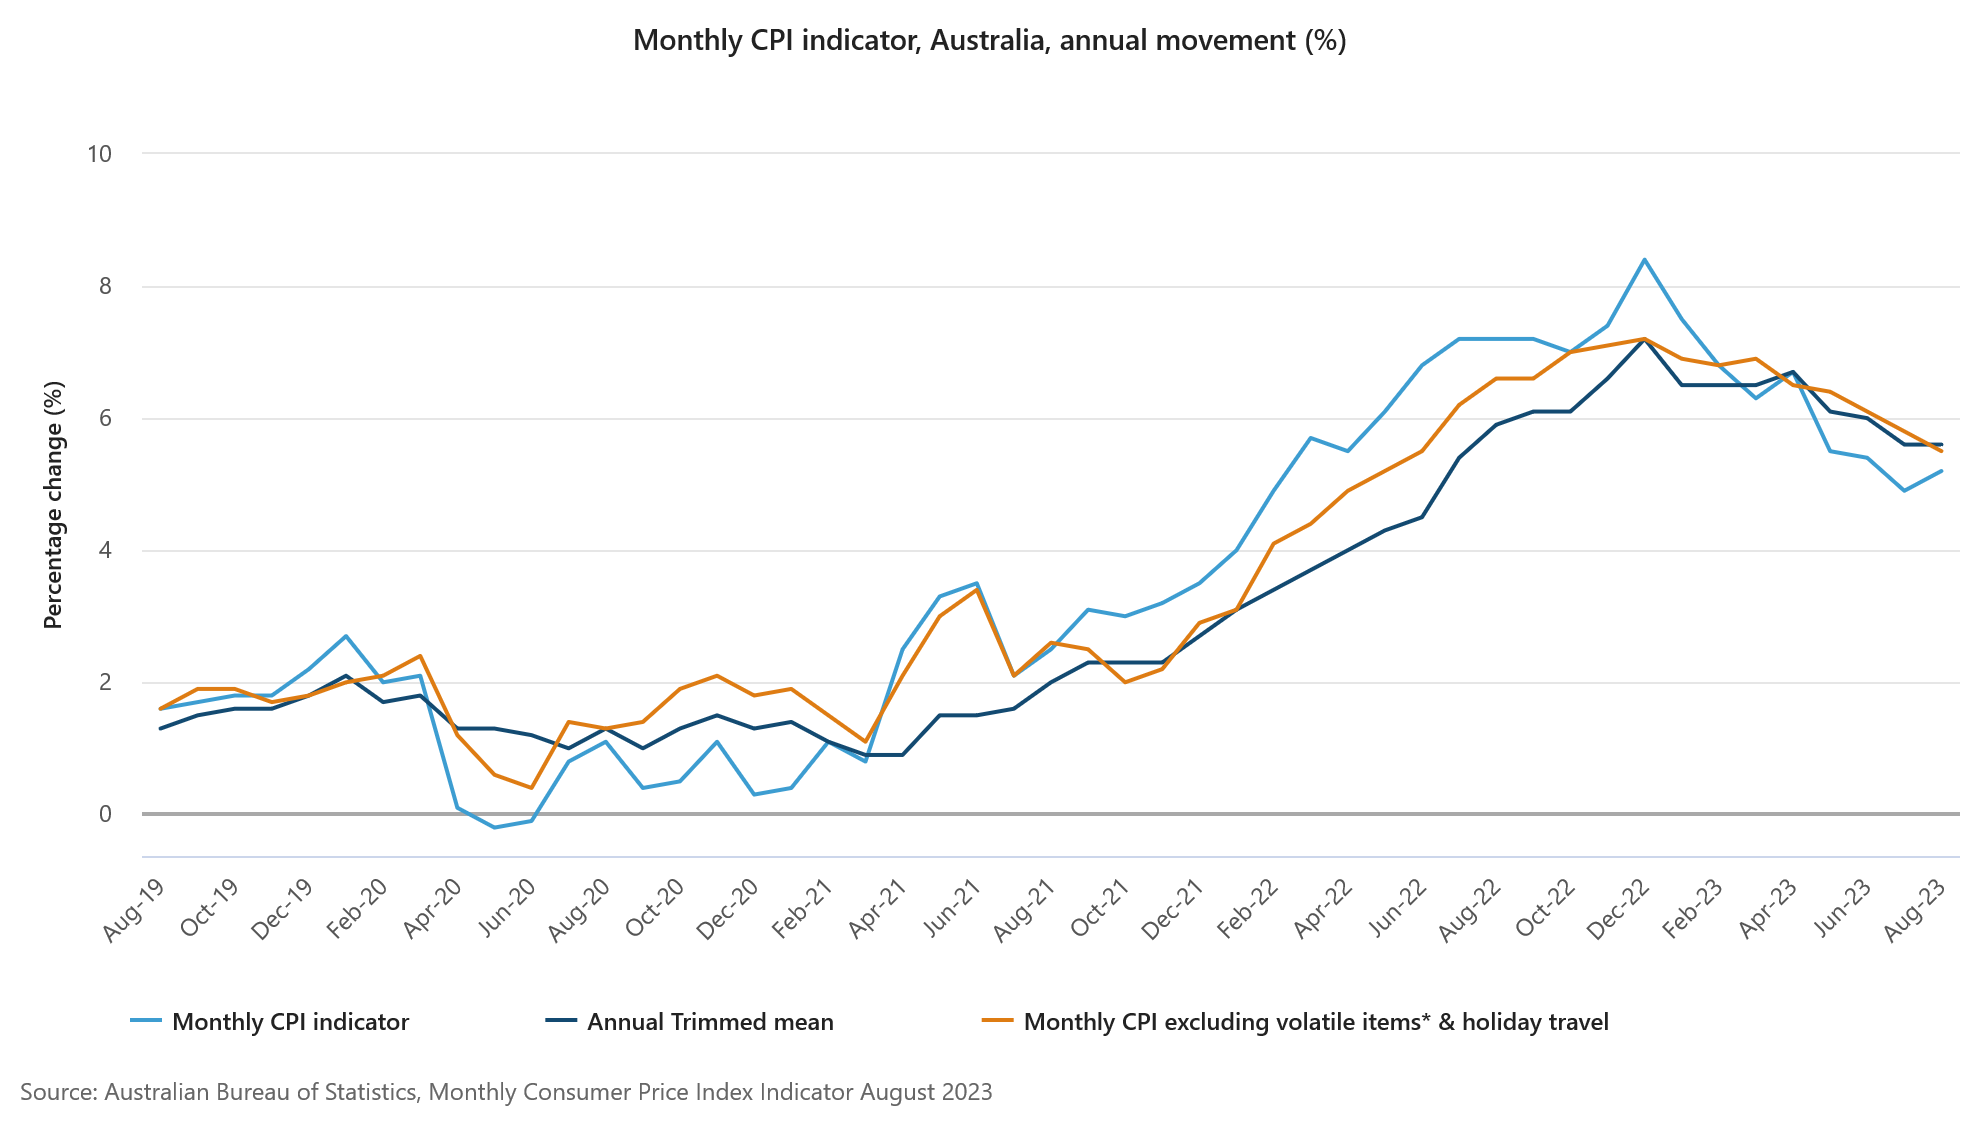
Full Australia monthly CPI release here.
AUD/USD Recovery Could Remain Capped Near 0.6450
Key Highlights
- AUD/USD declined below the 0.6450 and 0.6440 support levels.
- A major bullish trend line is forming with support near 0.6400 on the 4-hour chart.
- EUR/USD is showing heavy bearish signs below 1.0650.
- Gold prices moved lower and traded below the $1,920 support.
AUD/USD Technical Analysis
The Aussie Dollar started a fresh decline from the 0.6515 resistance against the US Dollar. AUD/USD traded below the 0.6450 support to enter a bearish zone.
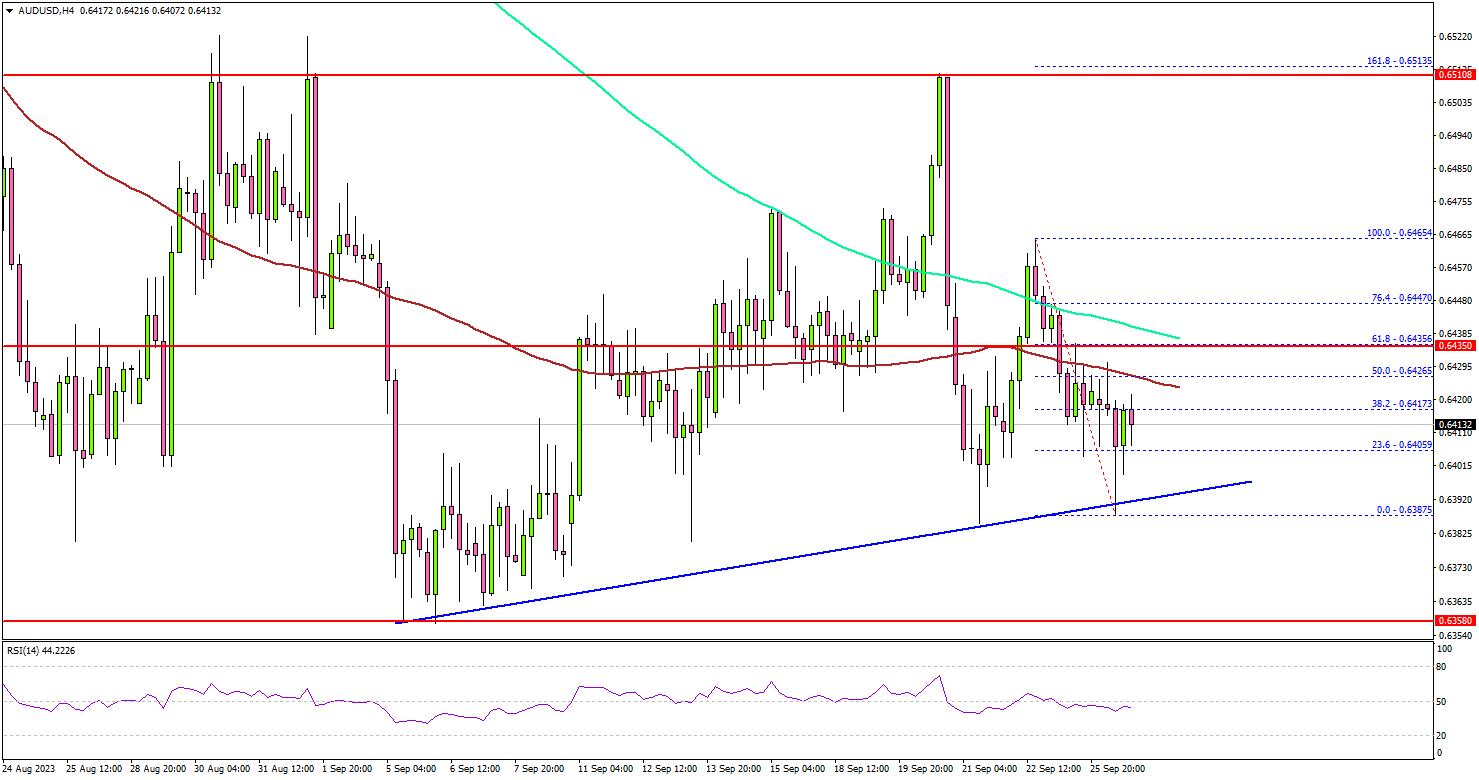
Looking at the 4-hour chart, the pair settled below the 0.6440 level, the 100 simple moving average (red, 4 hours), and the 200 simple moving average (green, 4 hours).
It traded as low as 0.6387 and recently started a minor upside correction. If there is a recovery wave, it could face resistance near the 0.6425 level and the 100 simple moving average (red, 4 hours).
The first major resistance is near the 0.6440 zone and the 200 simple moving average (green, 4 hours). The main resistance is now forming near the 0.6450 level. A close above 0.6450 could start a steady increase toward 0.6500.
Any more gains might send AUD/USD toward the 0.6550 resistance. On the downside, initial support is near the 0.6400 level. There is also a major bullish trend line forming with support near 0.6400 on the same chart.
The next key support is seen near the 0.6385 level, below which it could test 0.6360. If there is a move below 0.6360, the pair could dive toward 0.6320. Any more losses might send the pair toward the 0.6200 level.
Looking at EUR/USD, the pair remained in a bearish zone and might face a strong selling interest unless it recovers above 1.0650.
Economic Releases
- US Durable Goods Orders for August 2023 – Forecast -0.5% versus -5.2% previous.
- US Durable Goods Orders Ex Transportation for August 2023 – Forecast +0.1% versus +0.4% previous.
NZDJPY Rally from Extreme Area and Bullish Sequence
In this blog, we will take a look at the reaction from extreme area in NZDJPY, how buyers appeared in the area as expected and produced a strong reaction higher. We will look at how this area was calculated and also look at the current Elliott wave structure of this Yen cross. We will discuss the current Elliott Wave structure and short-term incomplete sequence that has been created and what it could lead to going forward.
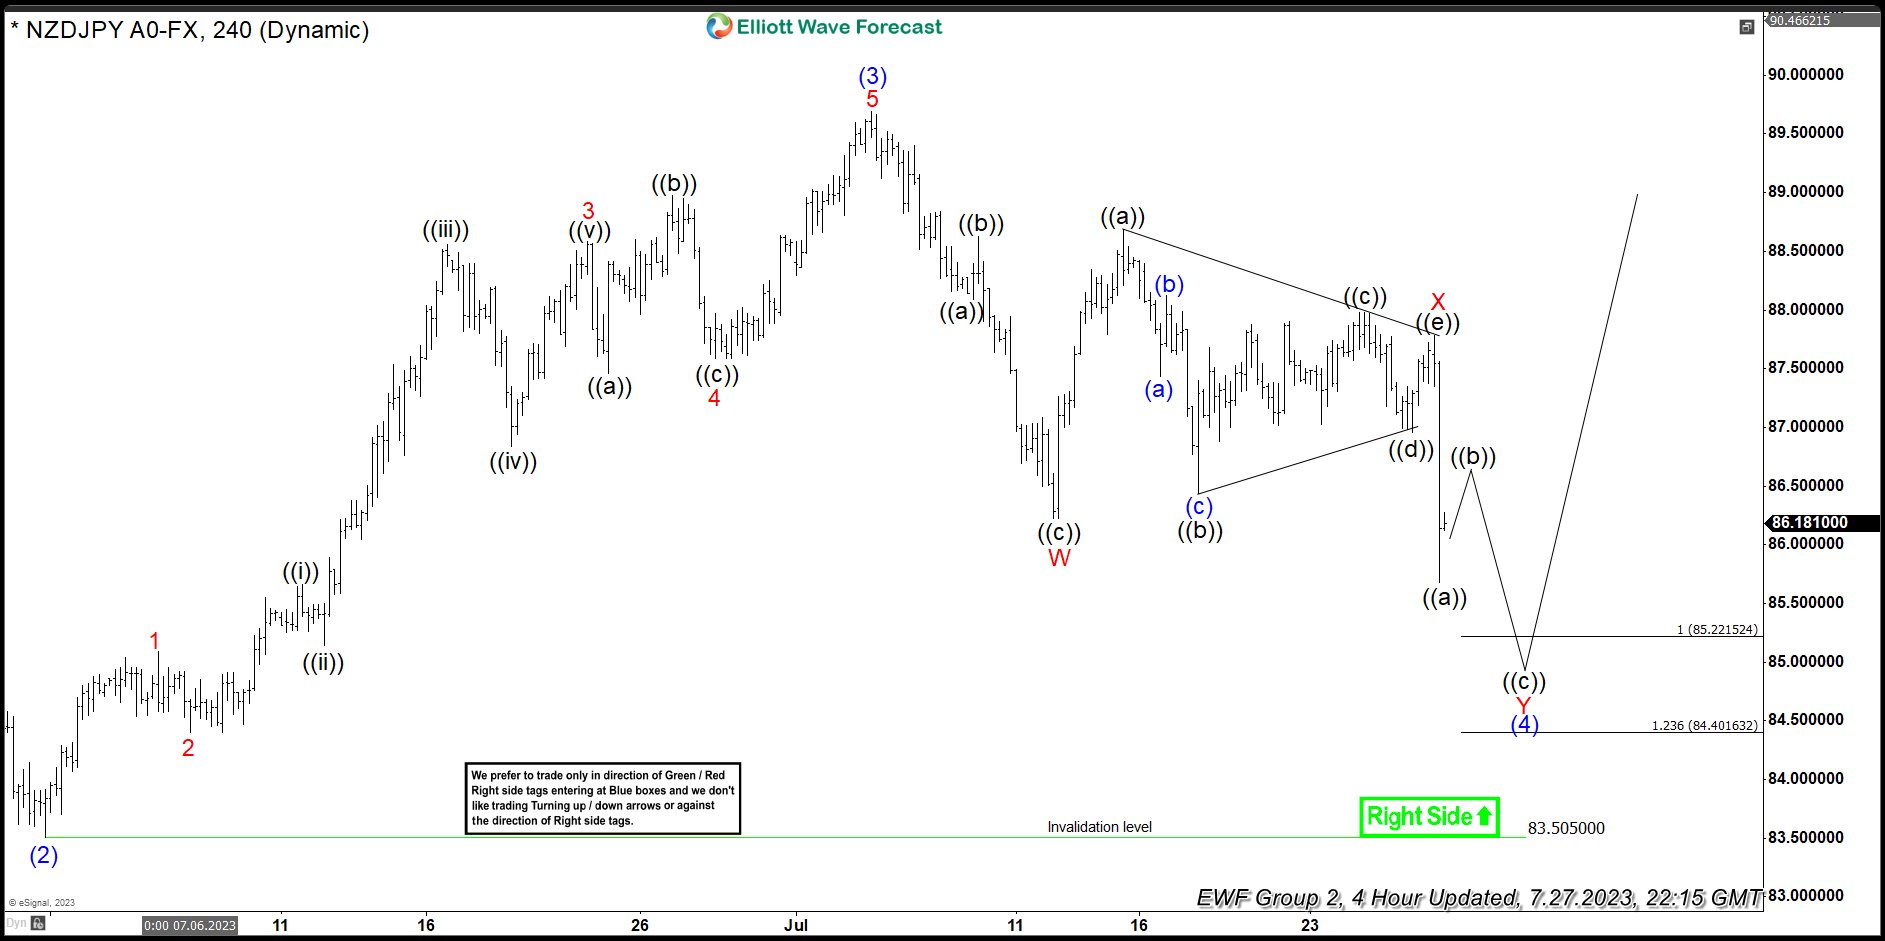
NZDJPY July 27, 4 Hour Elliott Wave Analysis
The chart below shows the pair to be in a double three Elliott wave structure with some more downside needed to complete the structure. It shows an extreme area (100 – 123.6 Fibonacci extension) between 85.22 – 84.40 where we expected the correction to end and buyers to appear to resume the rally or produce 3 waves reaction higher at least.
NZDJPY September 26, Daily Elliott Wave Analysis
The chart below is a daily chart and shows the pair reached the extreme area between 85.22 – 84.40 and turned higher sharply. It rallied to 88.59 which we have labelled as wave 1 of the new cycle. This was followed by a pullback to 85.79 which we have labeled as wave 2. It started rallying again and it has now broken above 88.59 peak which creates a short-term incomplete sequence higher from 7.28.2023 low against 8.21.2023 low and has a 100 – 161.8% Fibonacci extension target area coming between 89.44 – 91.68.
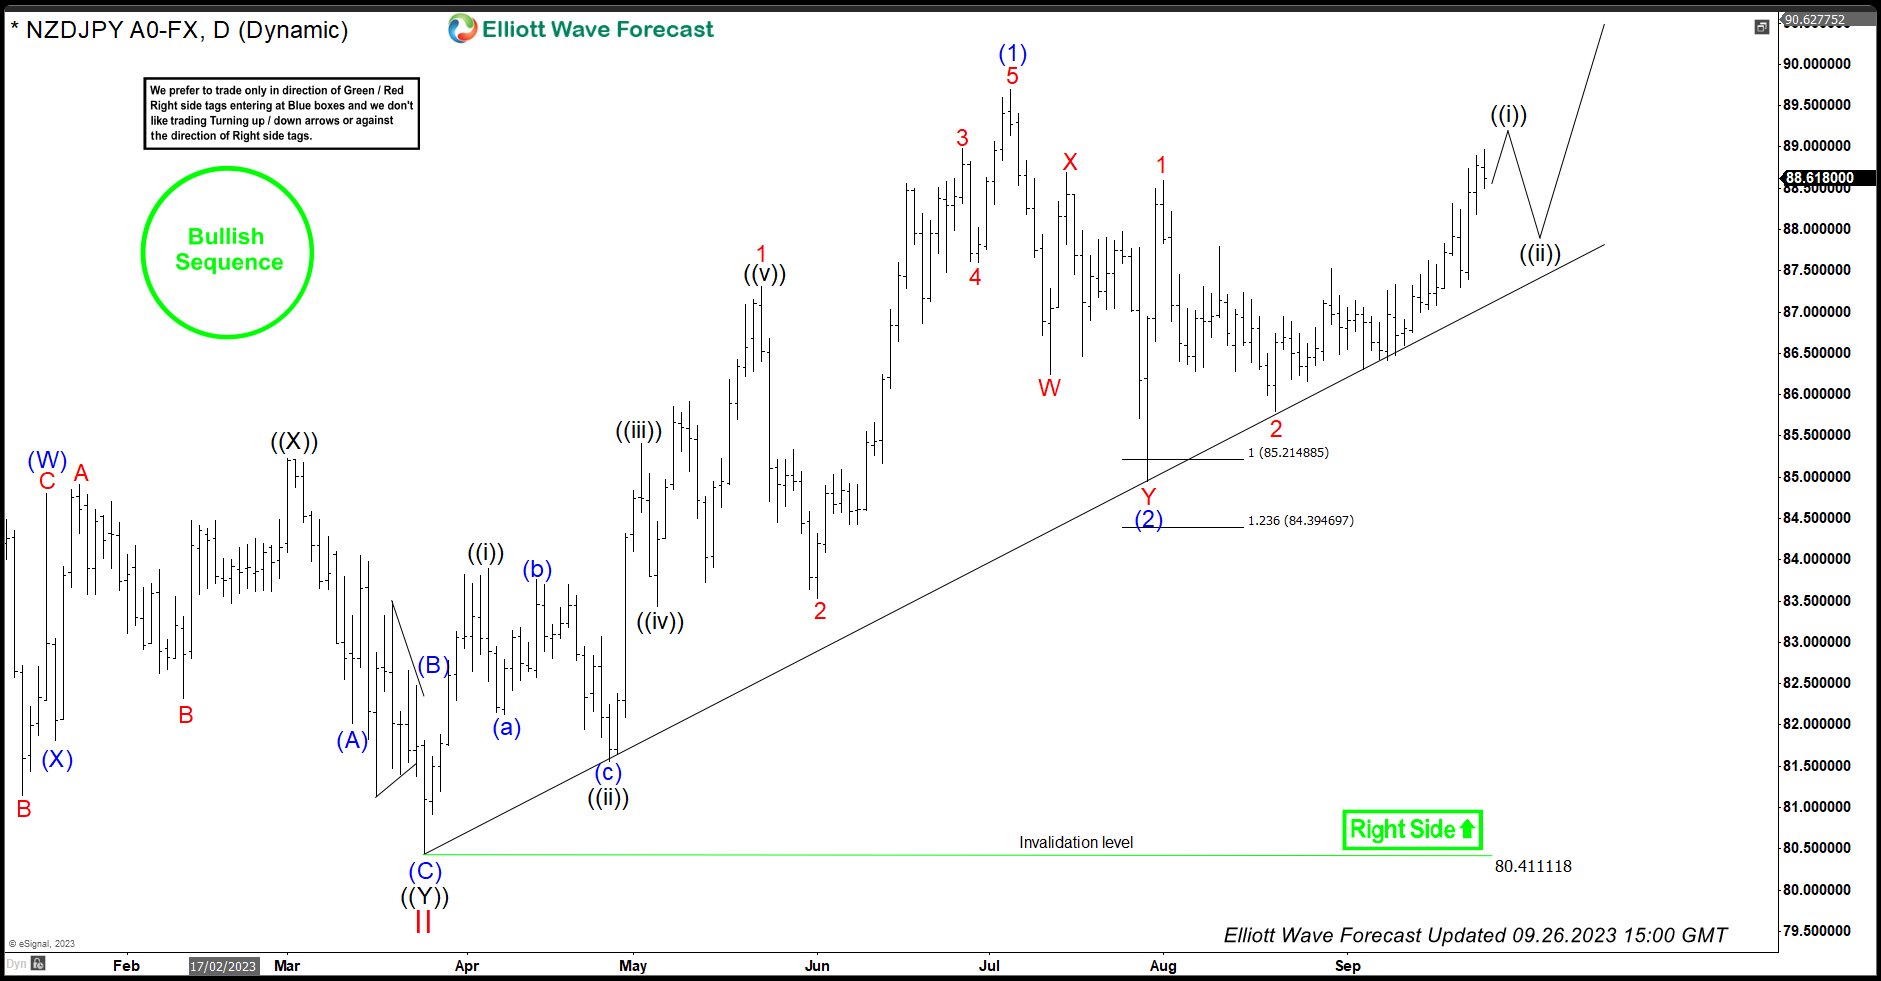
Blue wave (1) peak was seen on 7.5.2023 @ 89.69, a break of this level will create a larger bullish sequence up from 3.24.2023 low against 7.28.2023 low and confirm further upside in NZDJPY and other Yen crosses with 61.8% Fibonacci extension coming at 90.66 and 100% Fibonacci extension coming at 94.20. We don’t like selling the pair and near-term dips should remain supported in 3, 7 or 11 swings for extension higher toward 89.44. Once 7.5.2023 peak breaks, that will create a 4 hour bullish sequence and offer buying opportunities again in the dips in 3, 7 or 11 swings.
[VIDEO]: NZDJPY Reaction from Extreme Area and Incomplete Sequence
https://www.youtube.com/watch?v=mjlZk5WfZE4
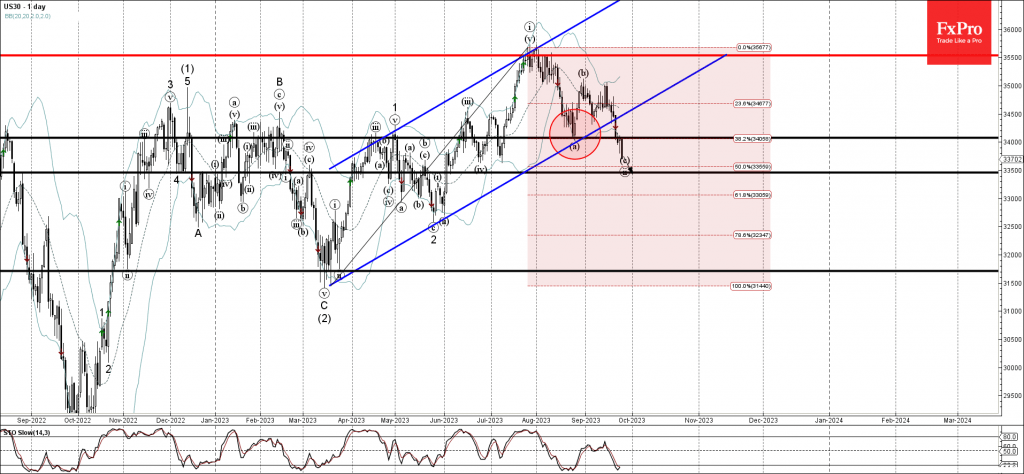
Dow Jones index Wave Analysis
- Dow Jones index broke key support level 34000.00
- Likely to fall to support level 33500.00
Dow Jones index recently broke key support level 34000.00 (low of the previous wave a) intersecting with the 38.2% Fibonacci correction of the previous upward impulse from March.
The breakout of the support level 34000.00 was preceded by the breakout of the daily up channel from March – which accelerated the active wave ii.
Dow Jones index can be expected to fall further toward the next support level 33500.00, target for the completion of the active wave ii.