Sample Category Title
GBP/USD Mid-Day Outlook
Daily Pivots: (S1) 1.2184; (P) 1.2221; (R1) 1.2247; More...
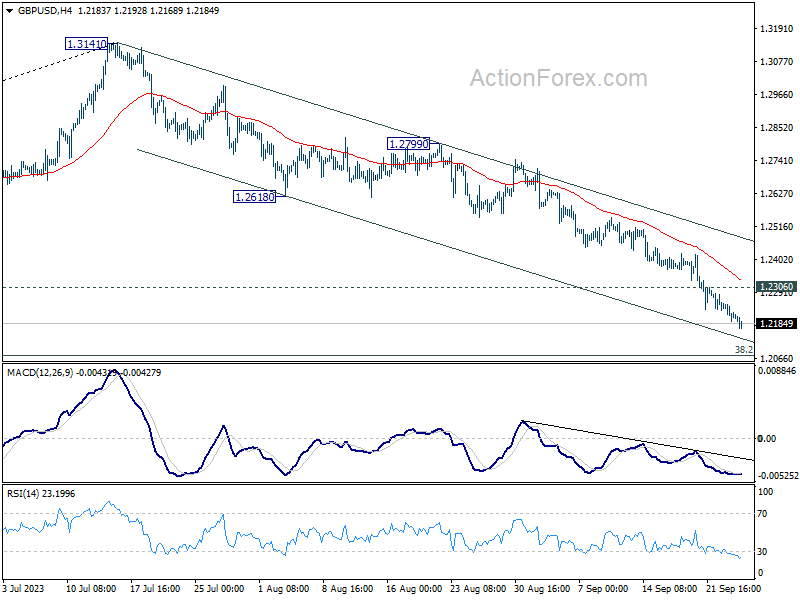
GBP/USD's decline is in progress and intraday bias stays on the downside. Fall from 1.3141 should target 1.2075 fibonacci level. On the upside, above 1.2306 minor resistance will turn intraday bias neutral and bring consolidations. But near term outlook will stay bearish as long as 1.2618 support turned resistance holds, in case of strong recovery.
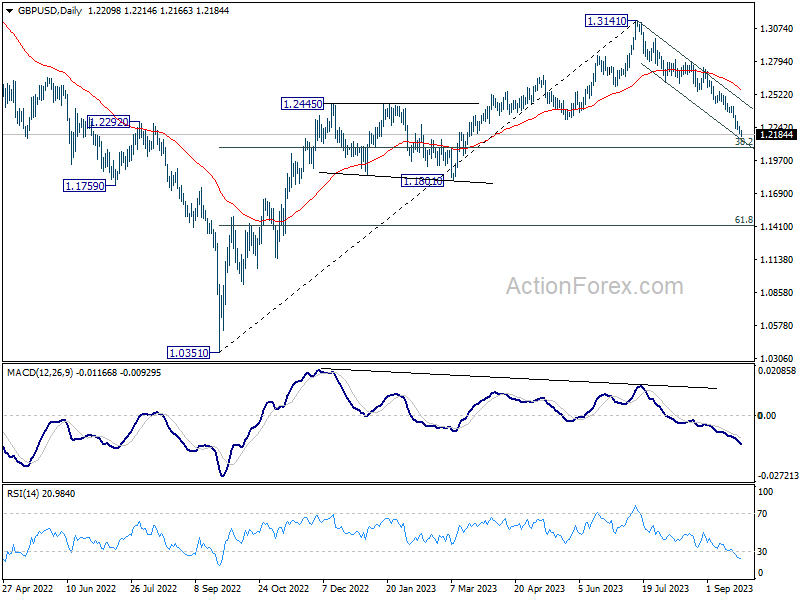
In the bigger picture, fall from 1.3141 medium term top is seen as a correction to up trend from 1.0351 (2022 low). Deeper decline would be seen to 38.2% retracement of 1.0351 to 1.3141 at 1.2075. Strong support would be seen there to bring rebound on first attempt. However, sustained break of 1.2075 will raise the chance of bearish trend reversal and target 1.1801 structural support next.
EUR/USD Mid-Day Outlook
Daily Pivots: (S1) 1.0616; (P) 1.0644; (R1) 1.0673; More...
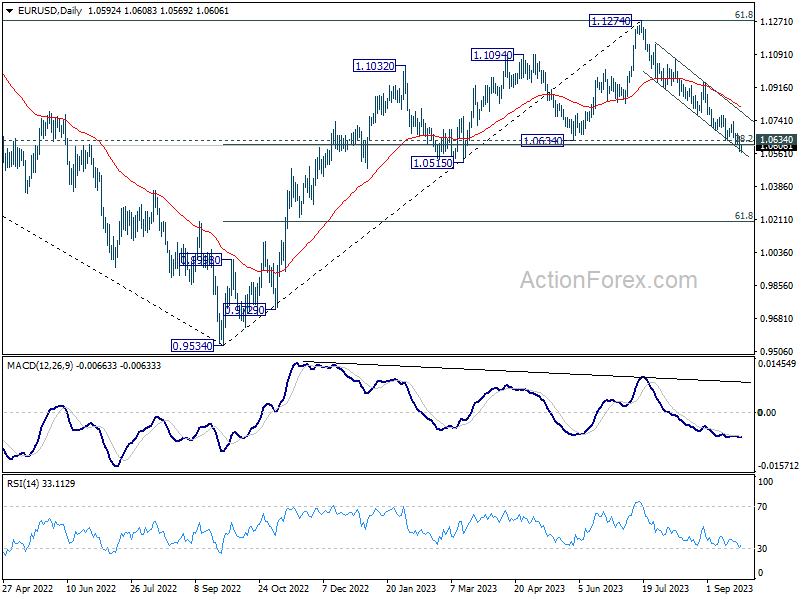
Intraday bias in EUR/USD remains on the downside at this point. Sustained trading below 1.0609/34 cluster support will carry larger bearish implication, and target 1.0515 support next. On the upside, above 1.0672 minor resistance will turn intraday bias neutral and bring consolidations. But outlook will stay bearish as long as 1.0764 support turned resistance holds.
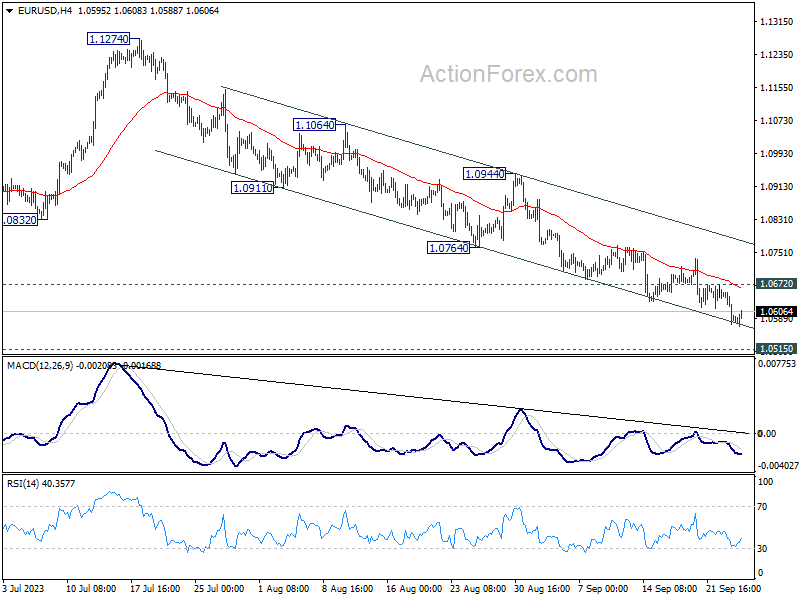
In the bigger picture, focus stays on 1.0634 cluster support (38.2% retracement of 0.9534 to 1.1274 at 1.0609). Sustained trading below there would rase the chance of bearish trend reversal. That is, fall from 1.1274 could be reversing whole rise from 0.9534 (2022 low). But even if it's just a corrective move, deeper decline would be seen to 61.8% retracement at 1.0199. For now, risk will stay on the downside as long as 55 D EMA (now at 1.0825) holds, in case of rebound.
USD/CHF Mid-Day Outlook
Daily Pivots: (S1) 0.9075; (P) 0.9106; (R1) 0.9151; More....
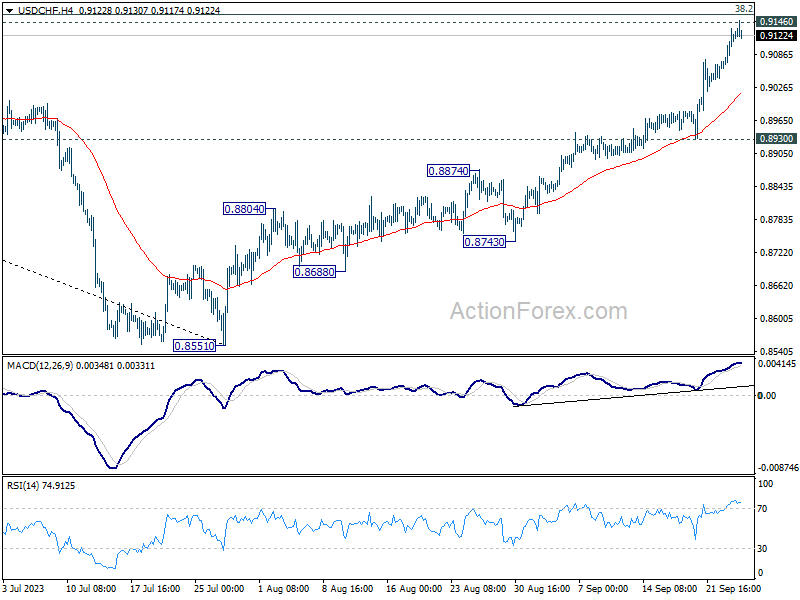
Intraday bias in USD/CHF remains on the upside for the moment. Decisive break of 0.9146/60 cluster resistance will carry larger bullish implication, and target 0.9439 resistance next. On the downside, break of 0.8930 support is needed to confirm short term topping. Otherwise, outlook will stay bullish in case of retreat.
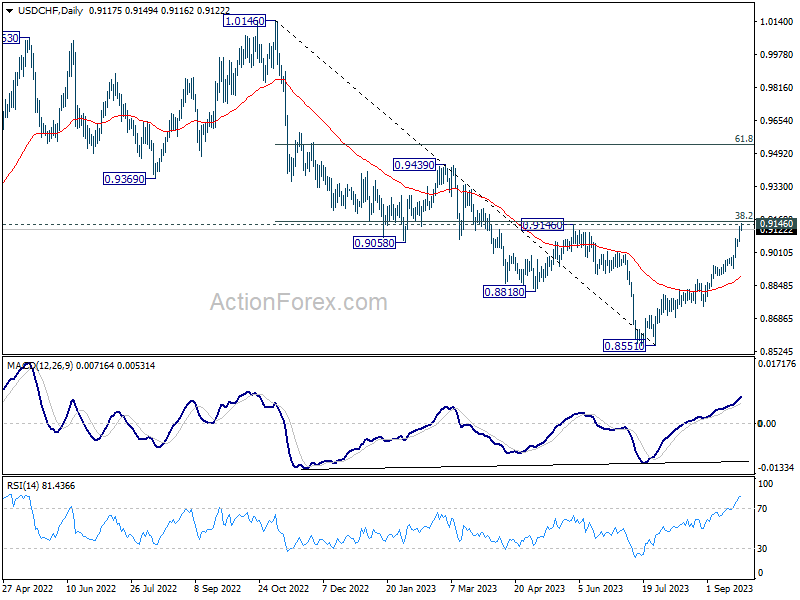
In the bigger picture, rebound from 0.8551 medium term bottom is currently seen as a correction to the downtrend from 1.0146 (2022 high). Further rally would be seen to 0.9146 cluster resistance (38.2% retracement of 1.0146 to 0.8551 at 0.9160). Strong resistance could be seen there to limit upside, at least on first attempt. However, decisive break of 0.9146/60 will indicate trend reversal, and target 61.8% retracement at 0.9537.
USD/JPY Mid-Day Outlook
Daily Pivots: (S1) 148.43; (P) 148.70; (R1) 149.15; More...
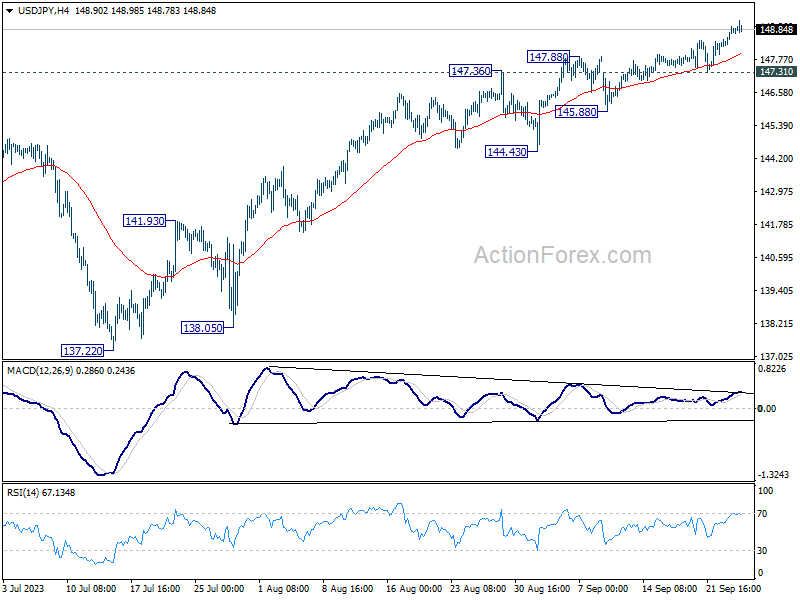
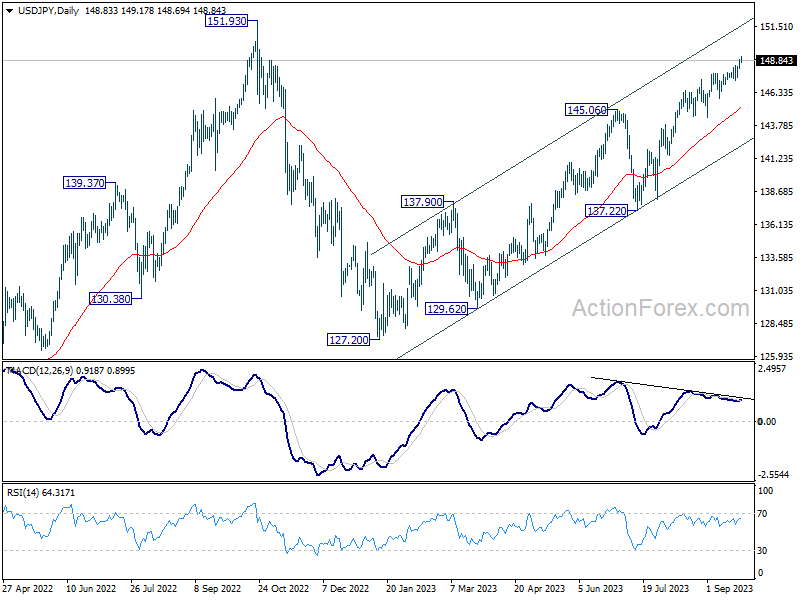
Intraday bias in USD/JPY remains on the upside for the moment. Current rise from 127.20 is in progress to retest 151.93 high. On the downside, however, firm break of 147.31 support will should confirm short term topping, and turn bias to the downside for 145.88 support and below.
In the bigger picture, while rise from 127.20 is strong, it could still be seen as the second leg of the corrective pattern from 151.93 (2022 high). Rejection by 151.93, followed by break of 137.22 support will indicate that the third leg of the pattern has started. However, sustained break of 151.93 will confirm resumption of long term up trend.
Dollar Losing Some Momentum Amidst Government Shutdown Concerns
Dollar, although retaining its strength, is witnessing mild deceleration in upside momentum as US session starts. The spotlight now shines on any potential progress within the US Congress to prevent a partial government shutdown looming this Sunday. While the notion of a shutdown isn't unfamiliar in the US, having occurred 14 times since 1981, this instance carries heightened significance. Moody's recent warning accentuates this, indicating that a shutdown now could underline how escalating political divides are deteriorating the nation's fiscal position.
Focusing on other currencies, Euro emerges as today's frontrunner, with the Yen and Dollar trailing closely. On the other end of the spectrum, Canadian Dollar appears to be the most underwhelming performer, with Sterling and Aussie not faring much better. Swiss Franc and Kiwi present a mixed picture for the time being.
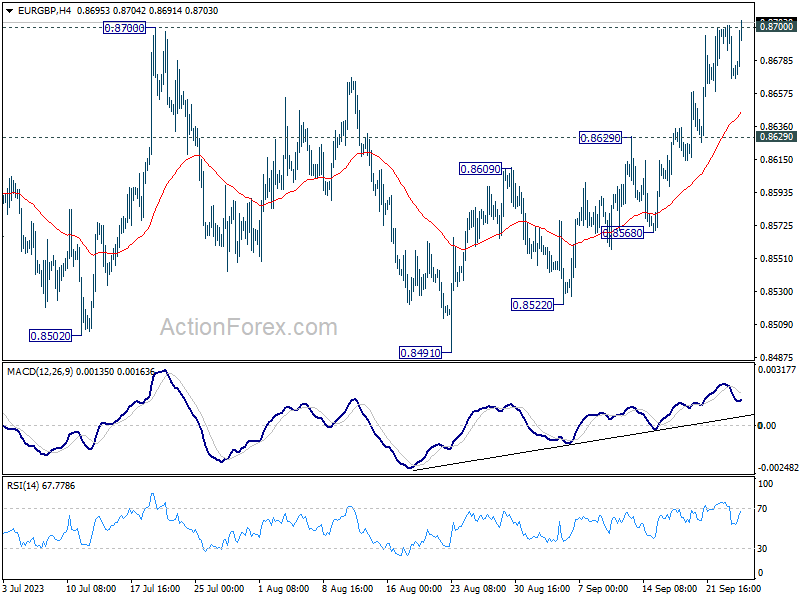
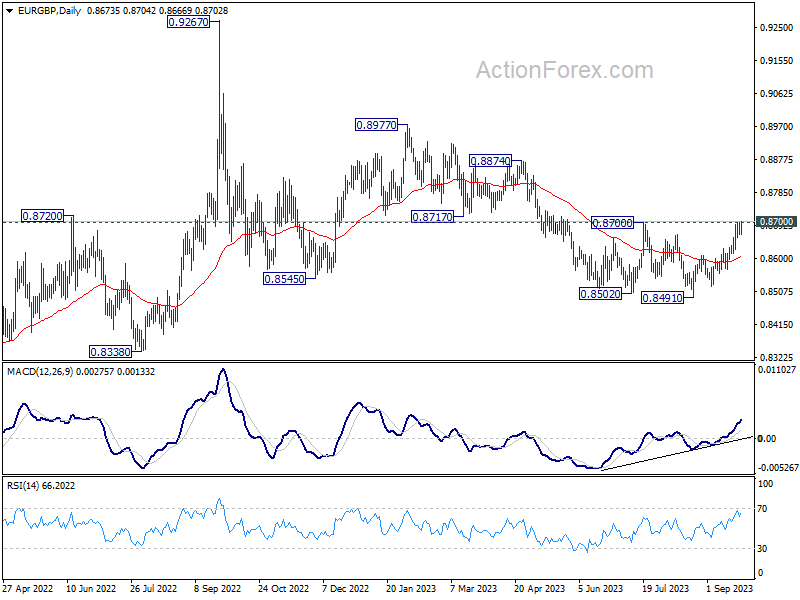
Technically, EUR/GBP is having another take on 0.8700 structural resistance today. Decisive break there will strengthen the case that whole corrective fall from 0.9267 has completed with three waves down to 0.8491. That would turn near outlook bullish for further rise to 0.8874/8977 resistance zone. Any upside acceleration in EUR/GBP could help cushion Euro's decline against Dollar.
In Europe, at the time of writing, FTSE is up 0.21%. DAX is down -0.62%. CAC is down -0.66%. Germany 10-year yield is down -0.020 at 2.780. Earlier in Asia, Nikkei dropped -1.11%. Hong Kong HSI dropped -1.48%. China Shanghai SSE dropped -0.43%. Singapore Strait Times dropped -0.01%. Japan 10-year JGB yield rose 0.0150 to 0.746.
ECB's Muller expects steady interest rates for the time being
ECB Governing Council member Madis Muller said today he does not anticipate any further hikes in interest rates for the time being.
The significant question is on the duration for which borrowing costs might remain at heightened levels. Expounding on this, he mentioned, "will depend on how the euro-area economy develops over the year and how the slowing of inflation plays out."
Highlighting the current economic climate, Muller stated, "Right now, we see that the economic situation is relatively weak in the euro area as a whole."
He, however, expressed a cautious optimism about the region's economic future, noting the potential for modest improvements. "
Looking forward, it could start improving slightly. If the recovery is slower, then that means smaller pressures in terms of inflation," Muller added.
Japanese officials weigh in on Yen's slide as it approaches 149 against Dollar
This week's decline of Yen against Dollar, which seems poised to breach 149 mark, has brought remarks from Japanese officials into sharp focus. Market participants are keen to decipher indications of when Japan might transition from verbal caution to active intervention, even though it's clear that Japan wouldn't pre-announce such a move.
Finance Minister Shunichi Suzuki, reiterating his consistent position, stated today, "Foreign exchange rates should be determined by market forces, reflecting fundamentals."
Suzuki emphasized that "Excessive volatility is undesirable," and assured that the government is monitoring the currency fluctuations with a "high sense of urgency". "We will respond as appropriate to excessive volatility without ruling out any options," he added.
Echoing Suzuki's sentiments, the newly appointed Economy Minister, Yoshitaka Shindo, stressed the significance of stable currency movements that mirror economic realities.
Pointing out the multifaceted impact of the Yen's position, Shindo elaborated, "Weak Yen has various effects on economy such as raising import costs for consumers, improving competitiveness of exporters."
With these comments, the stage is set for a heightened scrutiny of Japan's potential interventions in the currency market. Market participants will no doubt remain vigilant to further remarks and actions by Japanese officials in the coming days.
USD/JPY Mid-Day Outlook
Daily Pivots: (S1) 148.43; (P) 148.70; (R1) 149.15; More...
Intraday bias in USD/JPY remains on the upside for the moment. Current rise from 127.20 is in progress to retest 151.93 high. On the downside, however, firm break of 147.31 support will should confirm short term topping, and turn bias to the downside for 145.88 support and below.
In the bigger picture, while rise from 127.20 is strong, it could still be seen as the second leg of the corrective pattern from 151.93 (2022 high). Rejection by 151.93, followed by break of 137.22 support will indicate that the third leg of the pattern has started. However, sustained break of 151.93 will confirm resumption of long term up trend.
Economic Indicators Update
| GMT | Ccy | Events | Actual | Forecast | Previous | Revised |
|---|---|---|---|---|---|---|
| 23:50 | JPY | Corporate Service Price Index Y/Y Aug | 2.10% | 1.80% | 1.70% | |
| 13:00 | USD | S&P/CS Composite-20 HPI Y/Y Jul | -0.50% | -1.20% | ||
| 13:00 | USD | Housing Price Index M/M Jul | 0.10% | 0.30% | ||
| 14:00 | USD | Consumer Confidence Sep | 105.9 | 106.1 | ||
| 14:00 | USD | New Home Sales Aug | 700K | 714K |
AUDUSD Found Sellers After Elliott Wave Double Three Pattern
Hello fellow traders. In this technical article we’re going to take a look at the Elliott Wave charts charts of AUDUSD forex pair published in members area of the website. As our members know AUDUSD has recently made recovery against the 0.6520 peak that has unfolded as Elliott Wave Double Three Pattern. It made clear 7 swings from the lows and completed correction at the extreme zone . In further text we’re going to explain the Elliott Wave pattern and trading strategy
Before we take a look at the real market example, let’s explain Elliott Wave Double Three pattern.
Elliott Wave Double Three Pattern
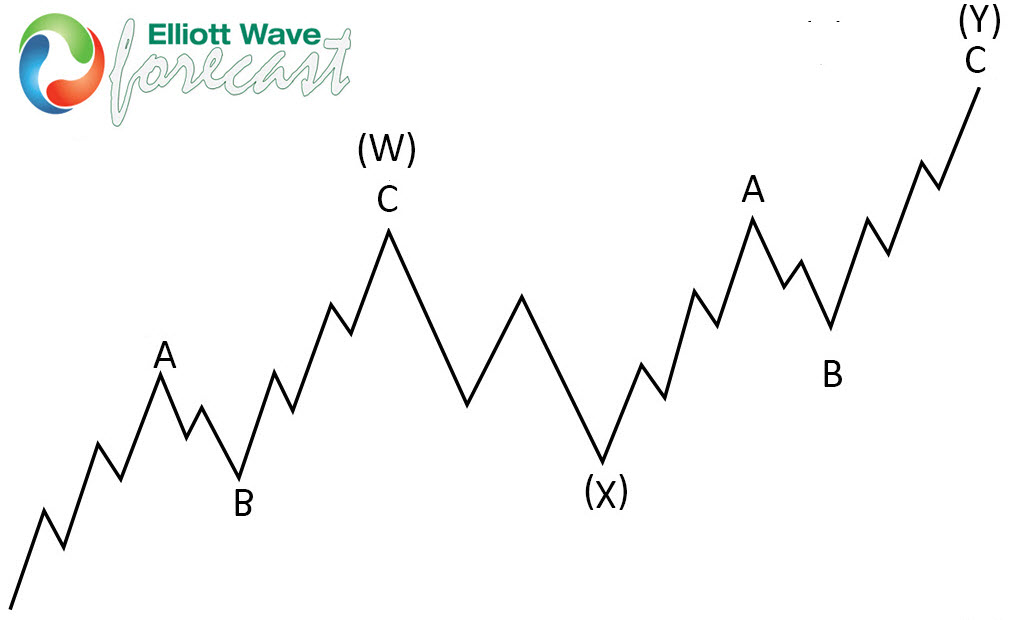
Double three is the common pattern in the market , also known as 7 swing structure. It’s a reliable pattern which is giving us good trading entries with clearly defined invalidation levels.
The picture below presents what Elliott Wave Double Three pattern looks like. It has (W),(X),(Y) labeling and 3,3,3 inner structure, which means all of these 3 legs are corrective sequences. Each (W) and (Y) are made of 3 swings , they’re having A,B,C structure in lower degree, or alternatively they can have W,X,Y labeling.
AUDUSD 1 Hour Elliott Wave Analysis 09.20.2023
AUDUSD made 5 waves down from the 0.652 peak and now correcting that cycle. The pair is giving us (ii) blue recovery that is unfolding as Elliott Wave Double Three Pattern. Correction has wxy red inner labeling. The extreme zone has been already reached at 0.64718-0.64938. However, we expect to see another leg up to complete 7 swings. It’s important that correction ends below 0.65207 peak. We can see either decline toward new lows or larger 3 waves pull back at least. Invalidation for the current count would be break above 0.65207
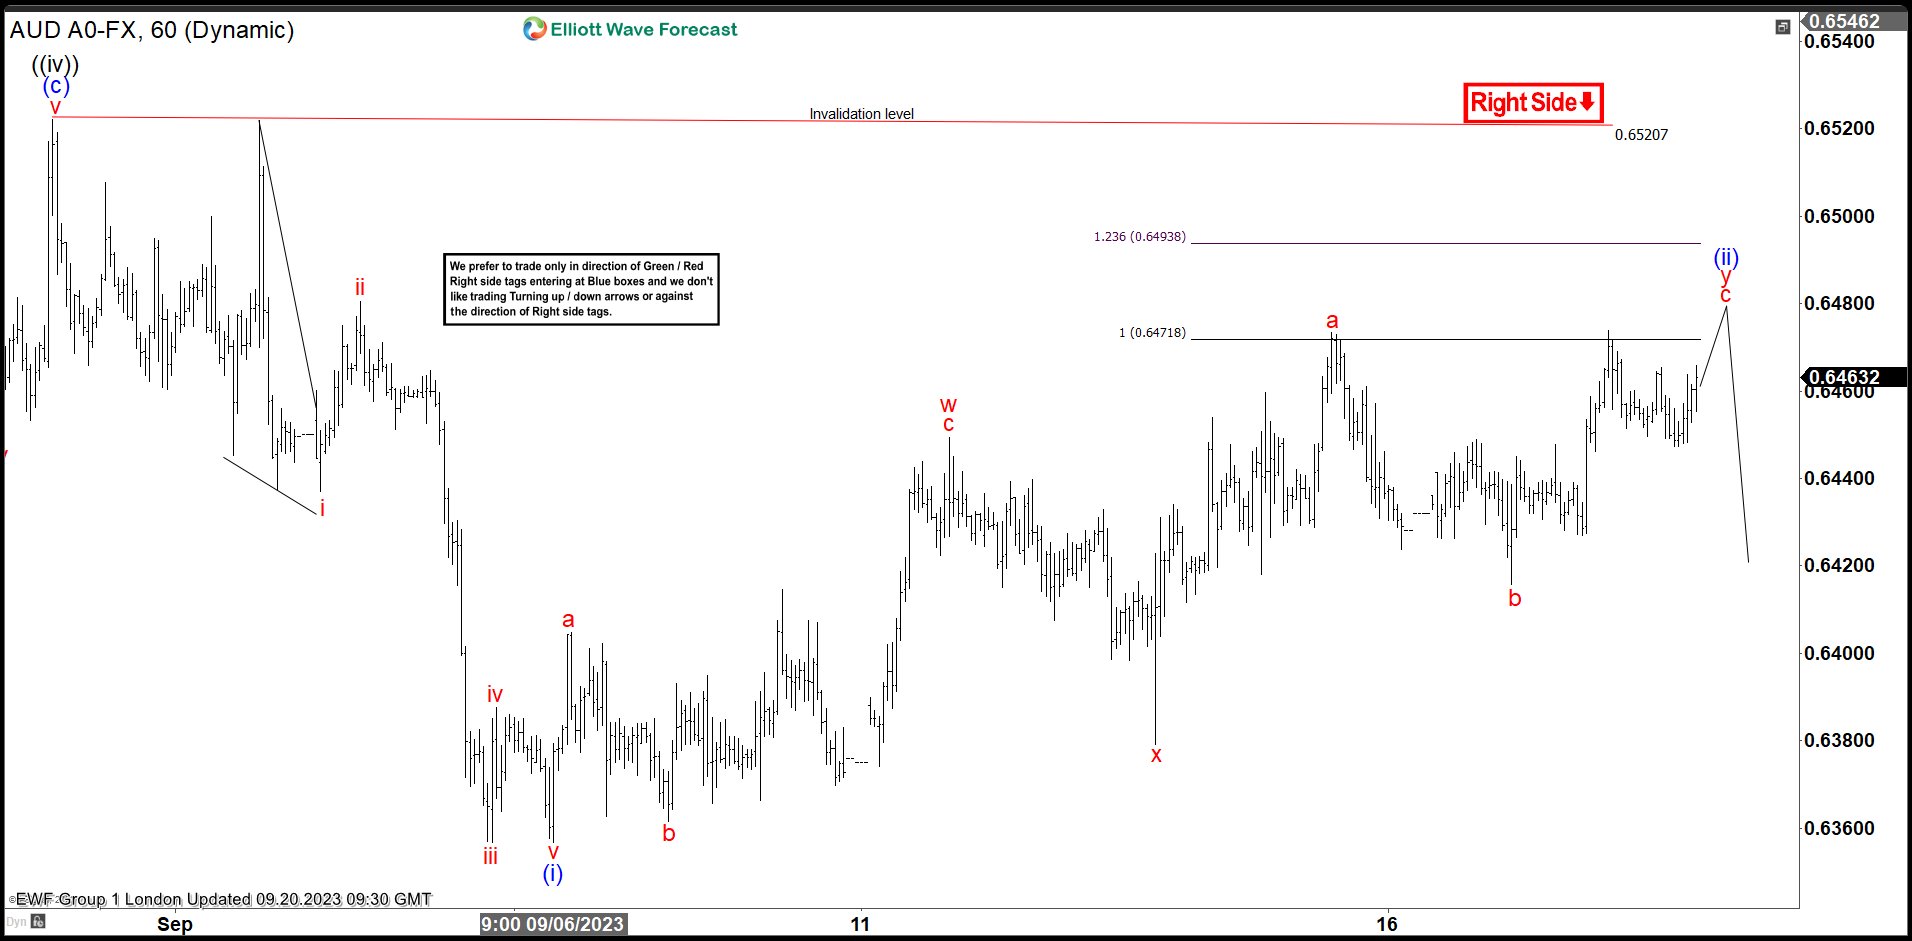
AUDUSD 1 Hour Elliott Wave Analysis 09.20.2023
AUDUSD made proposed leg up and complete 7 swings structure. Previous high: 0.65207 held well during the correction. The pair found sellers at the extreme area and we got decline as expected. Current view suggests ((iv)) black recovery completed at 0.65101 high. As far as the price holds below that peak, further weakness should follow.
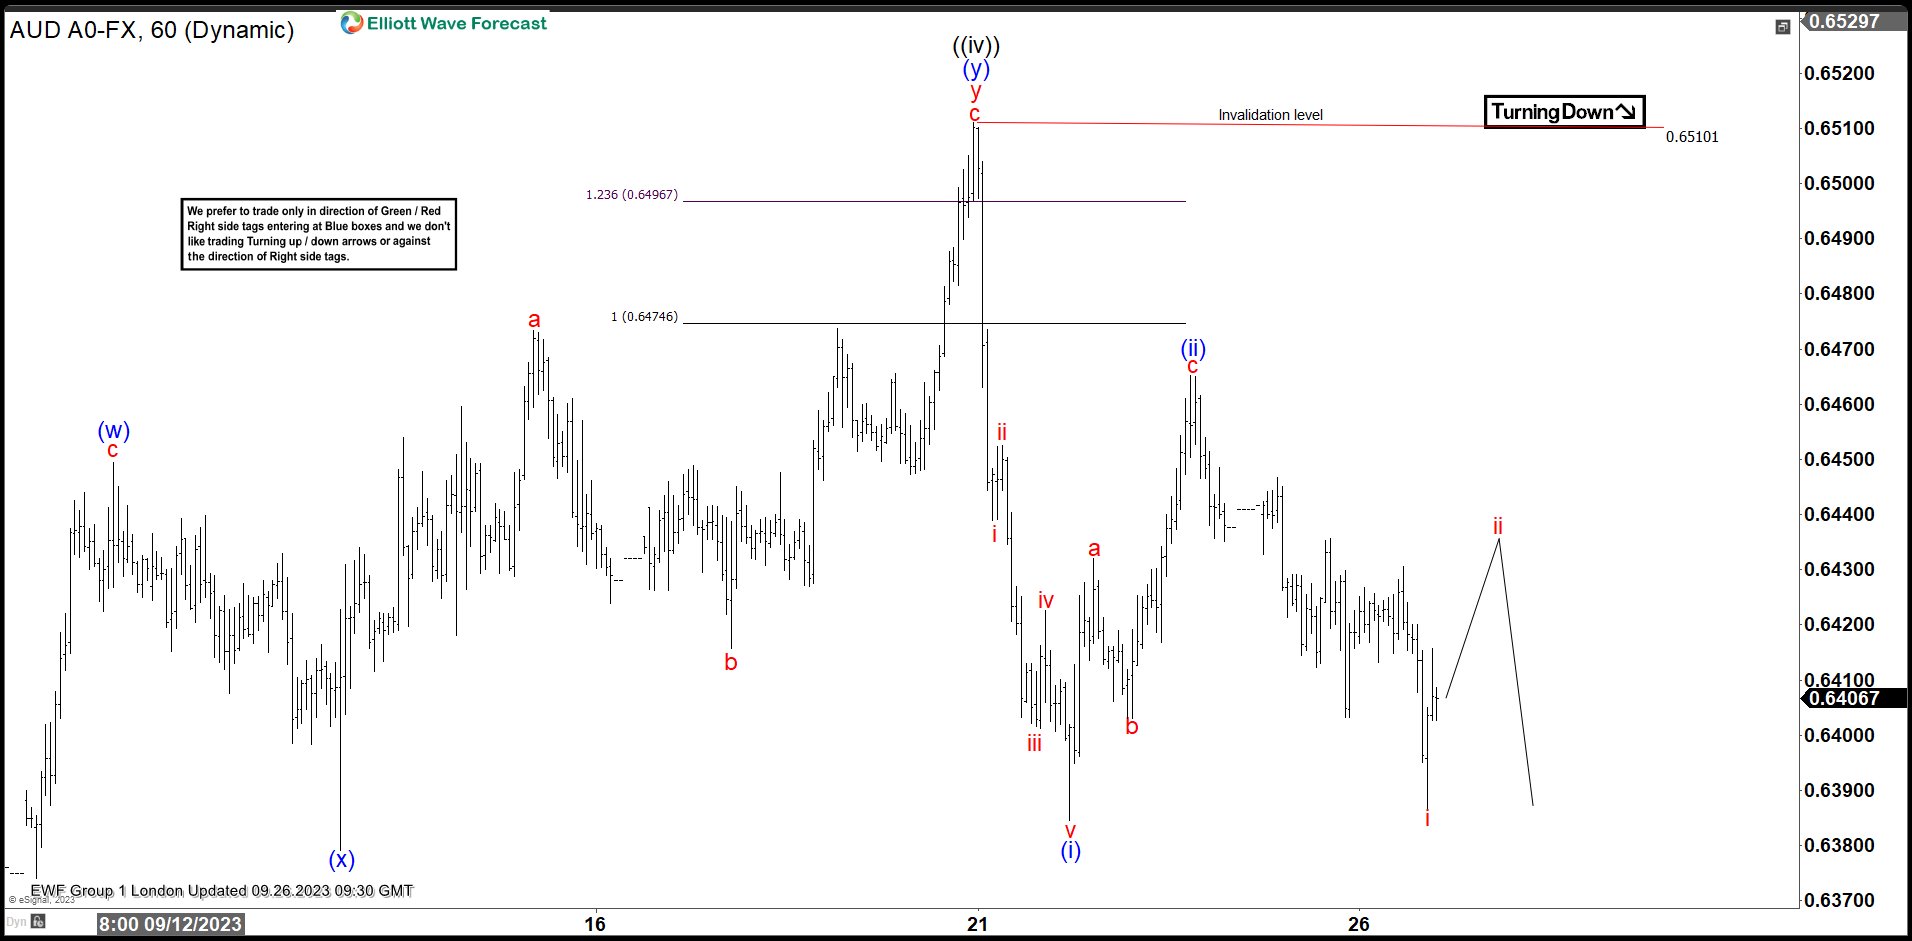
ECB’s Muller expects steady interest rates for the time being
ECB Governing Council member Madis Muller said today he does not anticipate any further hikes in interest rates for the time being.
The significant question is on the duration for which borrowing costs might remain at heightened levels. Expounding on this, he mentioned, "will depend on how the euro-area economy develops over the year and how the slowing of inflation plays out."
Highlighting the current economic climate, Muller stated, "Right now, we see that the economic situation is relatively weak in the euro area as a whole."
He, however, expressed a cautious optimism about the region's economic future, noting the potential for modest improvements. "
Looking forward, it could start improving slightly. If the recovery is slower, then that means smaller pressures in terms of inflation," Muller added.
Pound Fell Too Fast: Likely to Rebound
The British Pound lost ground against the Dollar for the fifth consecutive session, falling below the 1.2200 level. GBPUSD is down 4% since the beginning of the month, when pressure on the Pound intensified, and 7.3% from July’s peak.
Fundamentally, the latest phase of the Pound’s sell-off is due to the Bank of England’s softer-than-expected response to the latest inflation report. The technical reason is the break below the 200-day moving average, which has prompted some key market participants to revise their long-term outlook.
The last time the GBPUSD was this oversold on the RSI was about a year ago. This indicator has fallen as low as 20% on a daily timeframe. Last year, it was only lower for three days at the end of September, followed by an impressive reversal.
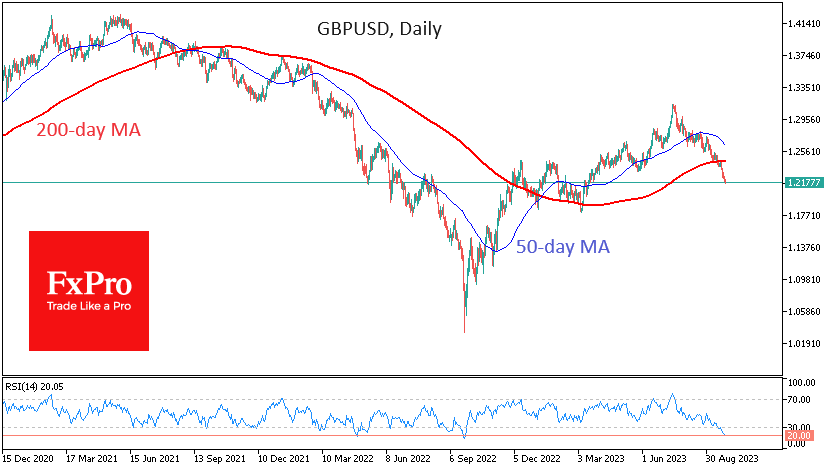
However, the situation is not directly comparable. Then, there was a real exodus from the Pound, with a fall to historic lows of just over 1.03. The current decline is similar to what we saw in May 2018 or October 2016. GBPUSD then temporarily recovered 40-50% of the initial losses before resuming the downward movement.
From current levels, a corrective bounce in the Pound could take the pair back to 1.2320, an area of previous support with a high probability of becoming resistant. A more ambitious target for the bulls is 1.2430, with a 200-day moving average and two downward reversals, in December and in January.
Could This Week’s CPI Prints Diminish the Chances of Further ECB Rate Hikes?
- Inflation data in the spotlight as the market prices in rate cuts
- The ECB kept the door open to more rate hikes, but growth remains a big thorn
- German CPI due out on Thursday; the euro area aggregate on Friday (09:00 GMT)
Has the ECB hiked for the last time?
Contrary to the other key central banks, the ECB announced another rate hike at its September meeting. The statement and the accompanying press conference did not differ much from the message coming from the recent Jackson Hole gathering as President Lagarde, and numerous hawks after the meeting, has tried to keep the door open to another rate hike if needed. However, the market does not appear convinced as the next rate move is expected to be a rate cut. Understandably, most ECB doves have also come out, insisting that the ECB has done enough.
As the September ECB staff projections showed headline inflation dropping to 2.1% by 2025, and core inflation a tad higher at 2.2%, one can say that the ECB is probably not there yet. And at this point, the discussion about the growth outlook comes in. The market believes that a stagnant economy, and potentially a short-term recession, will persist, increasing the possibility of inflation slowing down even more aggressively. This expectation is mostly confirmed by the most recent PMI figures.
ECB is aware of the grim growth outlook
However, Lagarde made it clear that the ECB is aware that the rough patch will continue in the fourth quarter of 2023, spilling over into 2024 as well. And despite this grim outlook, the ECB opted to hike, potentially fearing that the current inflation deceleration could be temporary. Considering the oil price performance over the past two months, these fears could materialize going forward. Additionally, a couple of weeks ago we got an interesting comment from Bank of Japan member Tamura. He commented that Japan's inflation is likely to slow for the time being, and then accelerate moderately again. If this applies to the euro area economy as well, then the ECB is probably sensible in keeping an open mind at this juncture.
Inflation still matters
In this context, on Thursday we will get the preliminary print for German inflation with the euro area aggregate figures released on Friday. Regarding Germany, the market is currently forecasting a significant deceleration at the annual pace of increase from 6.1% in August to just 4.6% in September. If confirmed, this will be the lowest headline figure since October 2021, a strong sign that the ECB’s monetary policy stance is working. Consequently, the euro area aggregate print is also expected to record a slowdown but less dramatic. The headline figure is seen easing to a 4.5% YoY growth from 5.2% in August, with the core component forecast to slow to an annual growth of 4.8%.
What does that mean for the ECB and the euro?
Unfortunately for the hawks, the ECB has reached the stage where an upside surprise in inflation is not sufficient justification for a rate hike at the next meeting. Other pieces of the economic puzzle i.e. growth outlook, wage developments and oil price action must align in order to increase the possibility of an inflation overshoot and eventually force the ECB to react. However, in the case of a stronger inflation print this week, the euro stands to benefit against the US dollar. A move towards the 1.0720 area could clearly please the euro bulls but these gains might prove short-lived if the incoming data continue to paint a grim growth picture.
On the flip side, the barrier for rate cuts remains high. However, certain ECB members have started to mention the word “cut” which suits the market’s intentions. We will gradually see more "rate cut" comments if there is a downside surprise at this week’s CPI figures. This outcome could bring forward the currently priced-in rate cuts and thus allow the euro-dollar pair to continue its aggressive downward trend. A break of the busy 1.0481-1.0571 area could open the door to a more protracted move towards 1.0315.
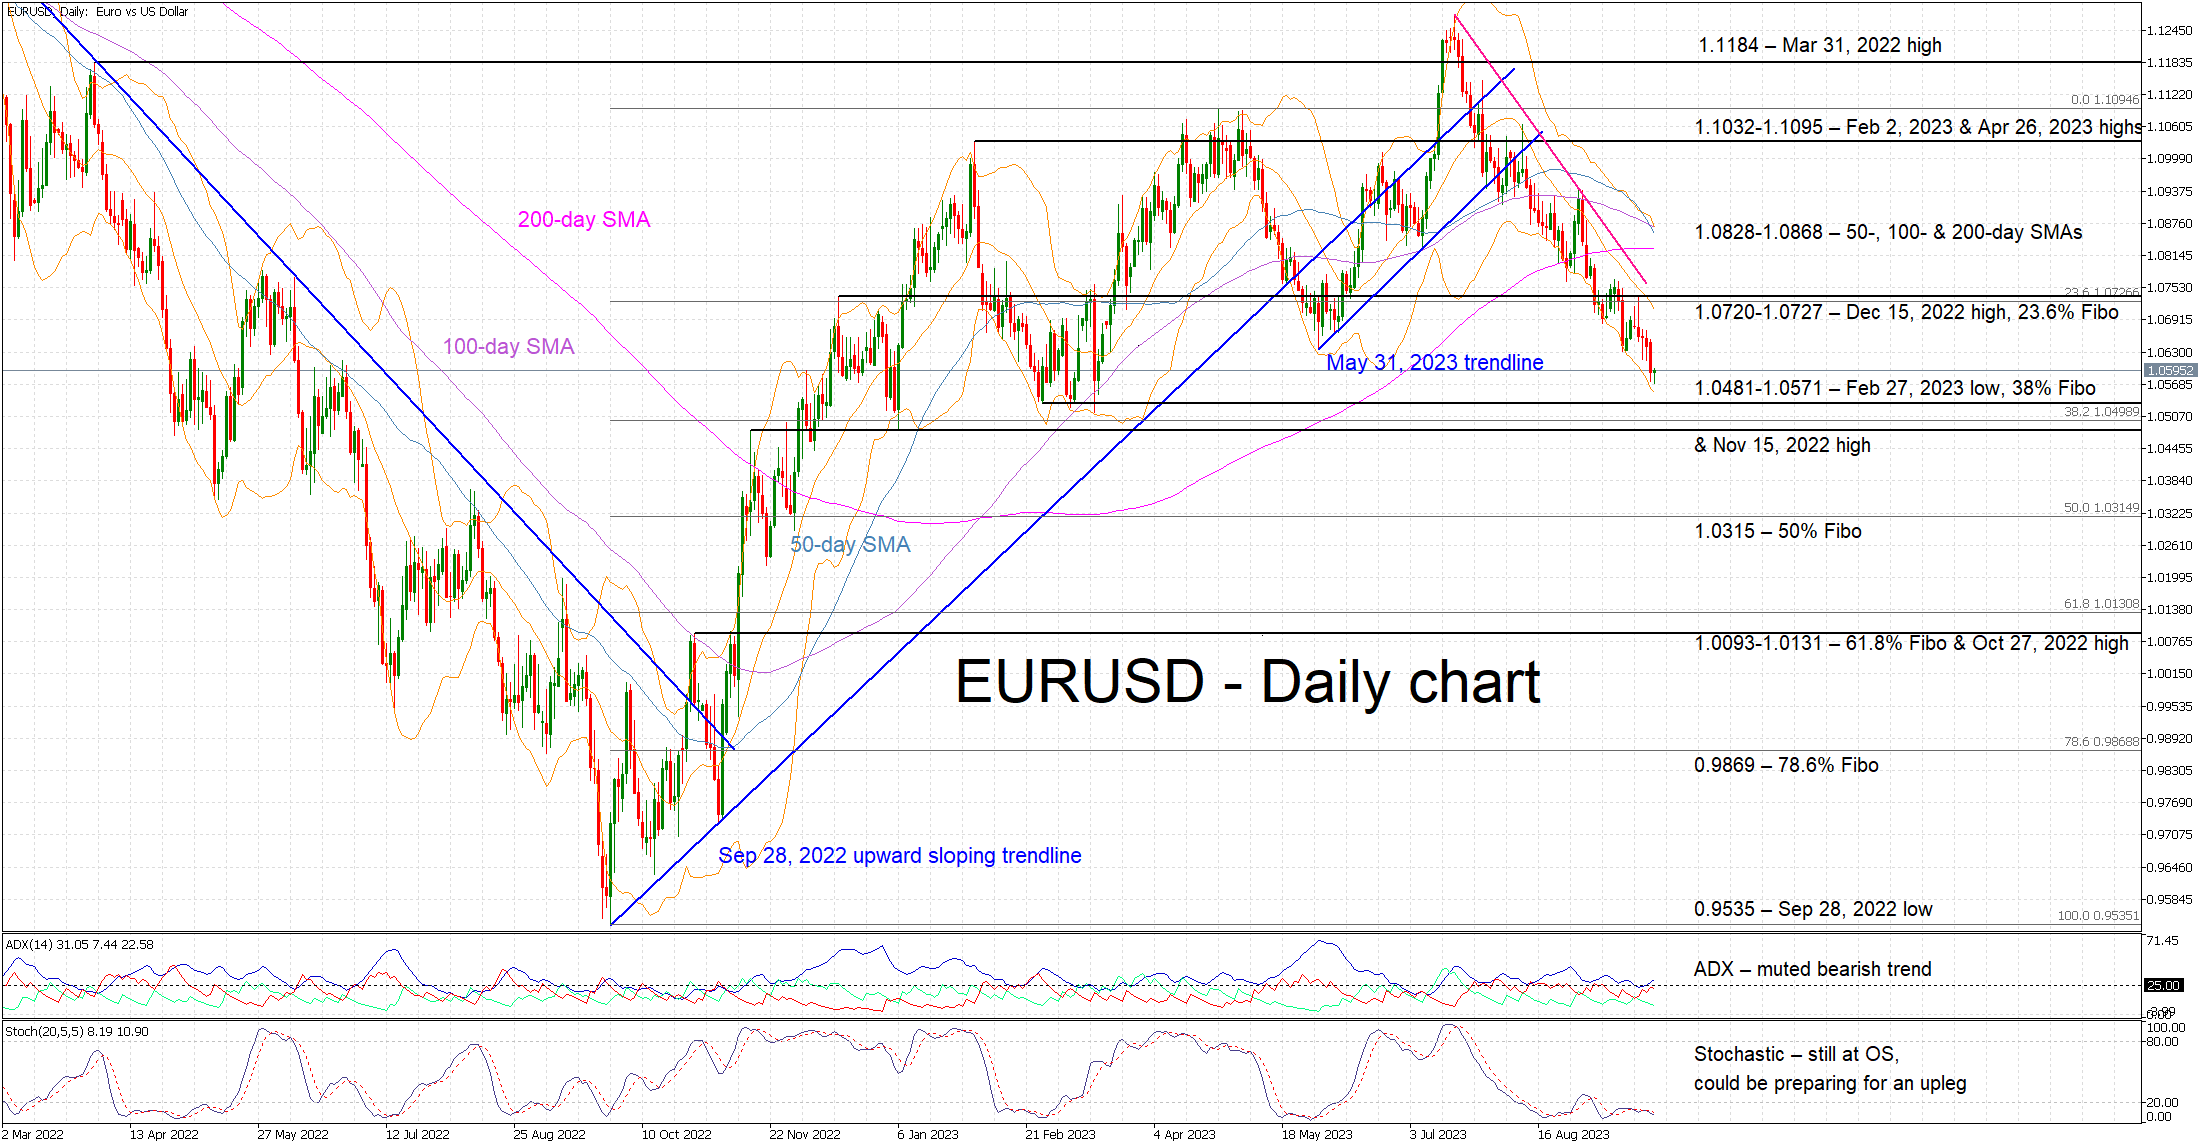
Gold Looking Lower after a Bearish Running Triangle Pattern
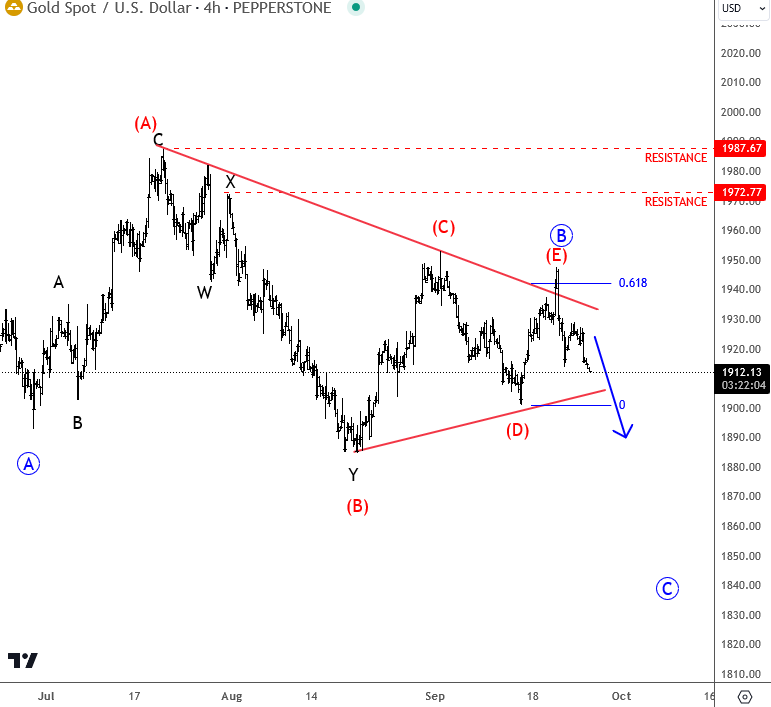
After the recent strong turn down on gold we adjusted the wave count and think that the price action from the July low is wave B, but can still meet higher prices if we consider a running flat or possibly even running triangle scenario since a drop from 1990 can be a complex w-x-y in subwave (B). Because of a recent sharp drop in the 4-hour chart from around 1950 at the start of September, it's a higher probability for a bearish running triangle pattern within wave B rather than a flat. In fact subwave (D) is also finished now followed by wave (E) that stoped at the 61.8% Fib resistance from here we can see nice turn, towards the lower side of a pattern. Keep an eye on the red trendline support now and the 1900 area; break below that zone will confirm a new drop for wave C, possibly even to around 1850 or lower.