Sample Category Title
EUR/AUD Daily Outlook
Daily Pivots: (S1) 1.6444; (P) 1.6518; (R1) 1.6562; More...
Intraday bias in EUR/AUD remains neutral for the moment. More sideway consolidations could be seen, but deeper decline is expected with 1.6793 resistance intact. On the downside, break of 1.6452 will resume the fall from 1.7062, as a larger scale correction, to 1.6000 fibonacci level. Nevertheless, firm break of 1.6793 will dampen this view and bring retest of 1.7062 instead.
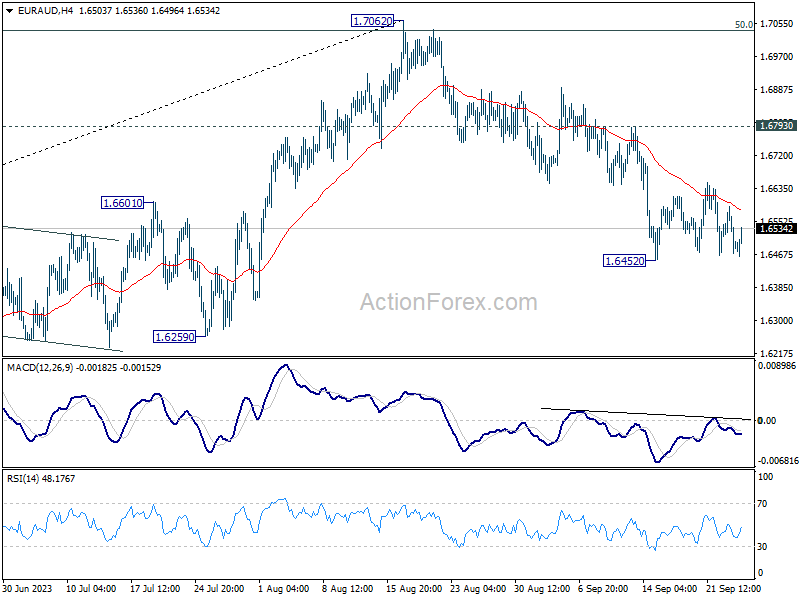
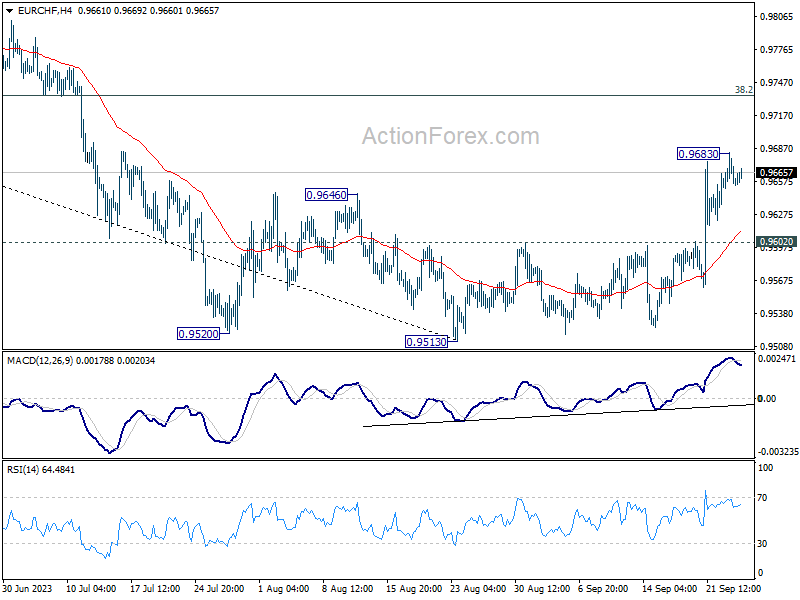
In the bigger picture, fall from 1.7062 is probably correcting whole up trend from 1.4281 (2022 low). Deeper decline would be seen to 38.2% retracement of 1.4281 to 1.7062 at 1.6000. Strong support should be seen there to bring rebound, at least on first attempt.
EUR/CHF Daily Outlook
Daily Pivots: (S1) 0.9646; (P) 0.9666; (R1) 0.9681; More...
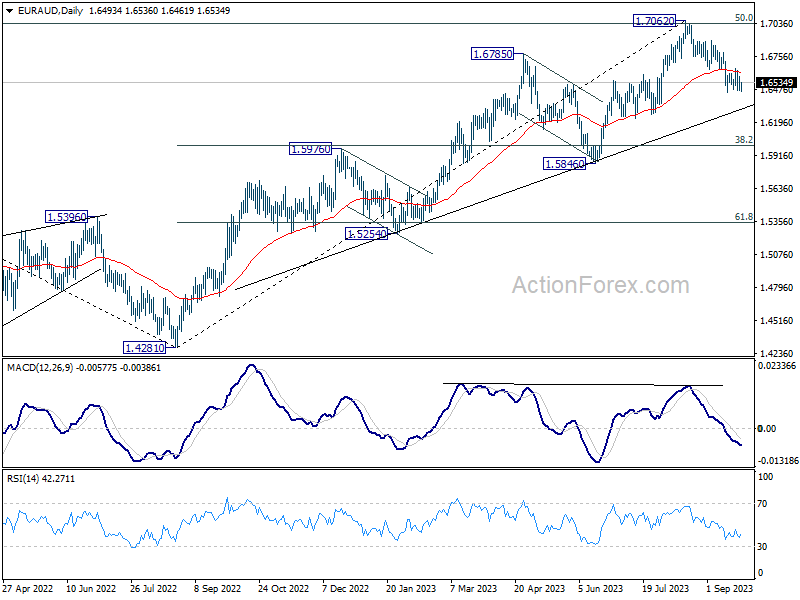
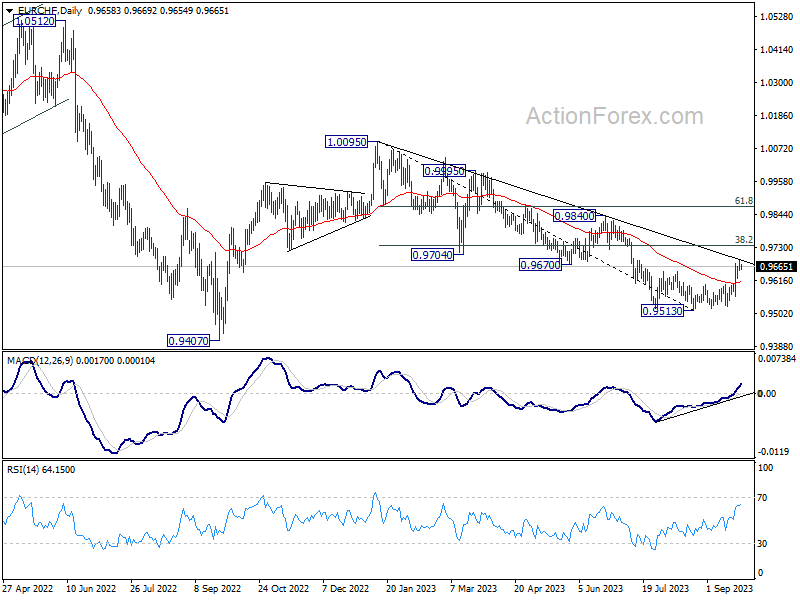
A temporary top is formed at 0.9683 in EUR/CHF with current retreat. Intraday bias is turned neutral first. But further rally is expected as long as 0.9602 support intact. On the upside, above 0.9683 will resume the rise from 0.9513 to 38.2% retracement of 1.0095 to 0.9513 at 0.9735. Sustained break there will target 61.8% retracement at 0.9873.
In the bigger picture, medium term outlook will stay bearish as long as the cross is capped well below falling 55 W EMA (now at 0.9799). That is, down trend from 1.2004 (2018 high) could still resume through 0.9407 (2022 low). However, sustained trading above the 55 W EMA will raise the chance that 0.9470 is already a long term bottom. Further rise would then be seen to 1.0095 resistance to indicate bullish trend reversal.
Core Bonds Fell Off a Cliff
Markets
What a way to start the week. Core bonds fell off a cliff with the long end again underperforming. The move was natural, not driven by any particular event and that makes it so telling. Some technical breaks did reinforce it though. The German 10y yield surpassed the previous cycle high at 2.77% and temporarily moved above 2.8% for the first time since 2011. Its real yield component broke out from a yield bullish triangle to close at the highest level since 2013. The 30-y variant (+10.5 bps) arrived just shy of the 3% symbolic barrier. US yield changes varied between 1.4 bps (2-y) and 12.7 bps (30-y). The 10-y yield added 10 bps, bringing it above 4.5% - a level last seen in 2007. As the front-end more or less stabilized, yesterday’s curve move add to the evidence of markets at long last coming to terms with the higher for longer era. Equities felt the heat. European indices lost about 1% with the EuroStoxx50 closing below the broad 4200 support level after multiple tests earlier this year. US indices slipped at the open but a recovery later on prevented the likes of the S&P500 (+0.4%) of closing below the neckline of a double top formation. The dollar flourished. EUR/USD finally caved and gave away 1.0635 support (May low). 1.0611 (38.2% retracement on the Sep 2022 – July 2023 rally) followed soon. The pair eventually closed sub 1.06 for the first time since March this year. DXY tested the 106 figure, matching levels last seen in November 2022. USD/JPY rose beyond recent highs, ending the day at 148.88 in another step towards the multidecade closing high of 150.15 (Oct 2022). EUR/USD’s decline filtered through in EUR/GBP. The duo dived from an intraday high around 0.87 to 0.8675. But the pound was no match for the dollar. GBP/USD extended a losing streak to 1.2211. Today’s economic calendar contains US consumer confidence (Conference Board). We don’t think it’ll be of major importance for trading and in any case it shouldn’t interrupt the ongoing core bond trend, even as it possibly shifts into lower gear after yesterday’s violent moves. Markets still have some repositioning to do. The risk-off it creates on equity markets should keep the dollar in the driver’s seat. The equity sell-off at some point will dampen the core bond yield rally through safe haven flows but we probably haven’t reached that tipping point just yet. USD is enjoying another healthy bid in Asian dealings this morning. EUR/USD is moving south slowly but steadily within the downward trading channel. Critical support kicks in at 1.0484/1.0516.
News and Views
Rating agency Moody’s in a statement warned that a US government shutdown could be a negative for the country’s credit rating. Moody’s is the last of the major rating agencies to rate the US with a AAA rating. Fitch and S&P have a AA+ rating. Moody’s assesses that the actual economic impact of a potential shutdown could be relatively limited if the disruption is short. Government debt services payments will not be impacted. However, a shutdown would underscore the weakness of the US institutional and governance strength relative to other AAA-rated sovereigns. It would also be an indication of the significant constraints that intensifying political polarization is putting on US fiscal policy making, the rating agencies says. Still, the shutdown is seen as having an direct impact on government spending and will also impact consumption and spending of federal workers and contractors.
Data from the Hungarian statistical office yesterday showed that in July 2023 full-time employees’ average gross earnings were HUF559 100 and average net earnings with tax benefits reached HUF 385 600. Average gross earnings and average net earnings increased by 15.2% and 15.1%, respectively, while real earnings decreased by 2.0%, compared with a year earlier. The rise in earnings was slightly softer than expected and was a last data input for the policy decision of the Hungarian National Bank today. End last week, data of the Ministry of Finance also showed that the budget deficit at the end of August already stood at HUF 3.3 trillion, close to the full year target. The higher than expected deficit was for an important part was due to VAT proceeds staying substantially below the government’s estimate despite high inflation as retail sales in the January-July period were about 10% lower compared to the same period last year. The forint yesterday weakened to the EUR/HUF 390 area, but this move was mainly driven by a global risk-off context and higher real yields in core markets.
US Yields Rise, Dollar Gains on Another US Government Gong Show
The US yields rose, and the dollar extended gains yesterday as the looming US government shutdown drama got the only remaining big rating agency company Moody’s to sound cautious about the US’ AAA rating. ‘Debt service payments would not be impacted, and a short-lived shutdown would be unlikely to disrupt the economy’, they said, but ‘it would underscore the weakness of US constitutional and governance strength relative to other triple-A rated sovereigns.’ Both S&P and Fitch have downgraded the US credit rating this summer, over a potential US default in the context of debt ceiling drama.
The US 10-year yield advanced past the 4.55% level and could advance even higher due to political tensions and an increased treasury issuance for long-dated papers. Rising US yields helped the US dollar gain more strength across the board. The US dollar index, which was already propelled into the bullish consolidation zone following the Federal Reserve’s (Fed) pledge last week to maintain rates higher for longer, hit a fresh high since last November. Even if it sounds funny, the dollar could profit from safe-haven inflows if the government shutdown drama doesn’t last long. During the last US government shutdown, in 2018 – which was, by the way the longest shutdown since 1970s - the US dollar gained against most major currencies. Of course, the longer a shutdown lasts, the bigger the impact would be on the economy, and potentially on the US’ credit rating. And the bigger the impact on the US growth and its credit worthiness, the more likely we see the US dollar get – at least a small – hit from another political gong show. For now, though, don’t pull all your eggs out of the US basket, because, the dollar could well strengthen despite the political shenanigans in the US, and the US stocks could see increased inflows, as well. The last time the US government was shut in 2018, the S&P500 rallied 13%.
Yesterday’s renewed dollar rally pushed the EURUSD below a critical Fibonacci level yesterday. The EURUSD slipped below the major 38.2% Fibonacci retracement on last September to July rally, and was thrown into a medium term bearish consolidation zone. The expectation that inflation in the euro area may have eased significantly may have enhanced the euro selloff before investors had a glimpse of the latest update – due later this week. Cable tested the 1.22 support to the downside, in a move that could extend toward the 1.2080 level, which is the major 38.2% retracement on pound-dollar’s last year rally. The dollar-franc rises exponentially above the 200-DMA, after last week’s surprise Swiss National Bank (SNB) pause convinced traders that the end of a strong franc era could be coming to an end, as long as inflation in Switzerland remains under control. Gold fell, trend and momentum indicators turned negative, and the yellow metal is about to post a death cross formation where the 50-DMA is about to cross below the 200-DMA, which could further fuel some short-term selloff. And the USDJPY is flirting with the 149 level, with traders determined to defy the Japanese officials’ threats of direct FX intervention into the 150. Released this morning, the Bank of Japan’s (BoJ) core CPI came in steady at 3.3%, higher than 3.2% expected by analysts. Normally, a stronger-than-expected inflation data would revive the BoJ hawks, and rate hike expectations and lead to a stronger yen. But, the BoJ isn’t much concerned about inflation when they decide on their rate policy, they are more concerned about how to keep an absurdly loose monetary policy without causing more bleeding in the yen.
In energy, the barrel of US crude stabilizes around the $90pb, the daily MACD index fell to the negative territory for the first time since the beginning of September, and the impact of US shutdown drama on growth outlook, and the deepening real estate crisis in China, with Evergrande’s latest default on a 4 billion yuan onshore bond, could add another layer of uncertainty in global financial markets, and trigger a much-awaited correction in oil prices. The $86/87 range is a reasonable target for those looking for a minor downside correction in oil prices without having to bet on a dramatic trend change.
Bond Yields on the Rise
Market movers today
The most relevant data release today is the US consumer confidence indicator from the Conference Board. After some improvements over the summer consumer confidence fell in August and consensus is looking for a further small decline in the September print.
In Hungary, the central bank will announce its monetary policy decision. All analysts in Bloomberg consensus (we included) expect the interest rate to remain unchanged at 13.0%.
In Sweden, we receive PPI figures for August.
The 60 second overview
US: Credit rating agency Moody's yesterday expressed concern over a potential government shutdown in US, which it argues would reveal institutional and governance weakness not seen in other Aaa-rated countries.
Fed: Minneapolis Fed President Neel Kashkari overnight said that he expected the Fed to raise interest rates one more time this year and keep policy tighter for longer if the economy proves stronger than expected.
Energy: Natural gas prices have risen to the highest level since April over the past week. The price increase comes despite still mild autumn weather, increased energy production from wind turbines and end to the strike among Australian LNG workers. Instead it might owe to unstable natural gas flows from Norway due to maintenance and higher global demand for LNG.
Equities were mixed on Monday. Europe and Nordics continued to bleed but US managed to close a tad higher for the day. S&P 500 up 0.4% (after losing -3% last week), Stoxx 600 -0.6% (-1% last week) and Nordics -0.3%. No doubt yields play a crucial role in the current risk-off regime. Thereby, Monday started with huge differences between sectors and styles. Bond proxy Orsted and Fortum were worst off, falling -4-5%. It is also worth noting that mainly defensives sold off while cyclical retail (Pandora and H&M flat), pulp (Stora Enso +1%) and industrials (Atlas +1%, Sandvik and Volvo 0%) held up. Bash in line with our strategy though, where we highlight retail, pulp, banks and short cyclical industrials, financed by growth/quality defensives. Overall, our value overweight has performed very well lately which of course speaks for some mean reversion at a later stage. US futures are a notch lower this morning again.
FI: Last week's higher for longer narrative extended yesterday with rates rising across the board for the 3y+ maturities. The higher rates came from the long end with 30y Germany ending almost 11bp higher on the day. The 10y and 30y Bund yields reached highest levels since 2011. There was no clear trigger for the significant sell-off led by the long end.
FX: EUR/USD broke below 1.06 for the first time since mid-March. Meanwhile, USD/JPY is closing in on the highs of October last year as US yields continue to climb. The SEK defied the shaky risk sentiment and traded strong on the back of the Riksbank starting their hedging program, with EUR/SEK briefly below 11.70 on the day. EUR/GBP traded above 0.87 for the first time since March as markets continue to digest the BoE disappointment last week.
Credit: Credit spreads widened modestly yesterday, with iTraxx Xover closing in 421.6bp (+4.9bp) and Main in 78bp (+0.8bp). However, despite the slightly downbeat sentiment, several primary market transactions were printed and reception was solid, with oversubscription around 2.0x for most transactions.
Nordic macro
In Sweden we get the PPI numbers for August (CET 8:00). Whereas we expect a further normalisation of the index that measures producers' prices of goods manufactured and sold in Sweden (HMPI), the index containing import prices might show a less favourable development, given the increase in oil prises during august. Riksbank's Per Jansson will hold a lecture on the Riksbank's objectives and tasks later today (CET 18:00).
Technical Outlook and Review
DXY:
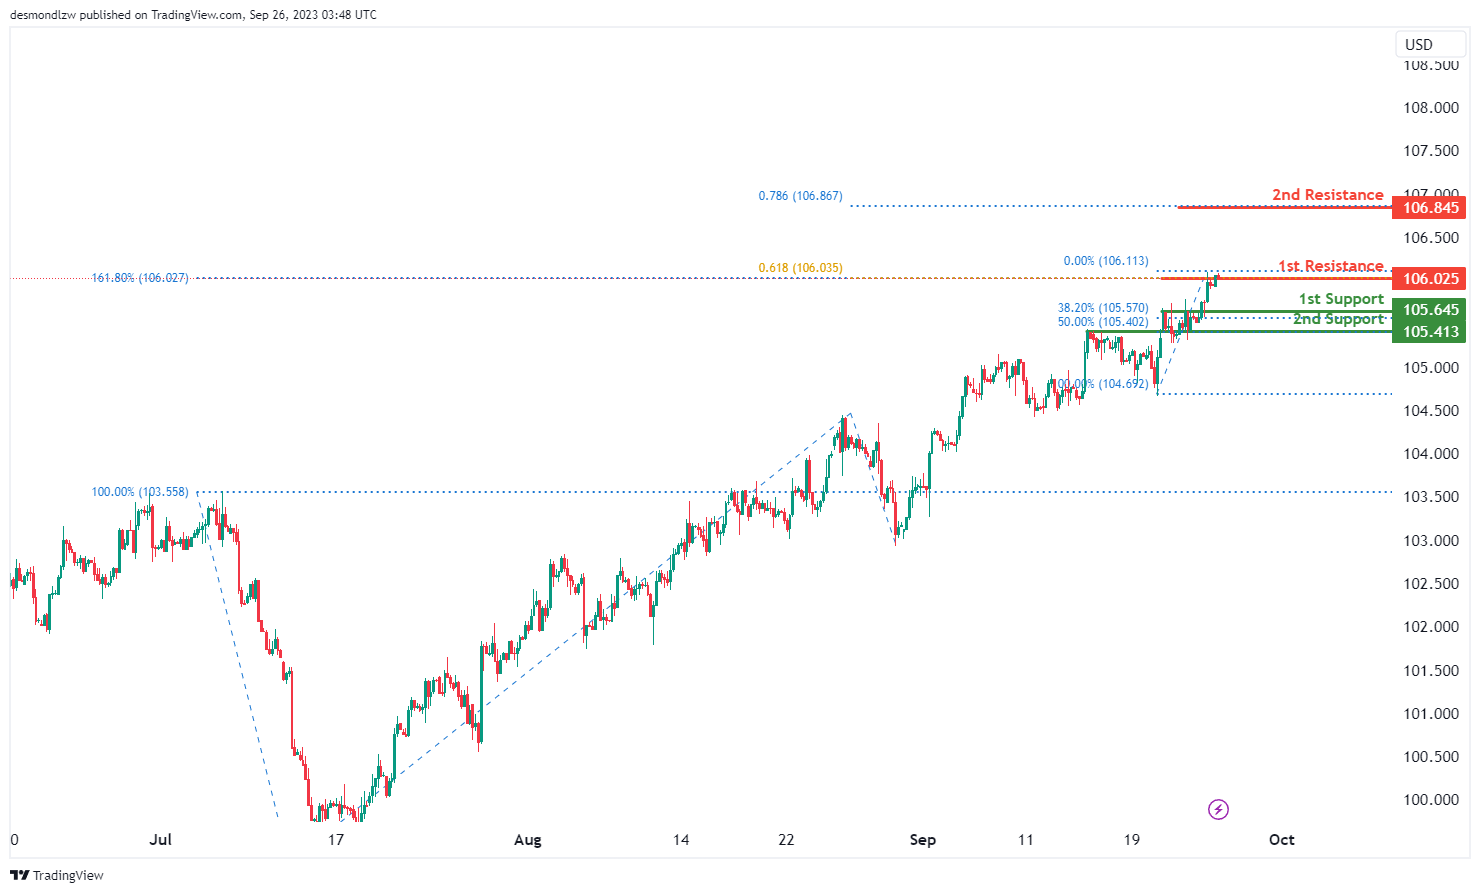
The DXY chart currently exhibits a bearish momentum. There’s a possibility for a bearish reaction off the 1st resistance at 106.02, leading to a drop towards the 1st support at 105.64. This 1st support is significant due to its characterization as an overlap support and the presence of the 38.20% Fibonacci Retracement. The 2nd support is at 105.41, another overlap support, reinforced by the 50% Fibonacci Retracement.
In terms of resistance, the 1st resistance at 106.02 is notable for its Fibonacci confluence, being at the intersection of the 61.80% Fibonacci Projection and the 161.80% Fibonacci Extension. The 2nd resistance is set at 106.84, marked by the 78.60% Fibonacci Projection.
EUR/USD:
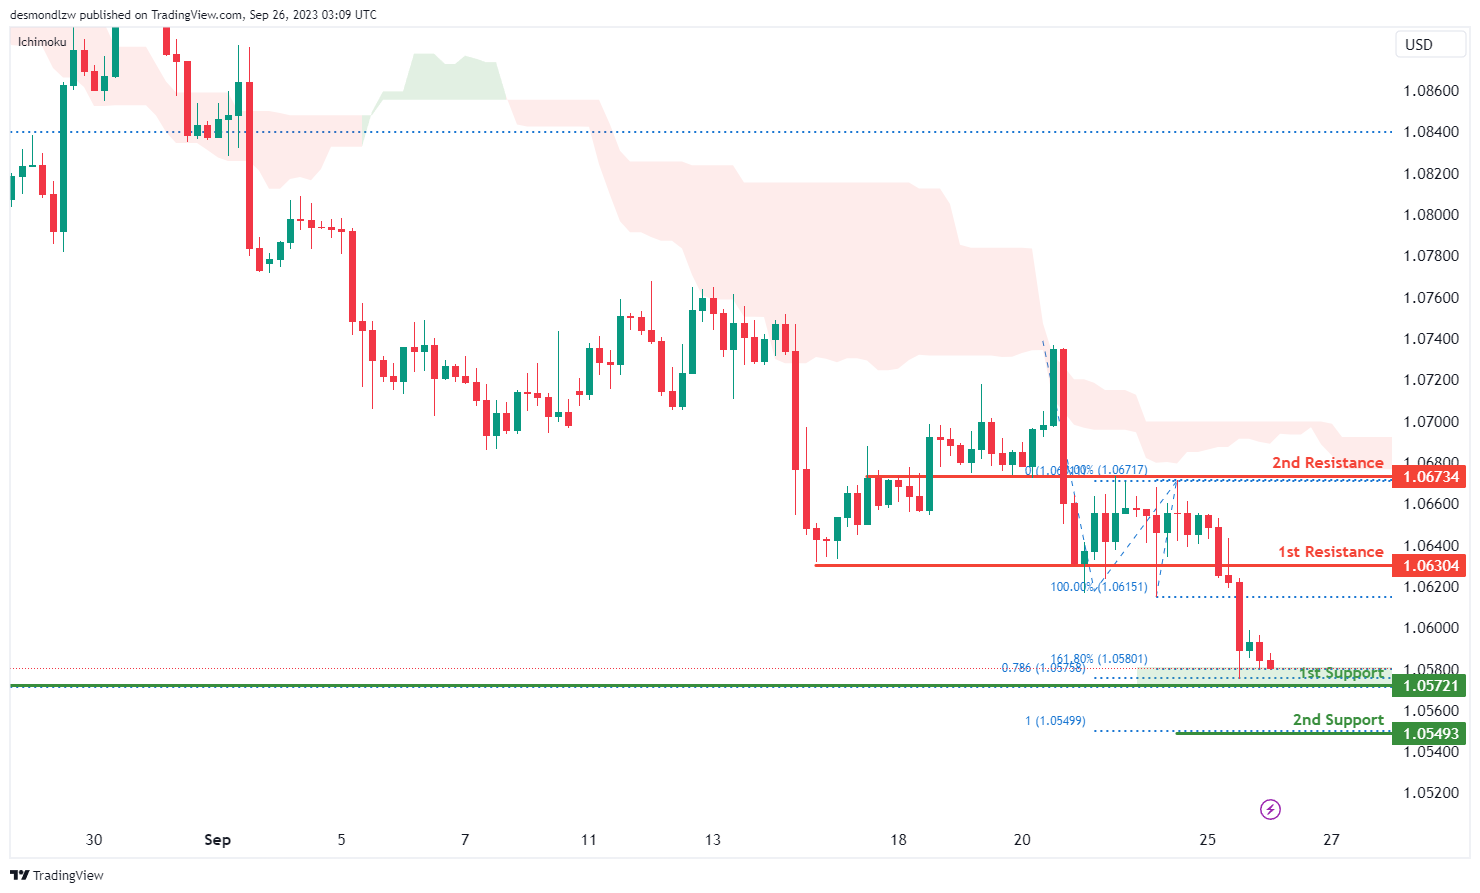
The EUR/USD chart is currently displaying a bullish momentum. There’s a potential scenario where the price may make a bullish bounce from the 1st support level at 1.0572 and move towards the 1st resistance at 1.0630. This 1st support level is especially significant due to its characterization as a multi-swing low support and the confluence of the 161.80% Fibonacci Extension and 78.60% Fibonacci Projection. The 2nd support at 1.0549 is marked by the 100% Fibonacci Projection.
On the resistance side, the 1st resistance at 1.0630 is defined as a pullback resistance. The 2nd resistance level at 1.0673 is characterized as an overlap resistance, making it another key level to watch.
EUR/JPY:
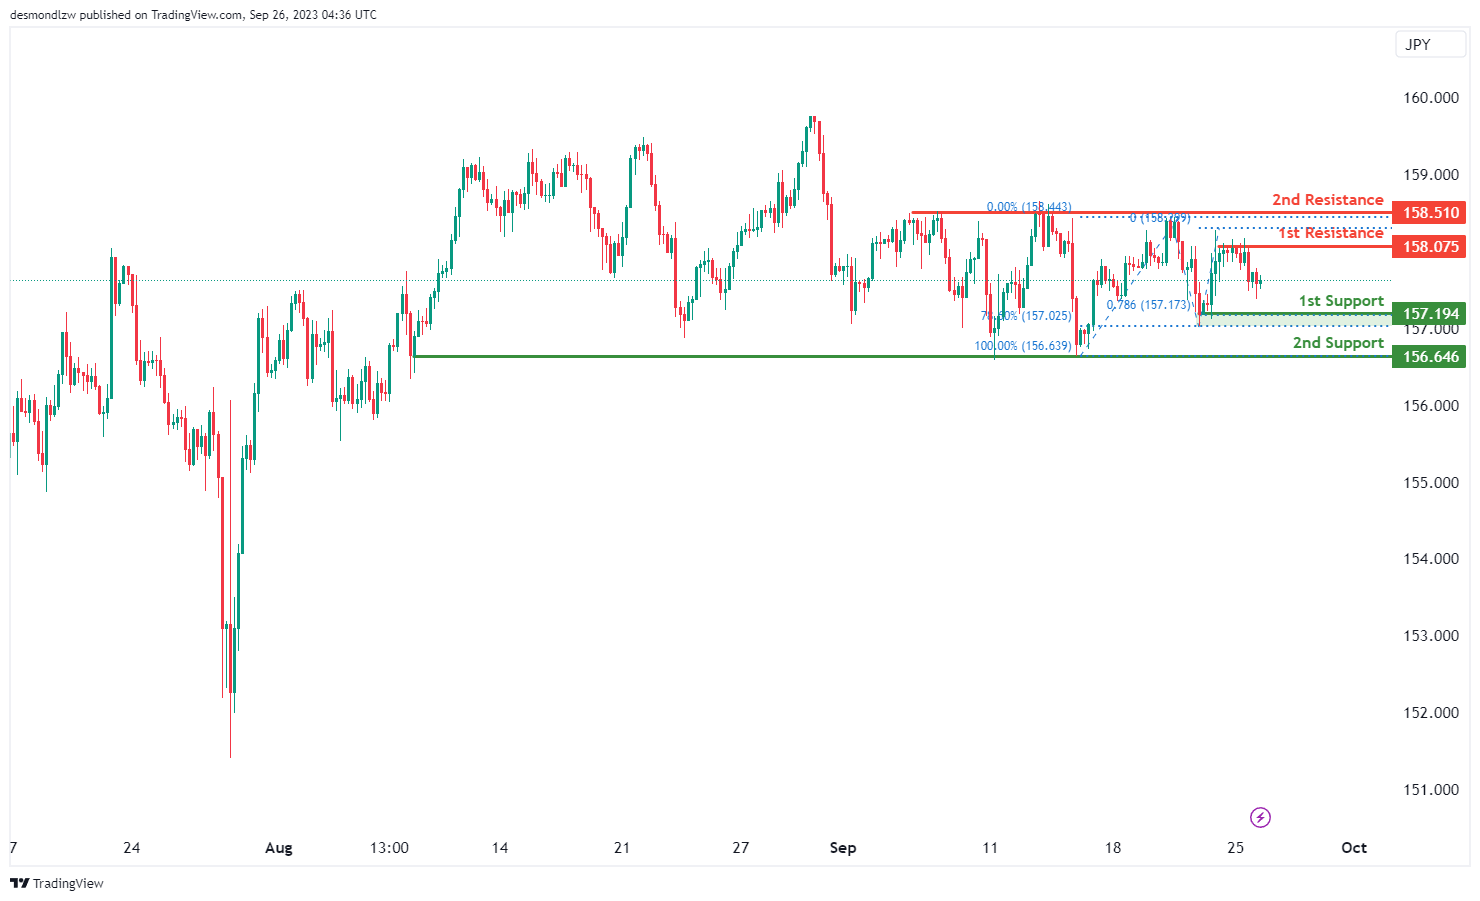
The instrument EUR/JPY currently shows a bearish overall momentum on the chart, and there’s potential for a bearish continuation towards the 1st support.
The 1st support at 157.91 is considered good due to its nature as a swing low support and its association with the 78.60% Fibonacci Projection.
The 2nd support at 156.64 is also notable as it acts as a swing low support, providing an additional layer of potential support.
On the resistance side, we have the 1st resistance at 158.07, which is significant because it represents a multi-swing high resistance.
Similarly, the 2nd resistance at 158.51 is noteworthy as it functions as another multi-swing high resistance, suggesting potential barriers to further bullish movement at these levels and supporting the idea of a bearish continuation towards the 1st support.
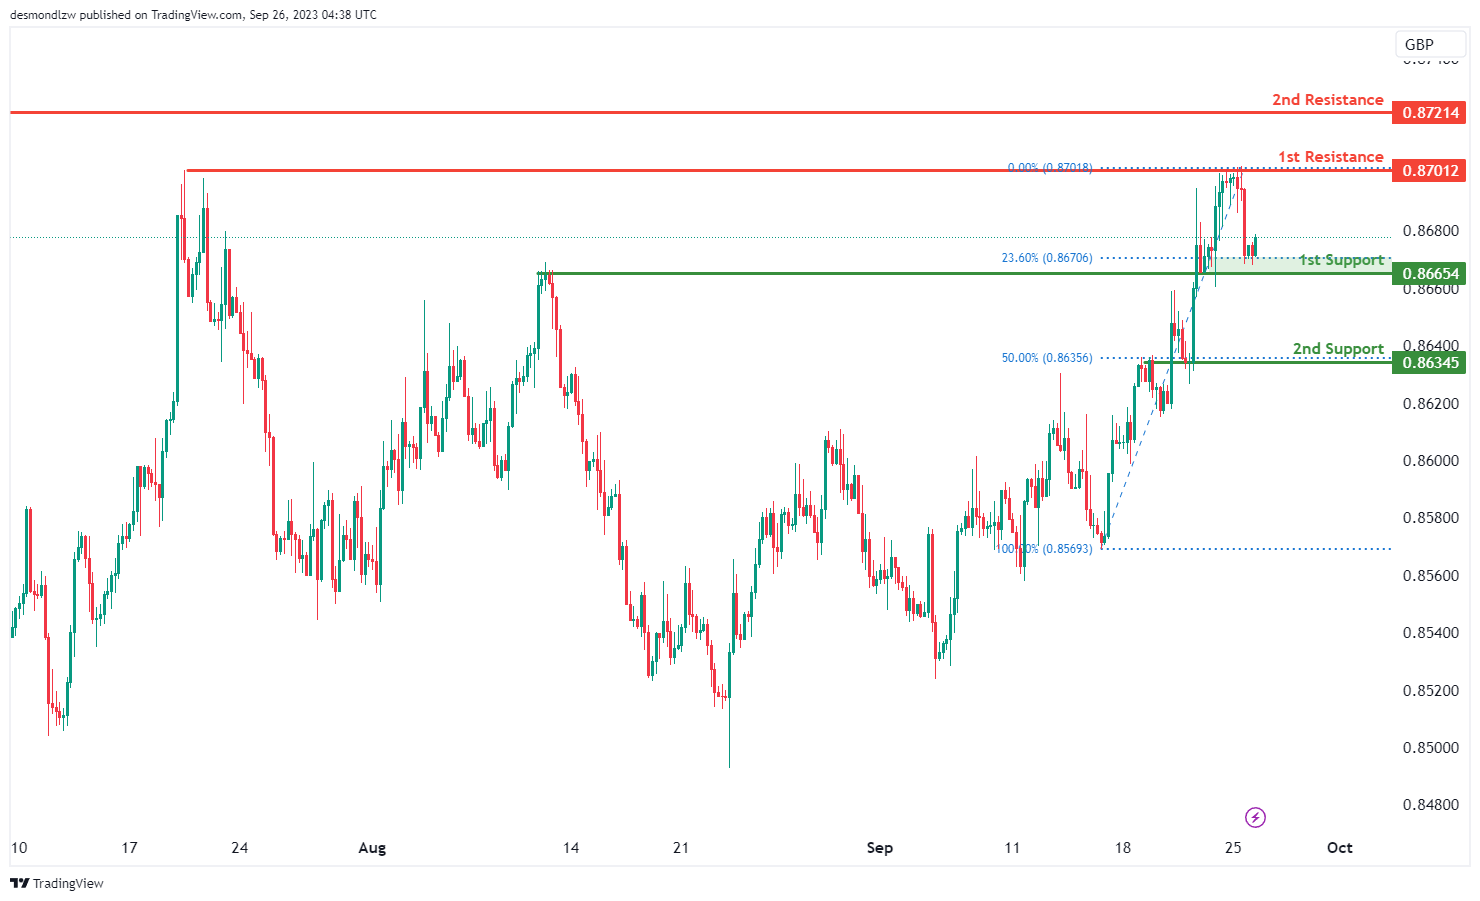
EUR/GBP:
The instrument EUR/GBP currently indicates a bullish overall momentum on the chart, and there’s potential for a bullish continuation towards the 1st resistance.
The 1st support at 0.8665 is considered good due to its nature as an overlap support and its association with the 23.60% Fibonacci Retracement.
The 2nd support at 0.8634 is also notable as it acts as an overlap support and is associated with the 50% Fibonacci Retracement, providing an additional layer of potential support.
On the resistance side, we have the 1st resistance at 0.8701, which is significant because it represents a multi-swing high resistance.
Similarly, the 2nd resistance at 0.8721 is noteworthy as it functions as an overlap resistance.
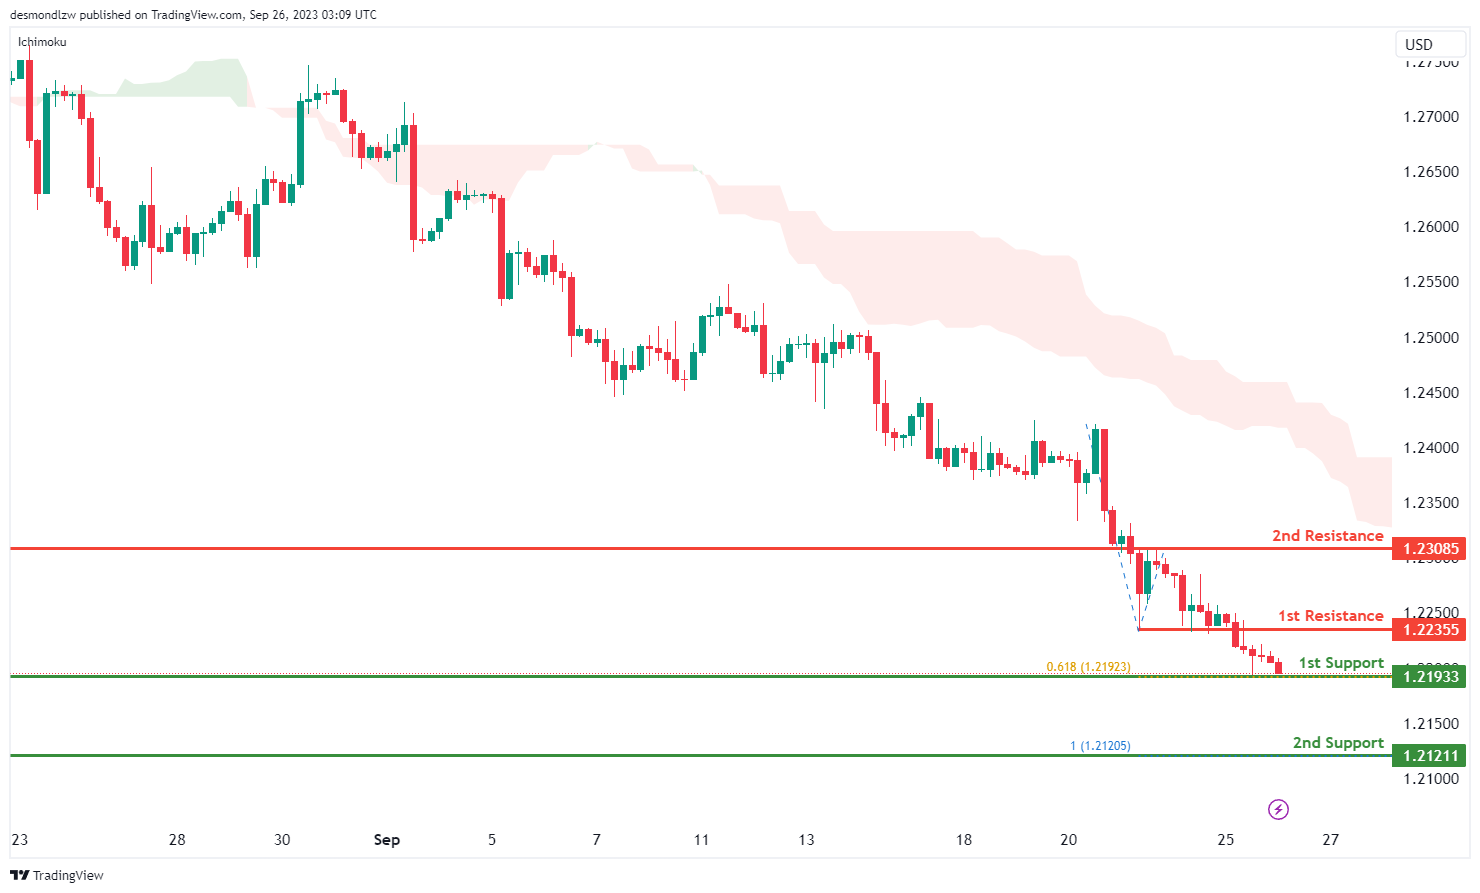
GBP/USD:
The GBP/USD chart currently indicates a bearish momentum, influenced by the price being below the bearish Ichimoku cloud. In the short term, the price might rise towards the 1st resistance level at 1.2235 before potentially reversing and declining to the 1st support at 1.2193. This support level is significant due to its characterization as an overlap support and its association with the 61.80% Fibonacci Projection.
The 2nd support at 1.2121 stands out as a swing low support and is marked by the 100% Fibonacci Projection.
On the resistance side, both the 1st resistance at 1.2235 and the 2nd resistance at 1.2308 are identified as overlap resistances, indicating potential barriers for price increases.
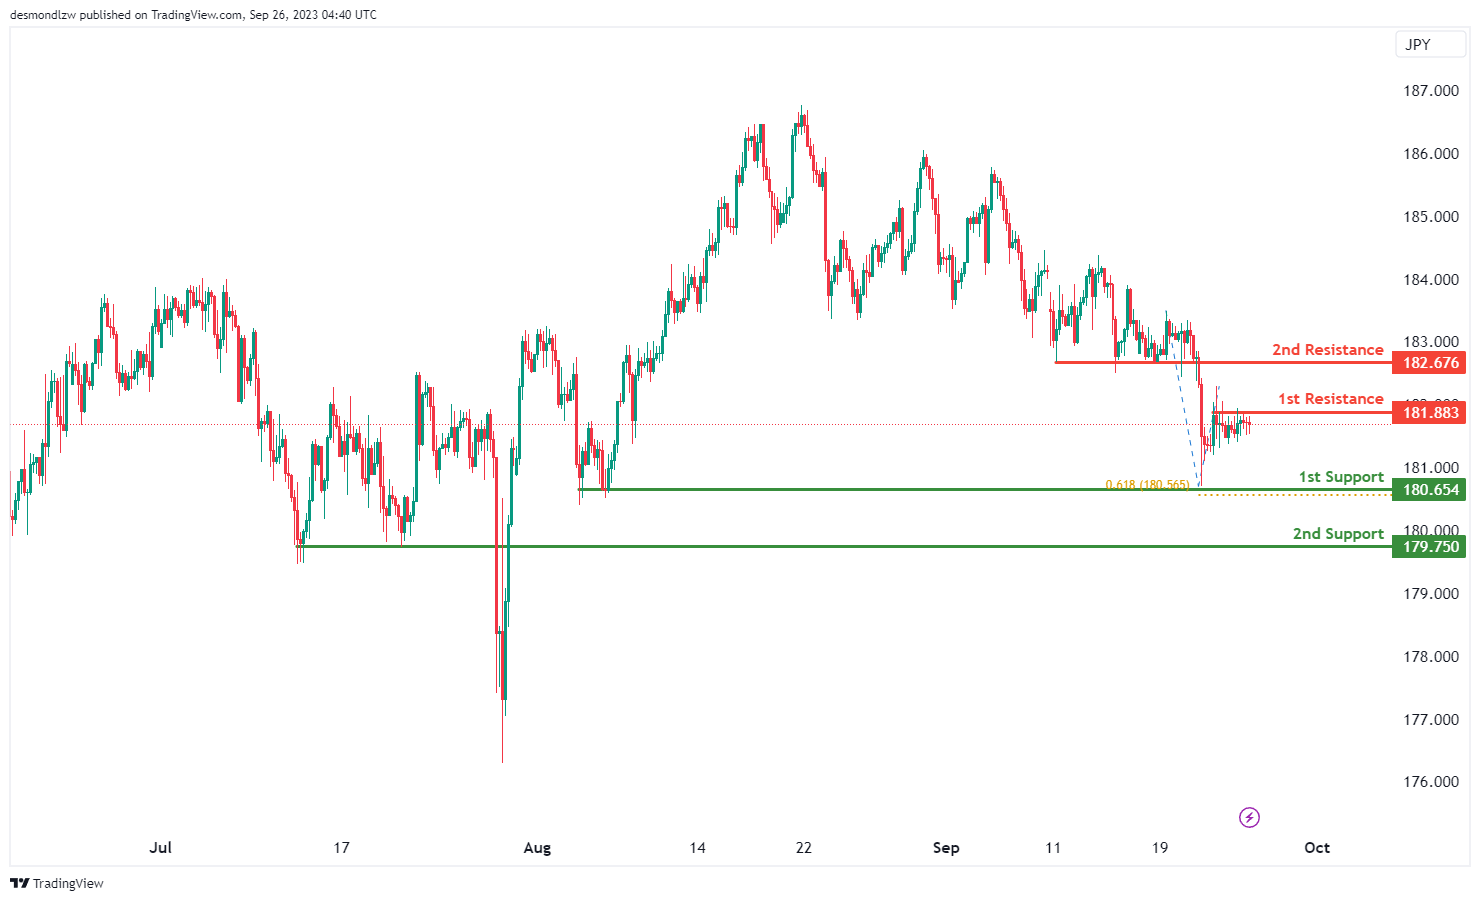
GBP/JPY:
The instrument GBP/JPY currently indicates a bearish overall momentum on the chart, and there’s potential for a bearish reaction off the 1st resistance and a drop towards the 1st support.
The 1st support at 180.65 is considered good due to its nature as a multi-swing low support. Additionally, it is associated with the 61.80% Fibonacci Projection, providing strong potential support.
The 2nd support at 179.75 is also notable as it acts as a pullback support, potentially adding to the support level.
On the resistance side, we have the 1st resistance at 181.88, which is significant because it represents a multi-swing high resistance.
Similarly, the 2nd resistance at 182.67 is noteworthy as it functions as a pullback resistance.
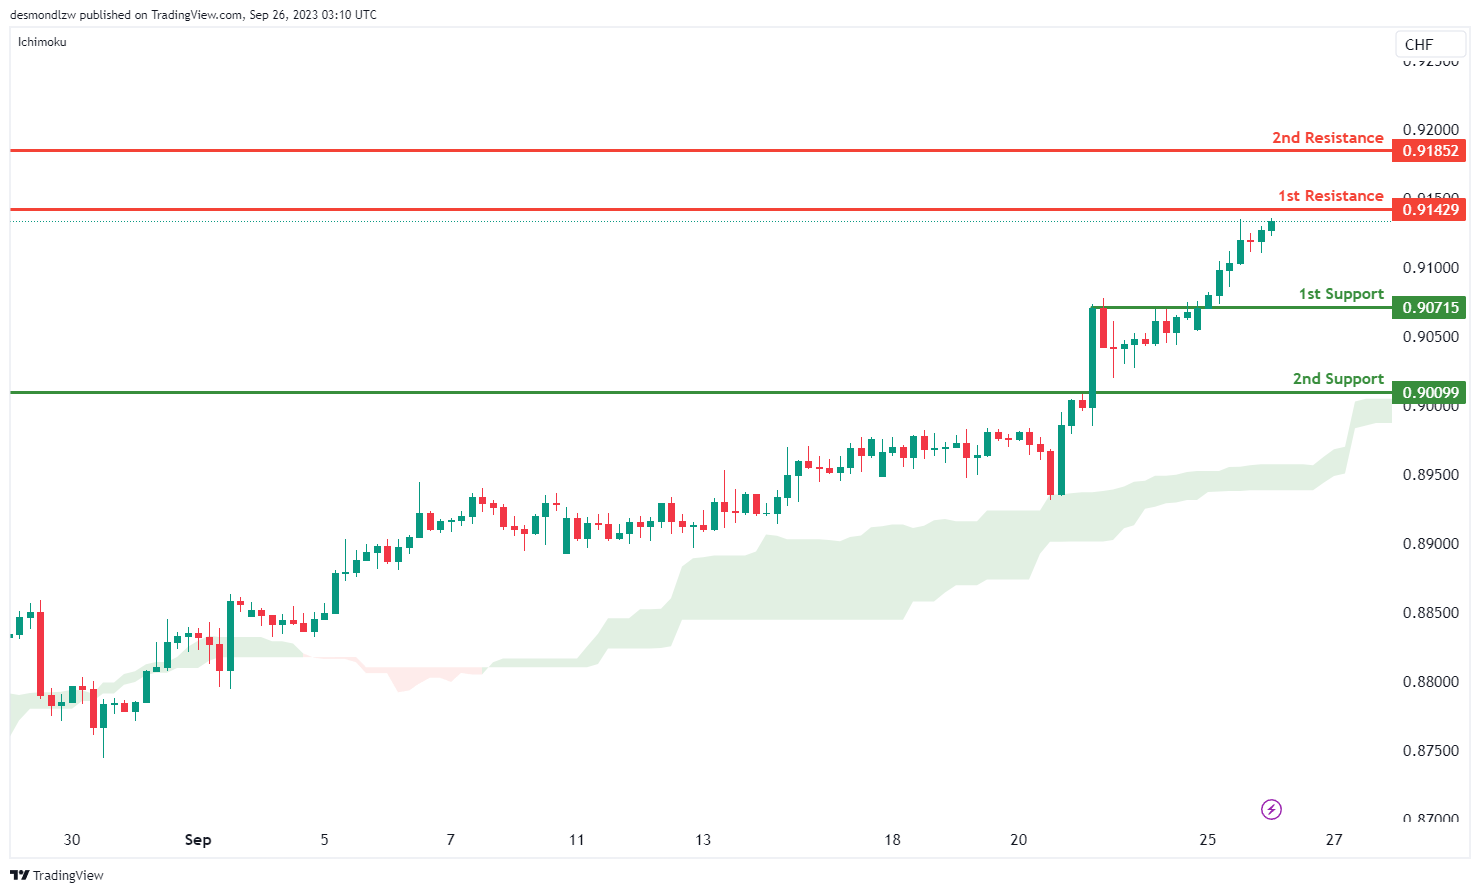
USD/CHF:
The USD/CHF chart currently demonstrates a bearish momentum. There’s a potential scenario where the price might react bearishly off the 1st resistance level at 0.9042, characterized as a swing high resistance, and decline towards the 1st support at 0.9071, which is identified as an overlap support.
The 2nd support level is at 0.9009 and is notable for being a pullback support, indicating historical levels where price has found support.
On the resistance side, beyond the 1st resistance, the 2nd resistance level is at 0.9185 and is characterized as a pullback resistance, suggesting it could act as a significant barrier for any bullish movements.
USD/JPY:
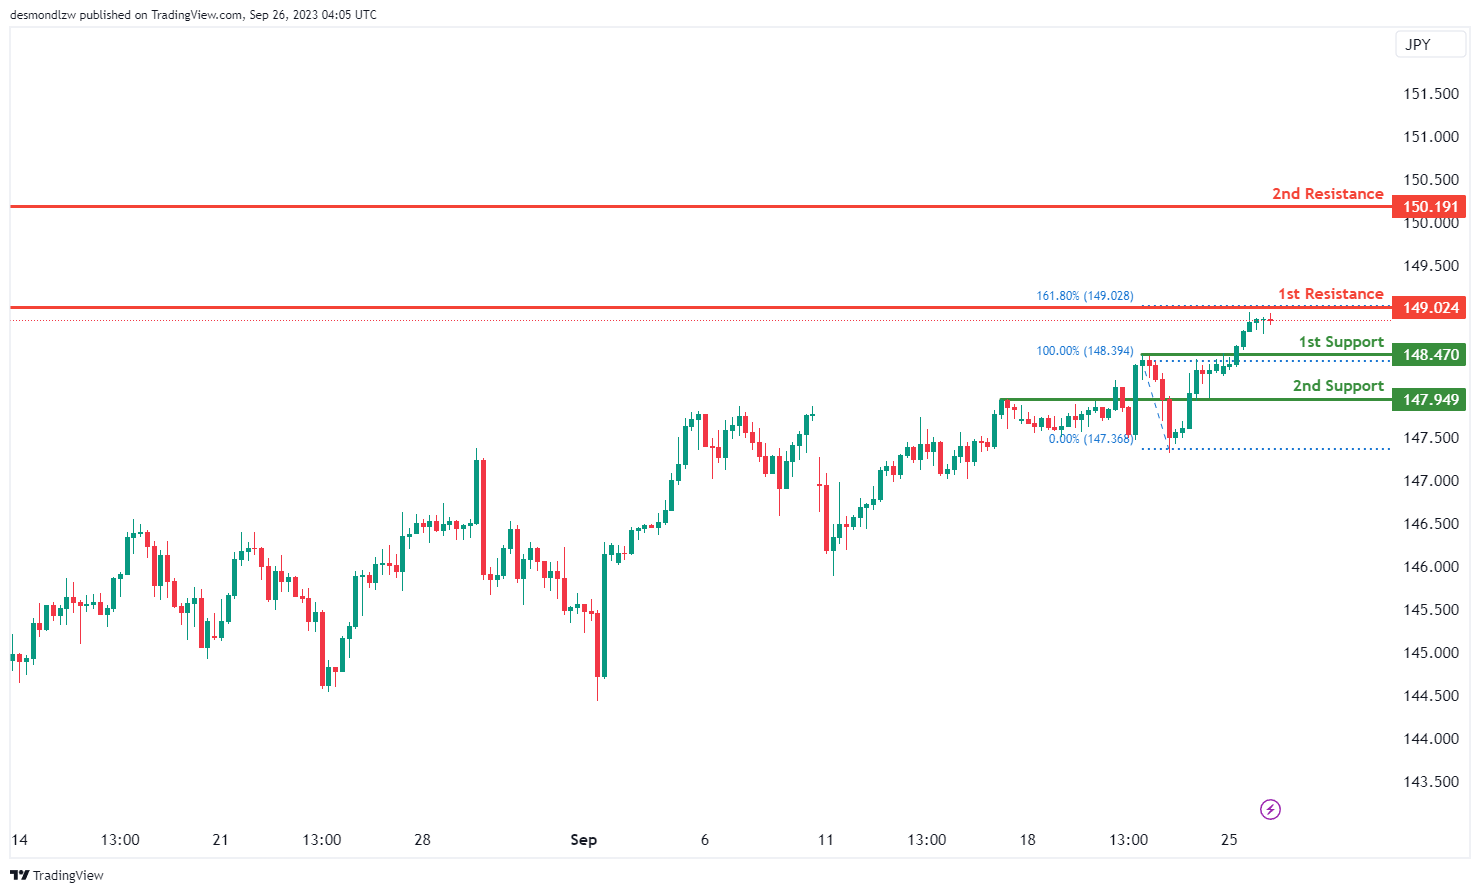
The USD/JPY chart is currently showing a bearish trend. In the upcoming sessions, there’s a possibility that the price might experience a bearish reaction upon reaching the 1st resistance level at 149.02, which is defined by a swing high resistance and the 161.80% Fibonacci Extension. If this resistance holds, the price could then decline towards the 1st support level at 148.47, characterized as a pullback support.
The 2nd support level, positioned at 147.94, is recognized as an overlap support, marking it as another potential area where the price might find support.
On the resistance side, beyond the 1st resistance, the 2nd resistance is situated at 150.19, also categorized as a swing high resistance, indicating its potential significance in halting any bullish advancements.
USD/CAD:
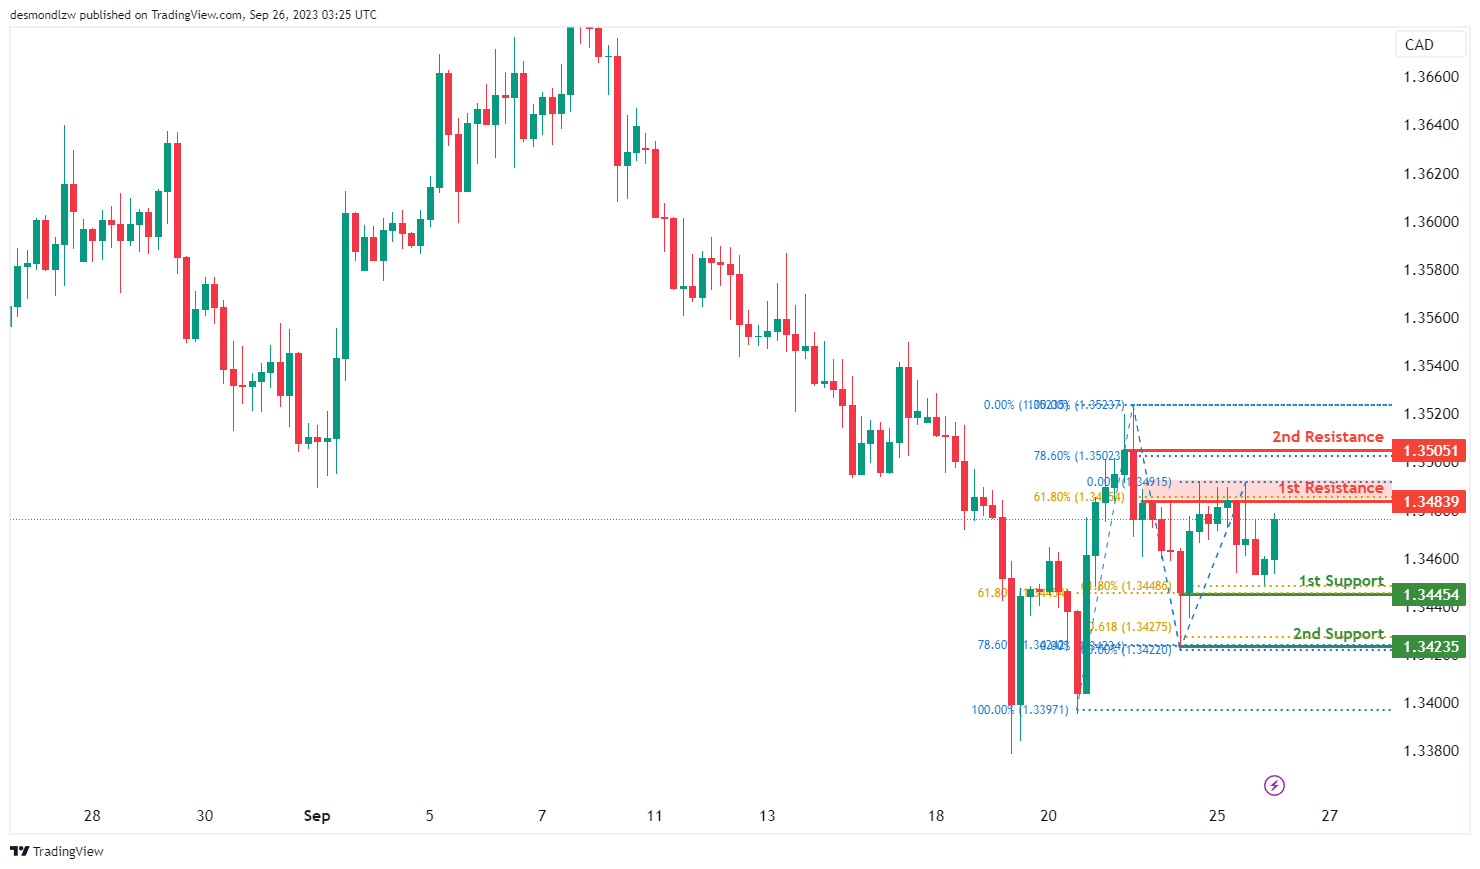
The chart for USD/CAD is currently indicating an overall bullish momentum. In this scenario, there is a potential for a bullish continuation towards the 1st resistance level.
The 1st resistance level at 1.3484 is identified as a pullback resistance that aligns with the 61.80% Fibonacci retracement level. Additionally, the 2nd resistance level at 1.3505 is marked as a swing-high resistance that aligns with the 78.60% Fibonacci retracement level.
To the downside, the 1st support level at 1.3445 is identified as a pullback support that aligns with a confluence of Fibonacci levels i.e. two distinct 61.80% retracement levels. Further below, the 2nd support level at 1.3424 is noted as a swing-low support that also aligns with a confluence of Fibonacci levels i.e. the 78.60% retracement and the 61.80% projection levels.
AUD/USD:
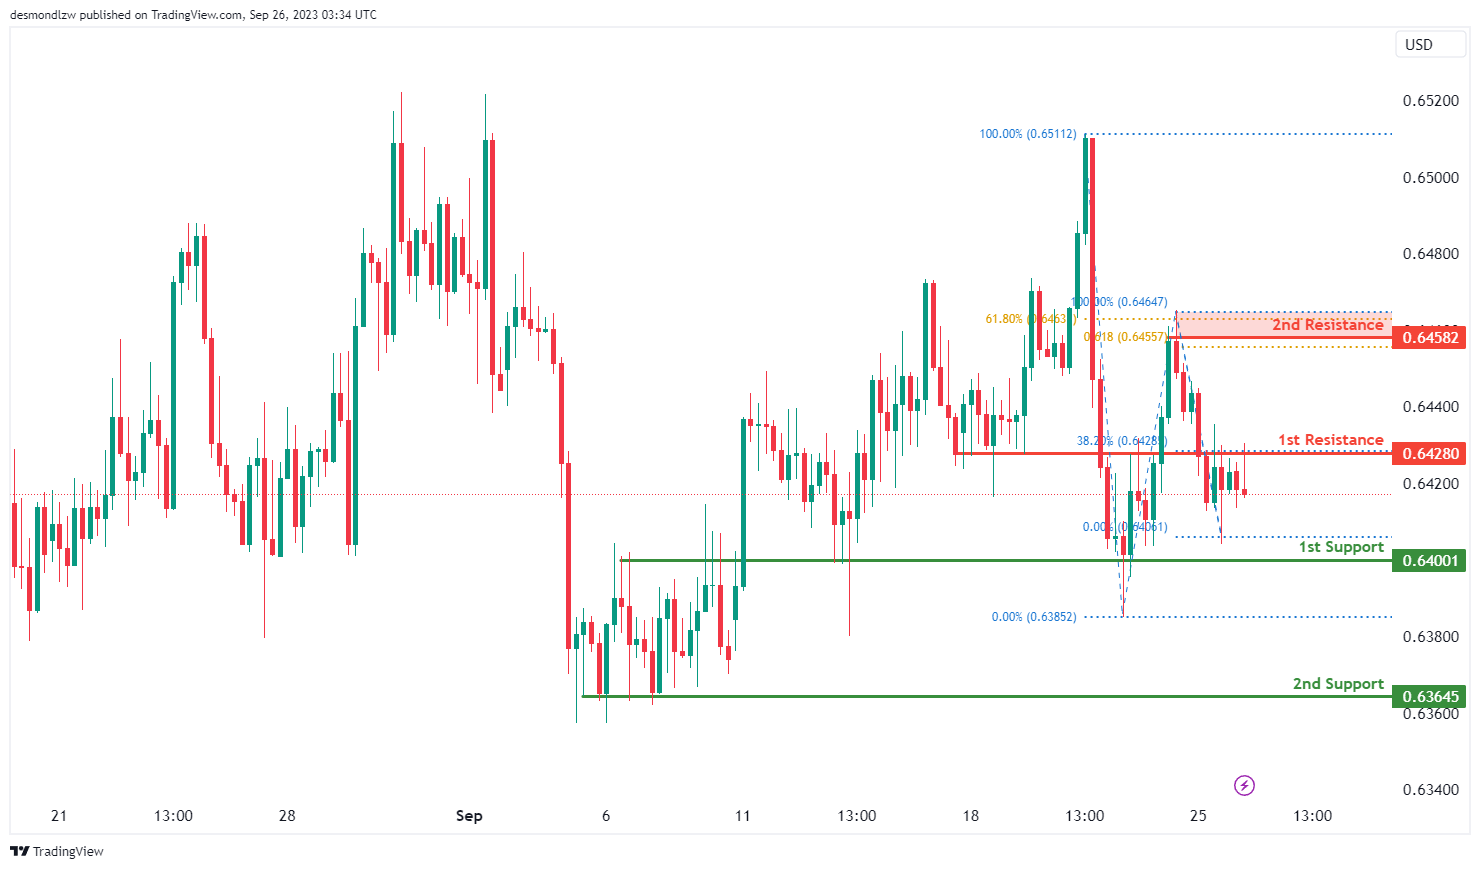
The AUD/USD chart is currently displaying an overall neutral momentum, suggesting that price may range-bound or oscillate between the 1st support and the1st resistance levels.
The 1st support level at 0.6400 is identified as an overlap support while the 2nd support level at 0.6365 is noted as a pullback support, suggesting a potential strong support level in the past.
To the upside, the 1st resistance level at 0.6428 is identified as an overlap resistance that aligns with the 38.20% Fibonacci retracement level. Further up, the 2nd resistance level at 0.6458 is marked as a swing-high resistance that aligns with a confluence of Fibonacci levels i.e. the 61.80% retracement and the 61.80% projection levels.
NZD/USD
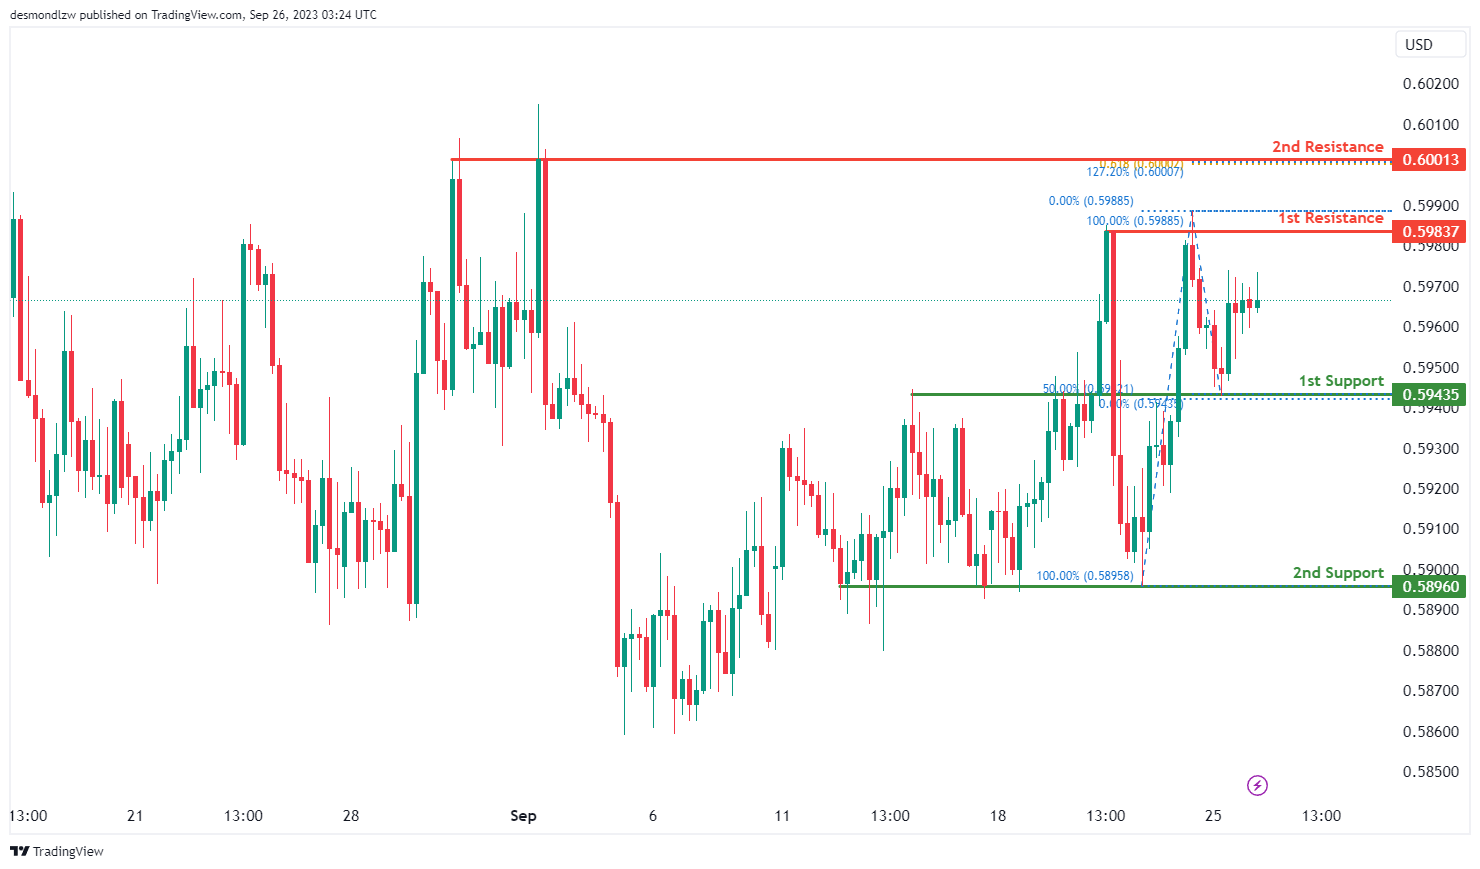
The NZD/USD chart is currently showing an overall neutral momentum, suggesting that the price may consolidate or move within the 1st support and the 1st resistance levels.
The 1st support level at 0.5944 is identified as an overlap support that aligns with the 50.00% Fibonacci retracement level. Additionally, the 2nd support level at 0.5896 is marked as a pullback support which could potentially act as a major support zone.
To the upside, the 1st resistance level at 0.5984 is identified as a multi-swing-high resistance. Further up, the 2nd resistance level at 0.6001 is also marked as a multi-swing-high resistance that coincides with a confluence of Fibonacci levels i.e. the 127.20% extension and the 61.80% projection levels.
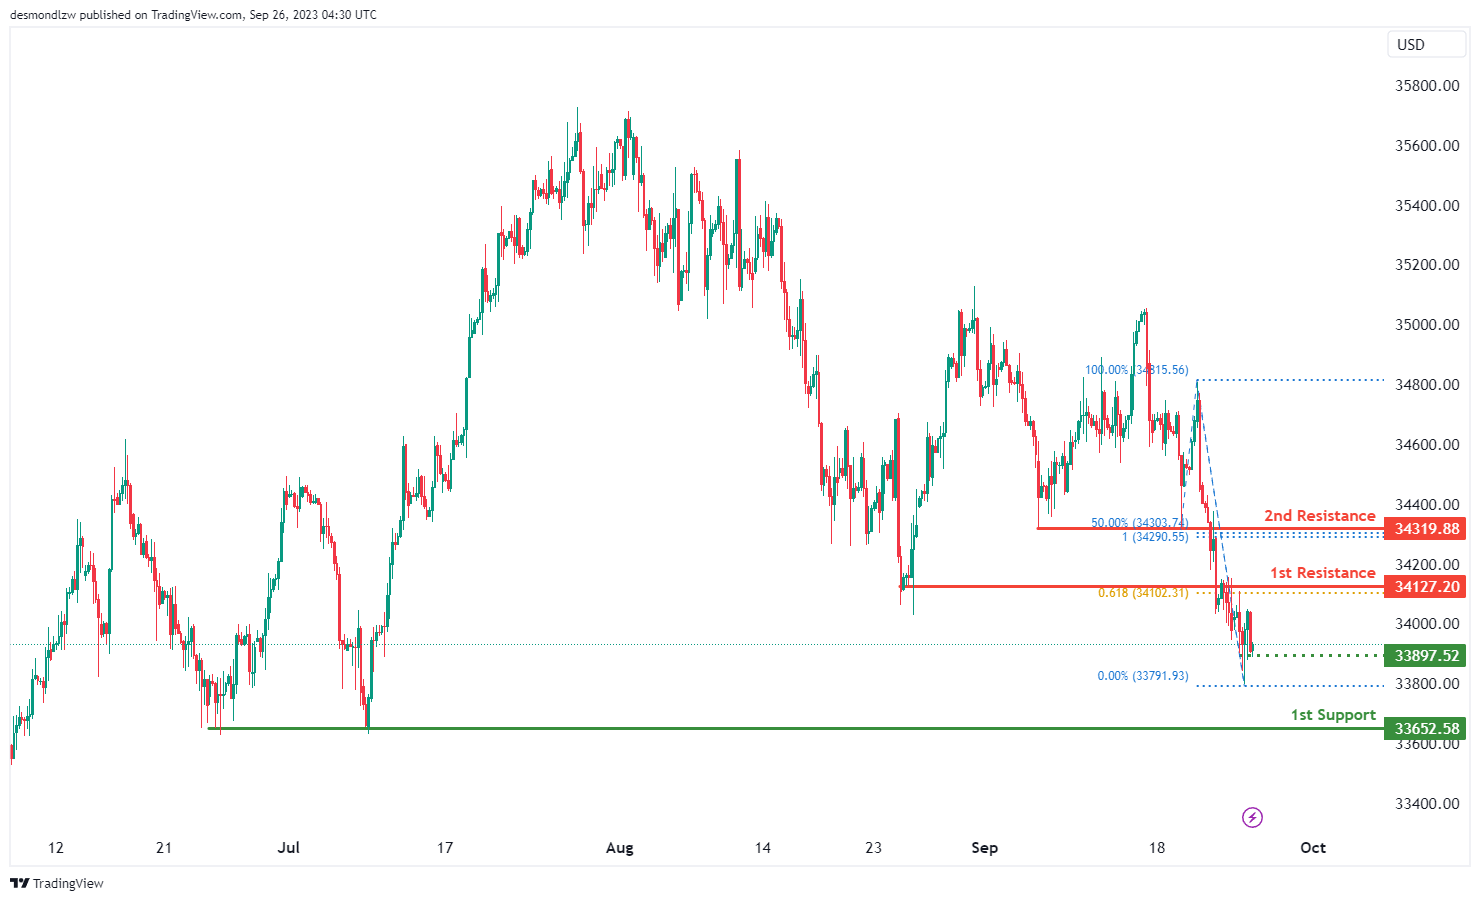
DJ30:
The instrument DJ30 currently indicates a bearish overall momentum on the chart, and there’s potential for a bearish continuation towards the 1st support.
The 1st support at 33652.58 is considered strong due to its nature as a multi-swing low support.
There is also an intermediate support at 33897.52, which is notable as it acts as a swing low support.
On the resistance side, we have the 1st resistance at 34127.20, which is significant because it represents an overlap resistance and is linked to the 61.80% Fibonacci Projection.
Furthermore, the 2nd resistance at 34319.88 is noteworthy as it functions as a pullback resistance and is associated with both the 50% Fibonacci Retracement and the 100% Fibonacci Projection, indicating potential areas of resistance convergence.
GER30:
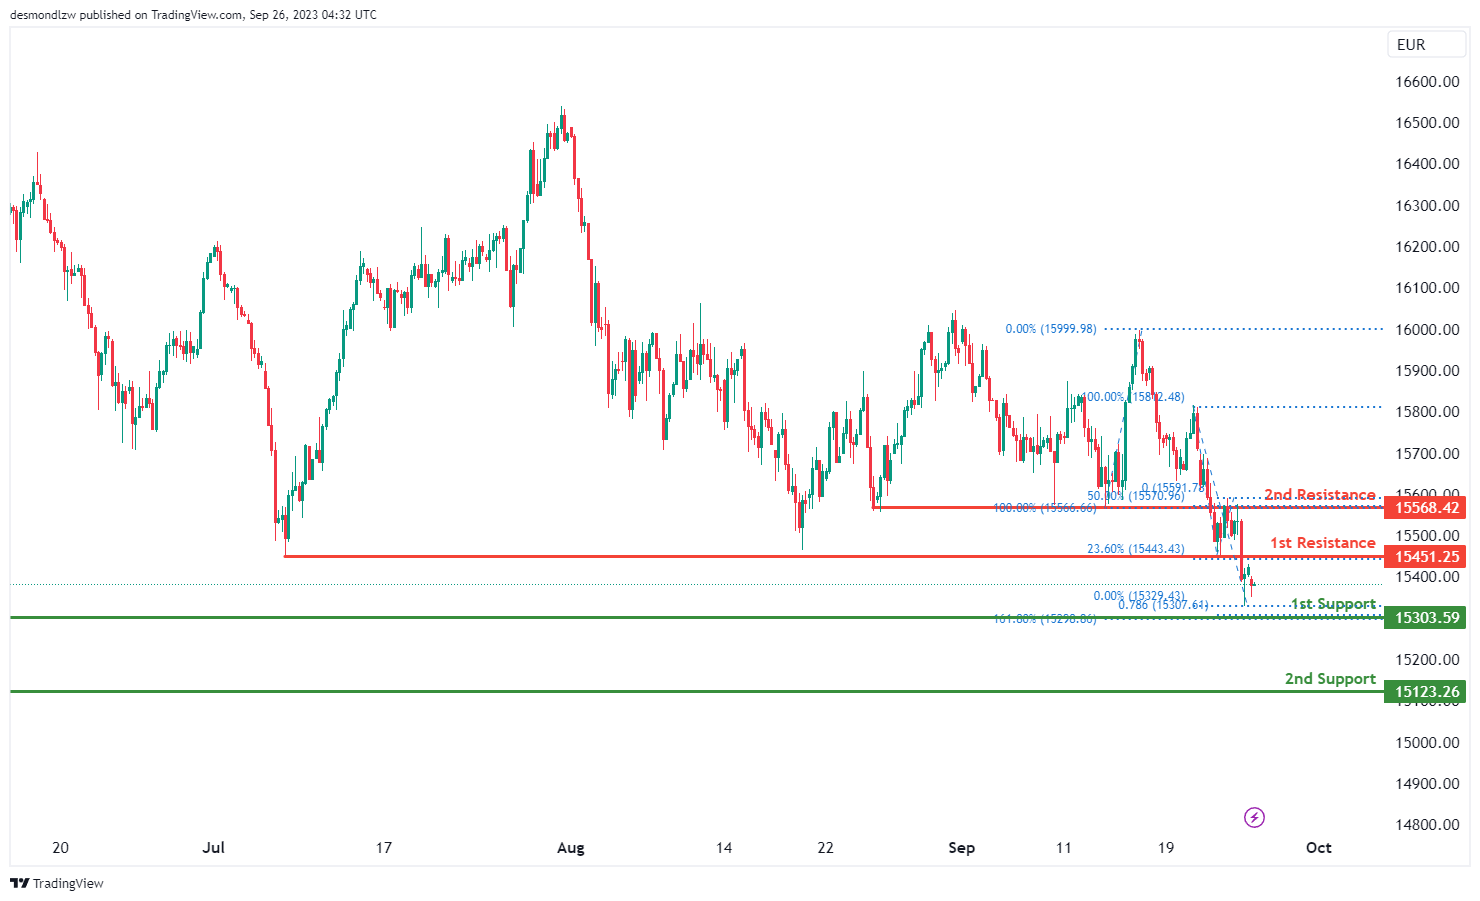
The instrument GER30 currently indicates a bearish overall momentum on the chart, and there’s potential for a bearish continuation towards the 1st support.
The 1st support at 15303.59 is considered strong due to its nature as a pullback support. It’s also associated with both the 161.80% Fibonacci Extension and the 78.60% Fibonacci Projection, indicating a potential area of Fibonacci confluence and providing robust support.
The 2nd support at 15123.26 is also notable as it acts as a swing low support and is associated with the 161.80% Fibonacci Extension, offering an additional layer of potential support.
On the resistance side, we have the 1st resistance at 15451.25, which is significant because it represents a pullback resistance and is linked to the 23.60% Fibonacci Retracement.
Furthermore, the 2nd resistance at 15568.42 is noteworthy as it functions as an overlap resistance and is associated with the 50% Fibonacci Retracement, suggesting potential barriers to further bullish movement at these levels and supporting the idea of a bearish continuation towards the 1st support.
US500
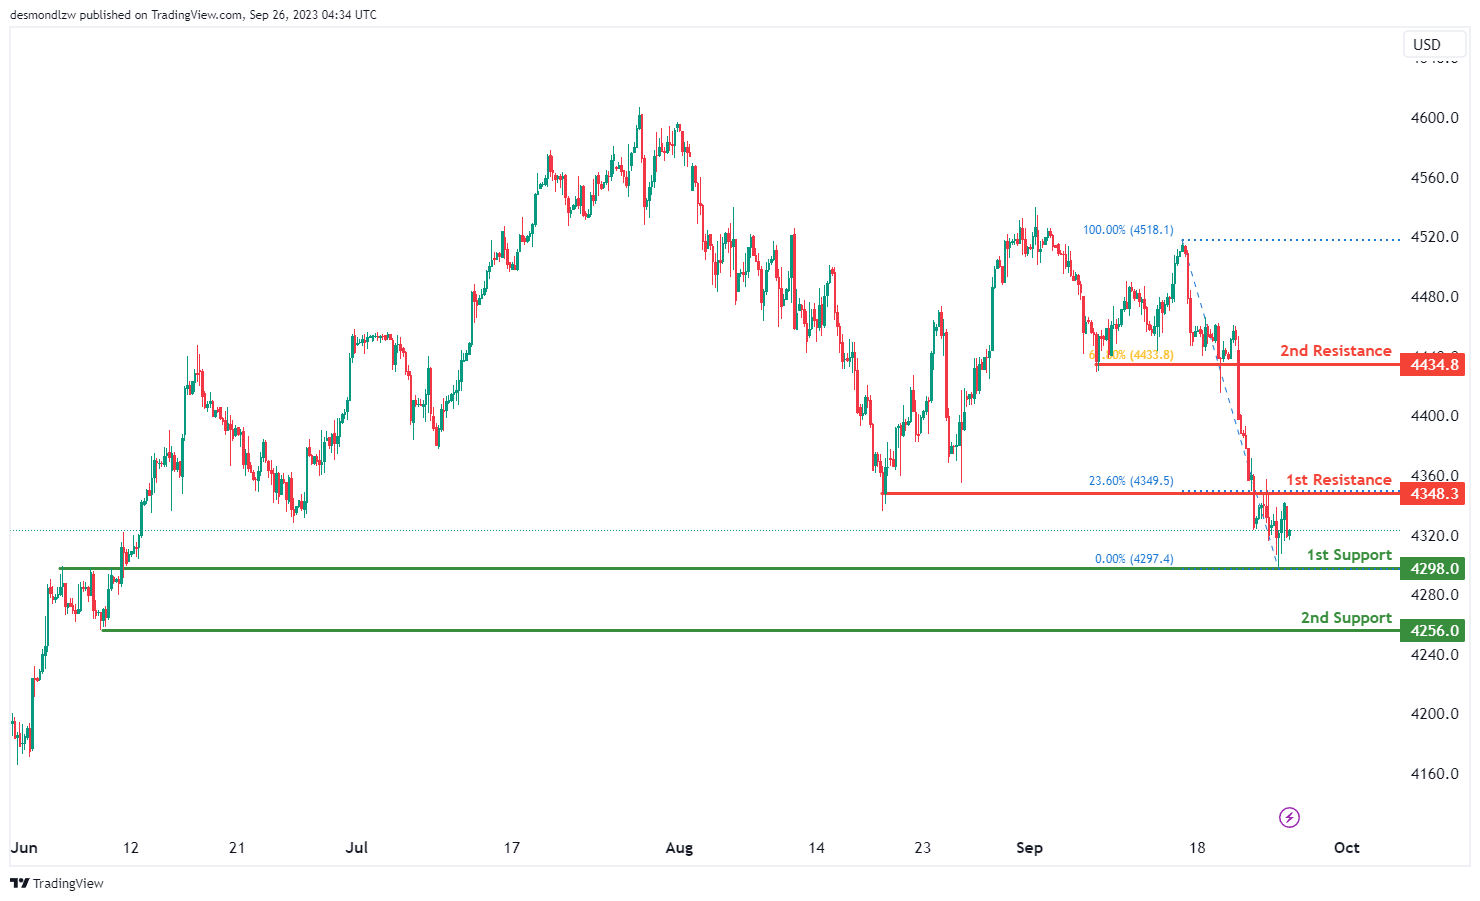
The instrument US500 currently indicates a neutral overall momentum on the chart, and there are factors contributing to this neutral momentum. As a result, there’s potential for the price to fluctuate between the 1st resistance and 1st support levels.
The 1st support at 4298.0 is considered good due to its nature as an overlap support.
The 2nd support at 4256.0 is also notable as it acts as a swing low support.
On the resistance side, we have the 1st resistance at 4348.3, which is significant because it represents an overlap resistance and is associated with the 23.60% Fibonacci Retracement.
Furthermore, the 2nd resistance at 4434.8 is noteworthy as it functions as a pullback resistance and is linked to the 61.80% Fibonacci Retracement.
BTC/USD:
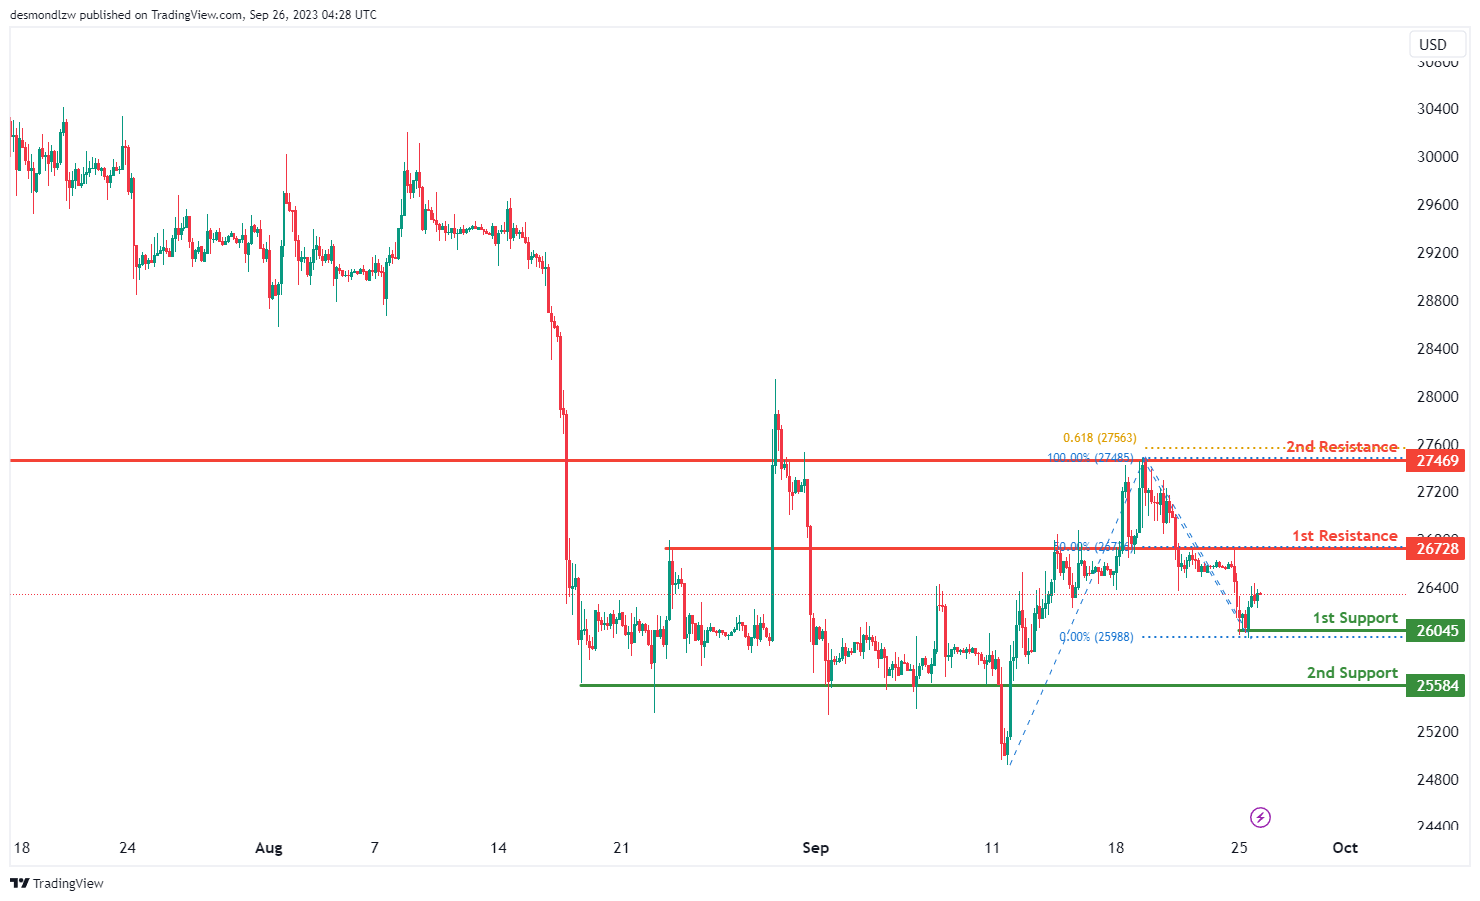
The instrument BTC/USD currently indicates a neutral overall momentum on the chart. Factors contributing to this neutral momentum include the potential for price to fluctuate between the 1st resistance and 1st support levels.
The 1st support at 26045 is considered good due to its nature as an overlap support.
The 2nd support at 25584 is also notable as it acts as a pullback support.
On the resistance side, we have the 1st resistance at 26728, which is significant because it represents an overlap resistance and is associated with the 50% Fibonacci Retracement.
Similarly, the 2nd resistance at 27469 is noteworthy as it functions as an overlap resistance and is linked to the 61.80% Fibonacci Projection, indicating potential barriers to further bullish movement at these levels.
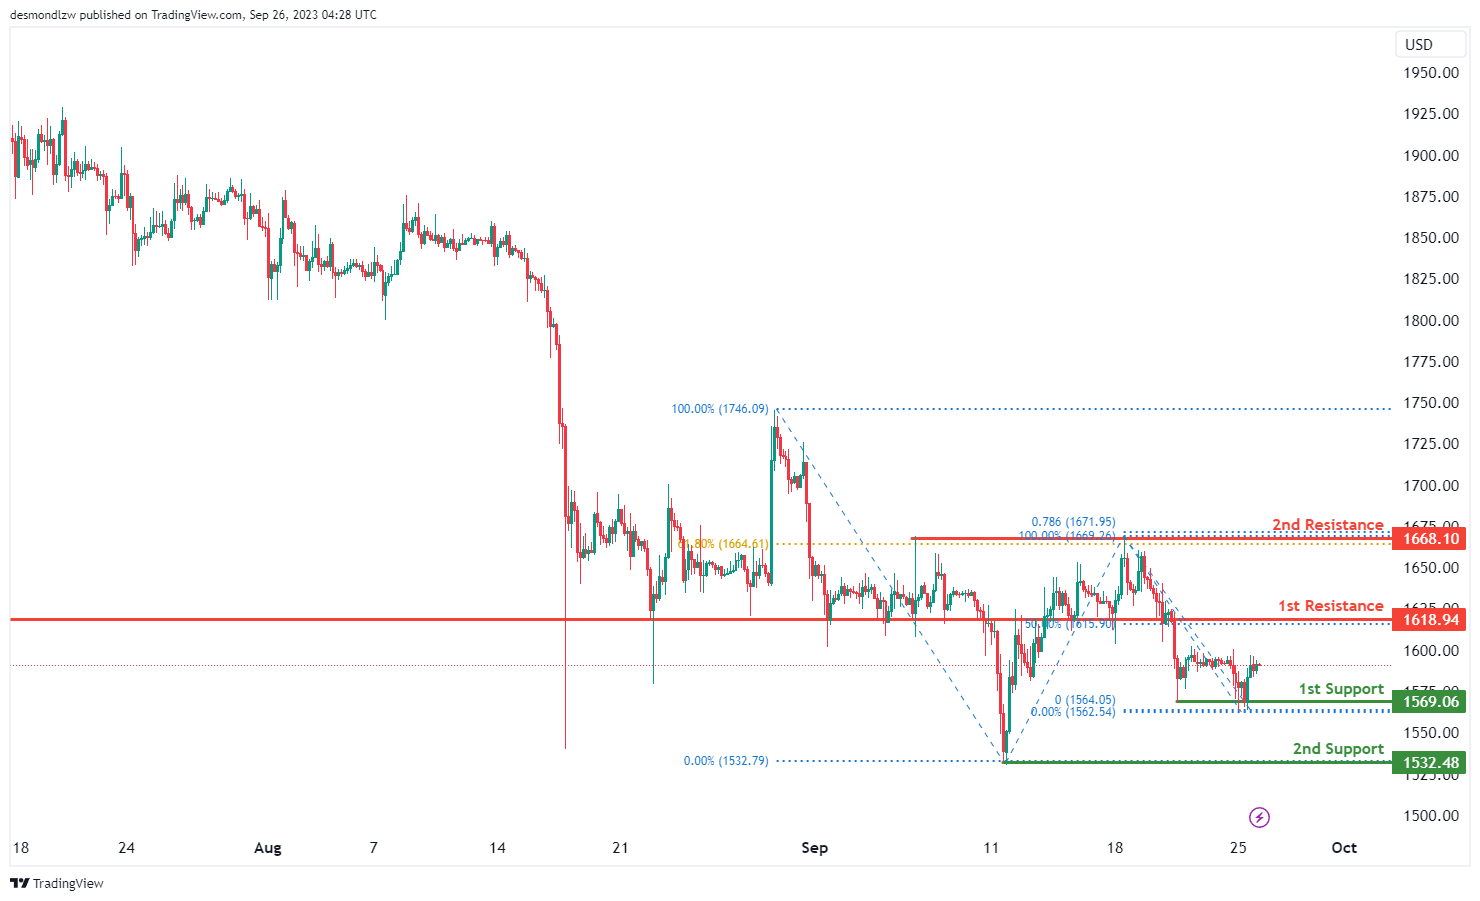
ETH/USD:
The instrument ETH/USD currently indicates a neutral overall momentum on the chart. There’s potential for the price to fluctuate between the 1st resistance and 1st support levels.
The 1st support at 1569.06 is considered good due to its nature as a multi-swing low support.
The 2nd support at 1532.48 is also notable as it acts as a swing low support.
On the resistance side, we have the 1st resistance at 1618.94, which is significant because it represents a pullback resistance and is associated with the 50% Fibonacci Retracement.
Furthermore, the 2nd resistance at 1668.10 is noteworthy as it functions as a multi-swing high resistance and is linked to both the 61.80% Fibonacci Retracement and the 78.60% Fibonacci Projection, indicating a potential area of resistance convergence. This suggests potential barriers to further bullish movement at these levels and contributes to the idea of price fluctuating within this range.
WTI/USD:
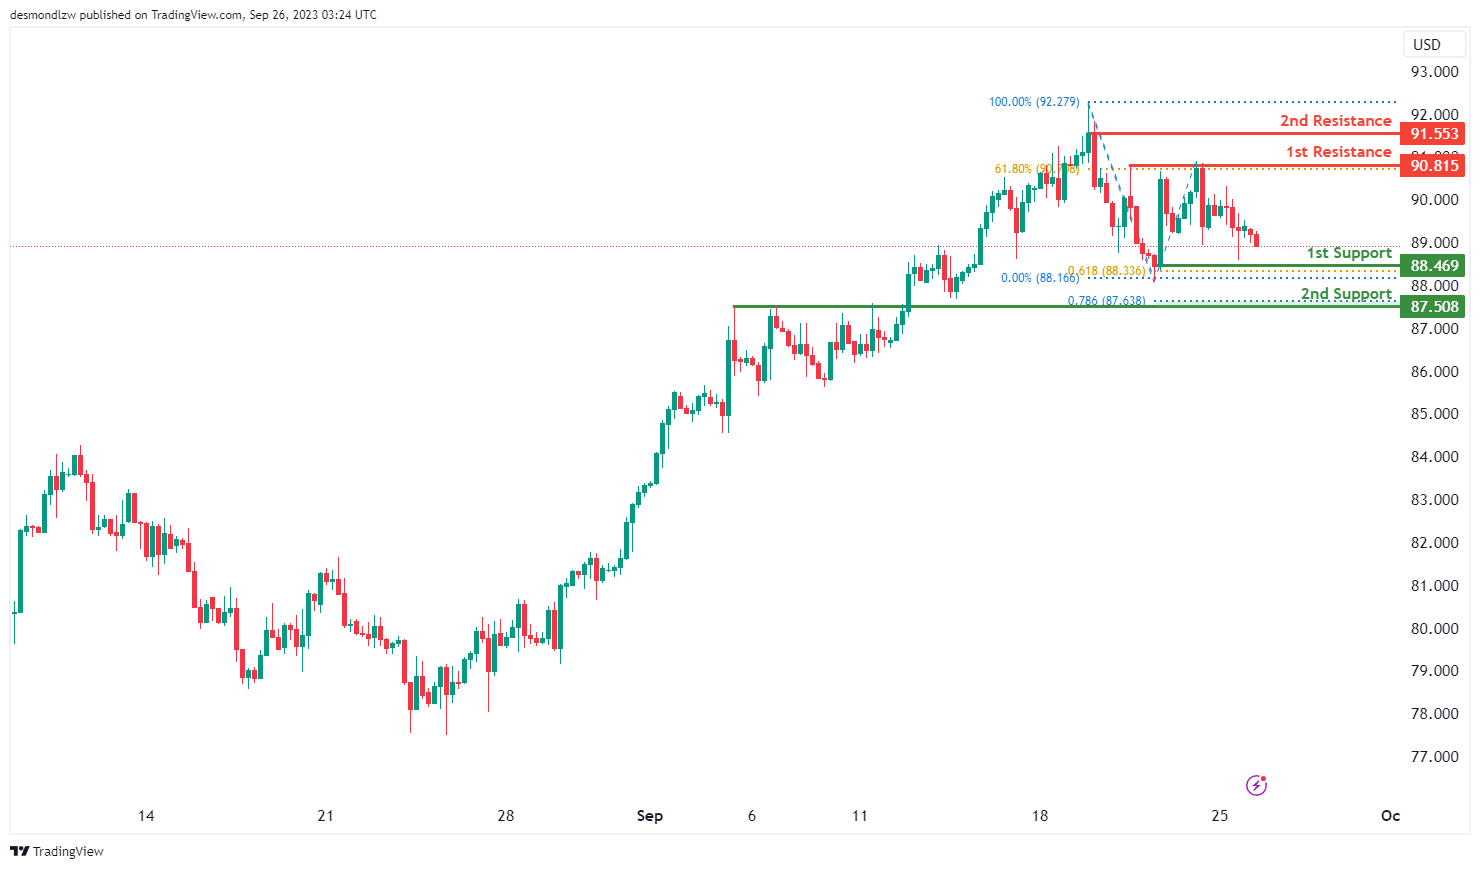
The WTI (West Texas Intermediate) chart currently exhibits a bearish momentum with price potentially falling towards the 1st support level.
The 1st support level at 88.47 is identified as a pullback support that coincides with the 61.80% Fibonacci projection level. Additionally, the 2nd support level at 87.51 is also marked as a pullback support that aligns with the 78.60% Fibonacci projection level.
To the upside, the 1st resistance level at 90.82 is identified as a pullback resistance that aligns with the 61.80% Fibonacci retracement level while the 2nd resistance level at 91.55 is marked as a swing-high resistance, which may act as a significant barrier to any potential upward movements.
XAU/USD (GOLD):
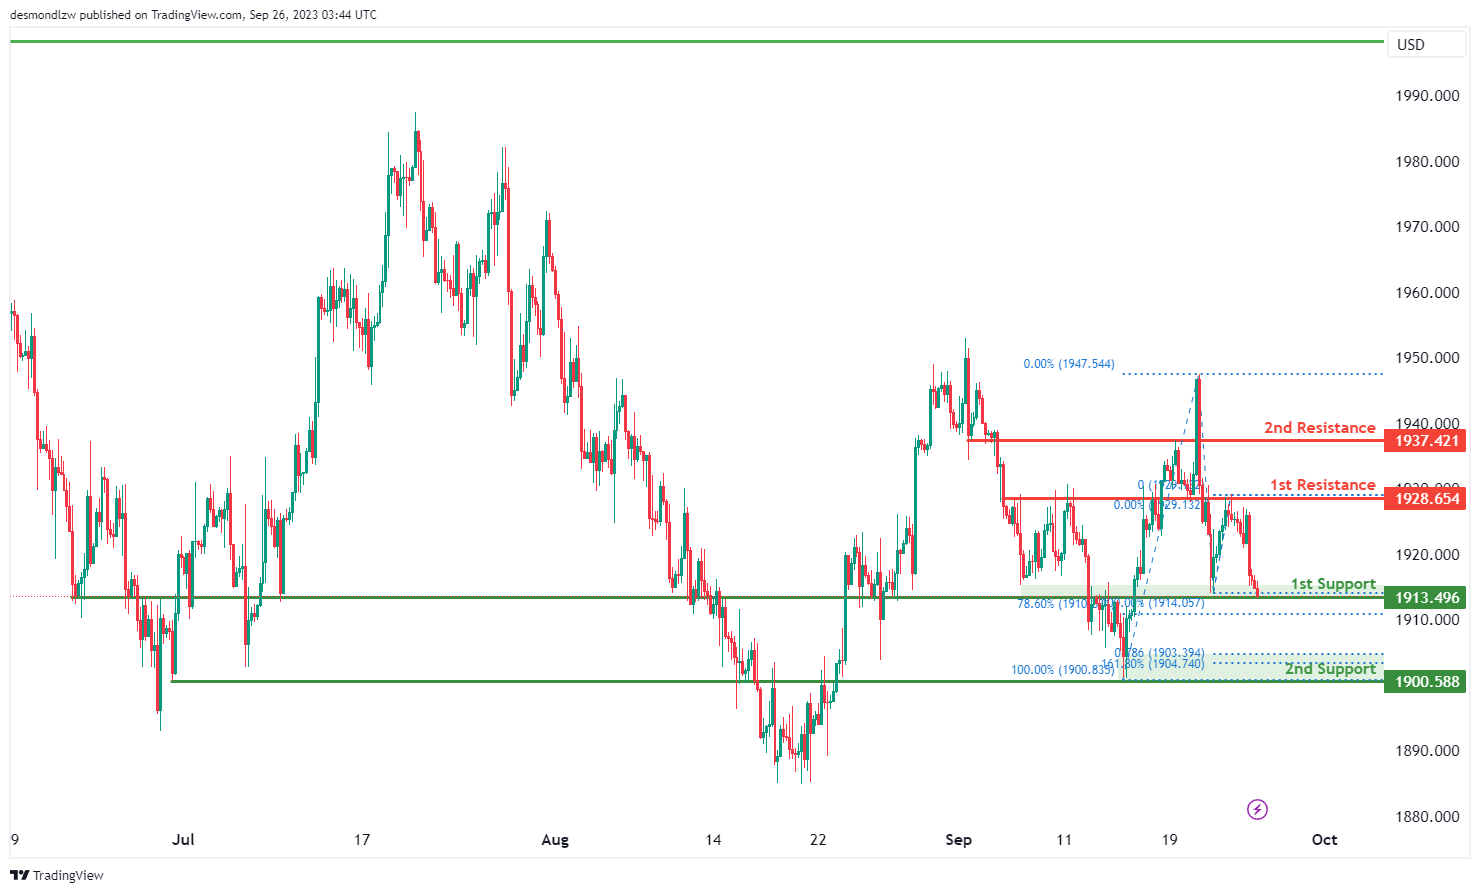
The XAUUSD chart is presently displaying a bullish trend. Anticipations suggest that there might be a bullish bounce from the 1st support level at 1913.49, which is characterized as an overlap support, directing the price towards the 1st resistance at 1928.65, which is also identified as an overlap resistance.
In case the price delves deeper, there’s a 2nd support level at 1900.00, noteworthy due to its overlap support characteristic and the convergence of the 161.80% Fibonacci Extension and the 78.60% Fibonacci Projection, marking a Fibonacci confluence and suggesting its potential significance as a strong support zone.
On the other side, should the price attempt to push higher, the 2nd resistance at 1937.42, distinguished as a pullback resistance, could act as a potential hurdle for further bullish movements.
AUD/USD Daily Report
Daily Pivots: (S1) 0.6403; (P) 0.6425; (R1) 0.6447; More...
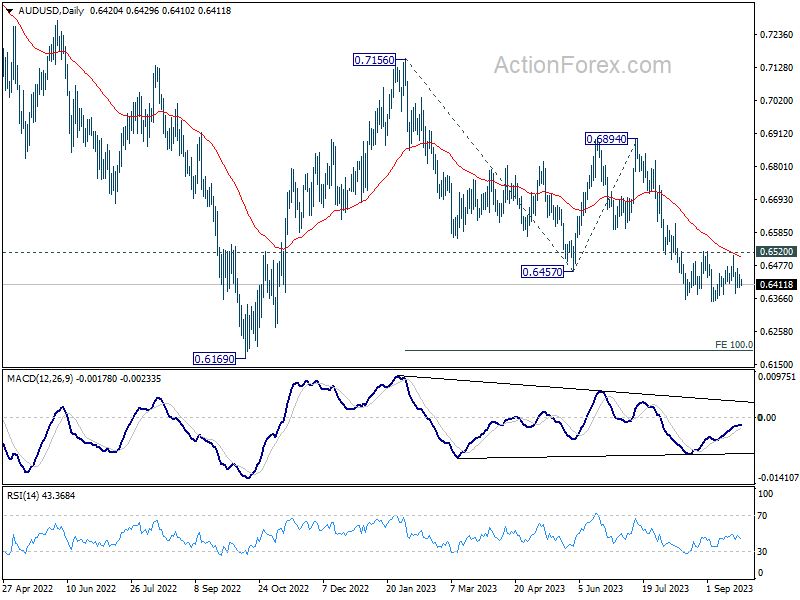
Intraday bias in AUD/USD stays neutral at this point, as consolidation from 0.6356 is extending. Further decline is expected as long as 0.6520 resistance holds. Break of 0.6356 will resume larger down trend to 100% projection of 0.7156 to 0.6457 from 0.6894 at 0.6195.
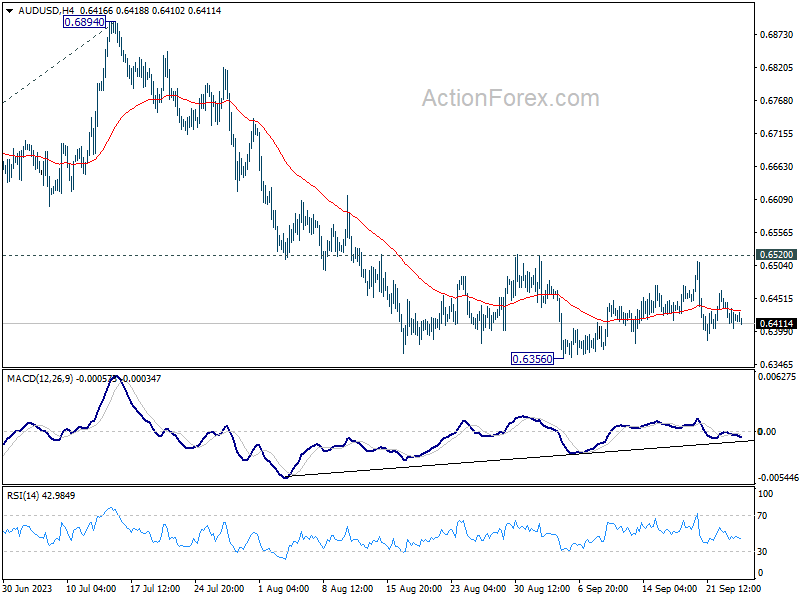
In the bigger picture, down trend from 0.8006 (2021 high) is possibly still in progress. Decisive break of 0.6169 will target 61.8% projection of 0.8006 to 0.6169 to 0.7156 at 0.6021. This will now remain the favored case as long as 0.6894, in case of strong rebound.
USD/CAD Daily Outlook
Daily Pivots: (S1) 1.3442; (P) 1.3467; (R1) 1.3480; More....
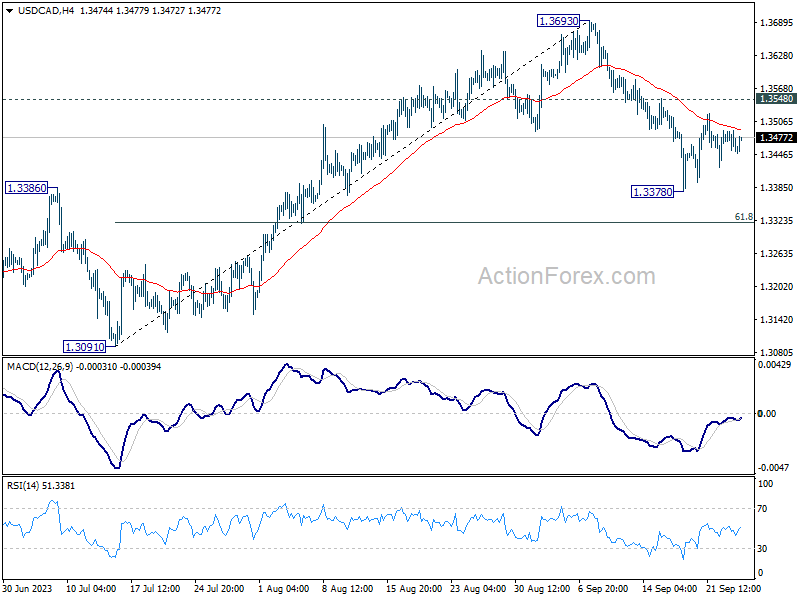
USD/CAD is staying in consolidation from 1.3378 and intraday bias remains neutral. Risk will stay on the downside as long as 1.3548 resistance holds. Break of 1.3378 will resume the fall from 1.3693, as another leg in the corrective pattern from 1.3976 high, to 61.8% retracement of 1.3091 to 1.3693 at 1.3321. However, firm break of 1.3548 will turn bias back to the upside for retesting 1.3693 instead.
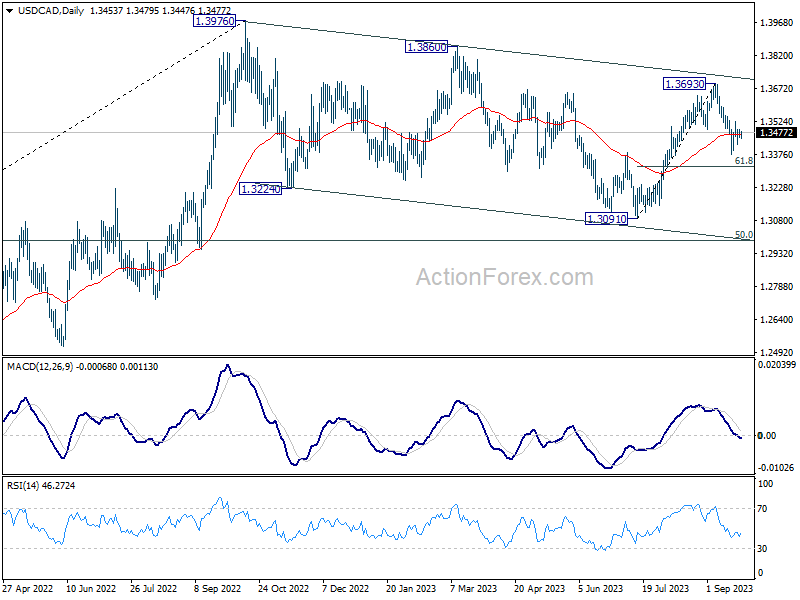
In the bigger picture, price actions from 1.3976 are viewed as a corrective pattern to the up trend from 1.2005 (2021 low). Deeper decline could be seen as the pattern is now extending. But downside should be contained by 50% retracement of 1.2005 to 1.3796 at 1.2991. Rise from 1.2005 is still expected to resume after the correction completes.
USD/JPY Daily Outlook
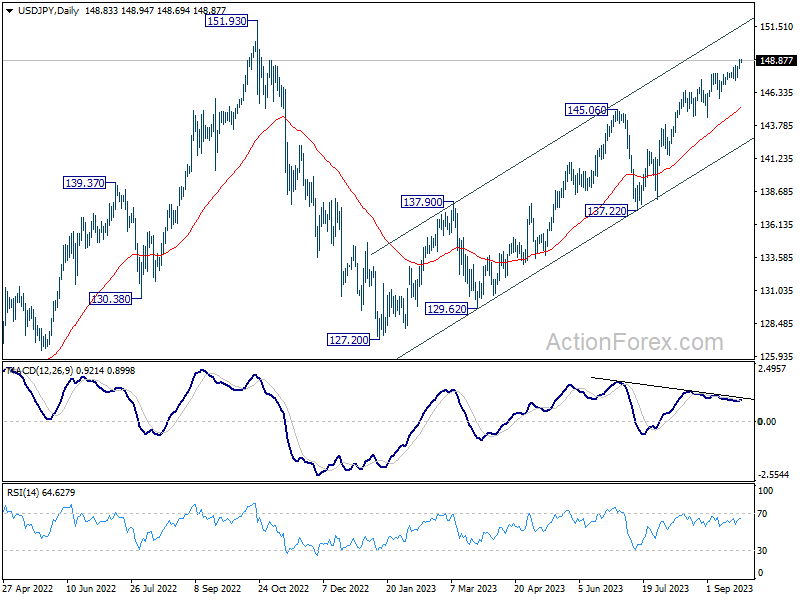
Daily Pivots: (S1) 148.43; (P) 148.70; (R1) 149.15; More...
USD/JPY's rally continues today and intraday bias stays on the upside. Current rise from 127.20 is in progress to retest 151.93 high. On the downside, however, firm break of 147.31 support will should confirm short term topping, and turn bias to the downside for 145.88 support and below.
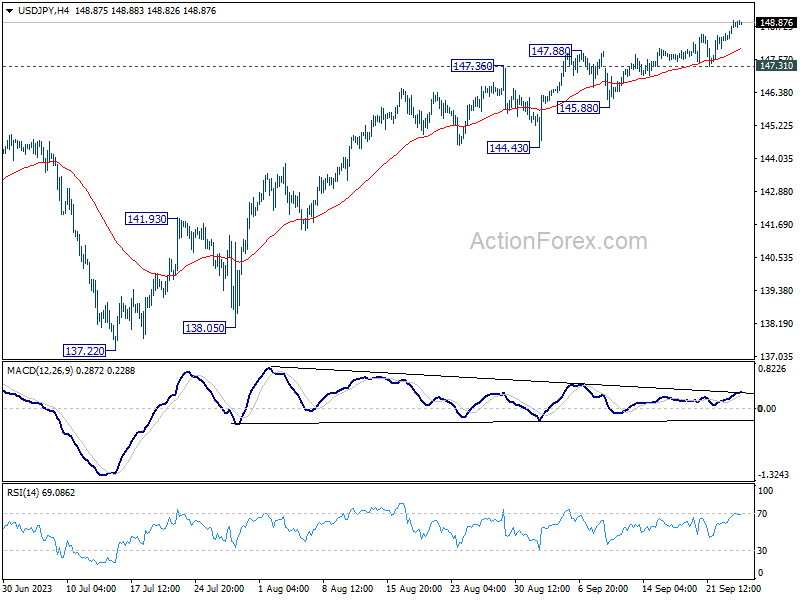
In the bigger picture, while rise from 127.20 is strong, it could still be seen as the second leg of the corrective pattern from 151.93 (2022 high). Rejection by 151.93, followed by break of 137.22 support will indicate that the third leg of the pattern has started. However, sustained break of 151.93 will confirm resumption of long term up trend.
USD/CHF Daily Outlook
Daily Pivots: (S1) 0.9075; (P) 0.9106; (R1) 0.9151; More....
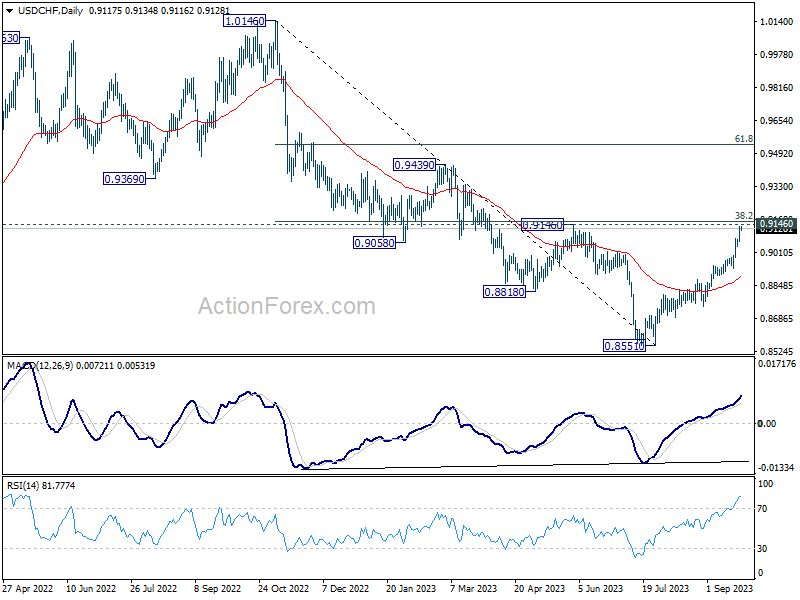
Intraday bias in USD/CHF stays on the upside as rise form 0.8551 is extending to 0.9146/60 cluster resistance. Decisive break there will carry larger bullish implication, and target 0.9439 resistance next. On the downside, break of 0.8930 support is needed to confirm short term topping. Otherwise, outlook will stay bullish in case of retreat.
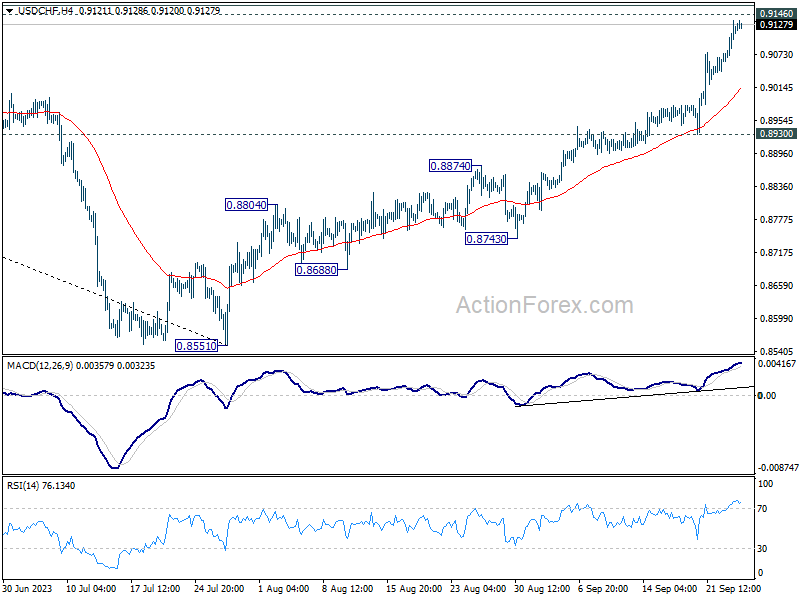
In the bigger picture, rebound from 0.8551 medium term bottom is currently seen as a correction to the downtrend from 1.0146 (2022 high). Further rally would be seen to 0.9146 cluster resistance (38.2% retracement of 1.0146 to 0.8551 at 0.9160). Strong resistance could be seen there to limit upside, at least on first attempt. However, decisive break of 0.9146/60 will indicate trend reversal, and target 61.8% retracement at 0.9537.