Sample Category Title
Yen Falls to 11-month Low, 150 Next?
- BoJ Ueda says 2% inflation target not yet achieved
- USD/JPY pushes above 149
The Japanese yen is unchanged on Tuesday, trading at 148.85.
BOJ’s Ueda says monetary policy to continue
The Bank of Japan maintained its policy settings on Friday, which really should not have been all that surprising, given the dovish messages that BoJ Governor Ueda and other BoJ members have been sending out for weeks. The BoJ does not appear to be in any rush to phase out its ultra-loose stimulus, given the weakness in Japan’s economy. Domestic consumption remains weak and the slowdown in the global economy is hurting the critical export sector.
BoJ Governor Ueda reiterated this stance on Monday, stating that the 2% target of “stable, sustainable” inflation was not yet in sight. Ueda acknowledged that inflation had exceeded 2% for a “prolonged period”, but that was not enough to indicate that the target of stable and sustainable 2% inflation had been achieved. Ueda added that the BoJ would continue to patiently maintain its monetary stance.
Inflation has remained above 2% for close to 1.5 years, but that does not seem sufficient for the BoJ. Earlier today, the BoJ Core CPI index, which is closely monitored by the central bank, remained unchanged at 3.3% in August, above the market consensus of 3.2%.
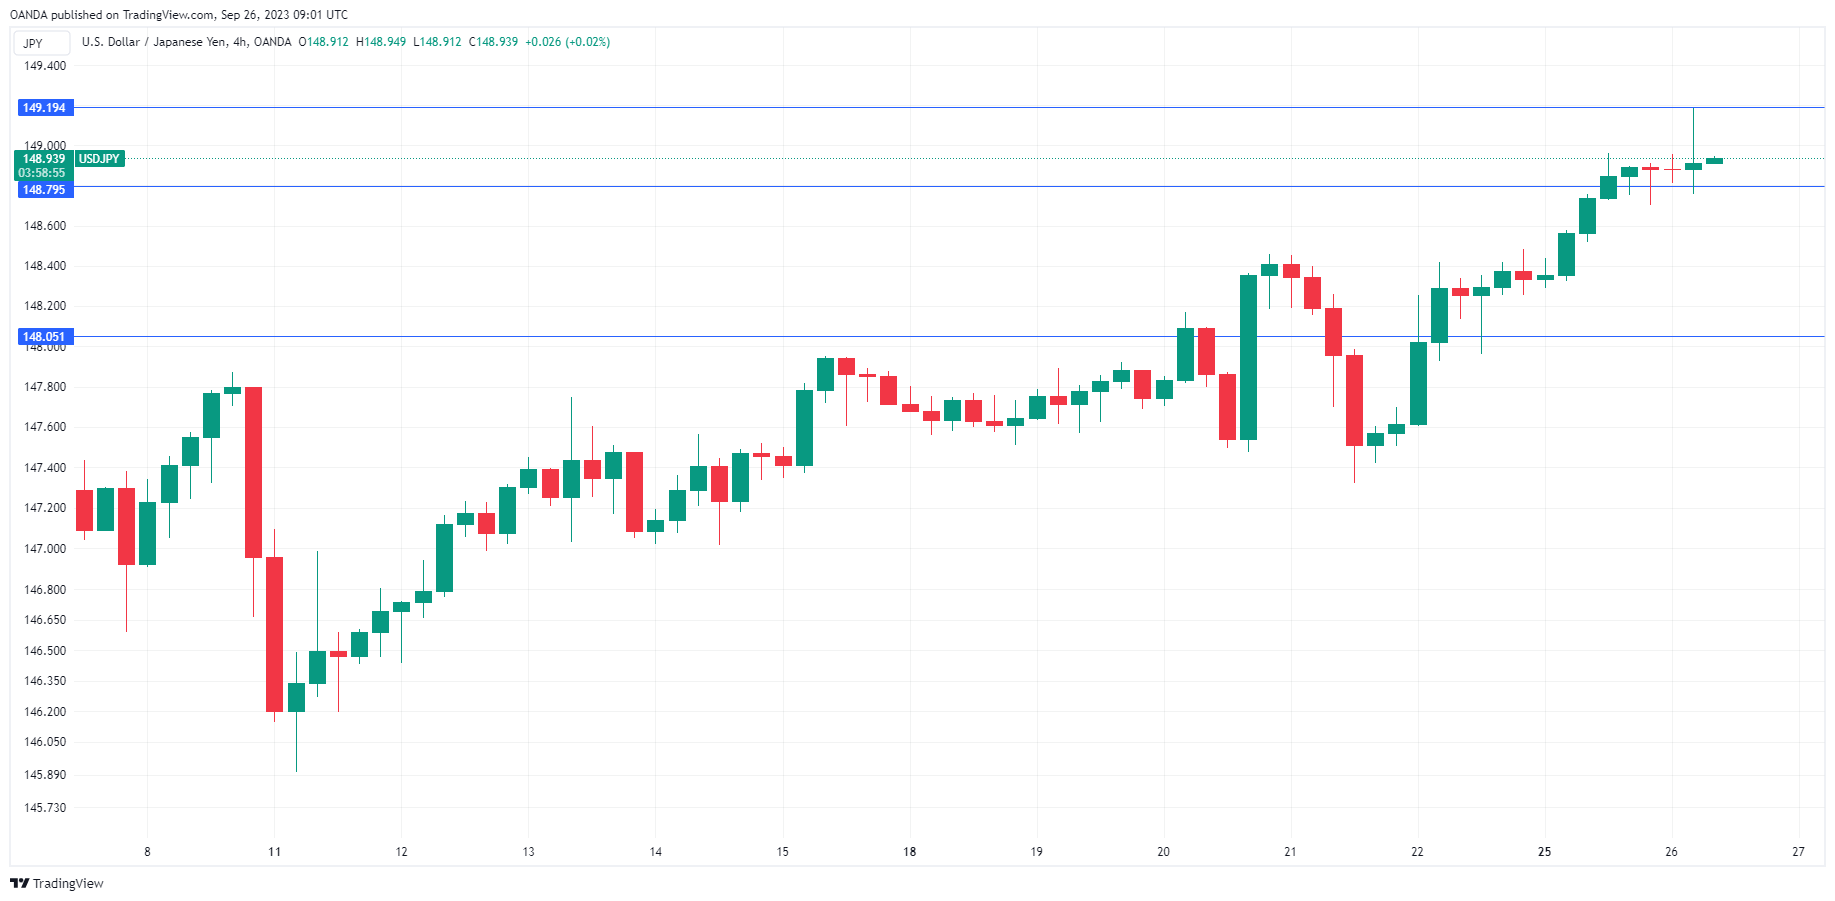
The yen has paid the price for the BoJ’s insistence on maintaining an ultra-loose policy and has had only one winning week against the dollar since July. The US/Japan rate differential continues to rise as Japanese yields stay put while US Treasury yields continue to move higher. USD/JPY broke above the 149 line on Tuesday and the symbolic 150 level seems very close at hand. Japanese officials have responded with some rhetoric about their concern over the depreciating yen and the threat of intervention is rising as the yen falls lower.
USD/JPY Technical
- There is resistance at 149.19 and 149.93
- USD/JPY tested support at 148.79 earlier. Below, there is support at 148.05
Rising Bond Yields Are Driving Down Price of Gold
The yield on 10-year bonds exceeded 4.5% per annum – a 16-year high. The demand for them was promoted by:
→ tough statements from the Fed last week that the high base interest rate will remain as long as necessary. Moreover, Minneapolis Fed President Neel Kashkari said he expects another increase;
→ concerns related to the likelihood of a US government shutdown on October 1. At the same time, Moody's issued a stern warning, jeopardizing the country's triple-A rating.
It can be assumed that investors choose bonds when forming a portfolio of protective assets. This puts pressure on the gold, which “loses its shine” in their eyes.
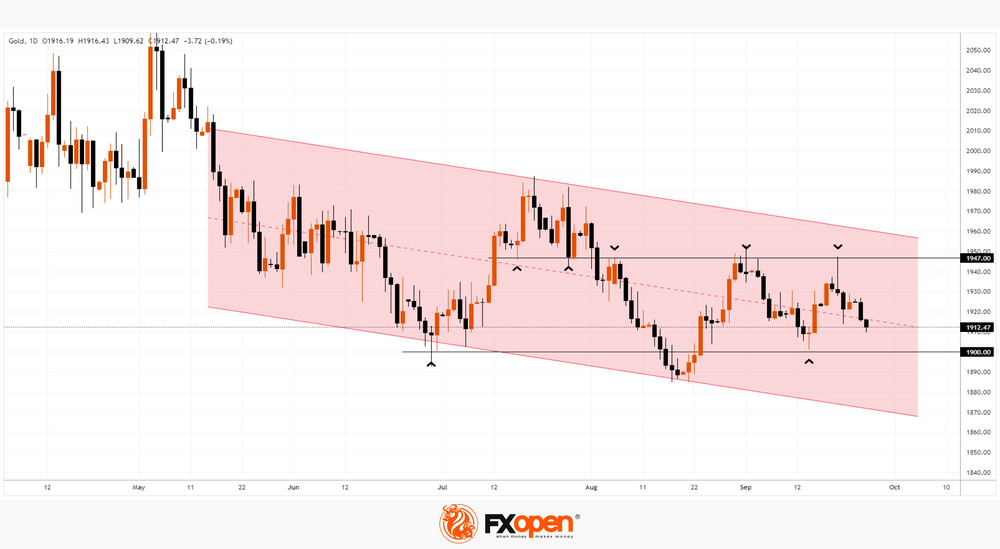
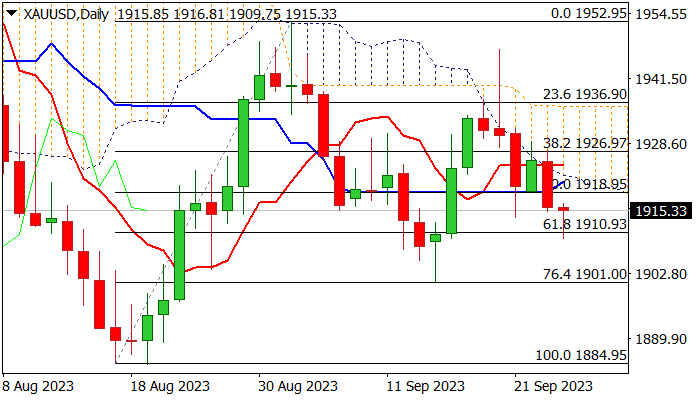
Thus, the XAU/USD daily chart shows that the price of gold continues the downward trend that has been going on since spring. Wherein:
→ the price of gold actively interacts with the level of 1,947. In July, this level acted as support, but in August this status changed. And the candle of September 20 confirms the dominance of the bears — the price failed to stay at the achieved heights. It was more like an intraday emotional movement that did not reflect the intrinsic value of gold;
→ so far, the price is near the median line of the channel, where supply and demand tend to balance, so this reduces the likelihood of sharp spikes in volatility;
→ But the psychological level of USD 1,900 per ounce is getting closer. But if in July the price rebounded sharply from it, then in August it made a delay, falling below 1,900. If the pressure on gold continues, then the bears may attempt a new attack on the psychological level and it is possible that the price may drop to the lower limit by the end of the year downward channel.
This article represents the opinion of the Companies operating under the FXOpen brand only. It is not to be construed as an offer, solicitation, or recommendation with respect to products and services provided by the Companies operating under the FXOpen brand, nor is it to be considered financial advice.
After Hawkish Fed, Dollar Turns to Core PCE Inflation
- Fed lifts dot plot, adds fuel to dollar’s engines
- Focus turns to core PCE index, the Fed’s preferred inflation gauge
- Slowdown could hurt the dollar, but broader outlook remains bright
- The data is released on Friday, at 12:30 GMT
Fed signals another hike, fewer cuts in 2024
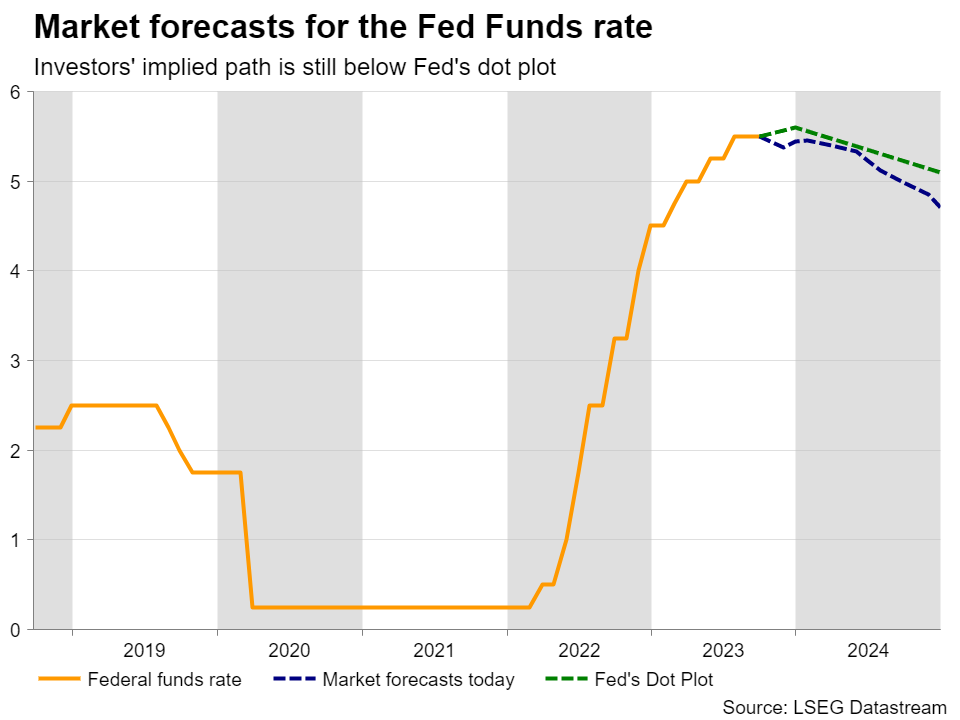
The Fed decided to keep rates steady last week, but policymakers appeared in hawkish armor, projecting a higher rate path than back in June. The new dot plot continued pointing to another quarter point hike by the end of this year, but only to two rate cuts during 2024. More specifically, officials now see rates coming down to 5.1%, 50bps higher than June’s 4.6% projection.
Still, investors were not fully convinced, as their own implied path points to only a nearly 50% probability for a final hike, while it indicates that interest rates will end 2024 at 4.7%. This suggests that there is still room for market participants to adjust higher their path should data continue to point to a resilient US economy, which in turn could add more fuel to the dollar’s engine tanks.
Focus turns back to the data
With that into consideration, although there is no data equivalent to Wednesday’s decision on this week’s agenda, investors may pay some attention to Friday’s core PCE index as it appears to be a more preferred inflation metric by the Fed than the CPIs, even if it is much less of a market mover. At the same time with the core PCE index, we get the personal income and spending data, while the day before, the final GDP for Q2 and initial jobless claims for last week are scheduled to be released.
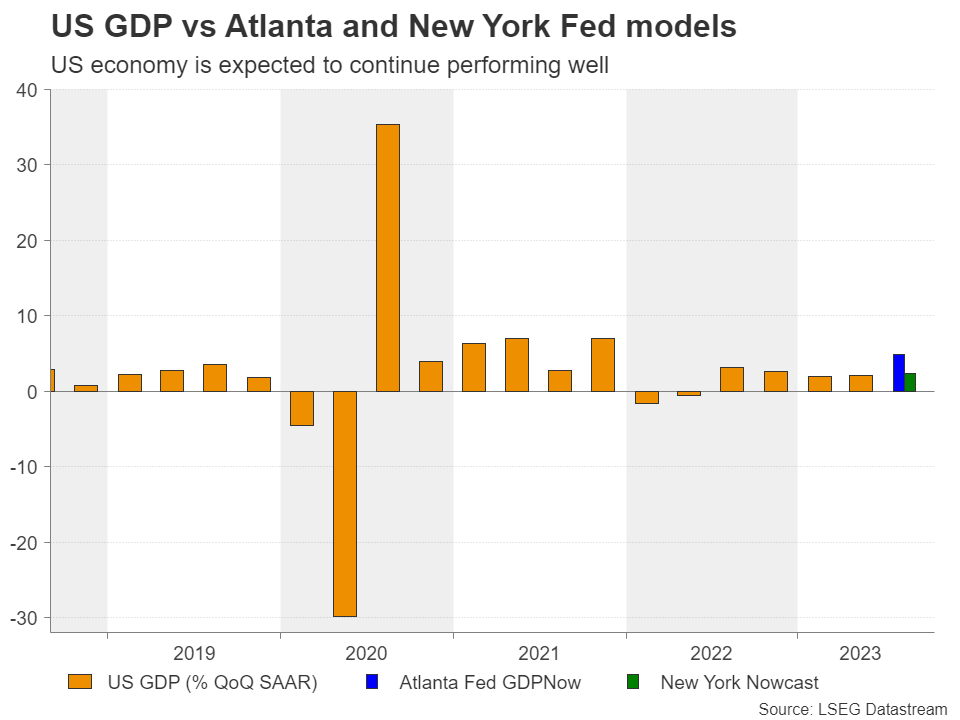
The GDP is likely to pass unnoticed as there are models already pointing to how the economy has performed during Q3. The Atlanta Fed GDPNow points to an outstanding 4.9% growth rate, while the New York Nowcast suggests that the economy grew around 2.3%. Although there is a big divergence between the two, they both point to a solid economic performance, which is unlikely to break the Fed’s “higher for longer” mentality.
Core PCE, income and spending, may all slow
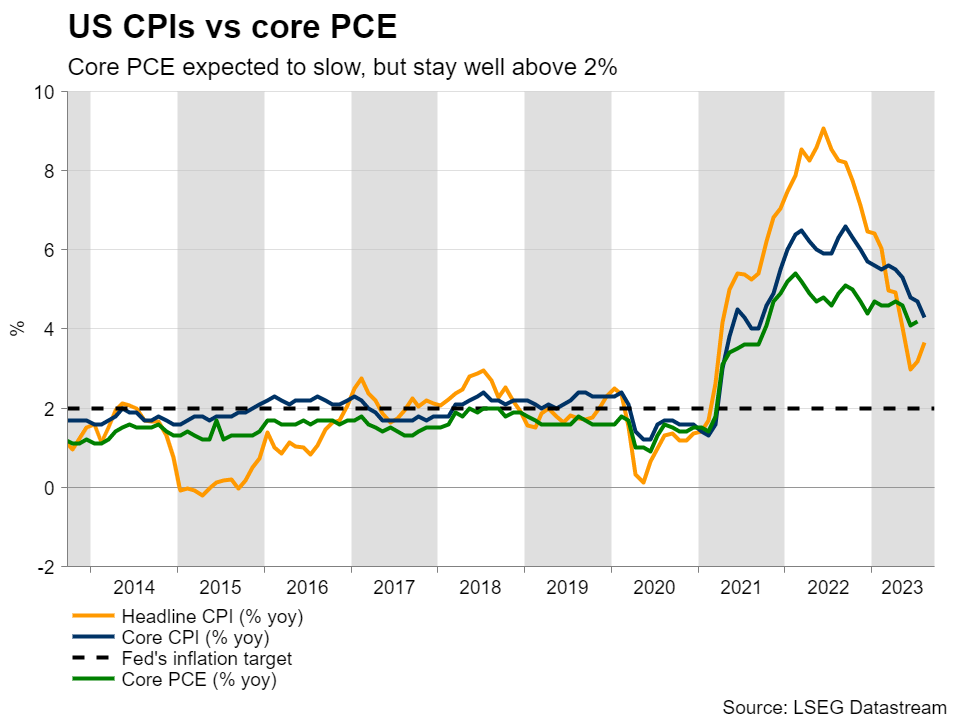
For Friday’s core PCE index, expectations are for a slowdown, which is supported by the cooling of the core CPI for the month. That said, even if this metric of underlying inflation slows, it would most likely remain decently above the Fed’s 2% goal. What’s more, considering the blend of a resilient economy and rising oil prices, the risk of a rebound in the months to come is not negligible.
Personal spending is also expected to have slowed, confirming the slight cooling in retail sales for the month, and thereby the reduced consumer demand. Although income is forecast to have accelerated, the deceleration in the monthly average hourly earnings for August tilts the risks to the downside.
Dollar could pull back, but stay in uptrend mode
The dollar could give back a small portion of its latest gains if the data adds to the idea that inflation in the US continues to cool down. However, a potential slide would be far from suggesting that the uptrend has run its course. Should growth-related data continue to suggest that the US economy is faring better than other major ones, the dollar is likely to continue shining.
Besides the “higher for longer” narrative, another source of dollar strength may be risk aversion, as the latest challenges facing the Chinese economy, as well as the Eurozone and the UK, are directing extra flows into the US dollar, which due to the higher US interest rates seems to be investors’ safe haven of choice.
Cable among the pairs to continue suffering
With the BoE unexpectedly taking the sidelines on Thursday and market participants assigning a 75% probability for no action at the November gathering, pound/dollar may be among the better choices for exploiting further dollar strength.
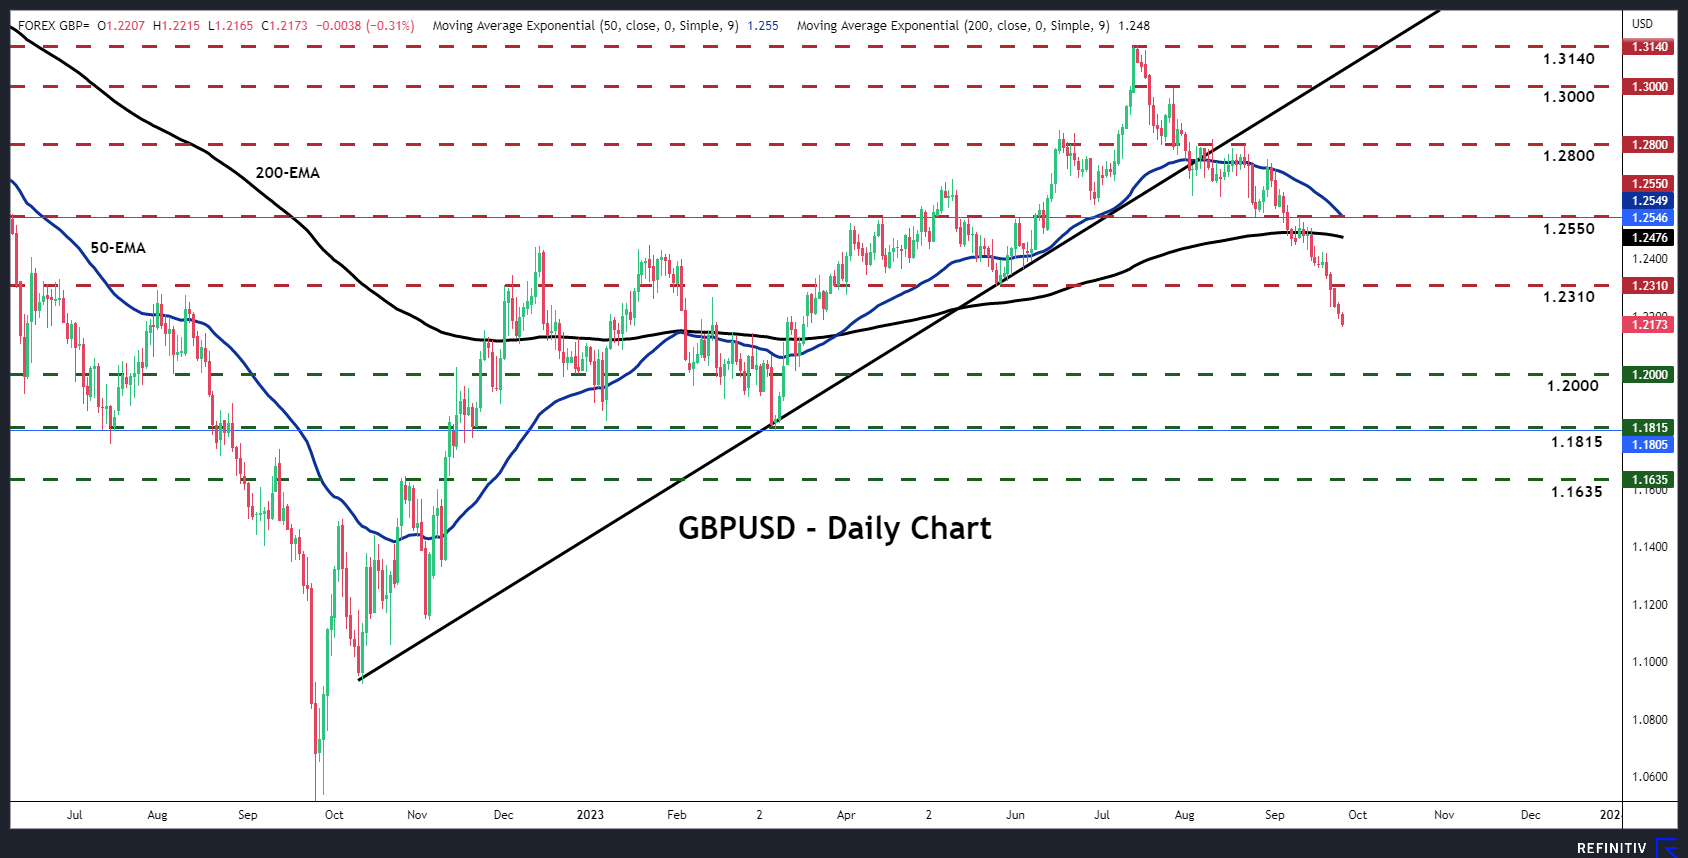
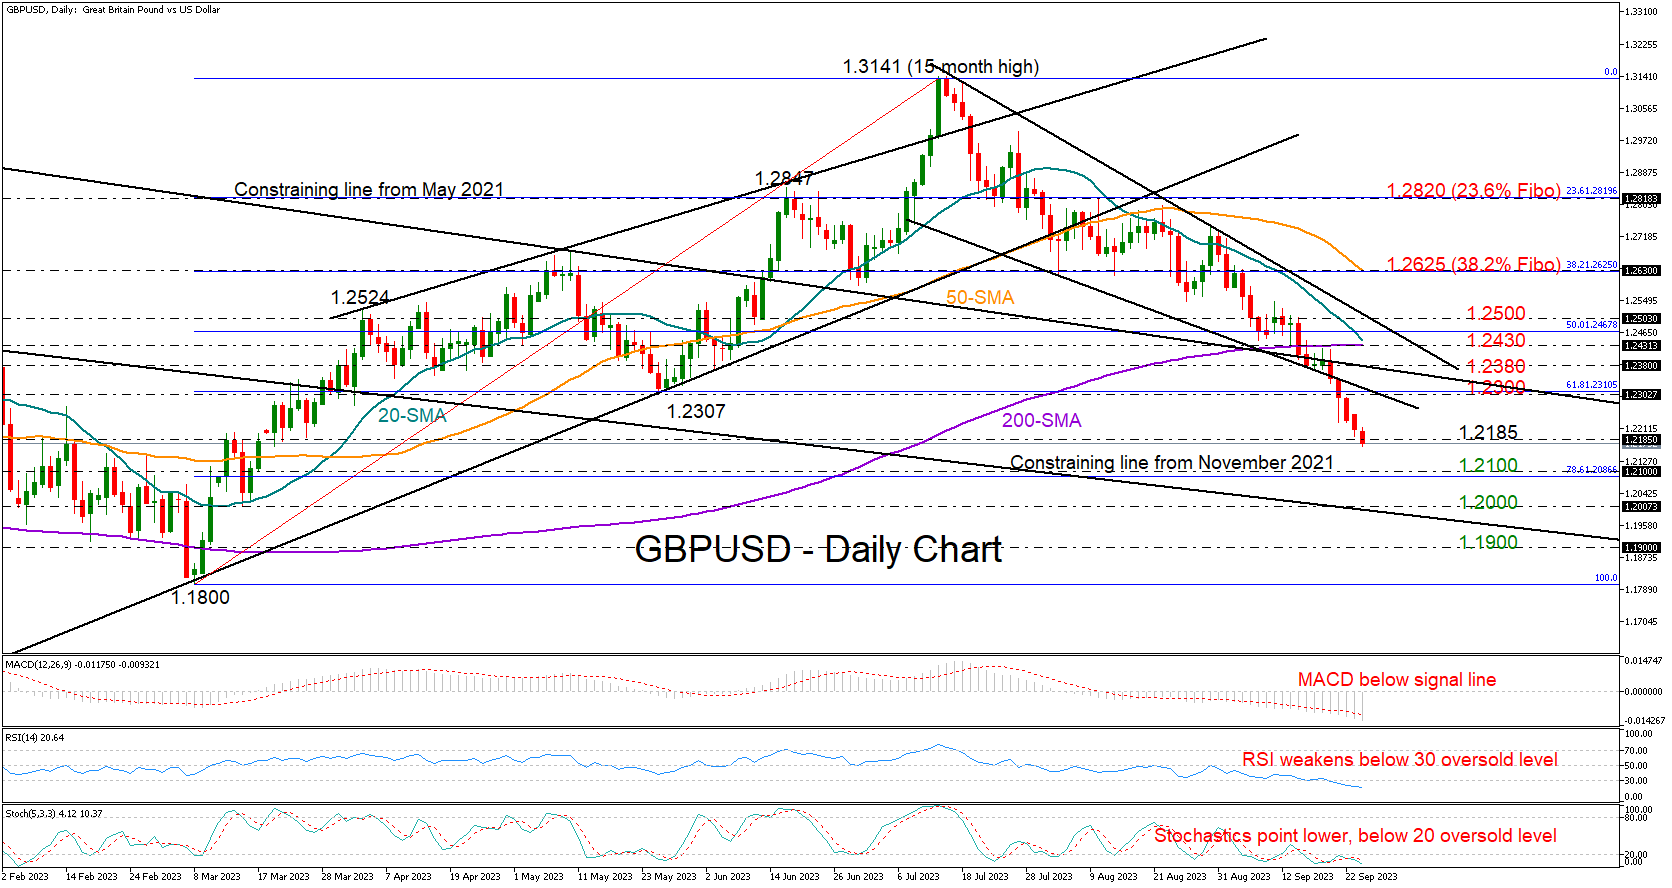
Cable has been in a sliding mode since mid-July and just after last week’s BoE decision, it pierced through the 1.2310 key zone, likely confirming a bearish trend reversal on the daily chart. The dip may have opened the way towards the psychological round number of 1.2000, marked by the low of March 15, the break of which could aim for the low of March 8, at around 1.1815.
On the upside, a return above 1.2310 is unlikely to make the picture brighter. It may just turn the outlook back to neutral. For this pair to enter uptrend mode again, a break above the key barrier of 1.2800 may be needed.
Crypto Market Losing Ground But Slowly
Market picture
The positive correlation between cryptocurrencies and the stock market is temporarily back on track. The crypto market capitalisation approached 1.05 trillion (+0.9% in 24 hours). On Monday evening, the crypto market recouped its losses following the US stock indices, but since Tuesday morning, there has been renewed selling strength. This time amid pressure on Chinese stocks.
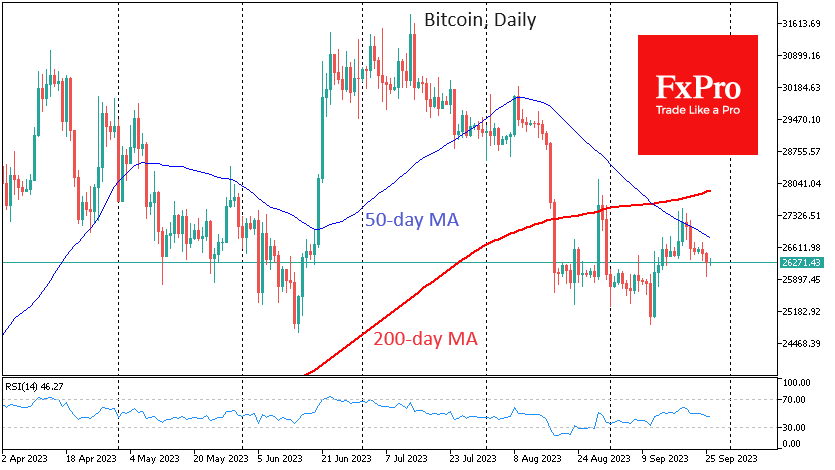
Bitcoin closed lower on Monday, remaining in the clutches of the bears after touching the 50-day moving average a week ago. With markets still under pressure, the focus remains on the first cryptocurrency’s momentum in the $25.0K-$25.6K area. Without confident buying in this area, be prepared for a failure towards $20K on weak hand capitulation.
XRP is giving up ground after a failed attempt to get back above the 200-day moving average. Although it is pointing up, it acts as solid resistance in September. The pressure in the equity markets is not helping.
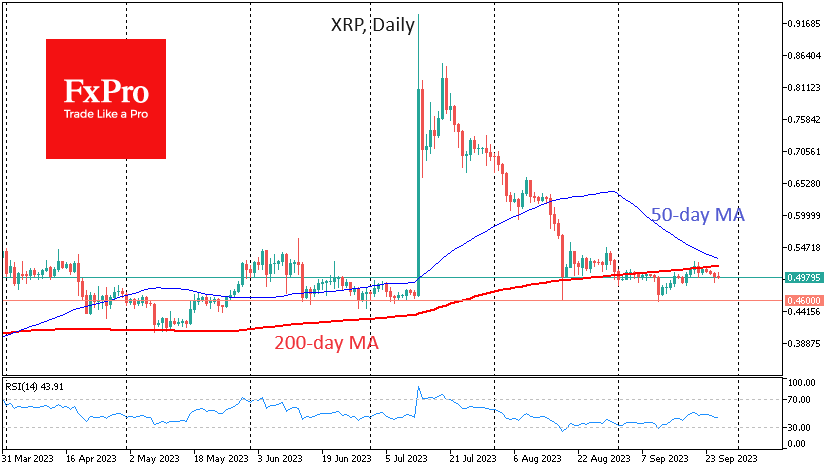
It forms a death cross (the 50-day will cross below the 200-day) after Ethereum and BTC. From the current level of 0.4980, 0.46 is a critical support level, where several supports and the 50-week moving average are concentrated.
News background
MicroStrategy has acquired an additional 5,445 BTC, according to founder Michael Saylor. MicroStrategy now owns 158,245 BTC worth approximately $4.68 billion (at an average price of $29,582).
According to CoinShares, investments in crypto funds fell by $9 million last week; outflows have continued for 9 of the previous 10 weeks. Bitcoin investments fell by $6 million, and Ethereum investments decreased by $2 million.
Weekly trading volumes totalled $820 million, well below the annual average of $1.3 billion. XRP and Solana saw small inflows, CoinShares noted.
According to Arkham, Coinbase holds nearly 1 million Bitcoins or about 5% of its total supply.
XAU/USD: Gold Under Pressure from Strong Dollar, Attack at $1900 Likely after Consolidation
Gold price fell to ten-day low on Tuesday, under increased pressure from rising dollar which is trading at the highest in ten months.
Fed’s narrative about one more rate hike towards the end of the year and signals that the central bank is likely to keep high rates for some time, until inflation returns to 2% target, keeps the greenback inflated and reducing demand for non-yielding yellow metal.
Traders focus on Friday’s released of US key consumer inflation report (PCE), Fed’s preferred inflation gauge, with stronger than expected data to add to downside pressure on gold.
Technical picture on daily chart is still unclear as MA’s are in full bearish setup but 14-d momentum is touching the line dividing positive and negative territory and stochastic is oversold.
Fresh bears faced headwinds at $1910 support (Fibo 61.8% of $1884/$1952 upleg), which guards pivotal support at $1900 (Fibo 76.4% Sep 14 spike low / psychological).
Immediate bears are expected to remain intact while the action holds below broken Fibo 50% level ($1918), though larger bias should stay negative while the base of daily Ichimoku cloud ($1922) caps.
Res: 1918; 1922; 1929; 1936.
Sup: 1910; 1904; 1900; 1889.
GBPUSD Marks Its Worst Month of 2023
- GBPUSD set to close the month with heavy losses
- Short-term risk bearish but oversold conditions evident
- Support could emerge within the 1.2100 area
GBPUSD has been in the red almost every single week since peaking at a 15-month high of 1.3141 in mid-July, with selling forces intensifying significantly in September.
The pair is 4.0% down this month, suffering its worst month so far this year. It is currently trading near a six-month low of 1.2173, increasing speculation that the bearish cycle may end soon. Still, the RSI and the Stochastic oscillator are not showing any improvement, even though they have reached an oversold region. This means that sellers may continue to be active for some time before backing off.
The 1.2100 level is currently in sight. If the price slides below that floor, it may seek protection near the 1.2000 number. Running lower, it could take a breather near the 1.1900 area before meeting the 2023 low of 1.1800.
Otherwise, an immediate upside correction could shift the spotlight to the 1.2300-1.2380 trendline zone, where the 61.8% Fibonacci retracement level of the previous uptrend is also positioned. Slightly higher, the pair could battle a tougher obstacle within the 1.2430-1.2500 territory. The 20- and 200-day simple moving averages (SMAs), the 50% Fibonacci mark, as well as the resistance trendline from mid-July are adding credence to this region. Hence, a successful penetration higher is expected to activate fresh buying towards the 38.2% Fibonacci of 1.2625 and the 50-day SMA.
All in all, the short-term bias for GBPUSD remains skewed to the downside, though the non-stop collapse could spark an upside reversal as key support levels come in sight.
EURJPY Extends Sideways Pattern Just Below 15-year High
- EURJPY stuck in a tight range during September
- Hovers a tad below 15-year peaks supported by 50-day SMA
- Momentum indicators are tilted slightly to the bullish side
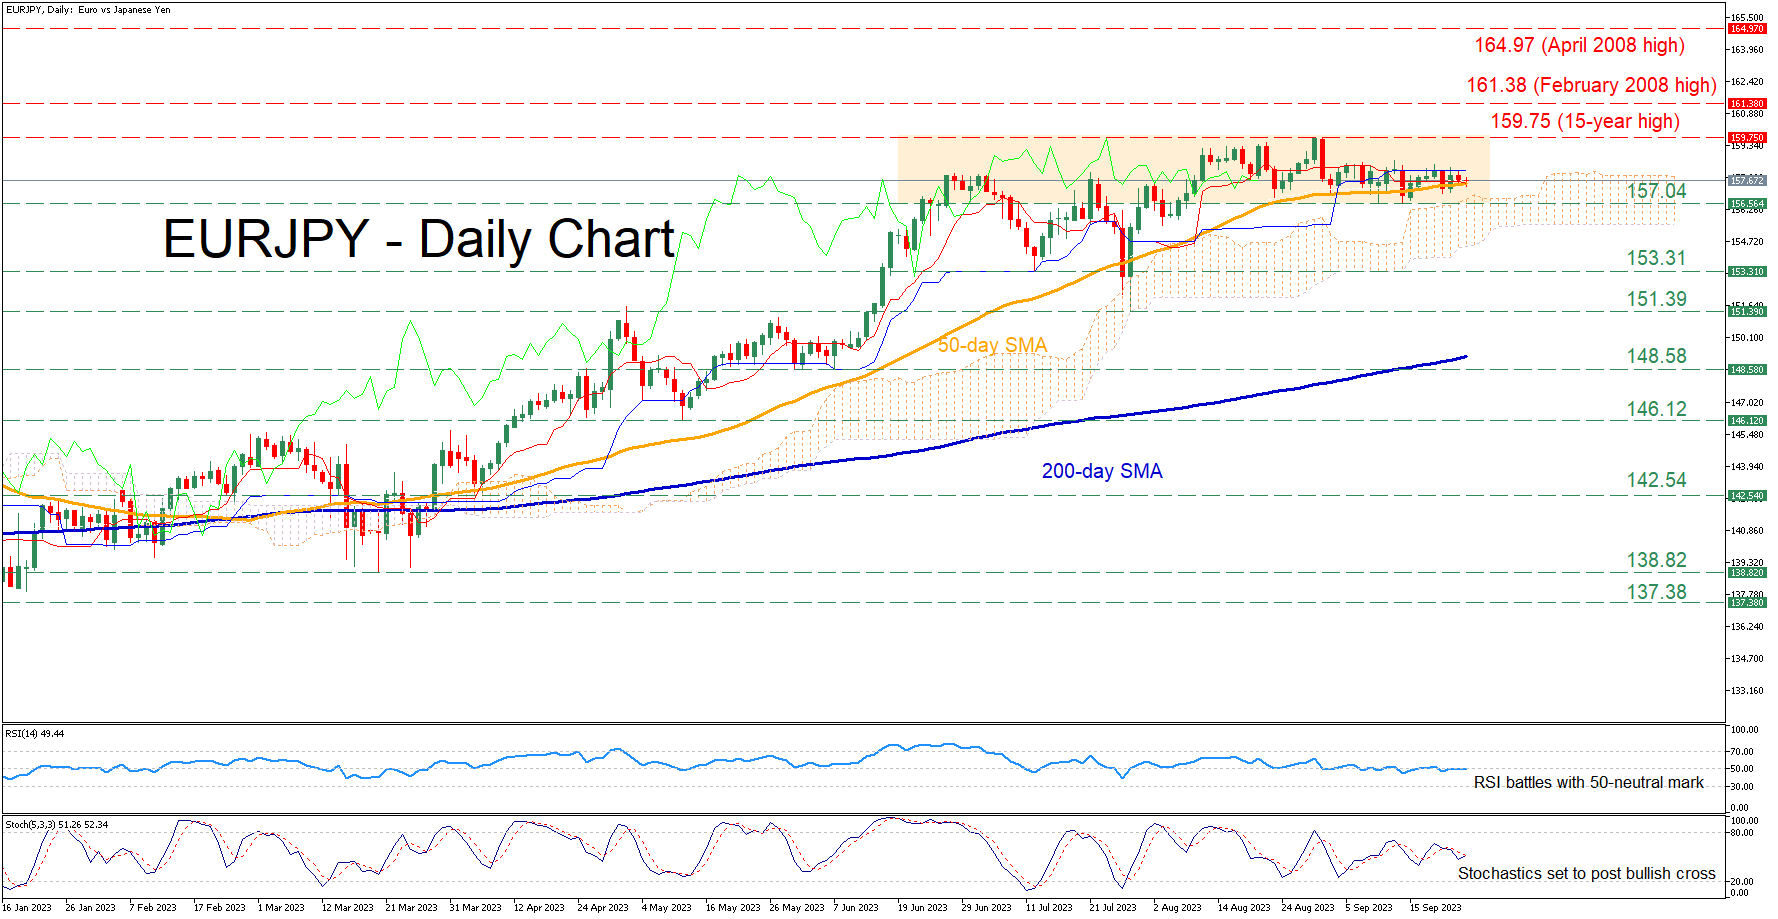
EURJPY has been in a prolonged uptrend since the beginning of the year, posting a fresh 15-year peak of 159.75 on August 31. Since then, the price has been trading without a clear direction around the 158.00 handle, while the short-term oscillators are reflecting a neutral-to-positive near-term bias.
If buying interest intensifies, the bulls might attempt to re-test the recent 15-year high of 159.75. Jumping above that zone, the pair could storm to fresh multi-year highs, where the February 2008 peak of 161.38 may curb further advances. Failing to halt there, the price could then ascend to challenge the April 2008 high of 164.97.
On the flipside, should the pair violate the 50-day simple moving average (SMA), immediate support could be found at 157.04, which held strong twice in September. A break below that zone could trigger a retreat towards 153.31. Even lower, the July bottom of 151.39 may prove to be a tough hurdle for the bears to overcome.
In brief, EURJPY has been trading in a range during the past month, appearing to be lacking directional impetus. Will the period of low volatility be followed by a spike?
GBP/JPY Daily Outlook
Daily Pivots: (S1) 181.49; (P) 181.73; (R1) 182.04; More...
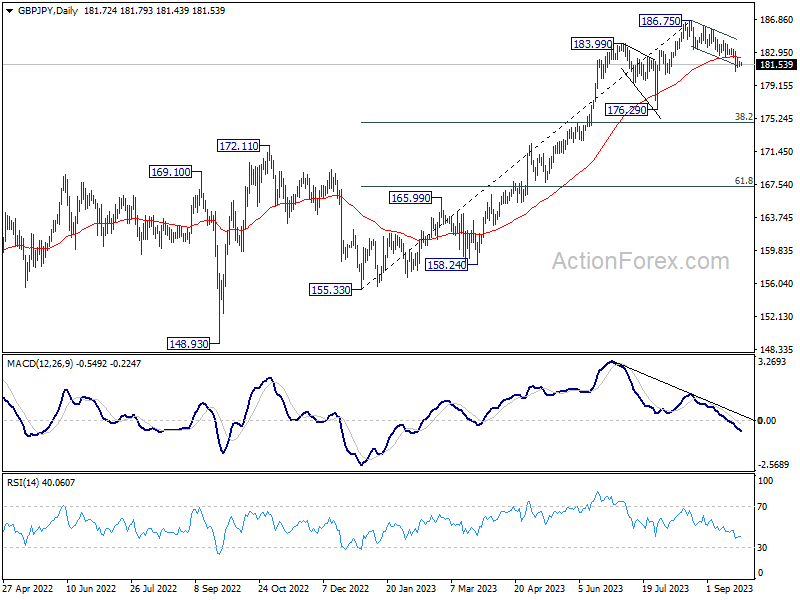
GBP/JPY is staying in consolidation above 180.78 temporary low and intraday bias remains neutral. With 183.34 resistance intact, further decline is expected. On the downside, break of 180.78 will resume the fall from 186.75 to 176.29 support next.
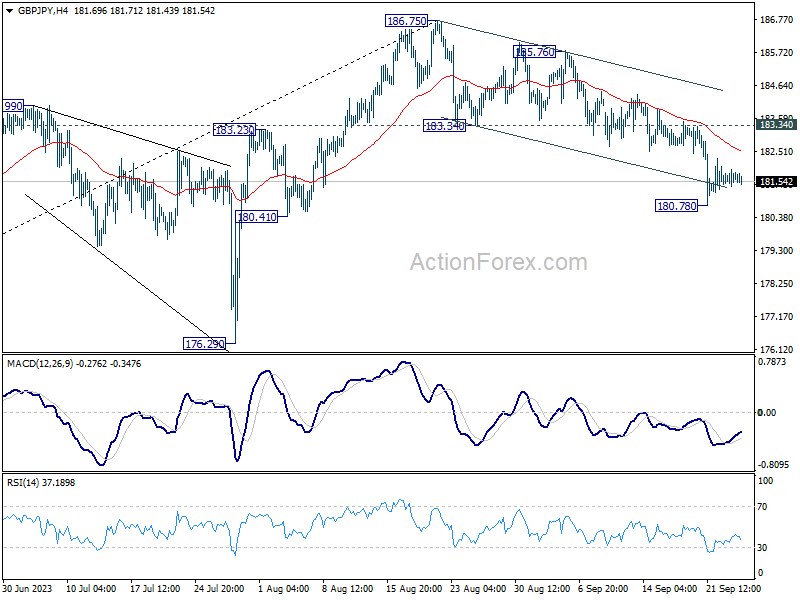
In the bigger picture, fall from 186.75 is currently seen as a corrective move only. As long as 176.29 support holds, larger up trend from 123.94 (202 low) should still be in progress. Break of 186.75 will target 195.86 (2015 high). Nevertheless, firm break of 176.29 will confirm medium term topping, and bring lengthier and deeper consolidations.
EUR/JPY Daily Outlook
Daily Pivots: (S1) 157.41; (P) 157.79; (R1) 158.10; More....
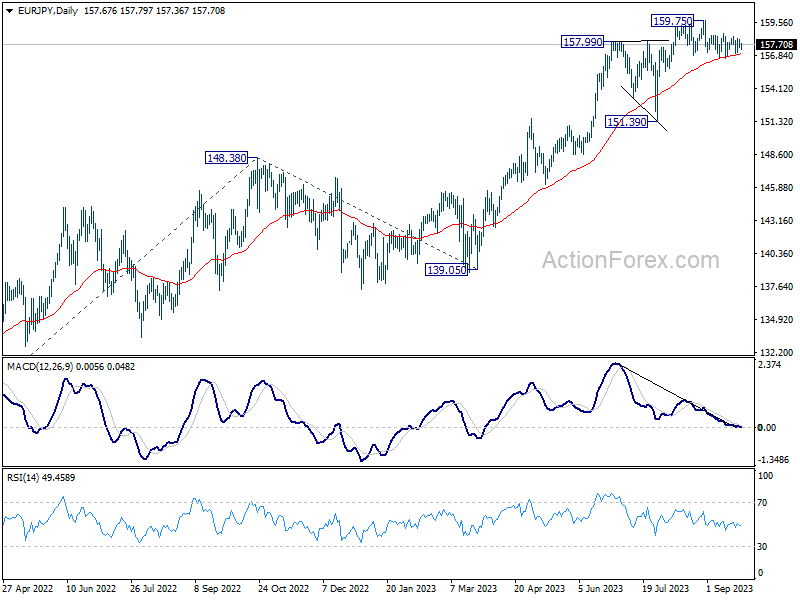
No change in EUR/JPY's outlook as sideway trading continues. Intraday bias remains neutral for the moment. Risk stays on the downside with 158.64 resistance intact. On the downside, break of 156.57 support, and sustained trading below 55 D EMA (now at 156.95) will argue that fall from 159.75 is a larger scale correction. Deeper decline would be seen back towards 151.39 support. Nevertheless, above 158.64 would bring retest of 159.75 high instead.
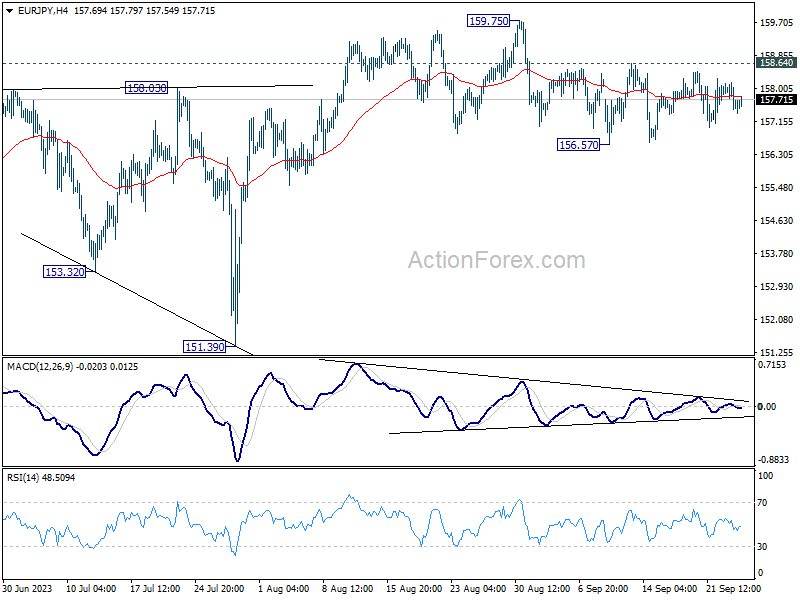
In the bigger picture, as long as 151.39 support holds, rise from 114.42 is still expected to continue. Next target is 100% projection of 124.37 to 148.38 from 139.05 at 163.06. Sustained break there will pave the way to retest long term resistance at 169.96.
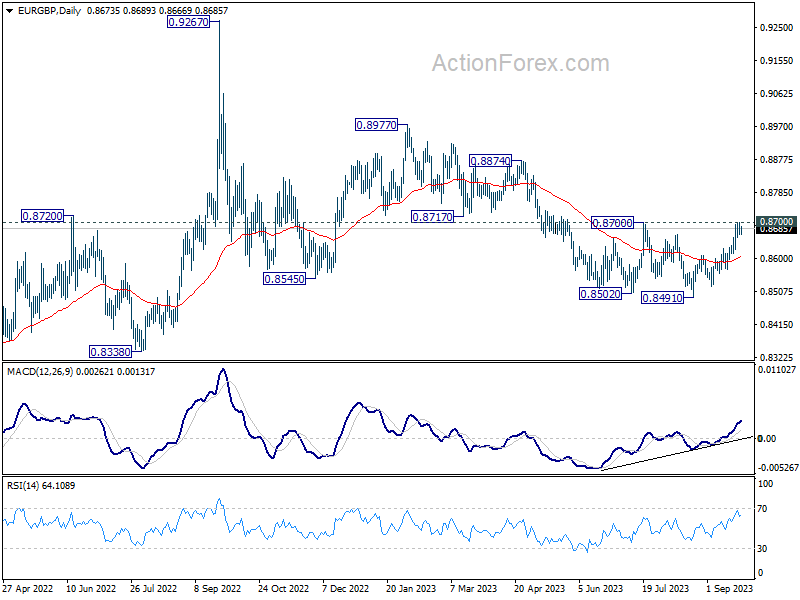
EUR/GBP Daily Outlook
Daily Pivots: (S1) 0.8662; (P) 0.8682; (R1) 0.8695; More....
Intraday bias in EUR/GBP is turned neutral first with current retreat. Focus stays on 0.8700 resistance. Decisive break there carry larger bullish implication and bring stronger rally to 0.8874 resistance next. Nevertheless, rejection by this resistance will maintain bearish outlook that larger down trend is not over. Break of 0.8629 resistance turned support will turn bias back to the downside for 0.8568 support first.
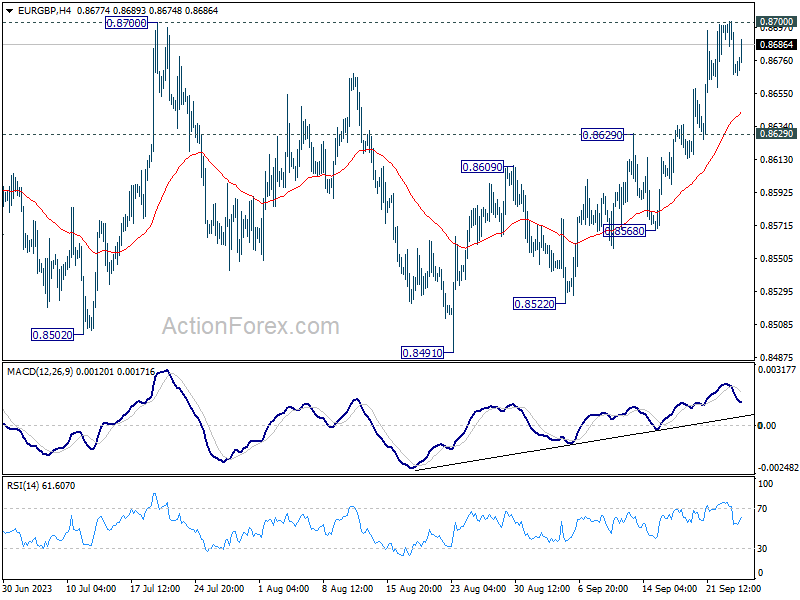
In the bigger picture, the down trend from 0.9267 (2022 high) is seen as part of the long term range pattern from 0.9499 (2020 high). Decisive break there will argue that this decline has completed with three waves down to 0.8491. Rise from 0.8491 could then be another leg inside the pattern that targets 0.8977 and above. However, rejection by 0.8700 will keep the down trend alive for another fall through 0.8491 at a later stage.