Sample Category Title
GBP/USD – Pause for Recovery Needed After Five-Day Sell-Off
GBP/USD is attempting to recover on Tuesday following earlier declines, bouncing from 1.3198 after five consecutive sessions of selling. Sterling remains under pressure as investors assess the impact of the Iran conflict on the British economy.
Despite this, since the beginning of March, the pound has remained one of the most stable currencies against the dollar.
However, sterling remains vulnerable. Britain's high reliance on gas imports, persistently high inflation, and pressure on public finances are heightening risks. The yield on 10-year government bonds is holding around 4.98%, near highs not seen since 2008, following recent increases.
Additional attention is focused on the debt market: after the government bond sale, some pension funds were required to increase collateral to hedge positions, although the scale remains far from the 2022 crisis levels.
Macroeconomic data also point to a slowing economy. Business activity is growing at its slowest pace in six months, producer costs are accelerating, and retail sales are declining.
The Bank of England is likely to remain cautious about changing rates – this remains the prevailing expectation.
Technical Analysis
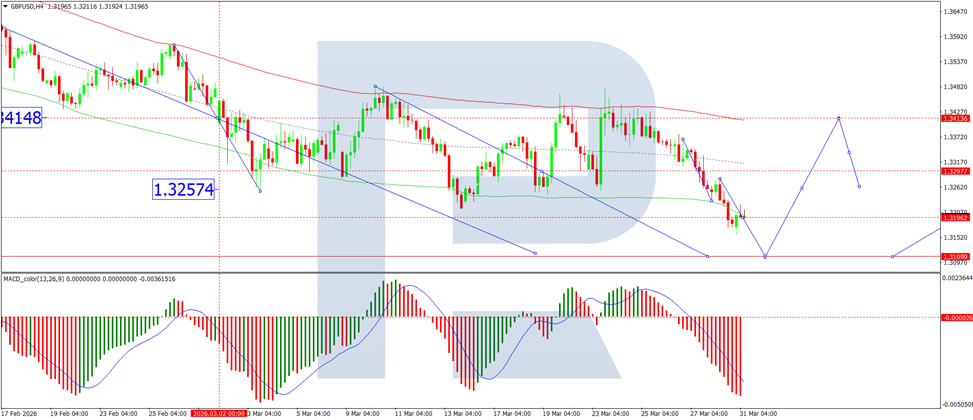
On the H4 GBP/USD chart, the market is forming a broad consolidation range around 1.3297, currently extending up to 1.3434. A decline to 1.3156 is likely in the near term, followed by the formation of a new consolidation range. An upside breakout would open the way for a continuation move to 1.3300, while a downside breakout would suggest further movement to 1.3100. Technically, this scenario is confirmed by the MACD indicator, whose signal line is below zero and pointing downwards.
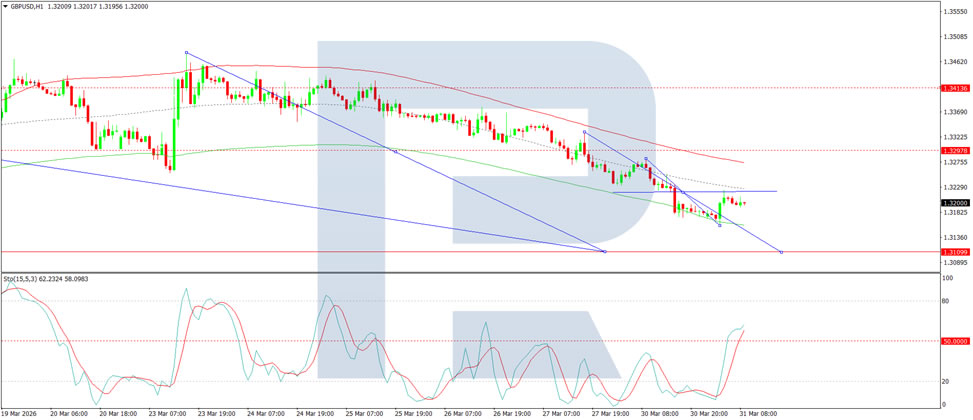
On the H1 chart, the market has formed a compact consolidation range around 1.3322. A downside breakout has initiated a wave structure extending to 1.3100. Should this level be breached, further downside potential towards 1.3050 would emerge. Conversely, an upside breakout from the range could trigger a rebound towards 1.3300. Technically, this scenario is confirmed by the Stochastic oscillator, with its signal line below 50 and pointing downwards.
Conclusion
GBP/USD is attempting to stabilise after five consecutive days of selling, though the broader outlook remains fragile. While sterling has shown relative resilience compared to other currencies since March, mounting headwinds – including the UK's energy import dependence, stubborn inflation, debt market pressures, and slowing economic activity – continue to weigh on the pound. The Bank of England's cautious stance offers little immediate support, and technical indicators point to further downside potential. A recovery pause may materialise, but sustained upside appears unlikely without a tangible shift in either geopolitical tensions or domestic economic data.
Silver Price Gains “Oxygen” from Yield Pullback; Break Above 74.52 to Confirm Momentum
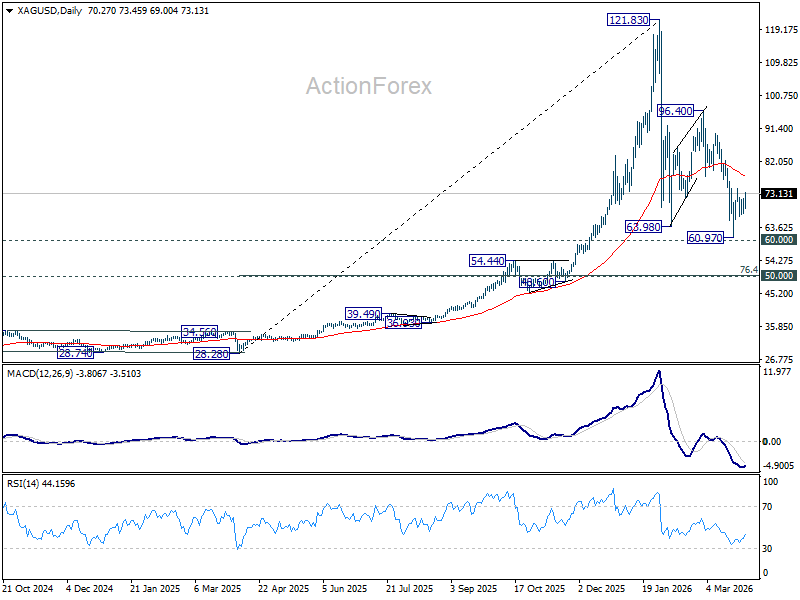
Silver price strengthened notably as a sharp pullback in US Treasury yields provided fresh support for precious metals, with markets reassessing Federal Reserve policy outlook following yesterday's comments from Chair Jerome Powell. The decline in yields, alongside softer rate expectations, has eased pressure on non-yielding assets, giving Silver the “oxygen” to rebound and push toward key resistance at 74.52.
The move in yields has been decisive. US 10-year yield spiked to as high as 4.484 last Friday, but faced strong rejection at the 4.500 psychological level before falling back below 4.35 yesterday. This shift reflects a reassessment of the Fed’s reaction function, particularly after Powell maintained “strategic ambiguity” while signaling that policymakers may “look through” supply-driven inflation shocks such as the recent surge in oil prices.
By effectively decoupling energy-driven inflation from immediate rate hike expectations, Powell’s comments lowered the perceived “hawkish floor” for policy. This reinforced the view that the Fed would prefer to avoid further tightening if conditions allow. The result has been a supportive backdrop for Silver’s recovery from recent lows.
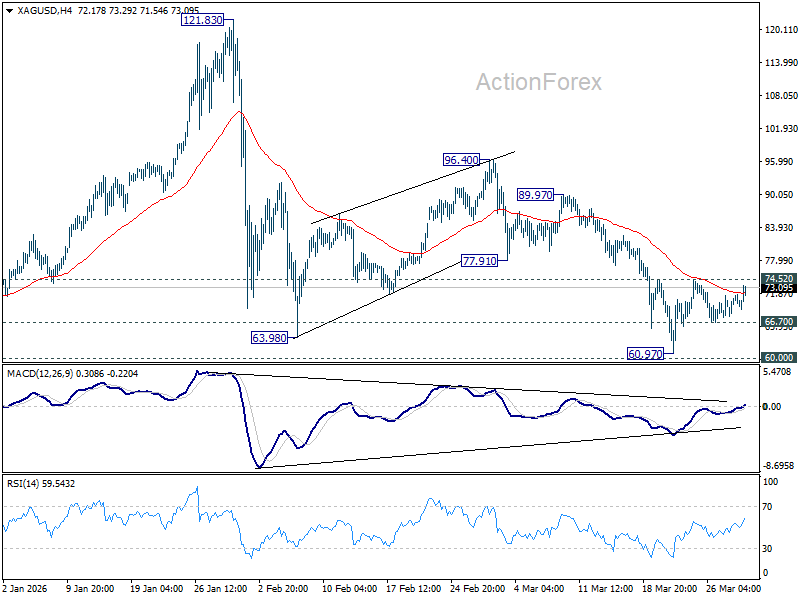
Technically, further rise is in favor in Silver as long as 66.70 support holds. Firm break of 74.52 will add to the case that whole corrective fall from 121.83 has completed with three waves down to 60.97, after drawing support from 60 psychological level. That would pave the way to 55 D EMA (now at 78.33) to confirm this bullish case.
However, the bullish case remains conditional. Sustained gains in Silver are likely to depend on a continued pullback in yields or a clearer de-escalation in the Iran War risks. Without these drivers, the rebound may struggle to extend beyond resistance, leaving the current move vulnerable to renewed volatility.
Eurozone CPI Jumps to 2.5% as Energy Drives Rebound, Core Inflation Eases Slightly
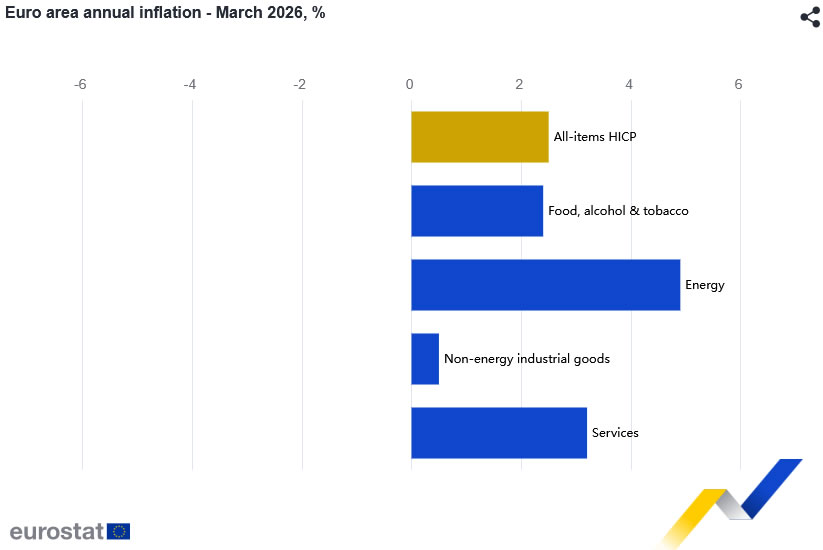
Eurozone inflation accelerated sharply in March, with headline CPI rising from 1.9% yoy to 2.5% yoy, matching expectations and marking the highest level since January 2025. The jump was driven primarily by a reversal in energy prices, which surged from -3.1% yoy to 4.9% yoy, reflecting the impact of rising oil costs linked to ongoing Iran War.
However, underlying inflation showed signs of moderation. Core CPI, which excludes energy, food, alcohol, and tobacco, edged down from 2.4% yoy to 2.3% yoy, below expectation of 2.4% yoy. This suggests that while headline inflation is being pushed higher by external factors, broader price pressures within the economy are not accelerating at the same pace.
Across components, services inflation eased slightly from 3.4% yoy to 3.2% yoy. Food, alcohol and tobacco slowed from 2.5% yoy to 2.4% yoy. Non-energy industrial goods declined from 0.7% yoy to 0.5% yoy.
Preview of RBNZ: 25 March Speech Redux
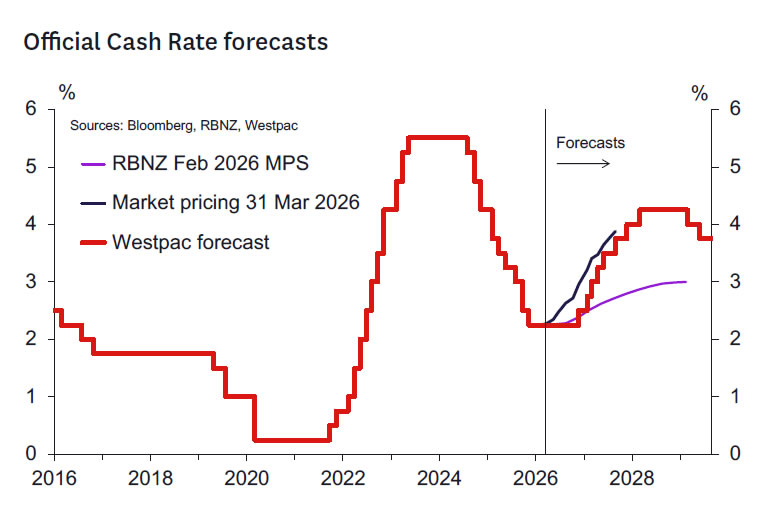
- Consistent with guidance given by Governor Breman in a recent speech, we expect the RBNZ to hold the OCR at 2.25% at the 8 April review.
- Barring major developments over coming days in the Middle East, the associated commentary – which will include a post-meeting press conference – will likely closely mirror Governor Breman’s recent speech.
- We expect the Bank to emphasise that it will not react to the first-round impact of higher energy prices on near-term inflation but that it will respond should there be evidence of second‑round effects that might create persistent inflation.
- While the post-meeting statement will present the consensus view of the MPC, the Record of Meeting will likely reflect a diversity of views about the likelihood of second-round persistent inflation and thus the appropriate policy stance.
- The Bank is not scheduled to present revised economic projections at this meeting. However, it is possible that the RBNZ will provide some guidance of the likely magnitude of the upward revision to near-term inflation and downward revision to GDP growth that might be considered in May.
- We think the Bank will aim to balance a desire to avoid a further tightening of financial conditions with the desire to not sound complacent about the medium-term inflation risks that come with an energy price shock.
The RBNZ will announce the outcome of the next Monetary Policy Review (MPR) at 2pm NZT on 8 April. In addition to the usual release of a post-meeting statement and the Record of Meeting, this meeting is notable as it will feature the first post-meeting press conference at a MPR meeting – a welcome innovation introduced as part of Governor Breman’s drive for greater transparency.
In the absence over coming days of major developments in the Middle East, we think that the Bank’s communication at this meeting is likely to closely mirror the speech given by Breman on 25 March – a speech that had received input from the Bank’s Monetary Policy Committee (MPC), albeit it not necessarily representing every member’s view. And so, with the Bank already indicating that it will not respond in a knee-jerk manner to a near-term oil-driven lift in inflation, the OCR is almost certain to be held at 2.25% next week, as would have been the case in the absence of the oil shock.
The RBNZ’s guidance about what to expect at future meetings will also likely echo the Governor speech. In crafting this guidance, the MPC will aim to reassure markets that it will not overreact to the shock, which could cause markets to further tighten financial conditions. At the same time, the RBNZ will need to ensure it sounds credible to households and businesses about its willingness to tighten policy if inflation expectations and pricing behaviour evolve in a manner inconsistent with achieving the inflation target over the medium-term. While monetary policy should look through a temporary spike in energy prices, the MPC will need to be vigilant – and be seen to be vigilant – against the risk that inflation becomes persistent.
The magnitude of that risk will depend in part on the duration of the conflict, with a more protracted conflict likely to lead to greater damage to energy infrastructure and enduring damage to supply chains, prolonging the inflation shock. It will also depend on the state of the domestic economy. As the Governor noted in her speech, while the recovery may be broadening, it is still early – as demonstrated by the disappointing Q4 GDP outcome – and the economy is operating well below capacity. In this context, many businesses may struggle to fully pass on cost increases without losing demand – a dynamic that should delay or limit second‑round inflation effects stemming from the rise in oil prices.
While the post-meeting statement and the Governor’s press conference will largely represent the consensus view of the Committee, the Record of Meeting will likely reveal a diversity of views. Key areas where the views of the Committee could diverge include the likely duration of the conflict, the impact on the economy, the likelihood of second-round effects driving persistent inflation over the medium-term, and the appropriate course for monetary policy over time. Such discussions might provide some insight into how the consensus view of the MPC might evolve as more is learnt about the evolution of the conflict and its economic impact.
The RBNZ is unlikely to provide a full update of its economic projections next week – that will likely come as usual when it releases the next Monetary Policy Statement (MPS) in May. That update will include reaction to pre-conflict data, such as the slightly disappointing Q4 GDP report. It will also allow reflect reaction to the first reports showing how the global and domestic economies have responded to the oil shock (so far there has been some evidence of softer PMI readings offshore, together with a marked drop in consumer confidence in New Zealand). Developments in financial conditions, including the exchange rate, will also factor into those revisions.
But we don’t rule out the possibility that next week the RBNZ could provide some preliminary quantification of how the conflict has impacted the near-term outlook for inflation and GDP growth that was presented in the February MPS (such as where inflation may peak and how much growth might be impacted this year). Such estimates could be refined in May based on developments in the Middle East and with the benefit of early economic data and further anecdotes quantifying the impact on New Zealand consumer and business behaviour. In our own recent forecast update, we upgraded our outlook for CPI inflation (now expected to peak at 4.1%y/y this year) and downgraded our forecasts for economic growth (now expected to be 1.9%y/y this year, down from a pre-war forecast of 3.3%y/y).
In its communications on 8 April, the RBNZ will balance a desire to avoid a further tightening of financial conditions with the desire to not sound complacent about the medium-term inflation risks that come with an energy price shock. Reinforcement of the approach communicated in Breman’s speech guidance should continue to lean against the market’s current pricing of more than three 25bp OCR hikes by the end of this year, especially once current liquidity issues in the domestic market ease. As we discussed in our own forecast update, we continue to forecast just one 25bp hike this year, but also that significant tightening will occur in 2027 once the activity implications of the energy shock begin to dissipate.
Kelly’s take.
No change is very appropriate for now. This supply shock is extremely unwelcome and will likely significantly boost headline inflation for a while. But at least for now the large, accumulated level of excess capacity likely means the risk of entrenched inflation remains modest.
The MPC has time to assess how the outlook will evolve. We don’t know how far and for how long inflation will remain elevated. Forecasts are necessarily uncertain if only because the duration of the war and restriction of oil supplies remain uncertain.
We can’t assume inflation will automatically revert to more normal levels, but we also can’t assume it won’t. We should be alert to the possibility of financial stability issues globally that could see financial conditions tighten. That’s another reason for not putting maximum weight on forecasts that suggest risks of inflation remaining elevated for a long time. The market might do some of the job for us. And there might be bigger fish to fry.
If inflation rises for a protracted period, then it won’t be appropriate to have interest rates in the 2’s or even the low 3’s as real interest rates will be too low. But there’s time to assess and plenty of scope to move quickly once it’s determined that real interest rates closer to more neutral settings are appropriate. I’d want to see a lot more data before coming to that judgement.
Australia: Middle East Crisis Update – A Materially Bigger and More Persistent Shock
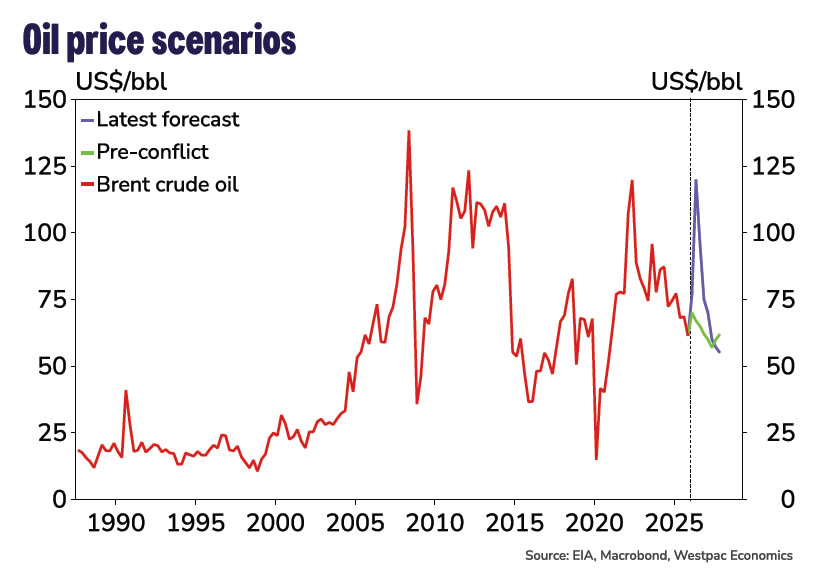
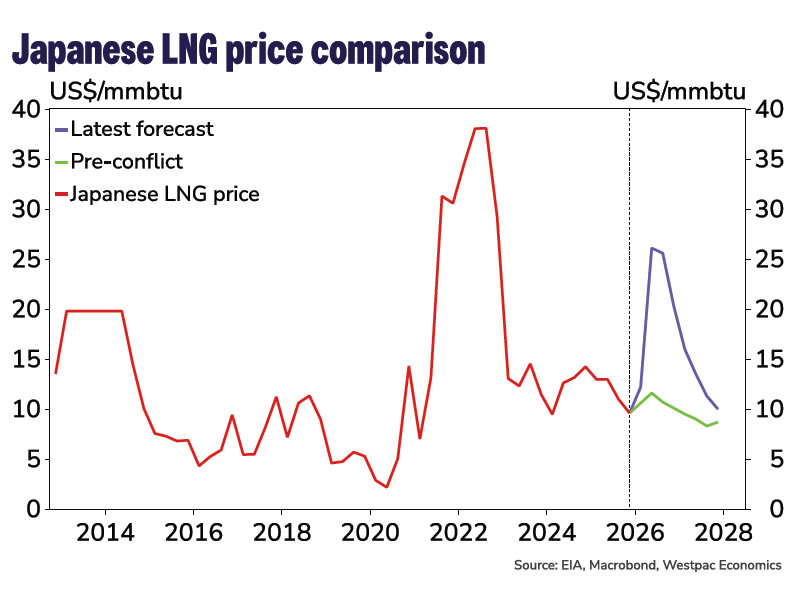
- Longer Middle East disruption lifts peak prices for oil and gas, lengthens recovery. Infrastructure damage exacerbates the shock. Brent oil now expected to peak at an average $120/bbl in Q2 and Japanese LNG prices at $26mmbtu.
- Australian CPI inflation now expected to peak at 5.4%yr in June quarter, and even higher on the monthly series, despite the announced cut to fuel excise. Trimmed mean inflation peaks around 4% in 2026 H2. Food prices a particular concern through to 2028, but broader passthrough to non-energy prices also an issue.
- RBA now expected to hike rates three times (May, June, August), revised up from one more (in May) previously. Peak cash rate now 4.85%, above previous peak.
- Supply shock and tight monetary policy drag on demand, especially consumption and other interest-sensitive sectors. GDP growth forecast to trough at 1%yr in 2027; unemployment rate peaks at 5% end-2026.
Energy situation
As previously highlighted, the key risk to our previous central case view (released on March 17) was that the Middle East conflict would prove to be more prolonged than assumed. With the conflict now entering its fifth week, it has become increasingly clear that the US/Israel–Iran confrontation is likely to result in a longer-lasting disruption to energy production in the Middle East and shipping through the Strait of Hormuz. We have therefore revised our baseline assumptions.
Specifically, we now assume the Strait of Hormuz remains effectively closed until the end of April, a total of eight weeks, and takes longer to reopen fully. This compares with our earlier assumption of a one-month disruption followed by a relatively rapid normalisation.
The slower recovery reflects several factors. Recent shipping traffic through the Strait has been limited to countries Iran deems friendly to it. Insurance premiums are expected to remain elevated given the risk of further attacks by regional factions. Shipping companies will also require time to re-establish vessel rotations and contractual delivery arrangements across energy and upstream industrial inputs.
As a result, we now assume traffic through the Strait reaches only around 20% of normal levels in May. Traffic is expected to continue to improve thereafter, although capacity is not expected to return to normal levels until end 2026.
The extension of the conflict and slower normalisation will lead to more ‘shut-ins’ (temporary stops in production due to storage capacity limits) among smaller Gulf producers. Coupled with some oil infrastructure damage, we now project this to see a shortfall in global oil production of around 6mb/d on average in Q2. This assumes Saudi Arabia and the UAE continue to divert exports via operational pipelines to partially bypass the Strait, with an available capacity at around 1.6–5.5 mbpd, alongside the release of IEA emergency stockpiles.
Risks around this path remain clearly skewed to the downside, particularly if there is more damage to port and energy infrastructure and/or shipping via the Red Sea is also impacted now that Yemen’s Houthi rebels have entered the conflict. This would represent a sharp escalation, but it could also see a faster resolution as it would bring more Gulf state countries into the fray against Iran.
Overall, the changes to our baseline assumptions imply a materially bigger and more persistent energy price shock than previously assumed.
Consequently, we now expect Brent crude oil prices to average around US$120/bbl in Q2, compared with US$90 previously. Prices are expected to remain elevated for longer, reflecting both ongoing physical disruptions and a sustained risk premium linked to security and insurance costs. Under our revised base case, oil prices ease only to around US$75/bbl in Q4, still US$13 above our pre conflict baseline, and do not converge back to pre conflict levels of around US$60/bbl until Q2 2027.
The impact on gas markets is even larger than for crude oil. LNG exports from the Middle East, particularly Qatar, have no viable alternative route that bypasses the Strait, leaving supply highly exposed to an extended disruption. Moreover, Qatar’s Ras Laffan LNG plant has suffered extensive damage halting production, with reports that it will potentially take up to five years to fully repair. As a result, Japanese LNG prices have surged above US$20mmbtu in recent weeks and are currently trading US$10 above pre-conflict levels. We forecast further increases as supply tightens to a quarterly average price of around US$26mmbtu over the next few quarters. Prices are projected to remain elevated even after oil markets begin to stabilise.
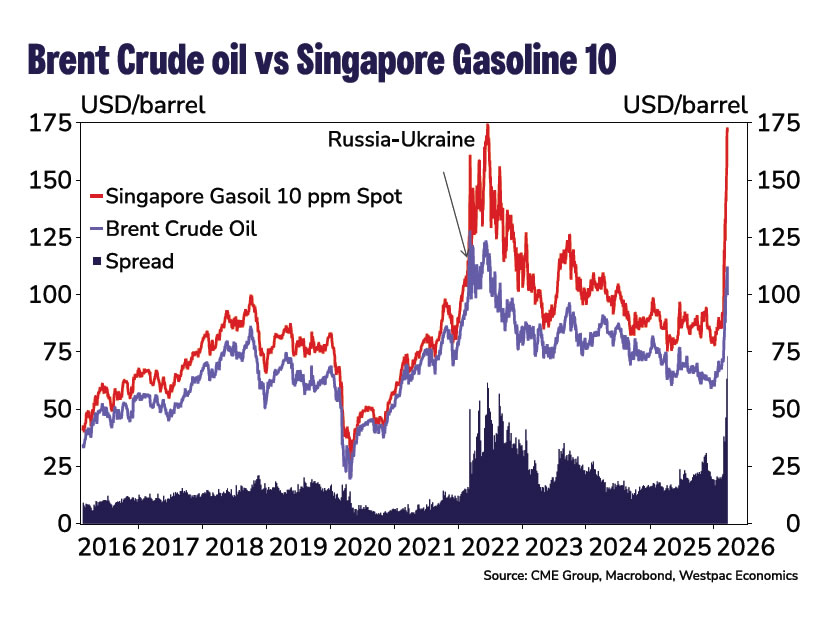
We have also made greater allowance for wider refinery margins than our previous forecasts. Disruptions to crude supply, combined with tight refined product inventories in Asia, have driven a sharp widening in the spread between Brent crude and Singapore Gas10, the key benchmark for Australian petrol and diesel prices. The spread has recently surged to around US$70/bbl, exceeding levels seen following Russia’s invasion of Ukraine. Given the importance of refined product availability and logistics, we expect margins to remain elevated even as the conflict eases, materially amplifying the pass through from higher crude prices to domestic fuel costs.
More acute pressures on supply chains
Given the prolonged closure, we now also assume supply chain pressures are more acute and persistent. Container freight rates have risen by 20% since the start of the conflict, reflecting longer shipping routes, higher fuel costs, insurance surcharges and booking constraints. While freight rates are still lower than the peaks in 2025 and significantly below the extraordinary peaks of 2021–22, Iran is reportedly extracting additional charges from non-hostile vessels negotiating passage through the Strait, further increasing transit costs even where shipping through the Strait is allowed.
The Middle East is also a key upstream supplier of industrial inputs, including fertilisers, chemicals, polymers and metals. Around 33% of global fertiliser trade, particularly urea and ammonia, transits the Strait. Disruptions are already pushing up prices for these inputs, with Egyptian urea prices, a global indicator for fertiliser prices, particularly nitrogen fertilisers, reaching its highest level in more than three years. That said, at around US$475/t, it is still significantly below its record of $1050 following Russia’s invasion of Ukraine.
Globally, manufacturing PMIs show a sharp re-acceleration in input cost growth, with energy, freight and intermediate goods cited as key drivers, alongside some lengthening in supplier delivery times. In Australia, the PMI manufacturing input price measure has risen to its highest level since August 2023.
However, while supply chain pressures are rising and are expected to remain elevated beyond the end of the conflict, they are expected to remain materially below the peak levels experienced in 2021–22. The port congestion, post-COVID reopening surge in demand and broad-based shortages that were features in this episode remain absent. The appreciation of the Australian dollar, both against the US dollar and on a trade weighted basis, will also provide a partial offset to imported cost pressures, reducing the local currency impact of higher global input prices. In contrast, the AUD/USD cross fell by 9% around during the 2022 episode, amplifying the rise in import costs.
Accordingly, while price pressures are rising, particularly for energy-intensive inputs such as fertilisers and aluminium, the impact on producer prices and the flow through to headline and core inflation is expected to be smaller than during the 2022 cost of living crisis.
Inflation impact
Both the Oxford Economics model and our bottom-up forecasts imply that higher energy, freight and upstream input costs are expected to lift headline inflation materially over 2026. The direct impact comes firstly through fuel and transport-related components before it broadens as higher distribution and input costs are passed on to a wider range of consumer prices.
Reacting to this, the Australian Government announced that from April 1, the fuel excise tax will be cut in half, reducing the pump price of petrol and diesel by 26¢/litre. We are now expecting headline CPI to peak at 5.4%yr in Q2 2026, up from 4.1% previously, with monthly inflation likely to be even higher breaking through 6%yr around April or May.
Chart Alert: AUD/USD Downtrend Remains Intact Below 0.6910 Despite Trump’s Iran War Exit Remarks
Key takeaways
- Downtrend intact despite policy support: AUD/USD failed to sustain gains after the hawkish RBA boost, reversing sharply from 0.7123 to a three-month low, with the bearish trend remaining intact below the 0.6910 resistance.
- Now driven by global risk sentiment: Rising stagflation fears and oil-driven macro stress have shifted AUD/USD into a “risk asset,” with stronger correlation to global equities—implying further downside if equity weakness persists.
- Key levels signal further downside risk: A break below 0.6838 may extend losses toward 0.6790–0.6710 (near the 200-day MA), while only a move above 0.6910 would invalidate the bearish outlook and trigger a rebound.
The price actions of the AUD/USD have staged the initial expected push up on 17 March 2025, ex-post RBA monetary policy meeting, where the Australian central bank offered a hawkish guidance of more interest rate hikes down the road in 2026 after it enacted a back-to-back rate hike of 25 basis points to increase the official cash rate to 4.1%.
The AUD/USD staged a rally of around 1% to print an intraday high of 0.7123 on 18 March 2026, which is within our predefined intermediate resistance zone of 0.7120/0.7140 highlighted in our previous analysis before it reversed by -4% to hit a three-month low of 0.6833 on Monday, 30 March 2026.
AUD/USD is now behaving like a “risk asset”
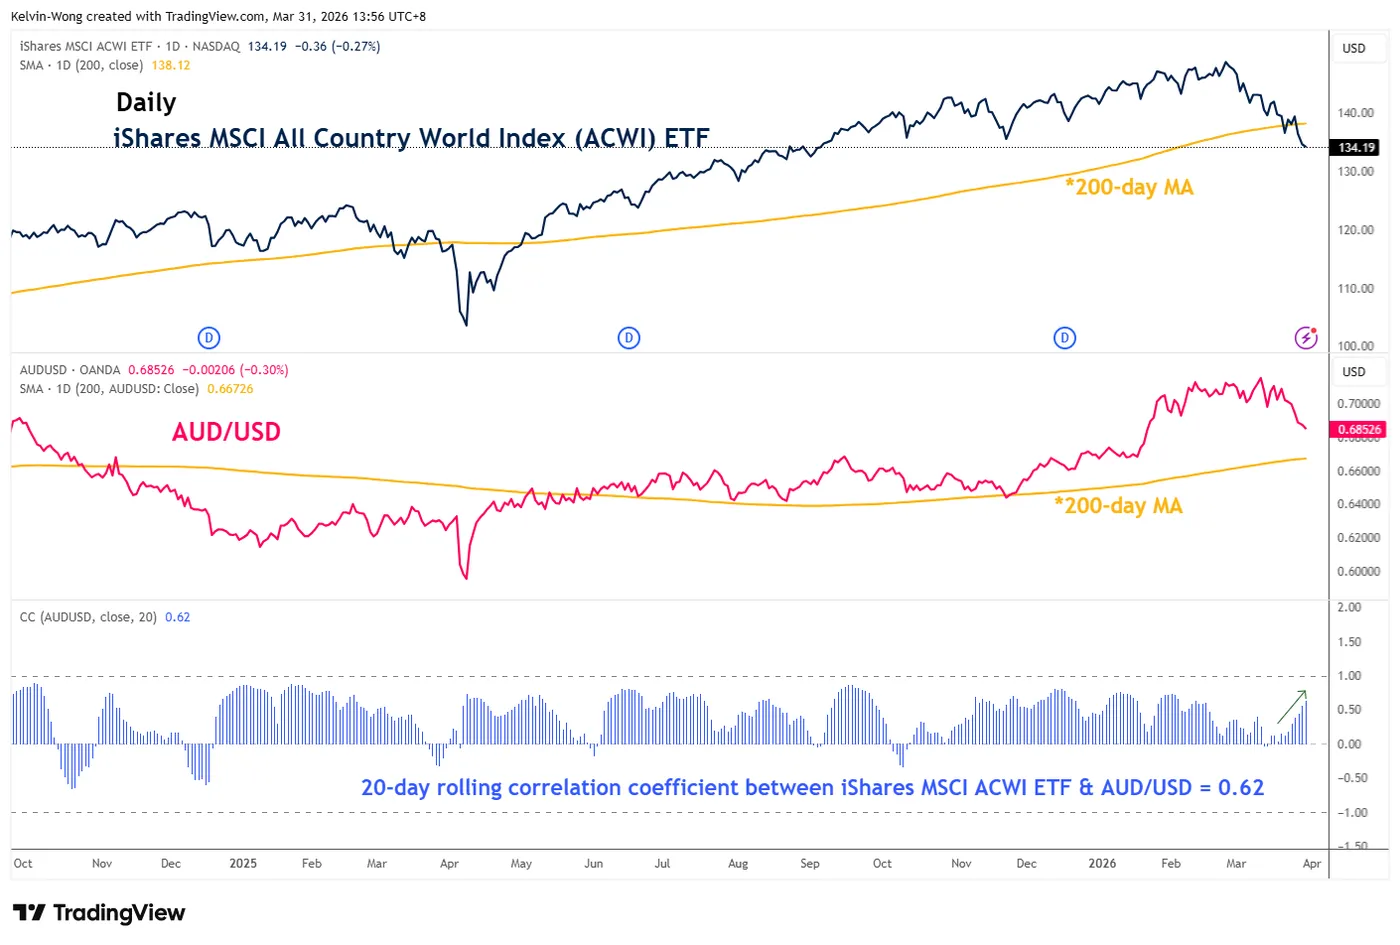
Fig. 1: Movement of iShares MSCI All Country World Index ETF with AUD/USD as of 31 Mar 2026 (Source: TradingView)
In the past two weeks, the stagflation risk narrative has gained traction due to higher oil prices, as global energy flow disruptions persist due to the US-Iran war, which shows no clear signs of de-escalation, damaging several Gulf states’ oil production and refinery assets.
Hence, the Australian dollar is now more sensitive to a significant deterioration in risk appetite triggered by heightened stagflation fear that overshadowed the “commodity currency” element.
Since mid-March 2026, the movement of the AUD/USD has been closely aligned with global equities.
The 20-day rolling correlation coefficient of the iShares MSCI All Country World Index (ACWI) ETF and AUD/USD has increased to 0.62 at this time of writing from 0.12 printed on 16 March 2026 (see Fig. 1).
Given that the ACWI ETF has just broken below its key 200-day moving average last week, which suggests more potential downside in the near to medium-term for global equities, in turn, it may trigger a further negative loop into the AUD/USD.
In today’s early Asian session, the Wall Street Journal has reported that US President Trump is willing to wind down the military campaign against Iran even if the Strait of Hormuz remains largely closed, signalling a potential shift in strategic priorities.
Overnight risk-off sentiment has stalled on this “conflicting” news flow, where the S&P 500 and Nasdaq 100 E-mini futures have erased earlier losses of around -0.5% at the opening hours of today’s Asian session to trade with an intraday of around 0.7% at this time of writing.
However, the AUD/USD remains muted and traded almost unchanged at the 0.6850 level.
Let’s now focus on the short-term trajectory (1 to 3 days) of the AUD/USD from a technical analysis perspective.
AUD/USD – More downside before potential bullish reversal at 200-day moving average
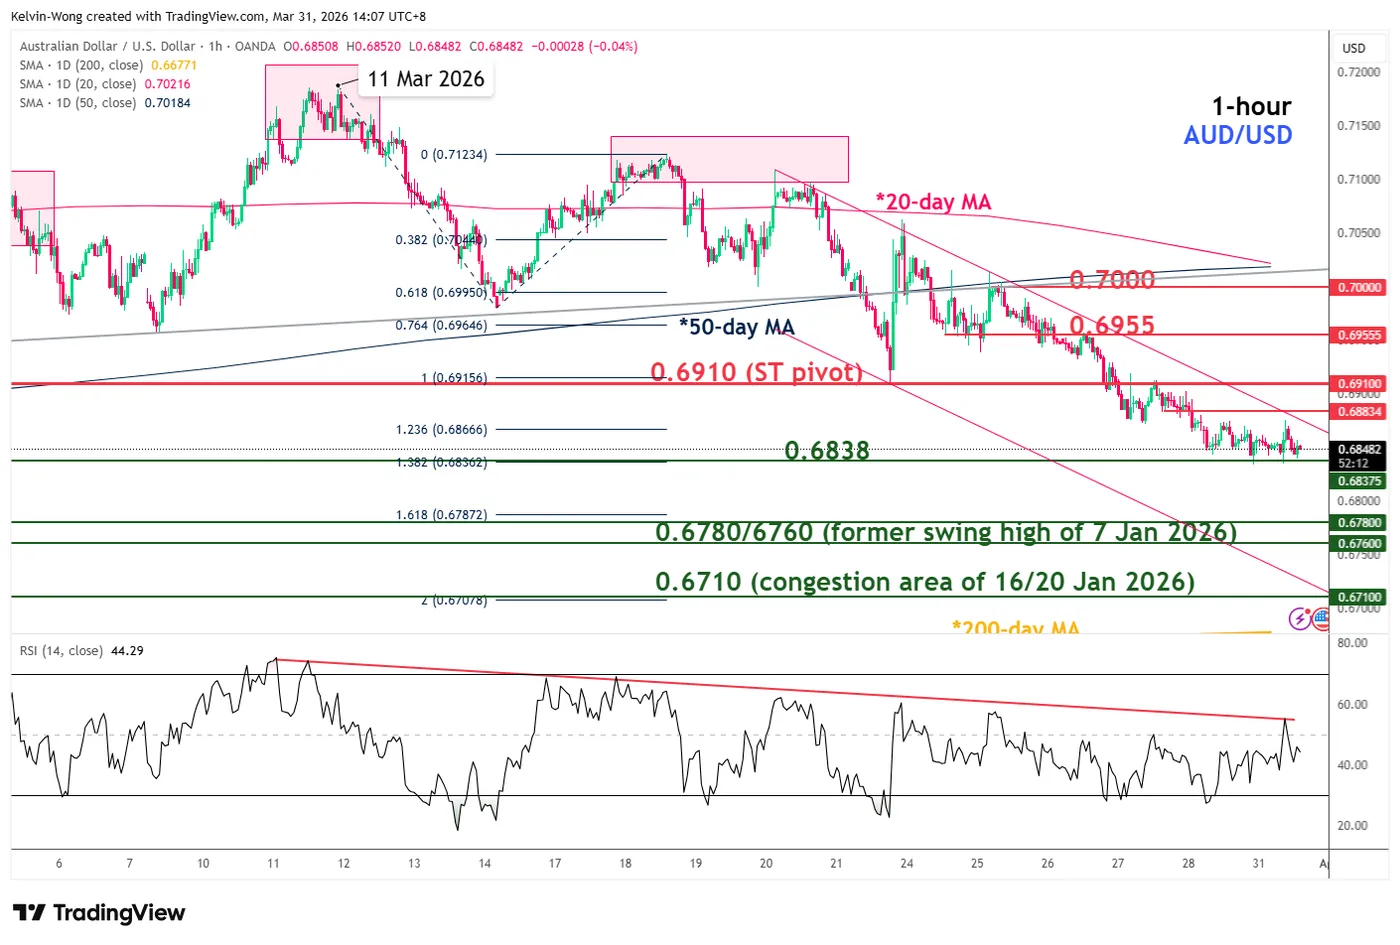
Fig. 2: AUD/USD minor trend as of 31 Mar 2026 (Source: TradingView)
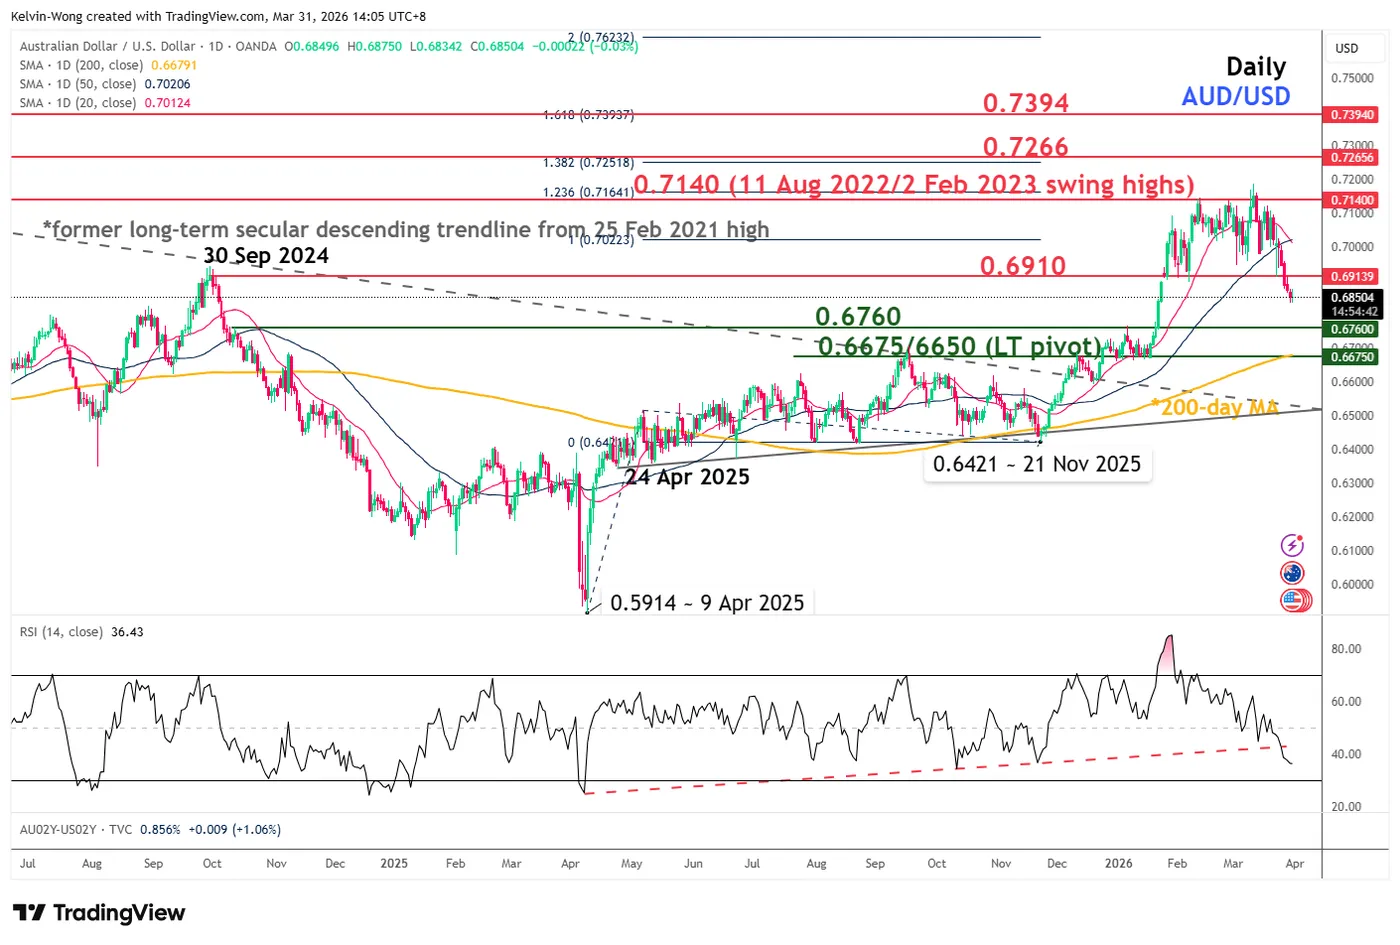
Fig. 3: AUD/USD medium-term & major trends as of 31 Mar 2026 (Source: TradingView)
Watch the 0.6910 short-term pivotal resistance (former medium-term pivotal support) to maintain a bearish bias.
A break below 0.6838 is likely to trigger the continuation of the minor bearish impulsive down move sequence to expose the next intermediate supports at 0.6790/6760 and 0.6710 (close to the key 200-day moving average) before a potential bullish reversal occurs (see Fig. 2).
On the other hand, a clearance above 0.6910 invalidates the bearish scenario for a mean reversion rebound towards the next intermediate resistances at 0.6955 and 0.7000 (close to the intersection of the 20-day and 50-day moving averages).
Key elements to support the short-term bearish bias on AUD/USD
- The price actions of AUD/USD have continued to oscillate within its minor descending channel in place since 20 March 2026, with its lower boundary coming in at around 0.6710 (see Fig. 2).
- The daily RSI momentum indicator of AUD/USD has broken below its key ascending trendline support and has not reached its oversold region (below 30) (see Fig. 3).
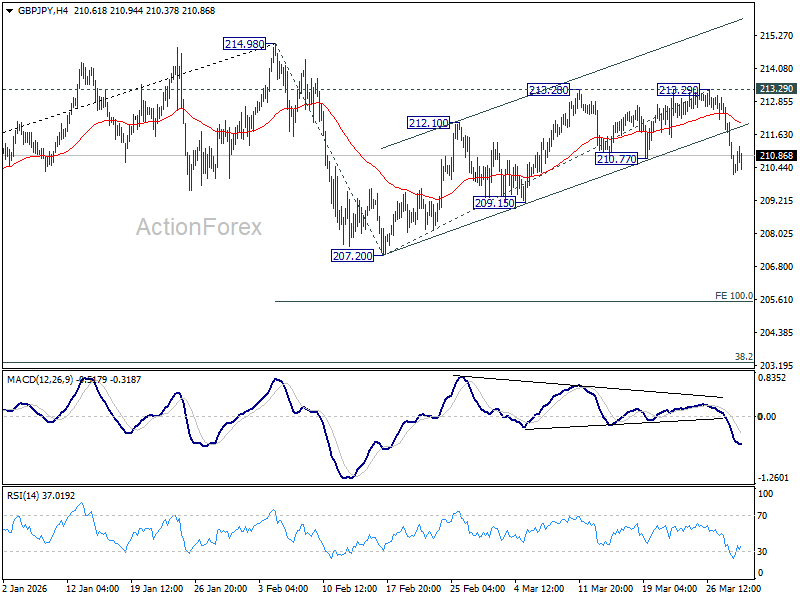
GBP/JPY Daily Outlook
Daily Pivots: (S1) 209.62; (P) 211.16; (R1) 212.13; More...
Intraday bias in GBP/JPY stays on the downside at this point. Corrective pattern from 214.98 should be in the third leg. Deeper decline would be seen to 209.15. Firm break there will target 207.20 and below. For now, risk will stay on the downside as long as 213.29 resistance holds, in case of recovery.
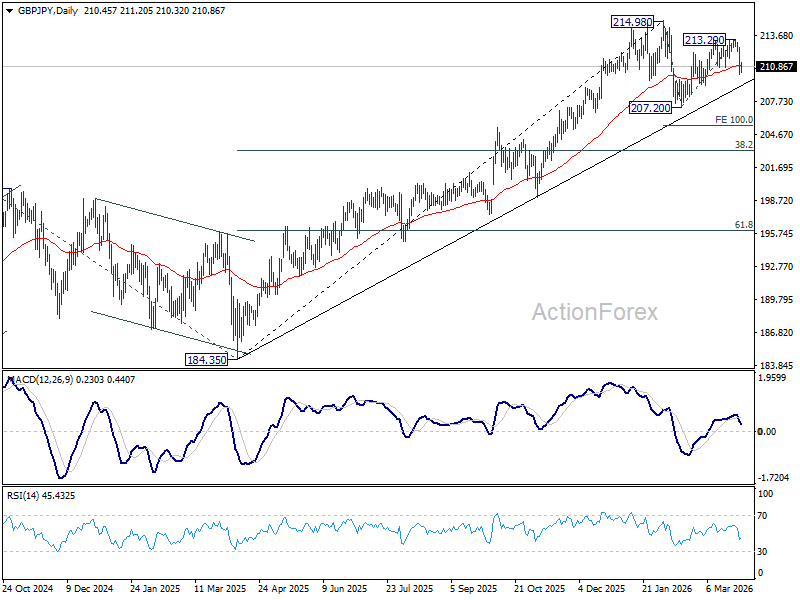
In the bigger picture, up trend from 123.94 (2020 low) is still in progress. Firm break of 214.98 will target 61.8% projection of 148.93 (2022 low) to 208.09 (2024 high) from 184.35 at 220.90. This will remain the favored case as long as 55 W EMA (now at 203.13) holds, even in case of another deep pullback.
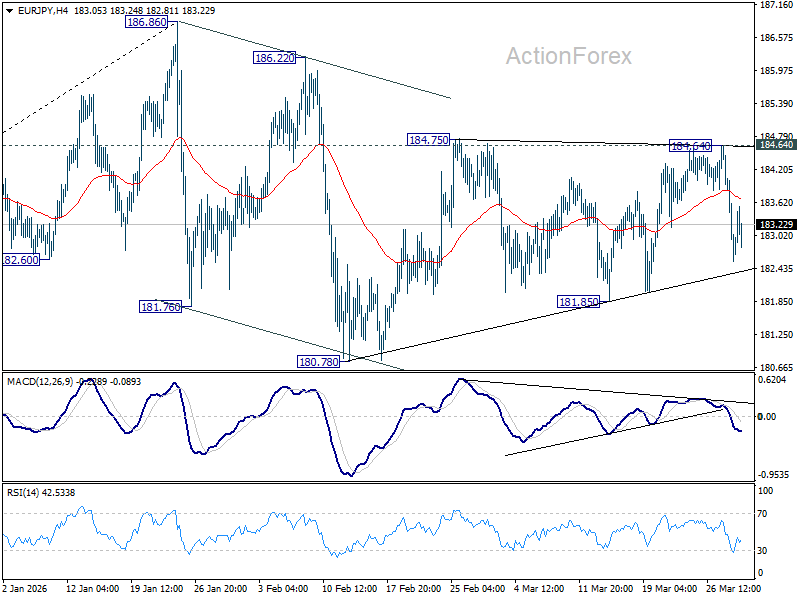
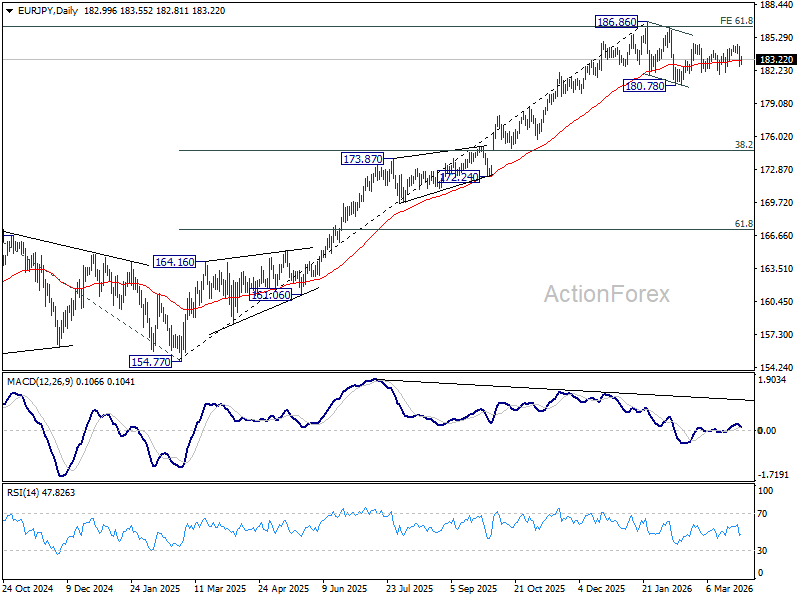
EUR/JPY Daily Outlook
Daily Pivots: (S1) 182.27; (P) 183.39; (R1) 184.20; More...
Risk remains on the downside for EUR/JPY with 185.64 resistance intact. Correction from 186.86 is probably in the third leg already. Break of 181.85 support will target 180.78 and below. Nevertheless, break of 184.64 resistance will invalidate this view, and bring retest of 186.86 high instead.
In the bigger picture, a medium term top could be in place at 186.86 and some more consolidations would be seen. Nevertheless, as long as 55 W EMA (now at 175.93) holds, the larger up trend from 114.42 (2020 low) remains intact. Firm break of 186.86 will pave the way to 78.6% projection of 124.37 (2022 low) to 175.41 (2025 high) from 154.77 at 194.88 next.
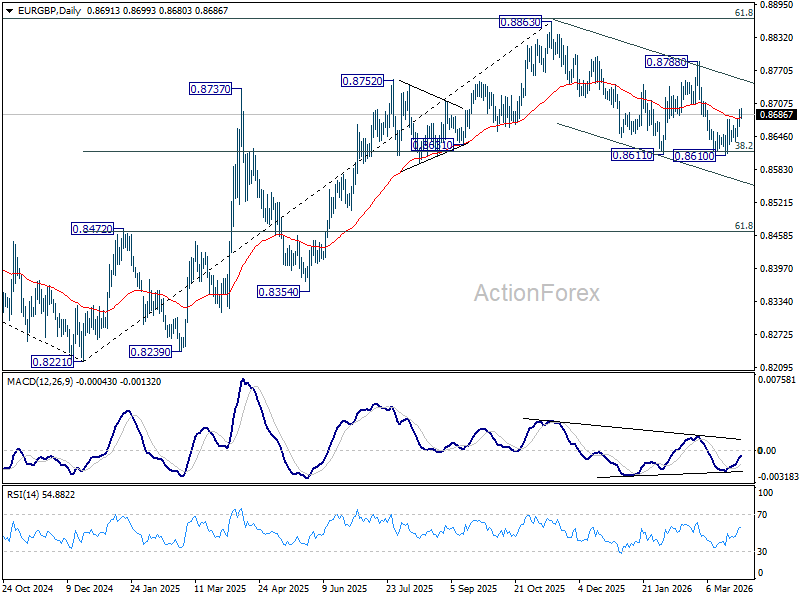
EUR/GBP Daily Outlook
Daily Pivots: (S1) 0.8674; (P) 0.8687; (R1) 0.8706; More…
EUR/GBP's rebound from 0.8610 is still in progress. A short term bottom should be formed and intraday bias remains on the upside for 0.8788 resistance. For now, risk is mildly on the upside as long as 0.8610 support holds, in case of retreat.
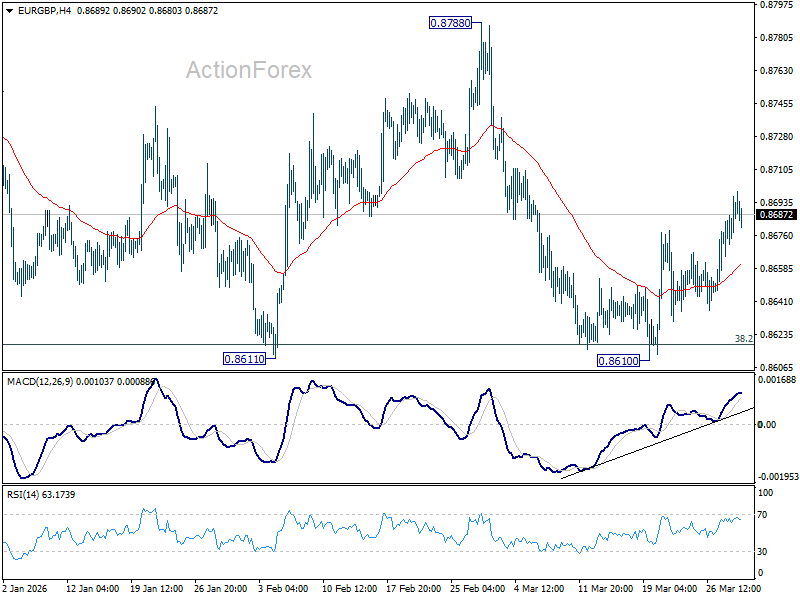
In the bigger picture, current development revived the case that whole rise from 0.8221 (2024 low) has completed at 0.8863, after rejection by 61.8% retracement of 0.9267 (2022 high) to 0.8221 at 0.8867. Sustained trading below 38.2% retracement of 0.8821 to 0.8863 at 0.8618 will confirm this case, and bring deeper fall to 61.8% retracement at 0.8466 at least. For now, medium term outlook is neutral at best as long as 0.8863 resistance holds.
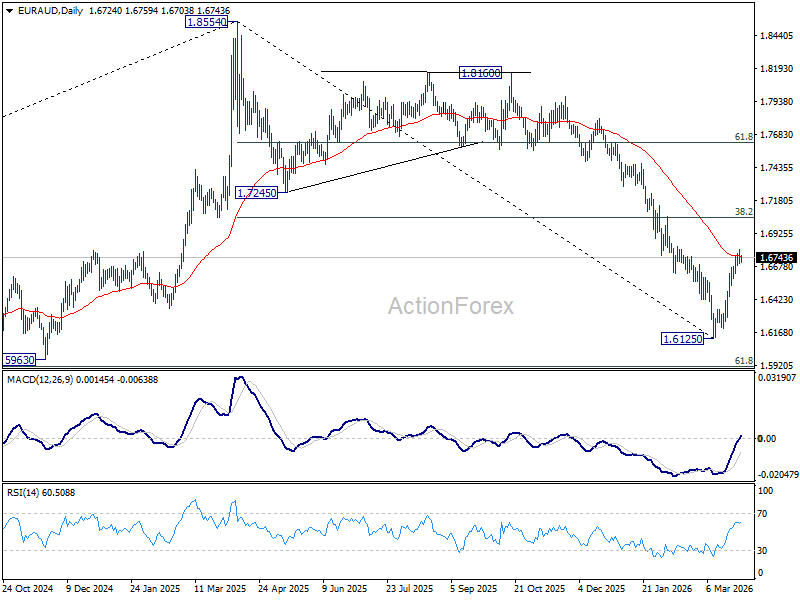
EUR/AUD Daily Outlook
Daily Pivots: (S1) 1.6680; (P) 1.6746; (R1) 1.6793; More...
Intraday bias in EUR/AUD is turned neutral first with current retreat. On the upside, above 1.6803 will extend the rebound from 1.6125 to 38.2% retracement of 1.8554 to 1.6125 at 1.7053. However, break of 1.6561 minor support will argue that the rebound has completed, after rejection by 55 D EMA (now at 1.6754). Retest of 1.6125 low should be seen next.
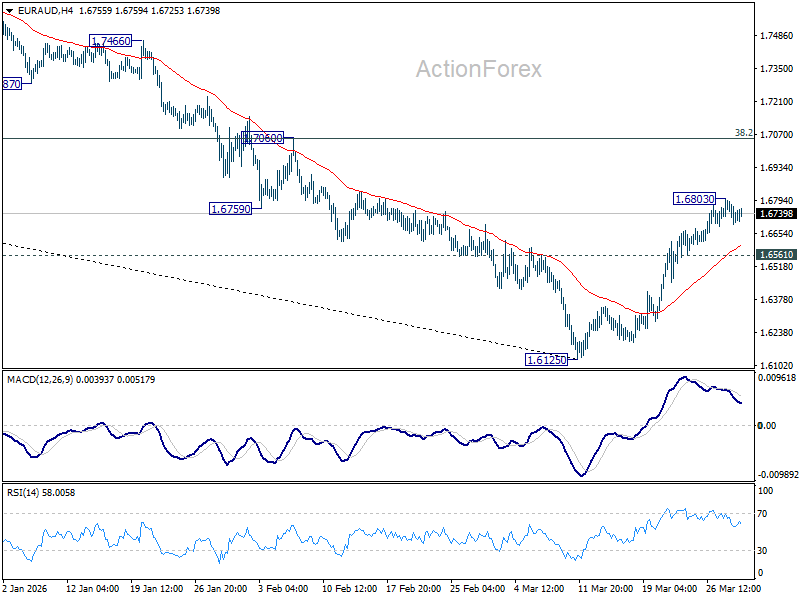
In the bigger picture, fall from 1.8554 medium term top is seen as reversing the whole up trend from 1.4281 (2022 low). Deeper decline should be seen to 61.8% retracement of 1.4281 to 1.8554 at 1.5913, which is slightly below 1.5963 structural support. Decisive break there will pave the way back to 1.4281. For now, risk will stay on the downside as long as 55 W EMA (now at 1.7226) holds, even in case of strong rebound.