Sample Category Title
AUD/USD Daily Report
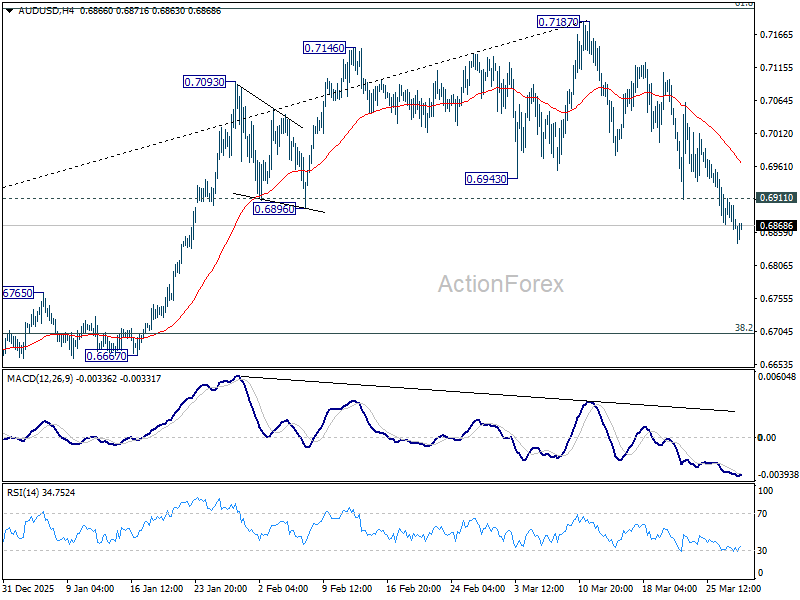
Daily Pivots: (S1) 0.6854; (P) 0.6884; (R1) 0.6904; More...
AUD/USD recovers mildly after initial dip, but there is no sign of bottoming yet. Intraday bias stays on the downside at this point. Current fall from 0.7187 should target retracement of 0.5913 to 0.7187 at 0.6700. On the upside, above 0.6911 minor resistance will turn intraday bias neutral first. But risk will stay on the downside as long as 0.7187 resistance holds, in case of recovery.
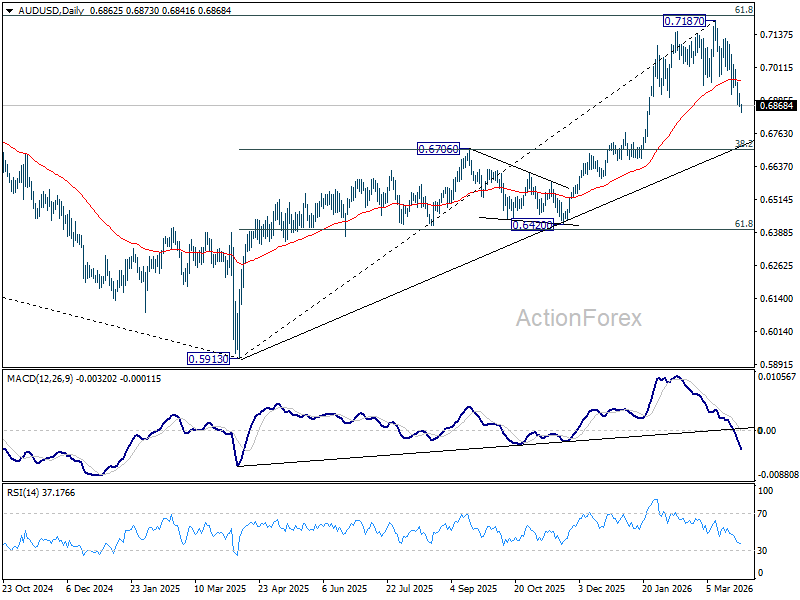
In the bigger picture, as long as 0.6706 cluster support holds, rise from 0.5913 (2024 low) should still be in progress. Decisive break of 61.8% retracement of 0.8006 to 0.5913 at 0.7206 will solidify the case that it's already reversing the down trend from 0.8006 (2021 high). However, firm break of 0.6706 will dampen this bullish case, and bring deeper fall back to 0.6420 support, and possibly below.
Dollar in “Spring-Load” Consolidation as Pakistan Talks Clash With Escalation Risks
Dollar has entered tactical consolidation as markets weigh a high-stakes diplomatic effort in Pakistan against the escalating risks of a “Maritime Double Chokepoint.” While regional powers attempt to broker an Iran ceasefire, the absence of confirmed U.S. and Iranian attendance suggests the talks are more of a hope-driven distraction rather than a strategic breakthrough. Meanwhile, with Israeli Prime Minister Netanyahu signaling a permanent “Gaza Model” for Southern Lebanon and Houthi rebels threatening a total maritime bottleneck, the structural floor for $110 Brent remains locked. This suggests the current Dollar softness could be a "Spring-Load" phase before geopolitical escalations eventually overwhelm the market’s skeptical hope.
Pakistan has emerged as a key diplomatic hub, hosting regional talks involving Saudi Arabia, Turkey, and Egypt aimed at brokering a ceasefire. However, optimism remains tempered. It is not yet clear whether the US or Iran will participate, leaving the initiative closer to a regional coordination effort than a confirmed breakthrough. As a result, markets are treating the development as a tentative off-ramp rather than a decisive de-escalation.
At the same time, escalation risks continue to build. The order to expand Israeli operations in Southern Lebanon using the "Gaza Model" terminology is a transformative signal. It tells traders that regional instability is no longer a temporary spike but a structural feature. A long-term military buffer zone in Lebanon ensures that energy and logistics risks are baked in for 2026.
The most underrated risk is probably the Houthi entry into the conflict. With both the Strait of Hormuz and the Bab el-Mandeb under threat, global maritime flows face a significant bottleneck. This "Double Chokepoint" is helping to keep energy prices elevated, with Brent holding above $110 and WTI above $100.
Against this backdrop, attention is also turning to a critical “Judgment Week” of economic data. Releases including ISM Manufacturing, Eurozone CPI, and US nonfarm payrolls will be closely watched for confirmation of whether the energy shock is feeding into inflation and labor market. The data will play a key role in shaping expectations for central bank policy paths.
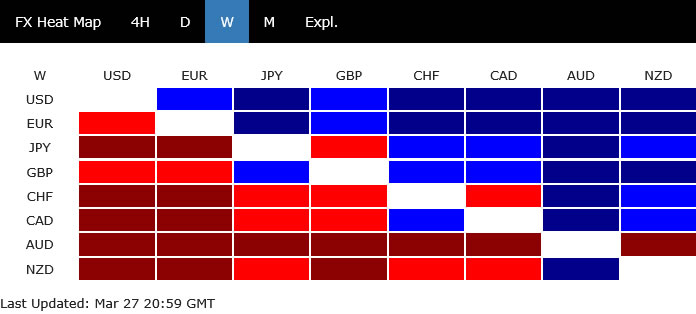
In the currency markets, Yen is the strongest performer for the day so far, rebounding after Japan issued a “final warning” on intervention. Euro and Sterling are also slightly firmer. Australian and New Zealand Dollars are underperforming, pointing to a cautious risk tone. while Dollar is also soft. Swiss Franc and Loonie are trading in the middle of the pack.
Japan Issues Intervention “Final Warning” as USD/JPY Breaks 160, but Dollar Strength Prevents Reversal
Japan escalated intervention rhetoric after USD/JPY broke above 160, issuing what markets see as a “final warning.” However, strong Dollar momentum continues to limit the impact, turning intervention into a ceiling rather than a reversal trigger. Yen strength is instead showing more clearly in crosses such as AUD/JPY, where downside has extended. Read More.
BoJ Warns of “Behind the Curve” Risk as Yen Depreciation Amplifies Inflation Pressure
BoJ flagged the risk of falling “behind the curve” as yen depreciation amplifies inflation pressure and raises concerns over second-round effects. Policymakers signaled readiness to accelerate rate hikes if needed, especially if wage growth and cost pass-through persist. The shift highlights growing sensitivity to currency-driven inflation and strengthens the tightening bias. Read More.
Judgment Week: Fed's Rate Deadlock and the Non-Farm Payroll Verdict
Markets head into a decisive “Judgment Week” as NFP, ISM, and Eurozone CPI test whether the energy shock is feeding into broader inflation. With oil above $110, the Fed faces a dual-mandate deadlock between rising price pressures and weakening labor signals. Friday’s payrolls will be key in determining the 2026 interest rate path. Read more.
AUD/USD Daily Report
Daily Pivots: (S1) 0.6854; (P) 0.6884; (R1) 0.6904; More...
AUD/USD recovers mildly after initial dip, but there is no sign of bottoming yet. Intraday bias stays on the downside at this point. Current fall from 0.7187 should target retracement of 0.5913 to 0.7187 at 0.6700. On the upside, above 0.6911 minor resistance will turn intraday bias neutral first. But risk will stay on the downside as long as 0.7187 resistance holds, in case of recovery.
In the bigger picture, as long as 0.6706 cluster support holds, rise from 0.5913 (2024 low) should still be in progress. Decisive break of 61.8% retracement of 0.8006 to 0.5913 at 0.7206 will solidify the case that it's already reversing the down trend from 0.8006 (2021 high). However, firm break of 0.6706 will dampen this bullish case, and bring deeper fall back to 0.6420 support, and possibly below.
Japan Issues Intervention “Final Warning” as USD/JPY Breaks 160, But Dollar Strength Prevents Reversal
Japan has officially triggered its “Final Warning” as USD/JPY breached the 160 Red Line, but the resulting policy pressure is unlikely to break the back of Dollar. Instead, the coordinated “Double-Team” effort from the Ministry of Finance and the Bank of Japan is creating a tactical ceiling in USD/JPY, that will squeeze Yen-short positioning into the crosses like AUD/JPY.
Vice Minister Atsushi Mimura has made it clear today: authorities are prepared for "bold steps" to counter speculative activity, and "decisive action may soon be necessary." The language marks a clear step-up in intervention rhetoric, reflecting rising concern over the pace of Yen depreciation and its implications for the Japanese economy.
BoJ Governor Kazuo Ueda added to the coordinated messaging, emphasizing that rising import costs from a weak currency could justify raising interest rates in the coming months. "We don't guide monetary policy directly to control foreign exchange rate moves," Ueda told Parliament. "But currency market moves are obviously among factors that hugely affect economic and price developments."
However, as broad-based Dollar strength continues to dominate due to global stagflation fear. In this environment, verbal intervention alone is unlikely to generate sustained reversals. Unless authorities move to direct market intervention or there is a broader shift in Dollar dynamics, USD/JPY is likely to remain supported near current levels, just capped below 160 for now. Yen strength, when it does emerge, is more likely to be expressed through crosses rather than against Dollar.
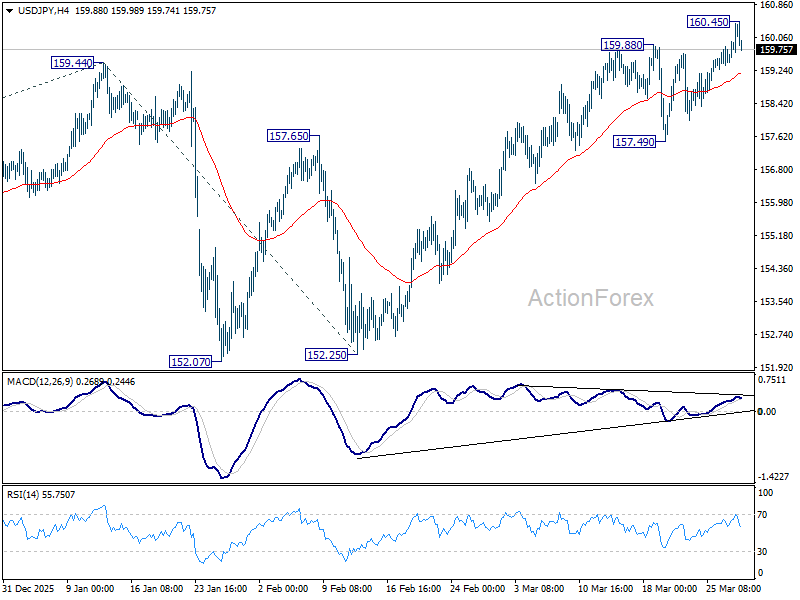
Technically, further rise is still in favor in USD/JPY as long as 55 4H EMA (now at 159.15) holds. Current rise from 152.25 is still in favor to continue to retest 161.94 (2024) high. However, sustained break of 152.25 will argue that a short term top is formed and further pullback would be seen back to 157.49 support and possibly below.
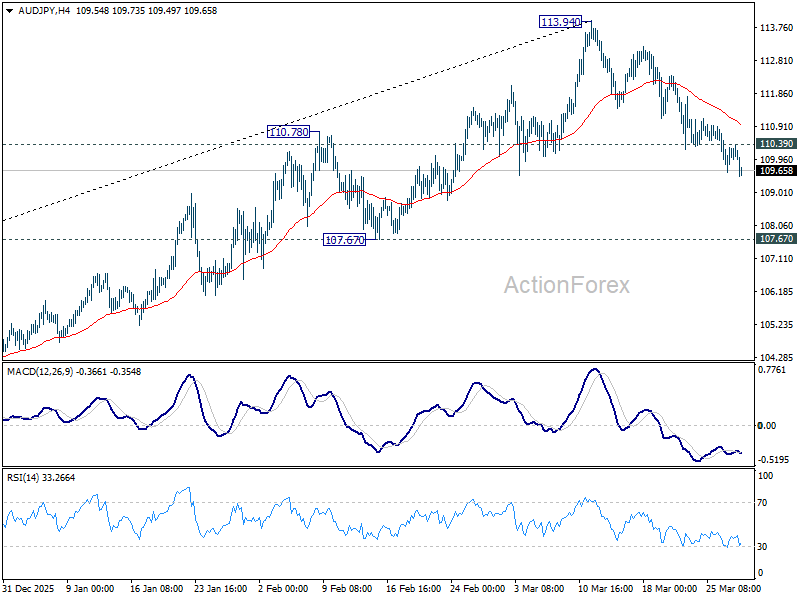
AUD/JPY's fall from 113.94 top continue today. As long as 110.39 minor resistance holds, deeper decline is still expected to 107.67 structural support in the near term.
EUR/USD Under Pressure, Is Another Leg Lower Imminent?
Key Highlights
- EUR/USD started a fresh decline and traded below 1.1550.
- It traded below a bullish trend line with support at 1.1520 on the 4-hour chart.
- GBP/USD extended losses and traded below 1.3320.
- Gold prices are showing signs of weakness below $4,550.
EUR/USD Technical Analysis
The Euro failed to settle above 1.1620 against the US Dollar. EUR/USD started a fresh decline and traded below the 1.1565 support.
Looking at the 4-hour chart, the pair settled below 1.1550, the 100 simple moving average (red, 4-hour), and the 200 simple moving average (green, 4-hour). Besides, it traded below a bullish trend line with support at 1.1520.
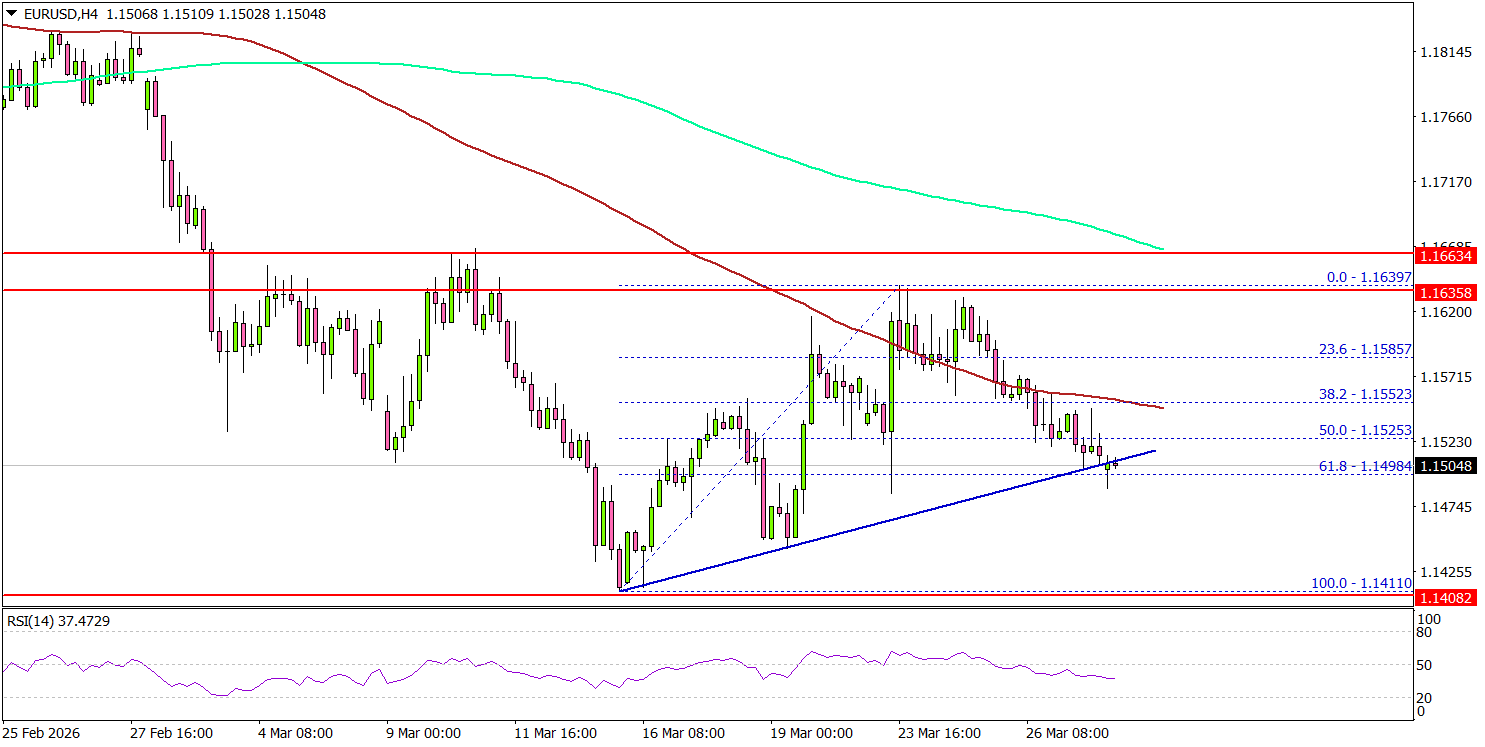
The pair is now consolidating near the 61.8% Fib retracement level of the upward move from the 1.1410 swing low to the 1.1639 high.
On the upside, the pair is now facing sellers near 1.1550 and the 100 simple moving average (red, 4-hour). The first major resistance sits at 1.1580. A close above 160.00 could open the doors for gains above 1.1600. In the stated case, the bulls could aim for a move to 1.1640.
If there is no upside break above 1.1600, the pair might start a fresh decline. Immediate support is seen near 1.1500. The first key support sits at 1.1440. A close below 1.1440 might call for heavy losses. In the stated case, it could even revisit 1.1400 in the coming days.
Looking at Gold, the price is signaling a fresh decline, and there are chances of a drop toward the $4,250 level.
Upcoming Key Economic Events:
- German Consumer Price Index for March 2026 (YoY) (Prelim) – Forecast +2.1%, versus +1.9% previous.
- German Consumer Price Index for March 2026 (MoM) (Prelim) – Forecast +0.9%, versus +0.2% previous.
WTI Above $100 as Talks Fail and Inflation Fears Rise
Markets were mainly focused on developments in Iran last week, creating high volatility across oil and equity markets. Early in the week, efforts by Donald Trump to reduce tensions helped calm sentiment. Oil prices moved lower, and stock markets pushed higher as traders hoped for progress.
By the end of the week, however, there was little progress in negotiations, and Iran did not appear ready to end the conflict. This shifted sentiment back to risk-off. Oil prices moved toward the $100 level again, while U.S. equity markets reversed lower, falling for a fifth straight week and closing near their weekly lows.
On the economic side, there were not many major releases, but the data added to concerns. U.S. S&P Global Services PMI came in weaker than expected, and consumer sentiment also declined. Consumers are now expecting higher inflation and are more worried about the future, which is keeping overall market sentiment cautious.
Markets This Week
U.S. Stocks
The downtrend in U.S. stocks is still strong as markets worry about rising inflation from the conflict in Iran. The chart looks bearish, with the 10-day moving average acting as resistance, and the Dow closing near its yearly lows. Even though stocks have fallen recently, they are still relatively high compared to the past few years, so investors may still panic and take profits. Unless the war clearly ends, focusing on selling opportunities remains the best approach. Resistance levels are at 46,500, 47,500, and 48,000. Support is seen at 45,000, 44,500, 44,000, and 43,500.
Japanese Stocks
Optimism about a possible end to the Iran conflict and a weaker yen helped push the Nikkei higher earlier in the week. However, the sharp drop in U.S. equities on Friday brought sellers back into the market, and the overall downtrend remains in place. Inflation is still a concern for Japan, especially with high oil prices, and there is also the risk of Bank of Japan intervention to support the yen. This makes it unlikely that the Nikkei will rise significantly in the short term. Selling near the 10-day moving average remains the preferred approach for the coming week. Resistance is seen at 53,000, 54,750, 56,000, 57,000, and 58,000, while support is at 51,000円, 50,000円, and 49,000円.
USD/JPY
USD/JPY continued to move higher, driven by rising U.S. interest rate expectations, and pushed above the key 160 level at the end of the week. Oil prices are still having a strong impact on short-term moves. This week, traders are likely to test the upside to see if the Bank of Japan will intervene. If there is no intervention, the pair could move higher quickly, while any intervention could cause a sharp drop. The uptrend remains strong, so selling in anticipation of intervention is risky in the short term. However, a move back below 160 could create a short-term selling opportunity. Resistance is at 162, and 165, while support is seen at 159.00, 158.50, 158.00, and 156.50.
Gold
Rising U.S. interest rate expectations continued to pressure gold last week, with a sharp sell-off at the start of the week breaking below yearly lows. There was a small recovery, but gains were limited as the 10-day moving average continued to act as strong resistance. Gold has fallen significantly in recent weeks, and the break below the lows followed by a recovery suggests the worst of the selling may be over in the short term. A move above the 10-day moving average, especially if tensions in Iran ease, could offer a buying opportunity in the week ahead. Resistance is at $4,700, $4,850, $5,000, and $5,100, while support is at $4,400, $4,300, $4,200, $4,100, and $4,000.
Crude Oil
WTI fell sharply at the start of the week after failing to break above $100 and on hopes of a quick end to the Iran conflict. However, as it became clear that Iran is likely to continue hostilities, buyers returned, pushing prices higher and closing the week above $100. This suggests strong underlying demand. Expect a volatile start to the week, with the potential for another spike above $100 and the risk of a further strong move higher if tensions continue. Resistance is at $102.50, $110, $120, $125, and $130, while support is at $90, $80, $75, $70, and $67.5.
Bitcoin
Bitcoin remains quiet, trading between $65,000 and $75,000, as traders focus on other markets with better opportunities. The sharp drop in U.S. equities on Friday triggered risk-off selling, pushing Bitcoin toward the lower end of the range. It now looks more likely that price could break below the $65,000 support and move lower in the near term. Resistance is at $75,000, $80,000, and $85,000, while support is at $65,000, $60,000, and $55,000.
This Week’s Focus
- Monday: U.S. Retail Inventories Ex Auto (Feb) and Fed Chair Powell Speaks
- Tuesday: Japan Tokyo Core CPI and Industrial Production, Australia RBA Meeting Minutes, China Manufacturing PMI, U.K. GDP, Current Account and Nationwide HPI, E.U. CPI, U.S. Chicago PMI and CB Consumer Confidence
- Wednesday: Japan Tankan Large Manufacturers Index, Australia Building Approvals, E.U. HCOB Eurozone Manufacturing PMI and Unemployment Rate, U.K. S&P Global Manufacturing PMI, U.S. Retail Sales and S&P Global Manufacturing PMI
- Thursday: Australia Trade Balance, U.S. Trade Balance
- Friday: U.S. Nonfarm Payrolls and S&P Global Services PMI
Markets will start the week at a critical point, with U.S. equities falling sharply on Friday to yearly lows, USD/JPY moving toward 160, and oil holding around $100. The main focus remains the conflict in Iran, and with markets now pricing in a longer war, the risk of large moves is high as headlines from the region drive sentiment.
Friday will be especially important, with U.S. Nonfarm Payrolls released on the same day that Easter holidays begin in many parts of the world—this combination could lead to sharp volatility. Markets will also be watching closely for any signs of intervention from the Bank of Japan as USD/JPY approaches 160, with traders alert to the risk of sudden moves in the yen.
BoJ Warns of “Behind the Curve” Risk as Yen Depreciation Amplifies Inflation Pressure
Bank of Japan struck a more urgent tone in the Summary of Opinions from its March meeting, warning of the risk of “falling behind the curve” if policy tightening lags underlying inflation dynamics. With real interest rates still deeply negative and price pressures showing signs of persistence, policymakers acknowledged that delayed action could eventually force more rapid and disruptive tightening, posing a greater risk to the economy.
While the baseline remains "gradually proceeding with rate hikes", the discussion revealed growing openness to adjusting the pace of hikes. Members indicated that rate increases may need to proceed “without long intervals between adjustments” and, if necessary, “without hesitation,” particularly if inflation trends continue to firm. This marks a subtle but important shift from a purely cautious stance toward a more proactive tightening approach.
A key concern is the rising risk of second-round effects. BoJ noted that wage growth is gaining traction amid labor shortages, while firms are increasingly passing through higher costs, amplified by "excessive depreciation of the Yen". The combination of stronger wage-price dynamics and a weaker currency is seen as increasing the likelihood that underlying inflation could exceed the 2% target in a sustained manner.
While higher oil prices could weigh on growth, policymakers stressed that the current environment still supports an ongoing uptrend in prices. In this context, Yen weakness becomes a critical factor, as further depreciation could intensify imported inflation and force the BoJ to accelerate tightening beyond its current projections.
S&P 500 Wave Analysis
S&P 500: ⬇️ Sell
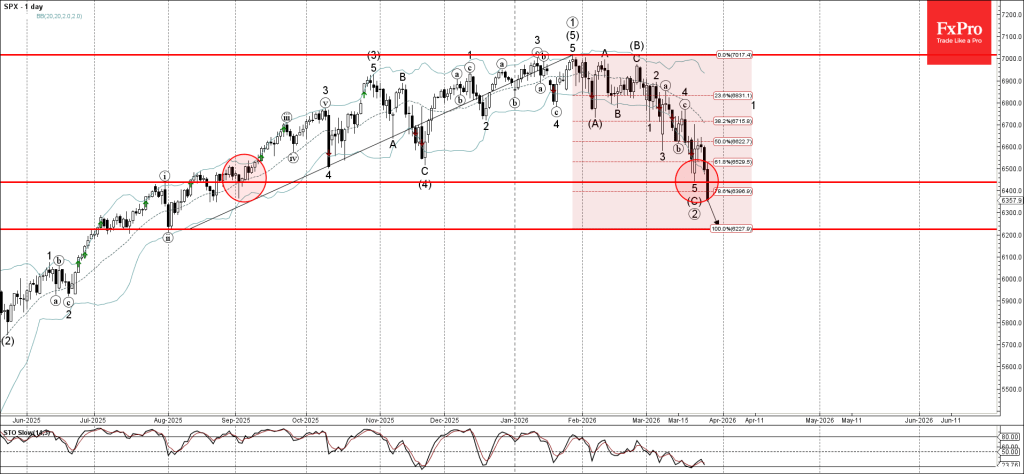
- S&P 500 broke strong support level 6440.00
- Likely to fall to support level 6225.00
S&P 500 index recently broke below the strong support level 6440.00 (which stopped the previous impulse wave 5 in March) and the 61.8% Fibonacci correction of the upward impulse from August.
The breakout of the support level 6440.00 should add to the bearish pressure on this index.
S&P 500 index can be expected to fall further to the next support level 6225.00 (former strong support from July and August of 2025).
Judgment Week: Fed’s Rate Deadlock and the Non-Farm Payroll Verdict
Global markets have entered a definitive “Judgment Week” for the Federal Reserve, where the future of the 2026 interest rate path will be tested against a backdrop of $110 oil. Following February’s shock loss of -92k jobs, the Friday NFP report serves as the final verdict on whether the U.S. labor market is merely cooling or officially freezing. However, the Fed remains trapped in a “Dual-Mandate Deadlock”. Any outcome other than a "Goldilocks" NFP print could force the FOMC into a public policy brawl—pitting the necessity of a growth-saving pause against the "Volcker-script" requirement to crush resurging inflation.
The High-Stakes Events: The Evidence on Trial
1. The Verdict: US Nonfarm Payrolls (NFP) & Unemployment (Friday, April 3)
After the -92k contraction in February, the Fed is praying for a "Goldilocks" stabilization. A print between +50k and +80k, and even better with revision to January's figure, allows them to maintain their "Hawkish Hold," dismissing the 4.4% unemployment rate as a "normalization."
The Panic Trigger: Another contraction (e.g., -50k) would prove the labor market is in a freefall. However, the Average Hourly Earnings (exp. 0.4% mom) is the "Stagflation Trap" within the data; if jobs vanish but wages stay high, the Fed cannot cut rates without surrendering to inflation.
2. The Star Witness: ISM Manufacturing Index (Wednesday, April 1)
While NFP is the result, the ISM tells us why it’s happening. The Prices Paid sub-index is the most critical metric here. If it remains elevated above 70 while New Orders fall below 50, it confirms the "Stagflation Filter." This signals that "cost-push" inflation from the Middle East is filtering into the supply chain, a scenario the Fed cannot fix with traditional interest rate tools.
3. The Global Catalyst: Eurozone Flash CPI (Tuesday, March 31)
The Flash CPI on Tuesday is arguably the most pivotal data point for the Euro since the start of the conflict. While the market consensus is currently set for a jump toward 2.4%, the "whisper" expectation is shifting even higher due to the disruptions in the Strait of Hormuz. If Tuesday's print hits 2.4% or higher, it will be seen as a "call to action" and solidify the case for an April ECB hike. Also, A high March CPI effectively turns June from a "maybe" to a "certainty" for the market.
The Silent Movers: The Shadow Risks
1. Germany’s Flash CPI (Monday, March 30)
As the Eurozone’s largest economy, Germany is the "canary in the coal mine." Because it reports 24 hours before the aggregate Eurozone data, a "beat" here will trigger an immediate front-running of the Euro. It serves as the early-warning system for whether the energy shock has already become entrenched in European economy.
2. RBA Monetary Policy Minutes (Tuesday, March 31)
Traders are looking for the "split" details. The previous meeting was a 5-4 vote; if the minutes lean hawkish due to "capacity pressures," the AUD could see renewed strength.
3. JPY Tankan Survey (Wednesday, April 1)
This is the definitive look at Japan’s business sentiment. With Japan’s headline CPI at a two-year low (1.3%), any weakness in the Tankan could provide the Bank of Japan with an excuse to delay normalization.
Highlights for the week:
| Day | Currency | Event | Importance |
| Mon | EUR | German Preliminary HICP (Inflation) | High |
| Tue | JPY | Tokyo CPI (Inflation Gauge) | High |
| NZD | ANZ Business Confidence | Medium | |
| AUD | RBA Meeting Minutes | High | |
| EUR | Eurozone Flash CPI | Critical | |
| Wed | USD | ADP Non-Farm Employment Change | Medium |
| USD | ISM Manufacturing PMI | High | |
| Fri | USD | Nonfarm Payrolls (NFP) | Critical |
Eco Data 3/30/26
| GMT | Ccy | Events | Act | Cons | Prev | Rev |
|---|---|---|---|---|---|---|
| 23:50 | JPY | BoJ Summary of Opinions | ||||
| 07:00 | CHF | KOF Leading Indicator Feb | 96.1 | 100.6 | 104.2 | 103.8 |
| 08:30 | GBP | Mortgage Approvals Feb | 63K | 61K | 60K | |
| 08:30 | GBP | M4 Money Supply M/M Feb | 0.60% | 0.10% | -0.10% | |
| 09:00 | EUR | Eurozone Economic Sentiment Indicator Mar | 96.6 | 96.5 | 98.3 | 98.2 |
| 09:00 | EUR | Eurozone Industrial Confidence Mar | -7 | -9 | -7.1 | -7.2 |
| 09:00 | EUR | Eurozone Services Sentiment Mar | 4.9 | 4 | 5 | |
| 09:00 | EUR | Eurozone Consumer Confidence Mar F | -16.3 | -16.3 | -16.3 | |
| 12:00 | EUR | Germany CPI M/M Mar P | 1.10% | 0.90% | 0.20% | |
| 12:00 | EUR | Germany CPI Y/Y Mar P | 2.70% | 2.70% | 1.90% |
| 23:50 | JPY |
| BoJ Summary of Opinions | |
| Actual | |
| Consensus | |
| Previous | |
| 07:00 | CHF |
| KOF Leading Indicator Feb | |
| Actual | 96.1 |
| Consensus | 100.6 |
| Previous | 104.2 |
| Revised | 103.8 |
| 08:30 | GBP |
| Mortgage Approvals Feb | |
| Actual | 63K |
| Consensus | 61K |
| Previous | 60K |
| 08:30 | GBP |
| M4 Money Supply M/M Feb | |
| Actual | 0.60% |
| Consensus | 0.10% |
| Previous | -0.10% |
| 09:00 | EUR |
| Eurozone Economic Sentiment Indicator Mar | |
| Actual | 96.6 |
| Consensus | 96.5 |
| Previous | 98.3 |
| Revised | 98.2 |
| 09:00 | EUR |
| Eurozone Industrial Confidence Mar | |
| Actual | -7 |
| Consensus | -9 |
| Previous | -7.1 |
| Revised | -7.2 |
| 09:00 | EUR |
| Eurozone Services Sentiment Mar | |
| Actual | 4.9 |
| Consensus | 4 |
| Previous | 5 |
| 09:00 | EUR |
| Eurozone Consumer Confidence Mar F | |
| Actual | -16.3 |
| Consensus | -16.3 |
| Previous | -16.3 |
| 12:00 | EUR |
| Germany CPI M/M Mar P | |
| Actual | 1.10% |
| Consensus | 0.90% |
| Previous | 0.20% |
| 12:00 | EUR |
| Germany CPI Y/Y Mar P | |
| Actual | 2.70% |
| Consensus | 2.70% |
| Previous | 1.90% |
70s-Style Stagflation Returns: Dollar as “Wrecking Ball,” Gold No Longer “King”
The return of “1970s-style stagflation” is no longer a distant tail risk—it is fast becoming the central theme driving global markets. The clearest warning sign is the emergence of a “dual shock” of rising oil prices and climbing Treasury yields. In a typical geopolitical crisis, investors seek safety in bonds, pushing yields lower. This time, yields are rising alongside oil, signaling that inflation fears are beginning to dominate over traditional risk aversion.
At the core of this shift is a “war of attrition” in the Middle East that is feeding a “slow-boil” inflation dynamic into the global economy. Rather than a sharp spike followed by relief, persistently elevated energy costs are filtering through supply chains, from transport to food production. This creates a classic “policy paradox” for central banks: tighten policy to contain inflation and risk a deeper slowdown, or tolerate rising prices and risk inflation becoming entrenched.
But unlike the 1970s, today’s central bankers are acutely aware of the lessons from “Burns’ failure”, making them far less likely to tolerate prolonged inflation drift. As a result, markets are now preparing for outcomes that could differ sharply from that era. Gold may no longer be the “King” in an environment of rising real yields, while Dollar—supported by higher rates and energy independence—could emerge as the global “wrecking ball.” Against this backdrop, the focuses should be on a “triple threat”—oil pushing toward 120, equities testing key support levels, and Treasury yields approaching 5%—as confirmation that a structural stagflation regime is taking hold.
War of Attrition Deepens as “Pause” Masks Structural Supply Shock
What initially appeared to be a potential off-ramp has instead evolved into a prolonged “war of attrition”, reinforcing the transition toward a “slow-boil” inflation regime. The latest decision by US President Donald Trump to delay a major strike on Iranian energy infrastructure by another 10 days, citing “productive” diplomatic talks via intermediaries, has done little to reassure markets. Rather than signaling de-escalation, the move is increasingly seen as a tactical pause that allows both sides to reposition while keeping the underlying conflict unresolved.
Developments on the ground point clearly in that direction. Iran’s declaration restricting access through the Strait of Hormuz to vessels linked to the US, Israel, and their allies represents a significant escalation in economic pressure. While not a full blockade, it introduces targeted disruption to one of the world’s most critical energy chokepoints. At the same time, military activity in the region continues unabated, suggesting that diplomacy and escalation are unfolding in parallel rather than as alternatives.
This combination is precisely what is pulling the global economy closer to “1970s-style stagflation.” Instead of a sharp, short-lived shock, markets are now facing a prolonged period of elevated costs and persistent uncertainty. Energy supply risks are no longer hypothetical—they are being operationalized through restrictions and strategic maneuvering. The longer this environment persists, the more likely it is that higher input costs will be embedded across supply chains, transforming a geopolitical conflict into a structural inflation problem.
“Dual Shock” Confirmed as Oil and Yields Rise Together, Equities Crack
Market pricing is increasingly aligning with a stagflationary outcome, led by the emergence of a clear “dual shock” dynamic. Treasury yields are rising alongside oil prices, breaking from the traditional crisis pattern where bonds rally as a safe haven. The US 10-year yield climbed to 4.44% last week, with markets now eyeing a move toward 4.5%, reflecting growing concerns that inflation will remain persistent rather than transitory.
At the same time, energy markets are signaling that supply pressures are intensifying. WTI has surged back above 100 after rebounding from 85.11, with a break of 102.31 likely to trigger a move toward the 119.45 high. Brent has also regained strong upward momentum, climbing from 96.26 to above 110 and positioning for a potential retest of 119.70. These moves suggest that markets are no longer pricing a temporary disruption, but a sustained constraint on supply.
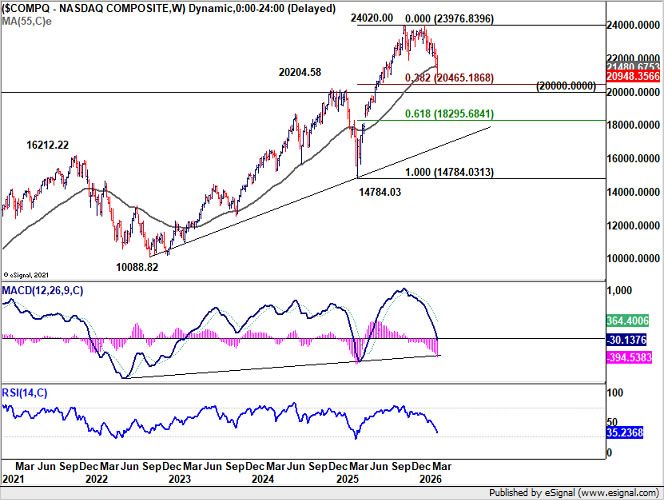
Equity markets are reacting accordingly. The DOW declined -0.9% over the week, nearing the critical 45k support level, while the NASDAQ dropped -2.15% and is approaching the 20k psychological threshold. The weakness reflects not just higher discount rates, but a reassessment of earnings resilience in a more challenging macro environment.
Stagflation Policy Paradox: Why Central Banks Won’t Repeat 1970s Mistakes
The emergence of a stagflationary environment brings with it a classic “policy paradox.” Unlike a standard downturn where central banks can cut rates to support growth, or a typical inflation spike where tightening can cool demand without major trade-offs, stagflation forces policymakers into a binary choice. They must either tighten policy and risk amplifying the economic slowdown, or tolerate rising inflation and risk it becoming entrenched.
History offers a clear warning. During the 1970s, the Federal Reserve under Arthur Burns attempted to manage the unemployment-inflation trade-off, keeping policy too loose in the face of rising price pressures. This approach allowed inflation expectations to drift higher even as growth stagnated, ultimately requiring far more aggressive tightening later. It was only when Paul Volcker pushed rates sharply higher that inflation was brought under control, at the cost of a deep recession.
Today’s central bankers are unlikely to repeat that mistake. Policymakers are widely seen as students of that era, with a clear bias toward acting earlier rather than later. The prevailing view is that inflation, once embedded, is far more damaging than a cyclical downturn, shifting the balance of risks toward pre-emptive tightening.
Market expectations are already adjusting. The narrative has shifted from rate cuts to the possibility of renewed tightening, particularly as the risk of second-round inflation effects from energy prices builds. For example, in Europe, some economists are now pointing to the possibility of multiple ECB rate hikes in April and June.
This sets the stage for a different policy path compared to the 1970s. Rather than a prolonged period of “stop-go” policy, central banks are more likely to pursue a decisive tightening cycle, even if it results in weaker growth. In effect, policymakers appear willing to engineer a “recession light” today to avoid a more severe and prolonged adjustment later.
| Central Bank | Current Rate | Next Meeting | Market Expectation / Bias |
| Fed | 3.50-3.75% | Apr-26 | Hawkish Hold. Rate cut priced out in 2026, 30% chance of hike by Dec. |
| ECB | 2.15% | Apr-26 | Aggressive. Economists expecting hike in April and June |
| BoE | 3.75% | Apr-26 | Hawkish Hold. "Bulk" of the hike probability is concentrated in H2. Risk of shock hike in June. |
| RBA | 4.10% | May-26 | Hawkish. 72% chance of hike to 4.35%. |
| BoC | 2.25% | Apr-26 | Neutral/Hold. Watching oil spillover. |
| RBNZ | 2.25% | Apr-26 | Neutral Hold. Wait-and-see approach. |
| BoJ | 0.75% | Apr-26 | Hawkish Pivot. Apri meeting is live. |
| SNB | 0.00% | Jun-26 | Dovish Hold. No hikes expected in 2026. |
A Different Playbook — How Asset Markets Diverge from the 1970s Stagflation Era
A key difference between today’s environment and the 1970s lies in how monetary policy shapes asset performance. Back then, delayed and inconsistent tightening allowed inflation to erode real returns across markets. This time, with central banks acting more decisively, asset behavior is likely to diverge sharply from the historical playbook.
Gold, the undisputed “King” of the 1970s, may not enjoy the same dominance in this cycle. During that era, gold surged from 35 to 850 as inflation accelerated and real yields turned deeply negative. Today, however, the backdrop is very different. With central banks expected to maintain higher interest rates to combat inflation, the opportunity cost of holding non-yielding assets rises. As a result, gold’s upside is likely to be capped, rather than explosive.
Commodities, particularly energy, are still poised to outperform, but in a more concentrated manner. In the 1970s, broad-based commodity gains were driven by widespread supply shortages. In contrast, today’s environment features more targeted disruptions, particularly in oil and energy-related inputs. Structural changes, including the rise of renewables and efficiency gains from technology, suggest that while energy may rally strongly, the commodity boom is unlikely to be as broad-based.
Equity markets face a more challenging outlook. In the 1970s, stocks delivered poor real returns, but nominal prices were largely range-bound as the Federal Reserve oscillated between tightening and easing. This time, the absence of “stop-go” policy increases the risk of a sharper adjustment. With central banks maintaining restrictive conditions and margins under pressure, equities are more likely to face a decisive correction rather than a prolonged sideways trend.
Dollar could stand out as the clearest structural winner. In the 1970s, Dollar was weakened by the collapse of the Bretton Woods system and rising inflation. Today, the situation is reversed. With the US benefiting from energy independence and relatively higher interest rates, Dollar is strengthening, supported by both fundamentals and policy dynamics.
In this sense, Dollar has transitioned from being the “problem” to becoming the global “wrecking ball.” As tightening persists and capital flows seek yield and stability, USD strength is likely to remain a defining feature of this stagflationary regime, amplifying pressure on other currencies and global financial conditions.
Watching the “Triple Threat” as Markets Approach Key Inflection Points
Markets are now converging on a critical “triple threat” that will determine whether the stagflation regime fully takes hold: Brent at 120, the DOW at 45k, and the US 10-year yield at 5%. These are not just technical levels—they are macro thresholds that signal a shift from stress to systemic repricing. A sustained move across these markers would confirm that markets are no longer pricing a temporary shock, but a structural imbalance.
In energy markets, Brent above 120 would indicate that supply disruptions are being treated as persistent rather than cyclical. At that level, oil is no longer reflecting a war premium—it signals a tightening global supply backdrop that feeds directly into inflation expectations and cost structures. This would reinforce the “slow-boil” inflation dynamic, making it increasingly difficult for central banks to stabilize prices without further tightening.
At the same time, a break below 45k in the DOW, particularly alongside rising yields, would confirm that “higher for longer” interest rate is actively eroding equity valuations. The most critical trigger, however, lies in the bond market. A decisive move in the 10-year yield toward or above 5% would risk a broader “VaR shock,” forcing institutional deleveraging and resetting the global risk-free rate. In such a scenario, the combined effect of rising yields and falling equities would mark the transition into a full stagflation-driven market adjustment.
Conclusion: Markets Shift from Event Risk to Stagflation Regime
Markets are undergoing a decisive shift from pricing short-term geopolitical risks to confronting a broader stagflationary regime. The combination of a “war of attrition”, “slow-boil” inflation, and the “dual shock” in oil and yields is redefining the macro landscape. This is no longer about isolated volatility—it is about a sustained change in how inflation, growth, and policy interact.
With central banks leaning toward tighter policy and markets increasingly focused on structural inflation risks, asset behavior is diverging from past cycles. Dollar’s rise as the “wrecking ball”, alongside the emergence of the “triple threat” as key market triggers, underscores this shift. Until there is a clear resolution to the underlying drivers, markets are likely to remain anchored in this new regime, where inflation persistence—not growth recovery—dictates direction.
Technical Outlook: “Triple Threat” Levels Come Into Focus Across Markets
As the macro backdrop shifts toward a stagflationary regime, price action across key assets is approaching critical technical inflection points. The “triple threat” framework—equities, yields, and oil—is now clearly reflected in charts, with multiple markets to test levels that will determine whether current moves extend into a broader structural shift or stabilize in the near term.
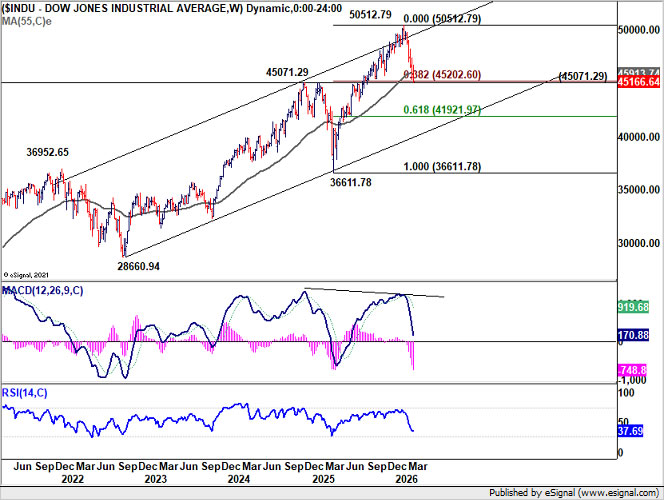
DOW
DOW’s decline from 50,512.79 resumed last week and is now approaching the key support zone around the 45k psychological level. This area is reinforced by 38.2% retracement of 36,611.78 to 50,512.79 at 45,202.26, as well as 2024 peak at 45,071.29, making it a critical confluence zone.
A strong rebound from this region, followed by a break above 46,718.42 resistance, would suggest that selling pressure has reached a near-term climax. Such a move would open the way for recovery toward the 55 D EMA (now at 47,799.33) and potentially higher.
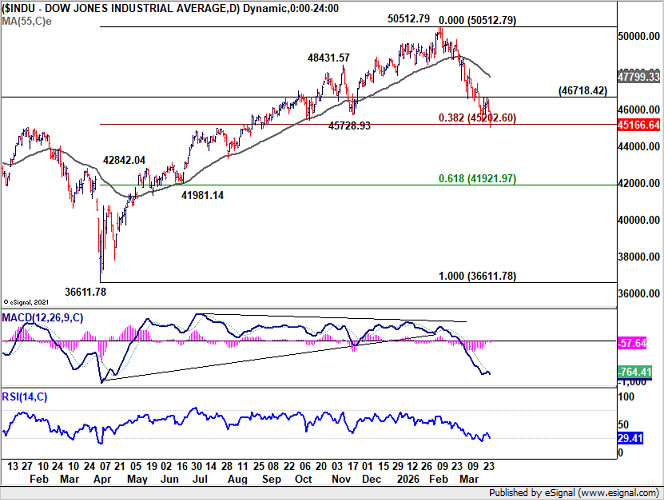
However, sustained break below 45k would signal a more significant shift. DOW could then be in reversal to the uptrend from 36,611.78 (2025 low), rather than merely correcting. In that case, deeper fall would be seen to 61.8% retracement at 41,921.97, or even further to multi-year channel floor near 40k.
NASDAQ
NASDAQ presents a similar technical picture. With current downside momentum remaining strong, the decline from 24,020.00 is likely to extend toward 38.2% retracement of 14,784.03 (2025 low) to 24,020.00 at 20,465.18.
The key support zone lies around the 20k psychological level, where 20,204.58 (2024 high) has turned into support. Strong rebound from this region, followed by break above 22,189.34 resistance, would suggest that the pullback has completed.
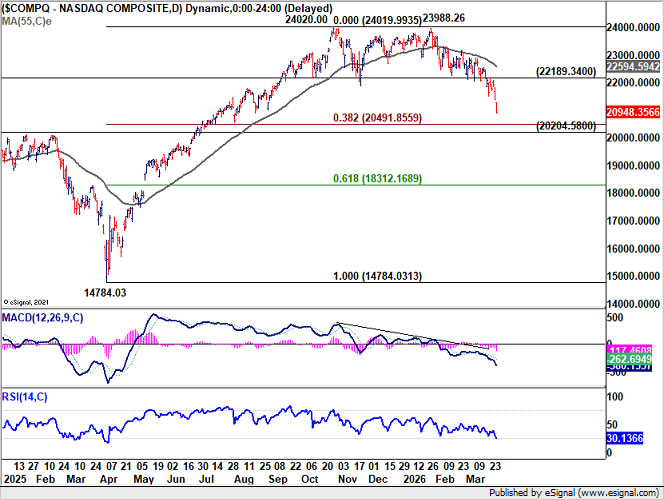
However, decisive break below 20k would open the door for deeper losses toward 61.8% retracement at 18,296.68, or even further toward long-term trendline support, currently around 16,700.
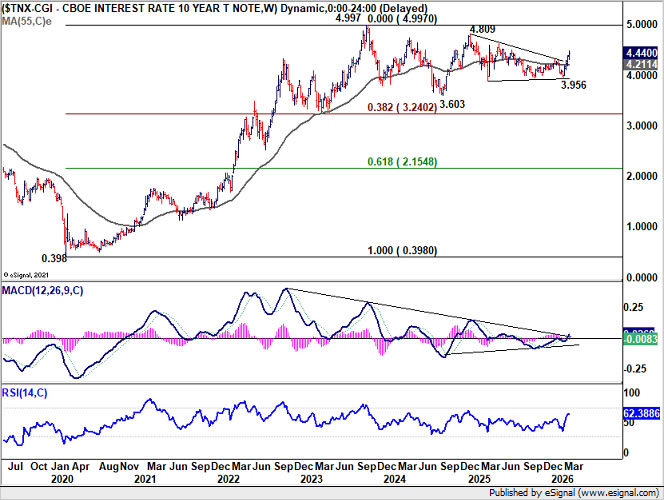
US 10-Year Yield
The US 10-year yield’s rally from 3.956 remains in an acceleration phase, as indicated by D MACD. While near-term volatility is possible, further upside is favored as long as 55 D EMA (now at 4.201) holds.
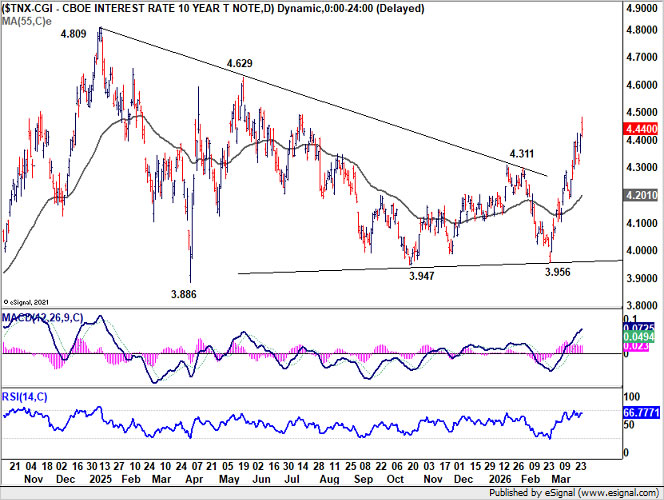
The next key target is 4.629 resistance. Firm break there will solidify the case that 10-year yield is actually extending the rise from 3.603 (2024 low), and set up further rise through 4.809 resistance to take on 4.997 (2023 high).
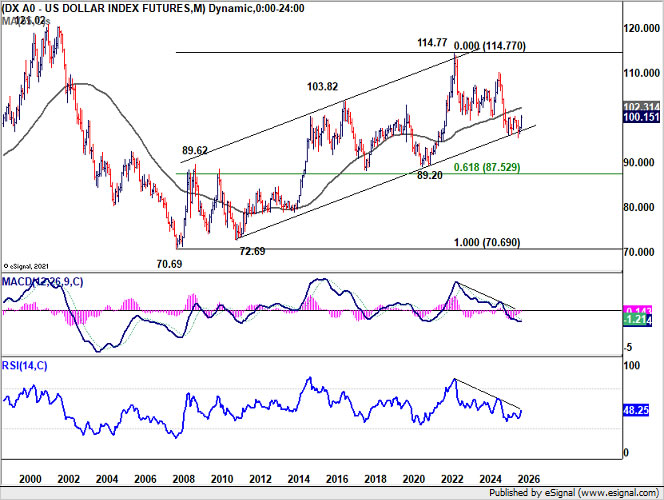
Dollar Index
Dollar Index hovered inside established range last week. With 98.49 support intact, further rally is still expected. Rise fro 95.55 low should extend to key resistance at 38.2% retracement of 110.17 to 95.55 at 101.13. Reaction from there will be important to determine Dollar Index's medium term trend.
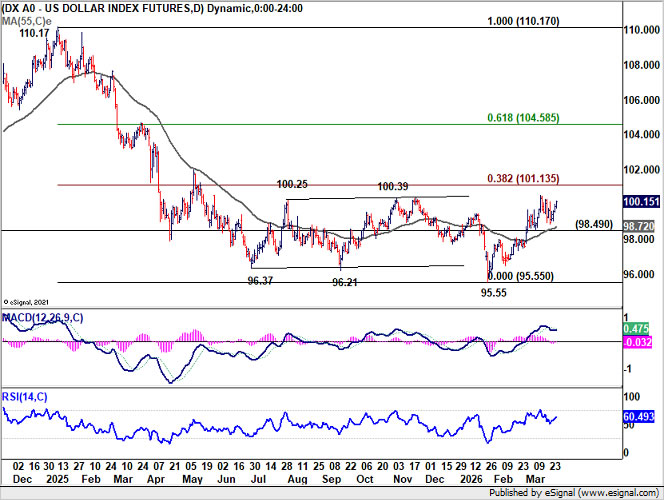
More importantly, it should be emphasized that Dollar Index has just rebounded from the multi decade channel floor. Firm break of 55 M EMA (now at 102.31) will indicate that the whole down trend from 114.77 (2022 high) has completed as a three wave correction to 95.55. The would open up the case for resuming the up trend from 70.69 (2008 low) through 114.77 in the medium term.
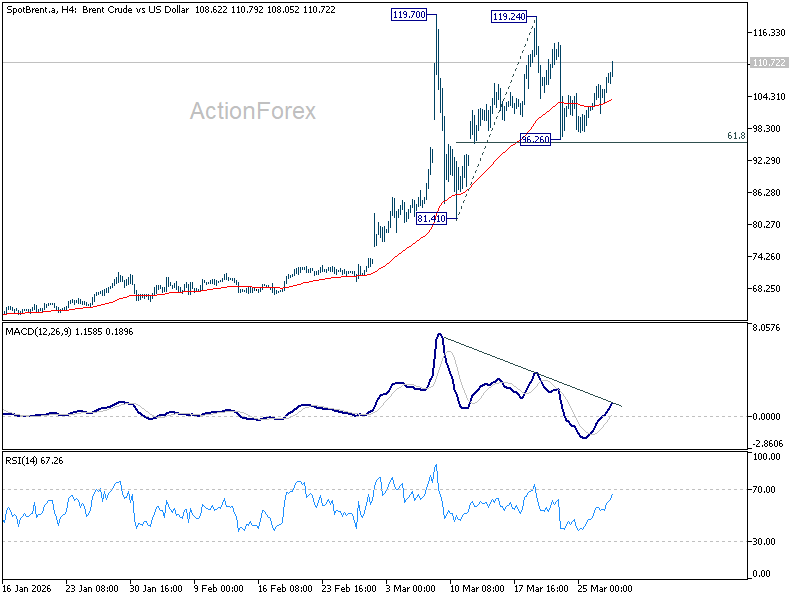
Brent Crude (Near-Term)
The extended rebound in Brent crude suggests that the pullback from 119.24 has likely completed at 96.26, just ahead of 61.8% retracement of 81.41 to 119.24 at 95.86. Further gains are expected as long as the 55 4H EMA (now at 103.73) holds. The next target is a retest of the 119.24–119.70 resistance zone. Decisive break above this area would confirm that the broader uptrend is resuming.
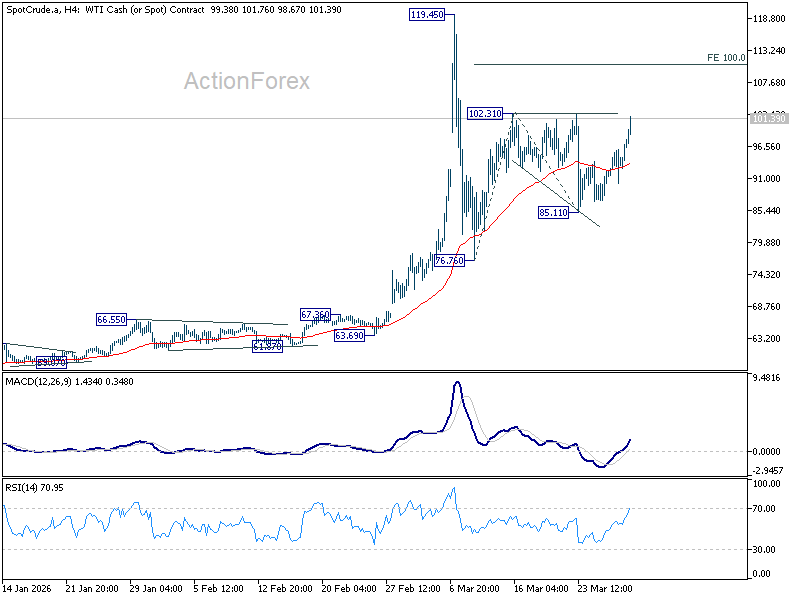
WTI Crude (Near-Term)
WTI crude’s sharp rebound indicates that the correction from 102.31 has likely completed at 85.11. Immediate focus is now on 102.31 resistance. Firm break above this level would resume the rebound from 76.76, targeting 100% projection of 76.76 to 102.31 from 85.11 at 110.66, with further upside potential toward a retest of the 119.45 high.
USD/CAD Weekly Outlook
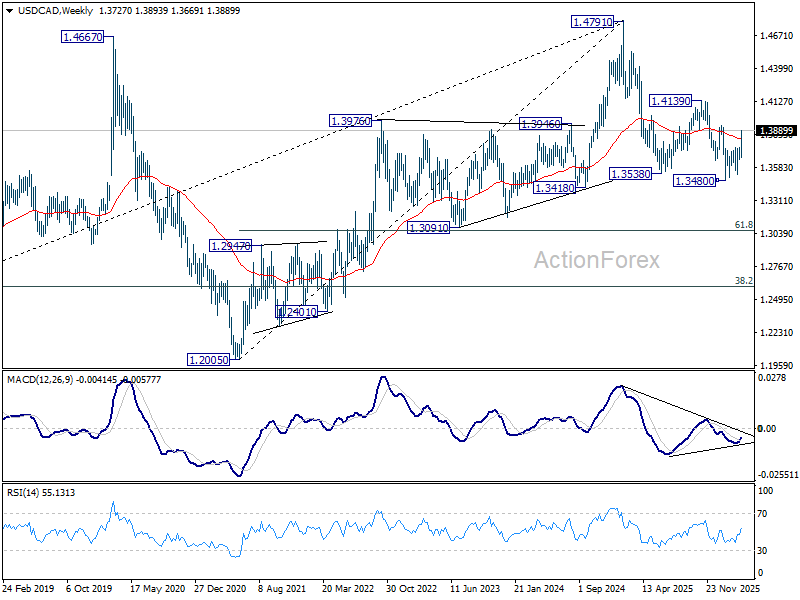
USD/CAD's rebound from 1.3480 accelerated high last week. Initial bias stays on the upside this week for 38.2% retracement of 1.4791 to 1.3480 at 1.3981. Decisive break there will argue that it's already reversing the whole down trend from 1.4791, and target 61.8% retracement at 1.4290. On the downside, below 1.3844 minor support will turn intraday bias neutral first. But risk will stay on the upside as long as 1.3751 resistance turned support holds, in case of retreat.
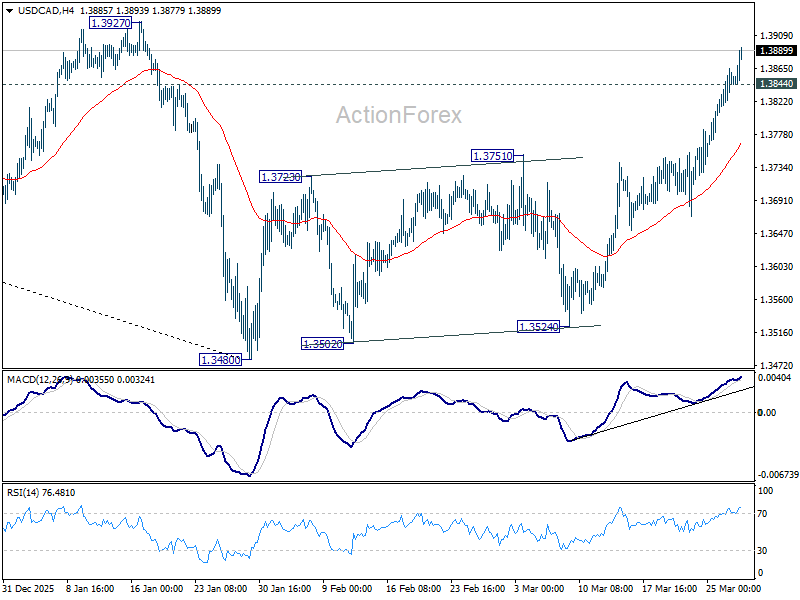
In the bigger picture, price actions from 1.4791 are seen as a corrective pattern to the whole up trend from 1.2005 (2021 low). Deeper fall could be seen, as the pattern extends, to 61.8% retracement of 1.2005 to 1.4791 at 1.3069. However, break of 1.3927 resistance will argue that the correction has completed with three waves down to 1.3480 already. Further break of 1.4139 will confirm and bring retest of 1.4791 high.
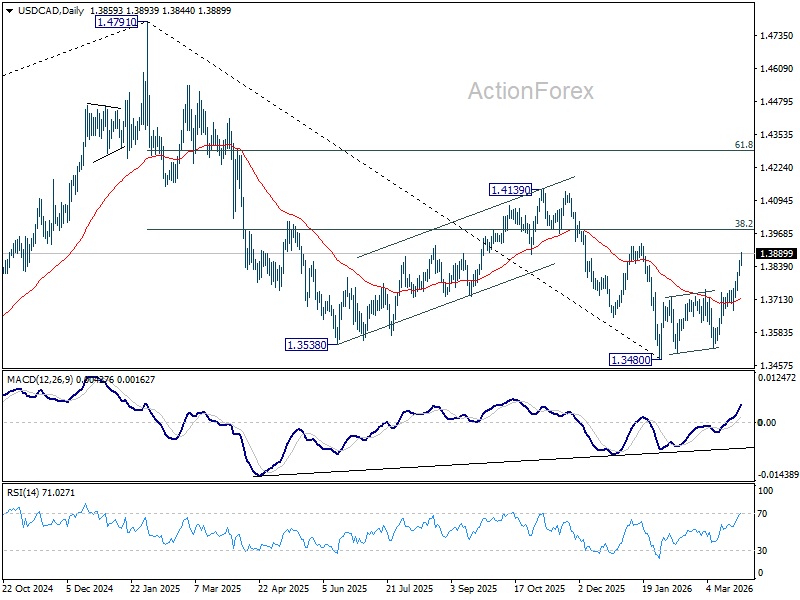
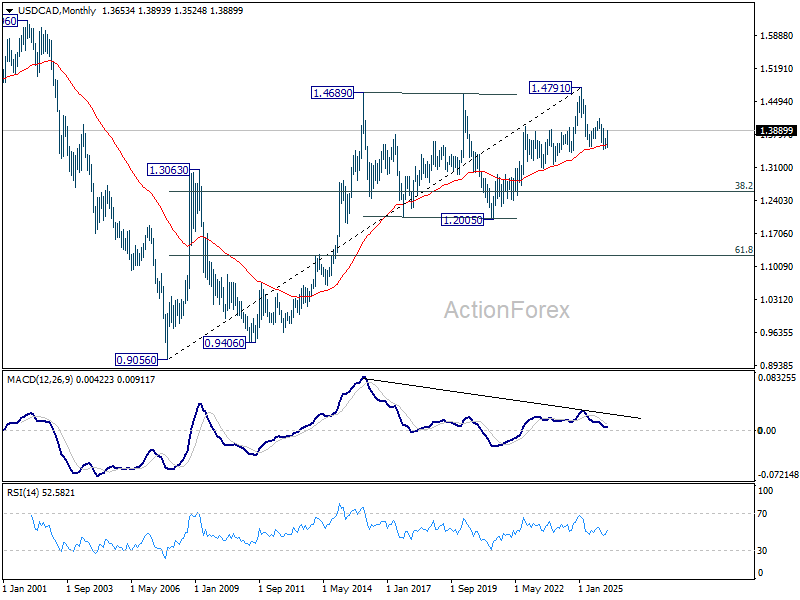
In the long term picture, rising 55 M EMA (now at 1.3574) remains intact. Thus, up trend from 0.9056 (2007 low) could still be in progress. However, considering bearish divergence condition M MACD, sustained trading below 55 M EMA will argue that the up trend has completed with five waves up to 1.4791, and turn medium term outlook bearish for correction to 38.2% retracement of 0.9056 to 1.4791 at 1.2600.