
Sample Category Title
AUD/USD Daily Report
Daily Pivots: (S1) 0.6853; (P) 0.6907; (R1) 0.6941; More...
Intraday bias in AUD/USD on the downside as this point. Fall from 0.7187 is seen as correcting the whole up trend from 0.5913. Deeper decline would be seen to 38.2% retracement of 0.5913 to 0.7187 at 0.6700. On the upside, though, above 0.6956 minor resistance will turn intraday bias neutral again first.
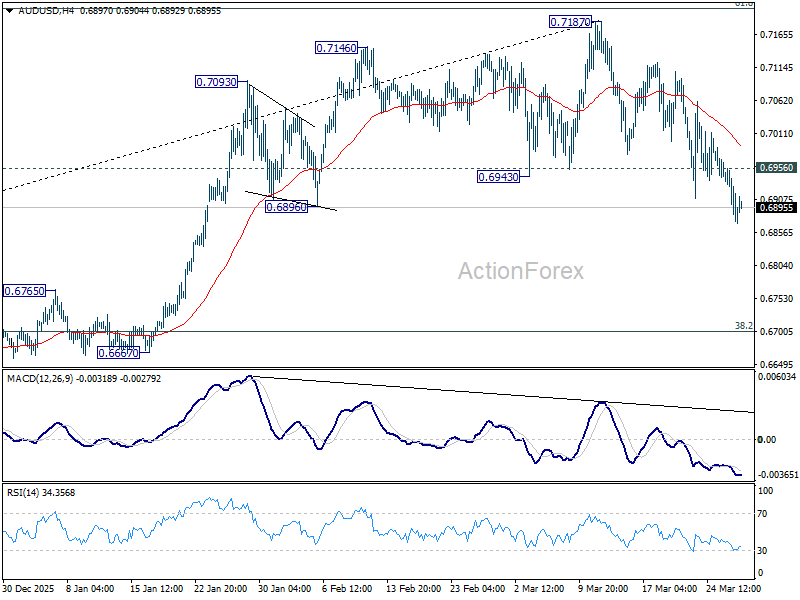
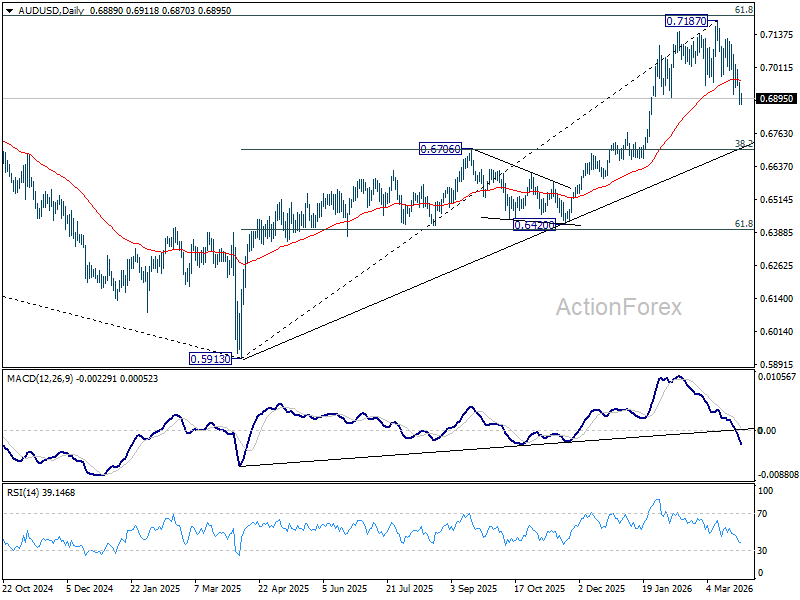
In the bigger picture, current development argues that rise from 0.5913 (2024 low) is reversing whole down trend from 0.8006 (2021 high). Decisive break of 61.8% retracement of 0.8006 to 0.5913 at 0.7206 will pave the way back to 0.8006. This will remain the favored case as long as 0.6706 resistance turned support holds, even in case of deep pullback.
USD/CAD Daily Outlook
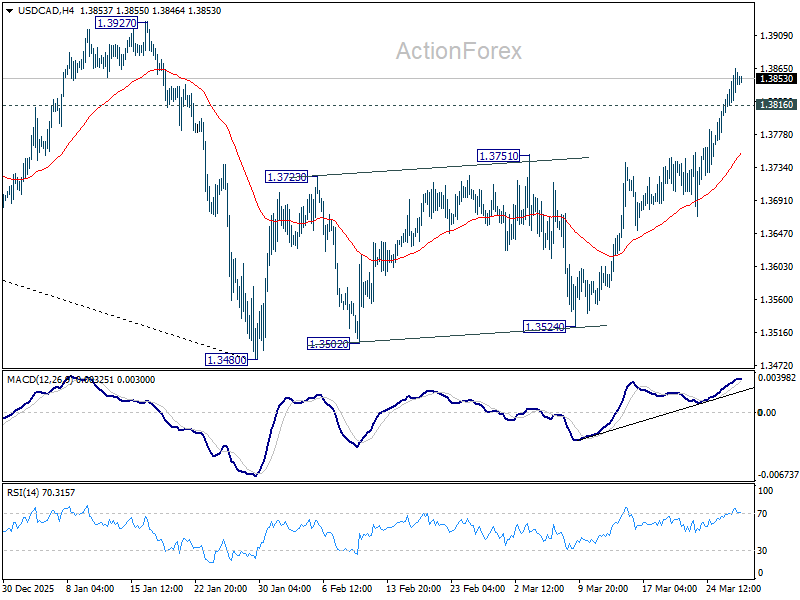
Daily Pivots: (S1) 1.3820; (P) 1.3844; (R1) 1.3886; More...
USD/CAD's rally from 1.3480 is in progress and intraday bias remains on the upside. It's seen as correcting the whole down trend from 1.4791 and should target 1.3927 resistance, or probably further to 38.2% retracement of 1.4791 to 1.3480 at 3981. On the downside, below 1.3816 minor support will turn intraday bias neutral first.
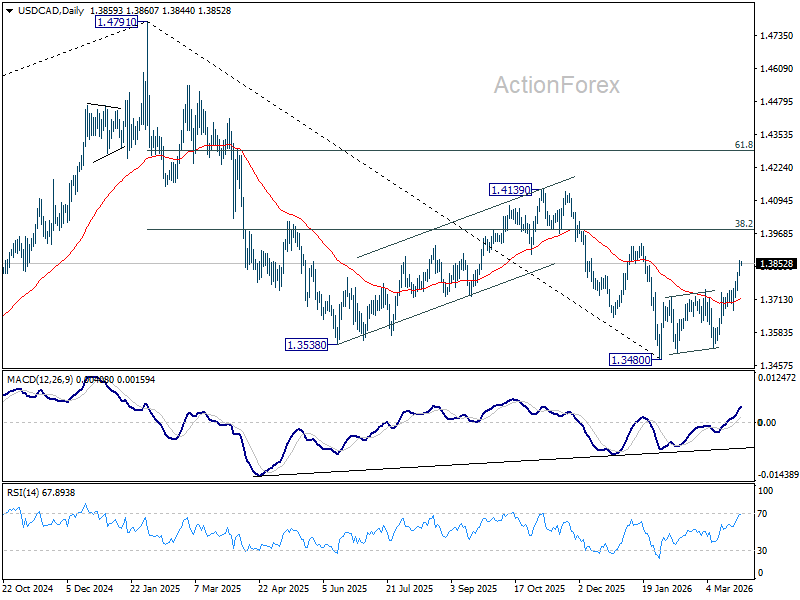
In the bigger picture, price actions from 1.4791 are seen as a corrective pattern to the whole up trend from 1.2005 (2021 low). Deeper fall could be seen, as the pattern extends, to 61.8% retracement of 1.2005 to 1.4791 at 1.3069. However, break of 1.3927 resistance will argue that the correction has completed with three waves down to 1.3480 already.
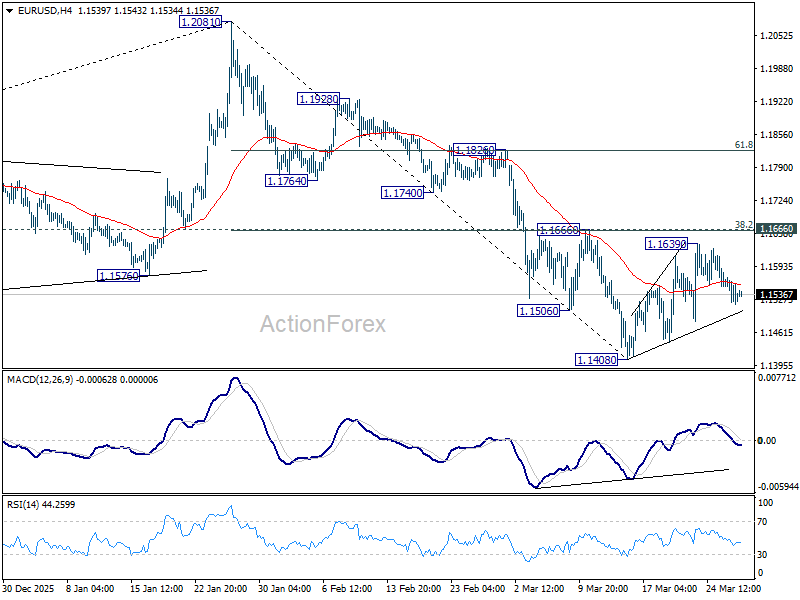
EUR/USD Daily Outlook
Daily Pivots: (S1) 1.1508; (P) 1.1541; (R1) 1.1562; More….
EUR/USD is still bounded in consolidations above 1.1408 and intraday bias remains neutral. With 1.1666 cluster resistance (38.2% retracement of 1.2081 to 1.1408 at 1.1665) intact, further decline is in favor. On the downside, below 1.1408 will resume the fall from 1.2081 to 38.2% retracement of 1.0176 to 1.2081 at 1.1353. However, decisive break of 1.1666 will argue that the fall from 1.2081 has completed, and turn bias back to the upside for 61.8% retracement of 1.2081 to 1.1408 at 1.1824.
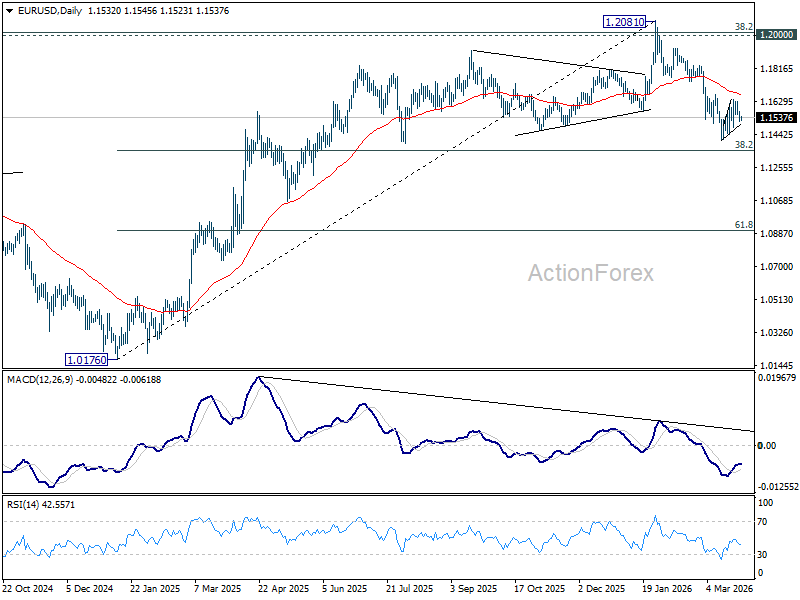
In the bigger picture, prior break of 55 W EMA (now at 1.1501) should confirm rejection by 1.2 key cluster resistance level. The whole up trend from 0.9534 (2022 low) might have completed as a three wave corrective rise too. Deeper fall is expected to long term channel support (now at 1.0528). Meanwhile, risk will stay on the downside as long as 1.2081 holds, even in case of strong rebound.
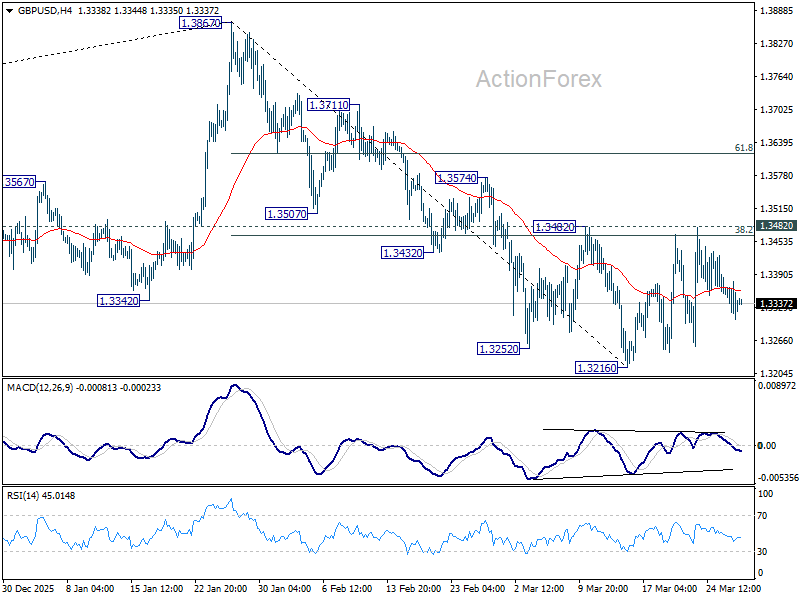
GBP/USD Daily Outlook
Daily Pivots: (S1) 1.3301; (P) 1.3340; (R1) 1.3369; More...
Range trading continues in GBP/USD and intraday bias remains neutral. With 1.3482 resistance intact, further decline is in favor. On the downside, below 1.3216 will resume the fall from 1.3867 to 1.3008 structural support. However, decisive break of 1.3482 will argue that the fall from 1.3867 has completed, and turn bias back to the upside for 61.8% retracement of 1.3867 to 1.3216 at 1.3618.
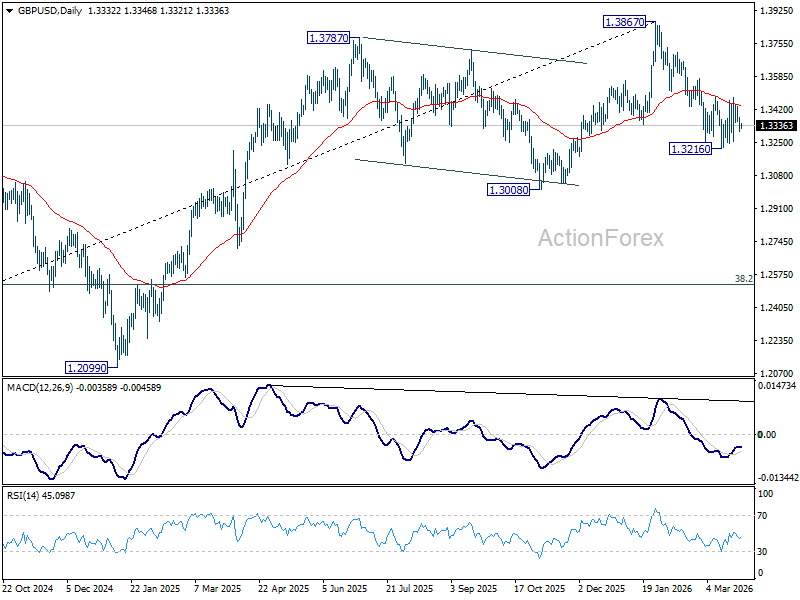
In the bigger picture, considering bearish divergence condition in both D and W MACD, a medium term top should be in place at 1.3867. Firm break of 1.3008 support will argue that fall from 1.3867 is at least correcting the rise from 1.0351 (2022 low) with risk of bearish reversal. That would open up further decline to 38.2% retracement of 1.0351 to 1.3867 at 1.2524. For now, medium term outlook will be neutral at best as long as 1.3867 resistance holds, or until further development.
USD/JPY Daily Outlook
Daily Pivots: (S1) 159.42; (P) 159.64; (R1) 159.98; More...
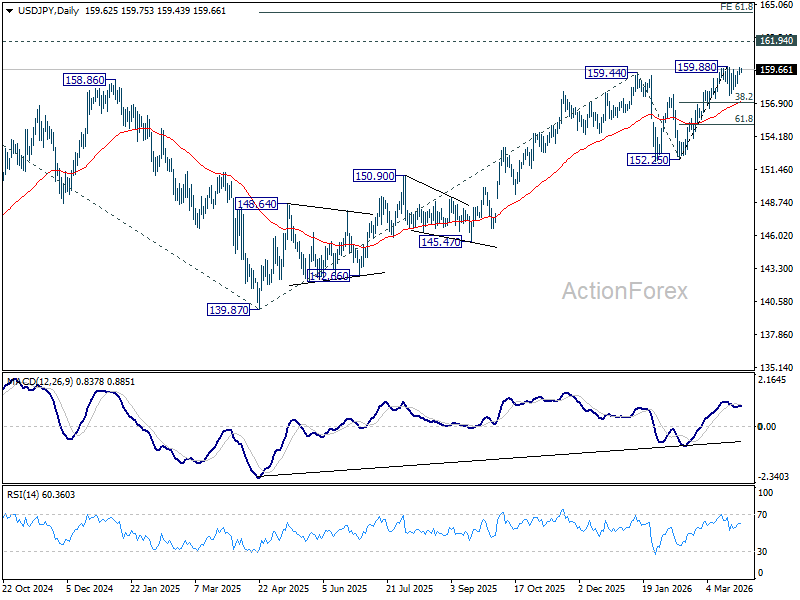
Range trading continues in USD/JPY and intraday bias stays neutral. Consolidation from 159.88 could extend with another falling leg. But in that case, downside should be contained by 38.2% retracement of 152.25 to 159.88 at 156.96 to bring rebound. On the upside, break of 159.88 will target a test on 161.94 high.
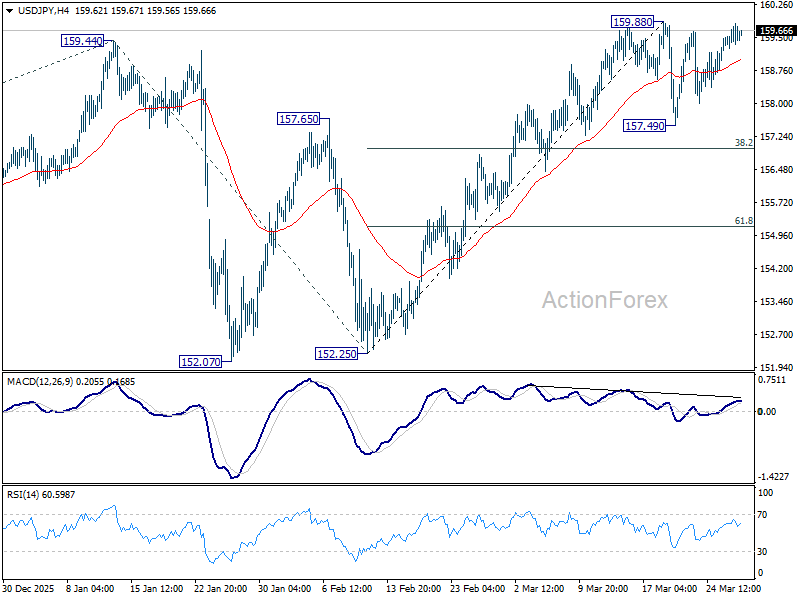
In the bigger picture, outlook is unchanged that corrective pattern from 161.94 (2024 high) should have completed with three waves at 139.87. Larger up trend from 102.58 (2021 low) could be ready to resume through 161.94. This will remain the favored case as long as 55 W EMA (now at 152.70) holds. Firm break of 161.94 will pave the way to 61.8% projection of 102.58 to 161.94 from 139.87 at 176.75.
USD/CHF Daily Outlook
Daily Pivots: (S1) 0.7924; (P) 0.7942; (R1) 0.7972; More….
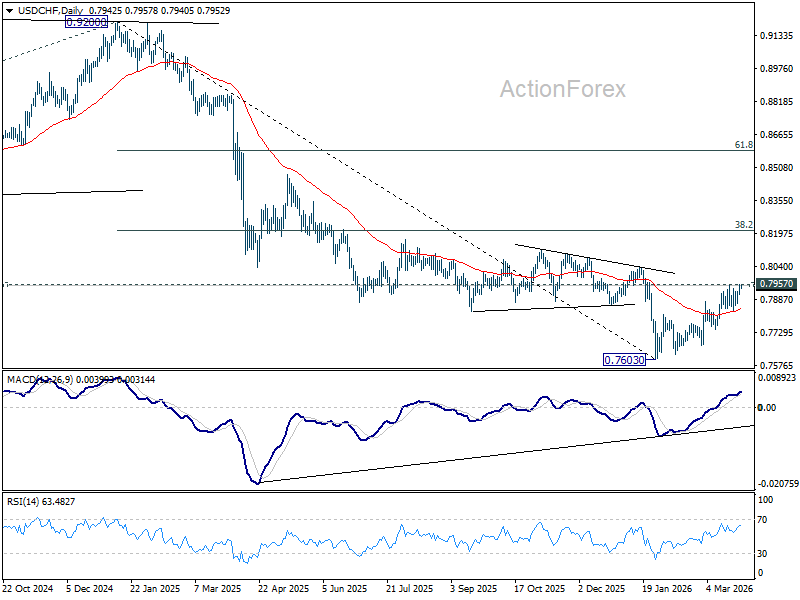
Immediate focus is now on 0.7957 resistance in USD/CHF as rebound from 0.7833 extends. Firm break there will resume the rise from 0.7603, as correction to the downtrend from 0.9200, and target 38.2% retracement of 0.9200 to 0.7603 at 0.8213. For now, further rise is expected as long as 0.7833 support holds, in case of another retreat.
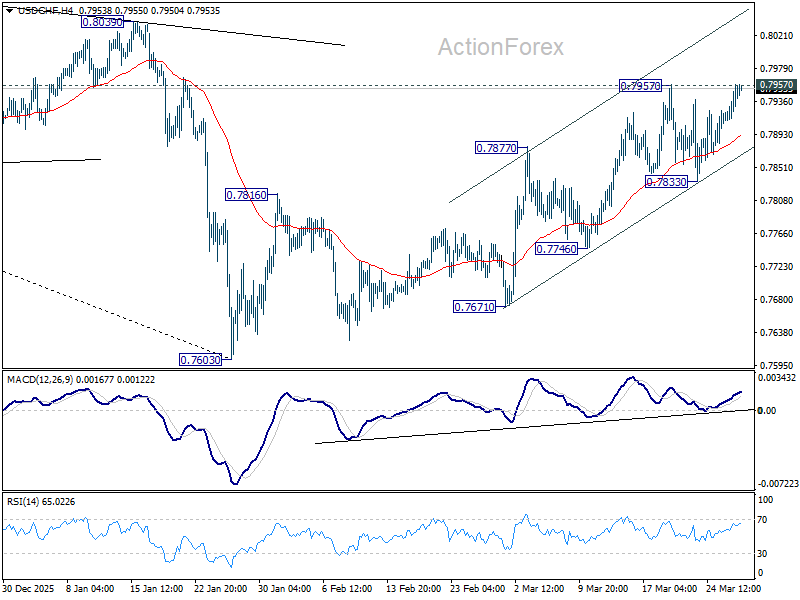
In the bigger picture, a medium term bottom should be in place at 0.7603 on bullish convergence condition in D MACD. Rebound from there is seen as correcting the fall from 0.9200 only. However, decisive break of 55 W EMA (now at 0.8085) will suggest that it's probably correcting the larger scale down trend from 1.0146 (2022 high). On the other hand, rejection by the 55 W EMA will setup down trend resumption to 100% projection of 1.0146 (2022 high) to 0.8332 from 0.9200 at 0.7382 at a later stage.
Iran Strike Pause: Slow-Boil Inflation Nightmare Scenario Keeps Dollar on Top
The latest 10-day extension of the Iran strike pause by US President Donald Trump might act as a “relief valve”, preventing a freefall in stocks. But it has also created a "slow-boil" inflation trap that is forcing a dramatic global monetary policy reversal. Contrary to providing a sentiment boost, Trump’s extension is paralyzing equity markets—preventing both a final capitulation and a meaningful recovery. This fundamental deadlock is keeping Dollar firmly at the top of the weekly performance table.
The "nightmare scenario" currently haunting global central banks is the transition from first-round to second-round inflationary effects. Typically, policymakers "look through" volatile energy spikes, but oil hovering at $105 for weeks is a different beast. It is high enough to infiltrate every layer of the economy—from plastics and transport to fertilizer—but not "explosive" enough to cause the immediate demand collapse that would naturally cool the market. This "slow boil" is exactly what leads manufacturers and logistics firms to stop absorbing costs and start passing them on to the final consumer.
The shift in rhetoric from the world’s most influential central banks has been swift. Bundesbank President Joachim Nagel, a noted hawk, has pivoted from discussing potential rate cuts to a 25bps "insurance hike" in April to protect the ECB's 2% target. Similarly, the Fed’s trajectory has undergone a massive reversal; after starting the year with expectations for multiple cuts, the market now assigns a near 50% chance of a rate hike in 2026.
As long as the Iran war drags on, the likelihood of inflation becoming entrenched grows, leaving central banks with no choice but to tighten.
Ultimately, Trump’s 10-day "relief valve" is a double-edged sword for investors. While it prevents a total market capitulation today, it also kills any appetite for "dip buying." Professional investors remain on the sidelines, paralyzed by the uncertainty of whether April 7 brings a diplomatic resolution or a regional energy war. This will keep the risk markets pressured, at least in the short term.
In the currency markets, this has solidified a clear hierarchy: Dollar and Sterling are the dominant beneficiaries, while growth-sensitive currencies like the Australian and New Zealand Dollars remain at the bottom of the pile.
In Asia, at the time of writing, Nikkei is down -0.12%. Hong Kong HSI is up 0.68%. China Shanghai SSE is up 0.70%. Singapore Strait Times is up 0.64%. Japan 10-year JGB yield is up 0.099 at 2.373. Overnight, DOW fell -1.01%. S&P 500 fell -1.74%. NASDAQ fell -2.38%. 10-year yield rose 0.088 to 4.416.
Stagflation Trap Could Tie RBA's Hawkish Hand, and Send AUD/JPY to 103
AUD/JPY is under pressure as rising geopolitical risks and surging energy and fertilizer costs create a stagflation threat for Australia. While markets still price a May RBA hike, growing concerns over a growth slowdown are raising doubts about further tightening. As expectations shift, the cross is at risk of a deeper correction toward the 103 level. Read More.
Fed Shifts Focus Back to Inflation as Officials See Labor Market in Balance
Federal Reserve officials are shifting focus back to inflation as the labor market is increasingly seen as balanced. Jefferson, Barr, and Cook warn that rising energy prices could push inflation higher and risk becoming entrenched if sustained. With policymakers prioritizing inflation risks over growth concerns, expectations for rate cuts are being pushed back, reinforcing a higher-for-longer outlook. Read More.
Oil Not a Simple Boost as BoC Rogers Flags Inflation and Growth Risks
Oil is no longer a clear tailwind for the Canadian Dollar, as Bank of Canada’s Carolyn Rogers warns that the latest energy surge is lifting inflation while weighing on growth. While higher oil prices support export income, rising costs are squeezing households and businesses, raising concerns about demand and investment. Read More.
USD/CHF Daily Outlook
Daily Pivots: (S1) 0.7924; (P) 0.7942; (R1) 0.7972; More….
Immediate focus is now on 0.7957 resistance in USD/CHF as rebound from 0.7833 extends. Firm break there will resume the rise from 0.7603, as correction to the downtrend from 0.9200, and target 38.2% retracement of 0.9200 to 0.7603 at 0.8213. For now, further rise is expected as long as 0.7833 support holds, in case of another retreat.
In the bigger picture, a medium term bottom should be in place at 0.7603 on bullish convergence condition in D MACD. Rebound from there is seen as correcting the fall from 0.9200 only. However, decisive break of 55 W EMA (now at 0.8085) will suggest that it's probably correcting the larger scale down trend from 1.0146 (2022 high). On the other hand, rejection by the 55 W EMA will setup down trend resumption to 100% projection of 1.0146 (2022 high) to 0.8332 from 0.9200 at 0.7382 at a later stage.
USD/JPY Advances, Bulls Aim for Break Toward New Highs
Key Highlights
- USD/JPY started a fresh increase above 158.80 and 159.00.
- A bullish trend line is forming with support at 159.00 on the 4-hour chart.
- EUR/USD failed to clear the 1.1620 resistance zone and trimmed gains.
- Gold prices are again moving lower and might revisit $4,200.
USD/JPY Technical Analysis
The US Dollar remained supported above 158.00 against the Japanese Yen. USD/JPY regained traction and climbed above 158.80.
Looking at the 4-hour chart, the pair settled well above 158.80, the 100 simple moving average (red, 4-hour), and the 200 simple moving average (green, 4-hour). The pair cleared the 76.4% Fib retracement level of the downward move from the 159.65 swing high to the 158.01 low.
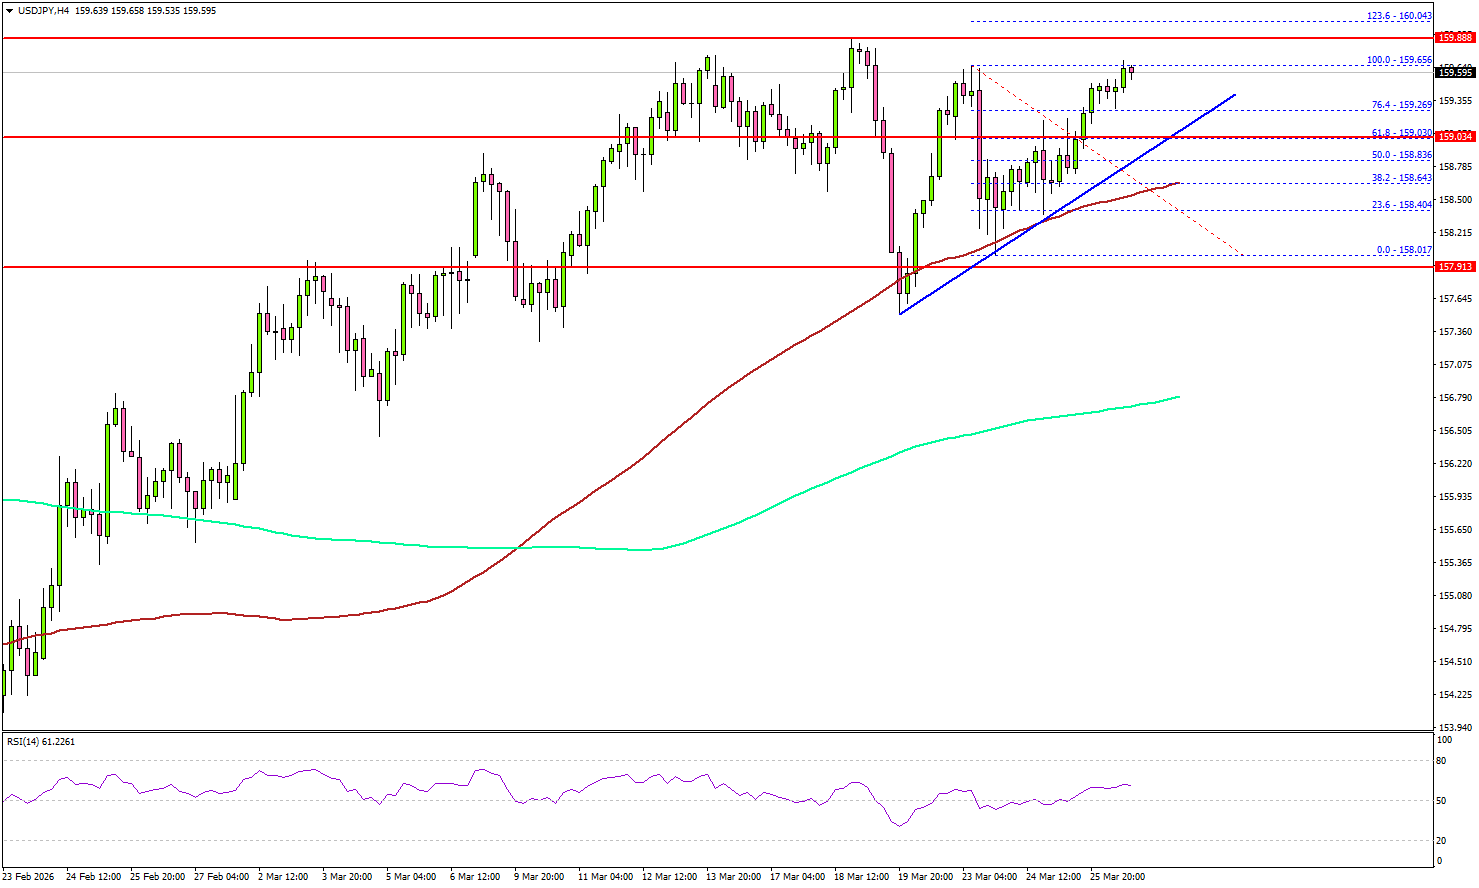
On the upside, the pair is now facing sellers near 159.80. The first major resistance sits at 160.00 or the 1.236 Fib extension level of the downward move from the 159.65 swing high to the 158.01 low.
A close above 160.00 could open the doors for gains above 160.80. In the stated case, the bulls could aim for a move to 162.00.
If there is no upside break above 160.00, the pair might start a fresh decline. Immediate support is seen near 159.00. The first key support sits at 158.80. A close below 158.80 might call for heavy losses. In the stated case, it could even revisit 157.50 in the coming days.
Looking at Gold, the price is signaling a fresh decline, and there are chances of a drop toward the $4,200 level.
Upcoming Key Economic Events:
- Fed's Barkin speech.
- Fed's Daly speech.
- Fed's Paulson speech.
Stagflation Trap Could Tie RBA’s Hawkish Hand, and Send AUD/JPY to 103
AUD/JPY’s selloff is accelerating as renewed risk aversion combines with a growing “stagflation trap” that is undermining the Reserve Bank of Australia’s hawkish outlook. While markets still price around a 72% chance of a May rate hike, surging energy and fertilizer costs are increasingly seen as a drag on growth rather than a simple inflation boost. As expectations begin to shift, the cross is at risk of a deeper medium-term correction toward the 103 region.
The broader backdrop is turning more defensive. Escalation risks in the Middle East remain elevated, with mixed messaging from US President Donald Trump—from ultimatums to extended pauses—failing to provide clarity. Rather than calming markets, the developments have prolonged uncertainty, keeping oil prices elevated and risk sentiment fragile.
This risk-off tone is weighing directly on the Aussie as AUD/JPY has emerged as one of the clearest expressions of this shift, with the pair among the biggest movers this week and downside momentum building.
At the same time, markets are reassessing the RBA’s policy path. The central bank’s March 17 hike was delivered on a narrow 5–4 split, already signaling internal divisions. While expectations for another hike in May remain firm, confidence in that outcome is becoming more fragile as new risks emerge.
The key issue is Australia's heavy reliance on imported refined fuels. Sustained Brent prices above 100 are feeding through into higher transport and business costs, raising inflation while simultaneously weighing on growth—a classic stagflation setup. The fertilizer shock adds extra pressure. Australia sources over 40% of its fertilizer imports from the Middle East, particularly Urea. With disruptions around the Strait of Hormuz, Urea prices have surged more than 30% in March, sharply increasing input costs for the agricultural sector. This threatens to squeeze farm margins and reduce output, while pushing food prices higher.
Taken together, these dynamics are complicating the RBA’s policy calculus. Inflation pressures argue for tightening, but the growth hit from rising costs and uncertainty raises the risk that further hikes could exacerbate the slowdown. Some market participant could start to speculate whether the balance could tilt toward a pause in May.
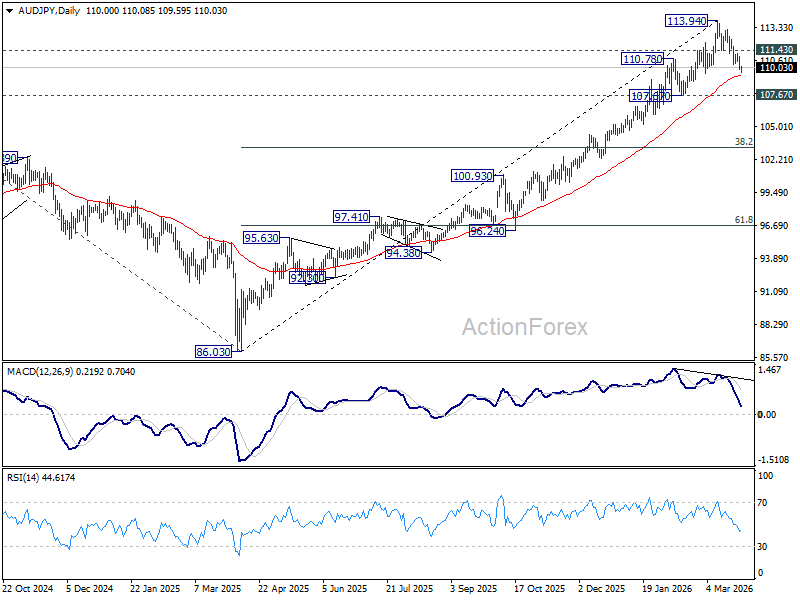
Technically, AUD/JPY is showing signs of a medium-term top, with bearish divergence visible in D MACD. The break of 110 level leaves it vulnerable, with immediate focus on the 55 D EMA (now at 109.31). Sustained trading below this level would open the door for a deeper pullback to 107.67 support next.
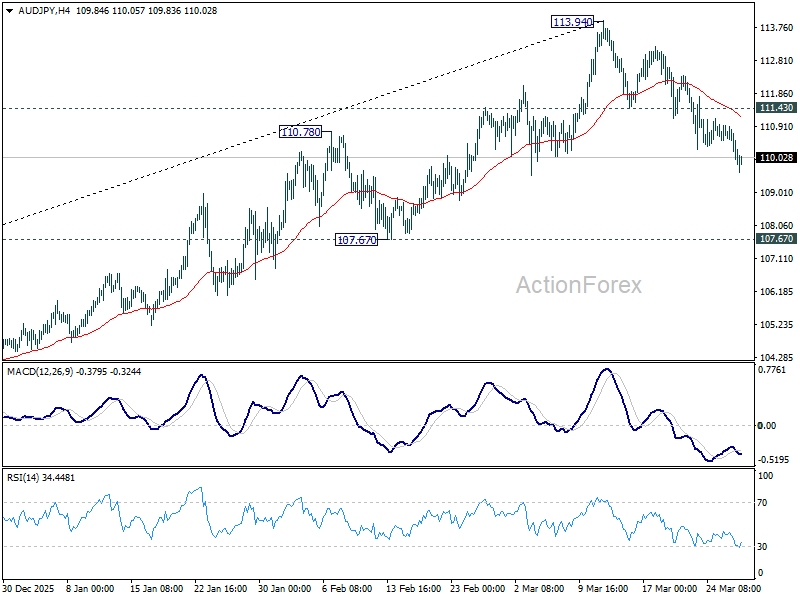
Decisive break of 107.67 will confirm that AUD/JPY is already correcting whole up trend from 86.03 (2025 low) and bring deeper decline to 38.2% retracement of 86.03 to 113.94 at 103.27.
Conversely, a strong rebound from current levels and a break above 114.30 would suggest the uptrend remains intact, though this scenario appears less likely as macro headwinds build.
Fed Shifts Focus Back to Inflation as Officials See Labor Market in Balance
Federal Reserve officials are signaling a shift in priorities, with the labor market increasingly viewed as “in balance” while inflation risks regain prominence. Comments from Philip Jefferson, Michael Barr, and Lisa Cook highlight a subtle but important pivot: employment conditions are no longer the primary concern, as attention turns back to rising price pressures driven by the Middle East energy shock.
Vice Chair Jefferson said he expects overall inflation to rise in the near term, reflecting higher energy prices stemming from the conflict. He emphasized that the duration of the shock will be critical—short-lived disruptions may only affect the economy for a quarter or two, but sustained increases in oil prices could have more material implications for both inflation and growth.
Governor Barr added that the key risk is a shift in "inflation expectations", which could lead to more entrenched price dynamics. He emphasized the importance of assessing how long energy prices remain elevated, with prolonged shocks posing a greater threat to both inflation and the broader economy.
Separately, Governor Cook further reinforced the message, stating that while overall risks are balanced, inflation risks are "greater right now:. This marks a clear change in emphasis, as policymakers prioritize containing inflation over responding to potential growth weakness.
Meanwhile, the labor market is seen as "balanced". Officials pointed to low hiring and downside risks, suggesting that while employment conditions are stable for now, they could weaken if shocks intensify.
Overall, the comments reflect a return to inflation vigilance. Rate cuts are being delayed, and while policy remains on hold for now, the balance of risks has shifted.