Sample Category Title
USDCHF Upleg Extends to 50-SMA
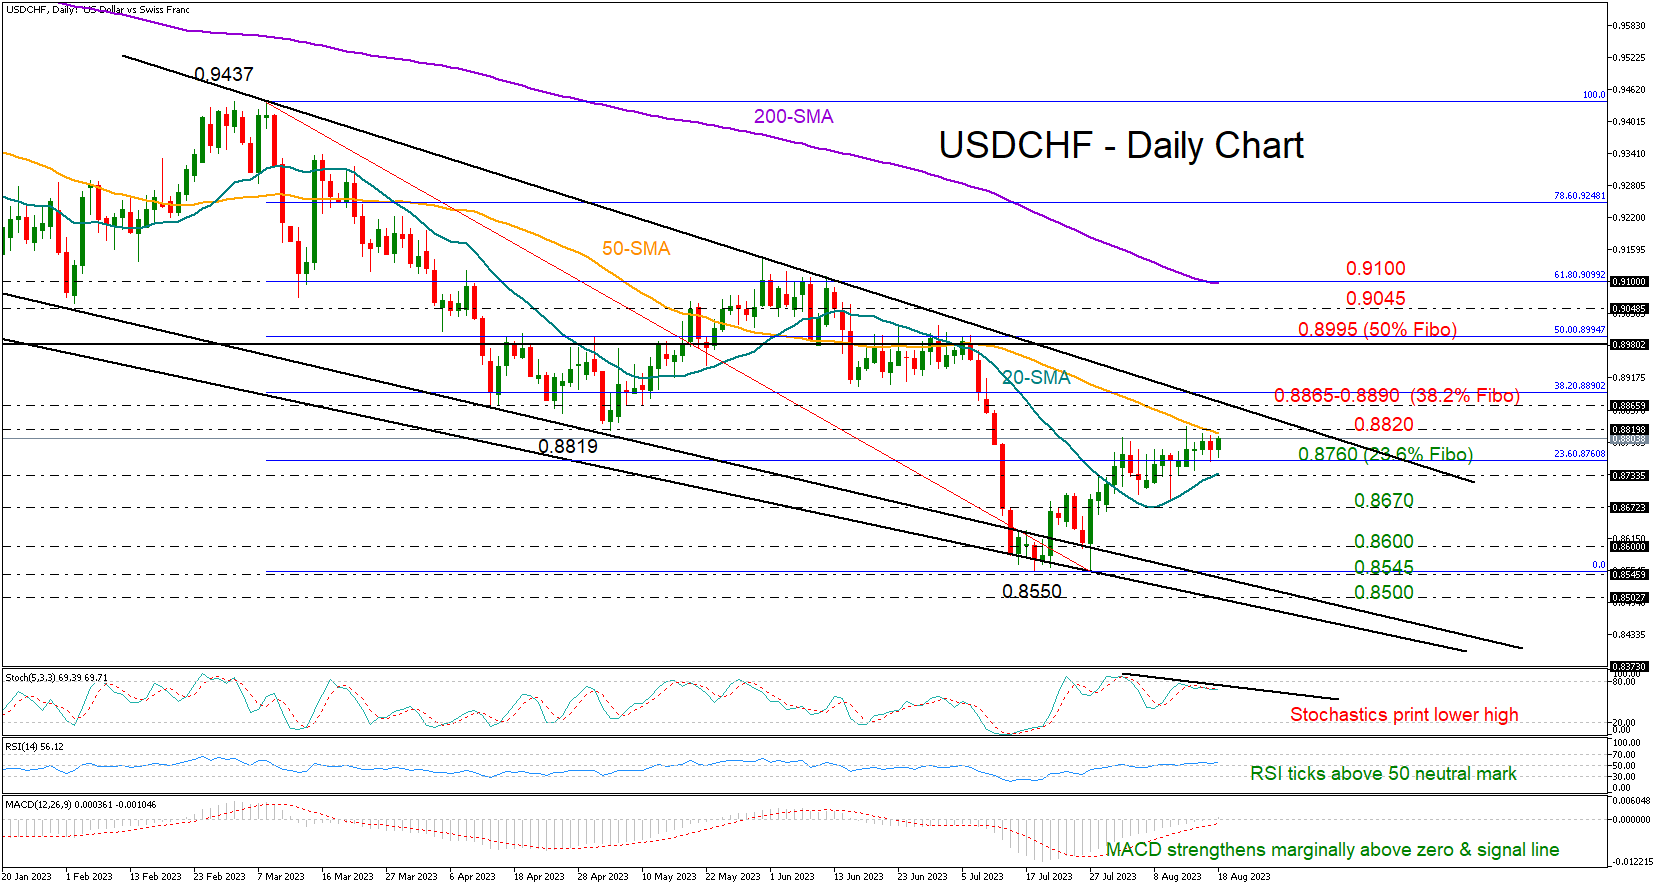
USDCHF is worth watching in the coming sessions as its recent upswing caught up to the 50-day simple moving average (SMA) and the 0.8800 level.
Technical signals are mixed. The RSI and the MACD have moderately strengthened above their neutral levels for the first time in two months, increasing speculation that the bull run could develop higher. On the other hand, the stochastic oscillator has confirmed a lower high below its 80 overbought level, mirroring some caution among traders.
If buying interest resumes above the 50-day SMA and May’s trough of 0.8819, the bulls may face a tougher obstacle around the resistance trendline from March at 0.8865. The 38.2% Fibonacci mark of the 0.9437-0.8550 downleg is also within a breathing distance at 0.8890. A decisive close above that barricade could trigger a new bull run towards the 50% Fibonacci of 0.8990, where the price faced a challenging battle during April-July. Still, only a sustainable extension above June’s ceiling and the 200-day SMA at 0.9100 would signal a bullish trend reversal in the big picture.
Alternatively, the price may ease to seek support somewhere between the 23.6% Fibonacci of 0.8760 and the 20-day SMA at 0.8733. If the 0.8670 constraining area cracks too, the downfall could worsen towards the 0.8600-0.8545 base.
Summing up, USDCHF retains its upleg from July lows, but the upcoming sessions could be somewhat burdensome as a major resistance area lays overhead.
USD/JPY: Larger Bulls Started to Lose Traction, Deeper Drop to Sideline Intervention risk
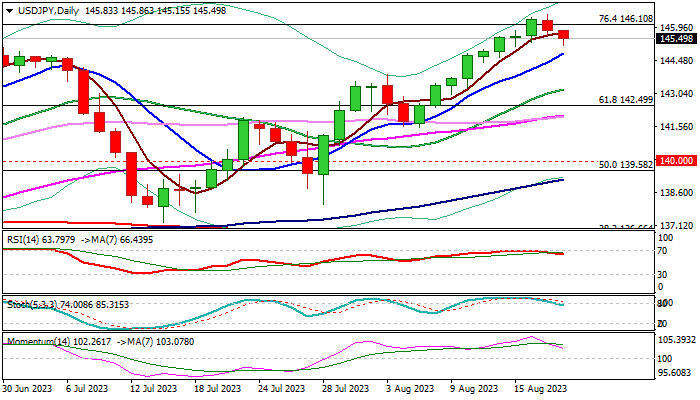
The pair is holding in red for the second consecutive day, as larger bulls were hurt by fresh risk aversion, with overbought daily studies prompting traders to start collecting profits.
Bulls probed through Fibo resistance at 146.10 (76.4% of 151.94/127.22), but so far without clear break higher that keeps in play risk of pullback.
Weekly close below 146.10 pivot would generate initial signal top and keep the downside vulnerable, with return below 145 level (reinforced by rising 10DMA), to increase likelihood of deeper pullback, as this likely ease pressure on Bank of Japan to intervene and support the national currency.
On the other hand, weekly close above 146.10 Fibo level would signal that larger bulls hold grip and are likely to resume after narrow consolidation.
Bearish scenario – loss of 145 handle would open way for attack at next pivotal support at 143.00 (Fibo 38.2% of 137.23/146.56) with risk of deeper fall on break of this point.
Bullish scenario – sustained break above 146.10 would expose targets at 148.82 (Nov 22 peak) and 150.00 (psychological).
Res: 146.10; 146.56; 147.00; 148.82.
Sup: 145.00; 144.80; 144.36; 143.00.
British Pound Edges Lower on Soft Retail Sales Report
- UK retail sales post a sharp decline
- Rainy weather and high prices weighed on consumer spending
The British pound has given up ground on Friday after several days of modest gains. In the European session, GBP/USD is trading at 1.2736, down 0.07%.
UK retail sales decline more than expected
The weather in the UK continues to have a major impact on consumer spending. The June retail sales report was stronger than expected, with record-hot weather contributing to an increase in spending. July brought cold and rainy weather, which led to a decline in spending as shoppers preferred to stay home. Retail sales declined -1.2% m/m in July, down from +0.6% in June and below the consensus estimate of -0.5%.
The UK consumer’s spending appetite isn’t only dependent on the weather, of course. Consumer spending has been surprisingly resilient in a tough economic environment, but high inflation and rising interest rates are taking their toll. The cost-of-living crisis has created a situation in which sales volumes are falling but the value of goods purchased has been rising – in other words, consumer purchasing power has been falling as consumers are spending more to buy less.
What is bad for consumers may be welcome news for the Bank of England, whose battle with inflation hasn’t gone all that well. The BoE has raised interest rates to 5.25% in order to curb inflation, but a tight labour market and strong consumer spending have contributed to high inflation, which is currently running at a 6.8% clip. If the cracks we saw this week in the labour market and consumer spending continue, it could mean that the BoE has finally turned the corner in its tenacious battle to bring inflation closer to the 2% target.
GBP/USD Technical
- GBP/USD is testing support at 1.2787. Below, there is support at 1.2634
- 1.2879 and 1.2940 are the next resistance lines
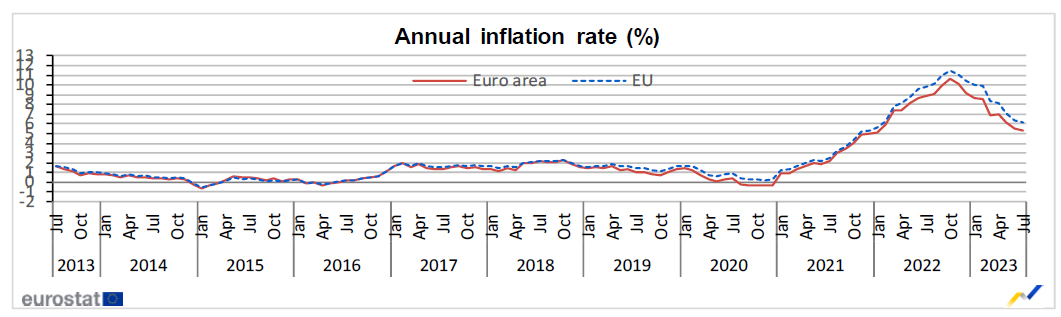
Eurozone CPI finalized at 5.3% in Jul, core CPI at 5.5%
Eurozone CPI was finalized at 5.3% yoy in July, down from June's 5.5% yoy. Core CPI (ex energy, food, alcohol & tobacco) was finalized at 5.5%, unchanged from June's reading. The highest contribution came from services (+2.47%), followed by food, alcohol & tobacco (+2.20%),), non-energy industrial goods (+1.26%),) and energy (-0.62%),).
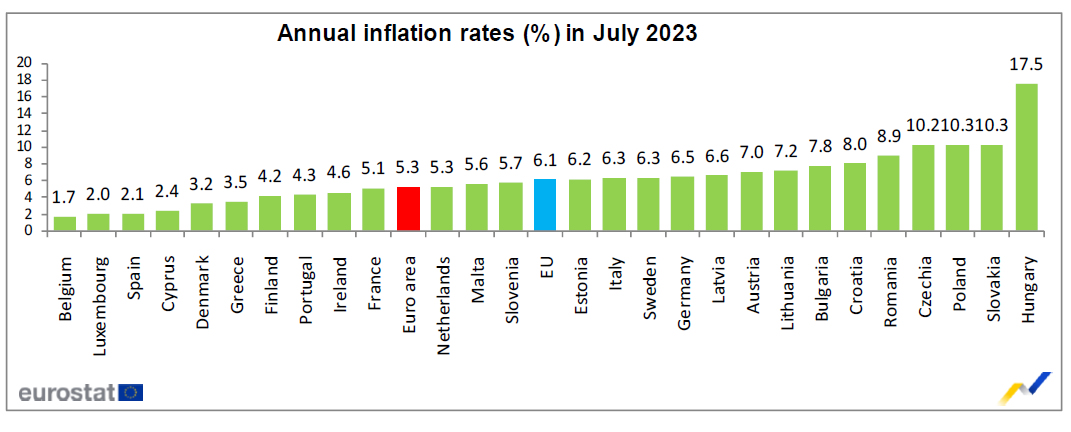
EU CPI was finalized at 6.1% yoy, down from prior month's 6.4% yoy. The lowest annual rates were registered in Belgium (1.7%), Luxembourg (2.0%) and Spain (2.1%). The highest annual rates were recorded in Hungary (17.5%), Slovakia and Poland (both 10.3%). Compared with June, annual inflation fell in nineteen Member States, remained stable in one and rose in seven.
Gold Price and Crude Oil Price Signal Negative Trend
Gold price is moving lower from the $1,930 resistance. Crude oil price is also declining and showing bearish signs below $80.00.
Important Takeaways for Gold and Oil Prices Analysis Today
- Gold price failed to clear the 1,930 resistance and moved lower against the US Dollar.
- A major bearish trend line is forming with resistance near $1,895 on the hourly chart of gold at FXOpen.
- Crude oil prices are also moving lower below the $80.00 resistance zone.
- There is a key bearish trend line forming with resistance near $80.00 on the hourly chart of XTI/USD at FXOpen.
Gold Price Technical Analysis
On the hourly chart of Gold at FXOpen, the price struggled to settle above the $1,930 resistance. The price started a fresh decline below the $1,920 pivot level.
The price traded below the $1,900 support and the 50-hour simple moving average. It tested the $1,885 zone. A low is formed near $1,885 and the price is now consolidating losses. It is now testing the 50% Fib retracement level of the downward move from the $1,903 swing high to the $1,885 low.
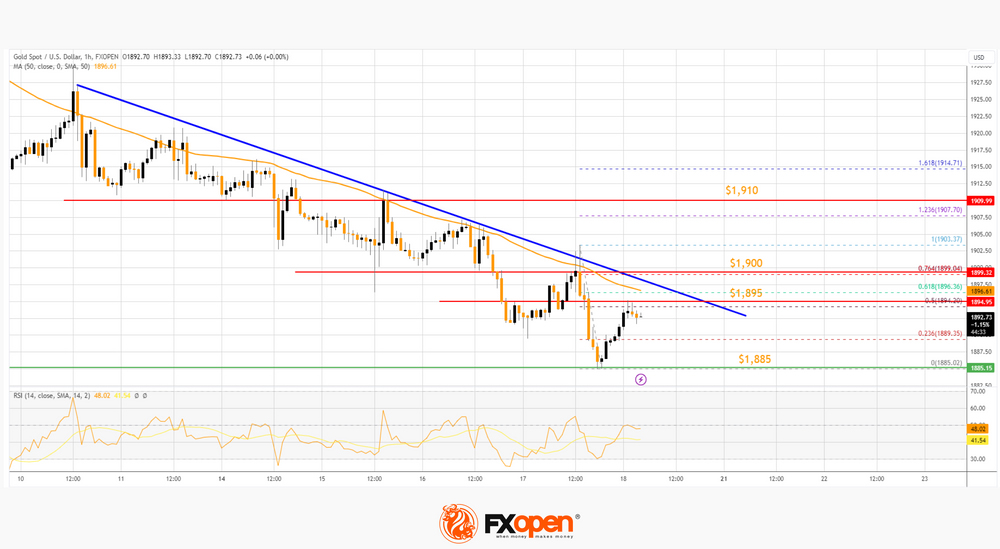
There is also a major bearish trend line forming with resistance near $1,895 and the 50-hour simple moving average. The next major resistance is near the 76.4% Fib retracement level of the downward move from the $1,903 swing high to the $1,885 low at $1,900.
An upside break above the $1,900 resistance could send Gold price toward $1,910. Any more gains may perhaps set the pace for an increase toward the $1,930 level.
Initial support on the downside is near the $1,885 level. The first major support is near the $1,875 level. If there is a downside break below the $1,875 support, the price might decline further. In the stated case, the price might drop toward the $1,850 support.
Oil Price Technical Analysis
On the hourly chart of WTI Crude Oil at FXOpen, the price struggled to continue higher above $84.00 against the US Dollar. The price formed a short-term top and started a fresh decline below $83.00.
There was a steady decline below the $81.45 pivot level. The bears even pushed the price below $80.00 and the 50-hour simple moving average. Finally, it tested the $78.60 zone. A low is formed near $78.58 and the price is now attempting a recovery wave.
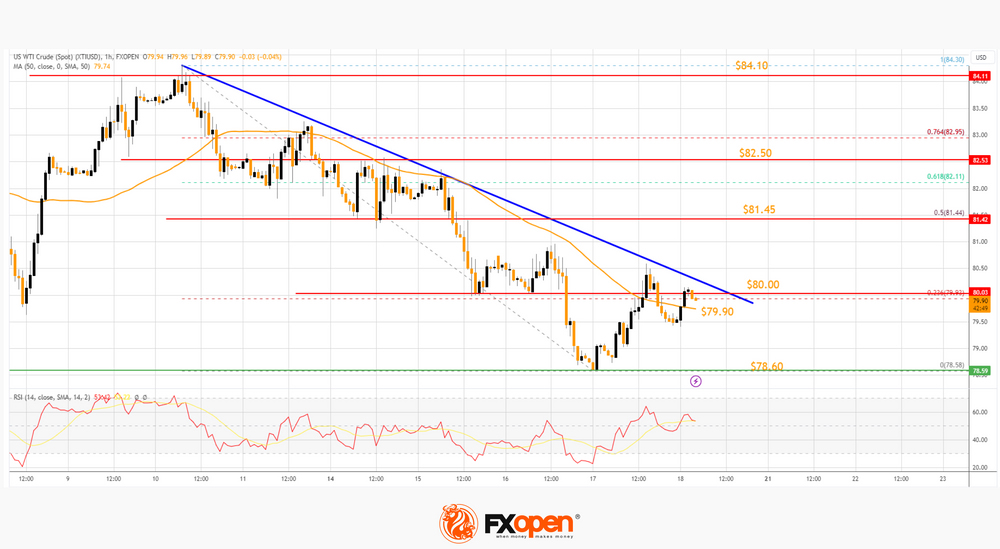
There was a move above the 50-hour simple moving average. However, the price is struggling near the 23.6% Fib retracement level of the downward move from the $84.30 swing high to the $78.58 low.
There is also a key bearish trend line forming with resistance near $80.00. If the price climbs further higher, it could face resistance near the 50% Fib retracement level of the downward move from the $84.30 swing high to the $78.58 low at $81.45.
Any more gains might send the price toward the $82.50 level. Conversely, the price might start another decline and retest the 50-hour simple moving average. The next major support on the WTI crude oil chart is near $78.60.
If there is a downside break, the price might decline toward $77.50. Any more losses may perhaps open the doors for a move toward the $76.20 support zone.
Start trading commodities with tight spreads. Open your trading account now or learn more about trading commodity CFDs with FXOpen.
This article represents the opinion of the Companies operating under the FXOpen brand only. It is not to be construed as an offer, solicitation, or recommendation with respect to products and services provided by the Companies operating under the FXOpen brand, nor is it to be considered financial advice.
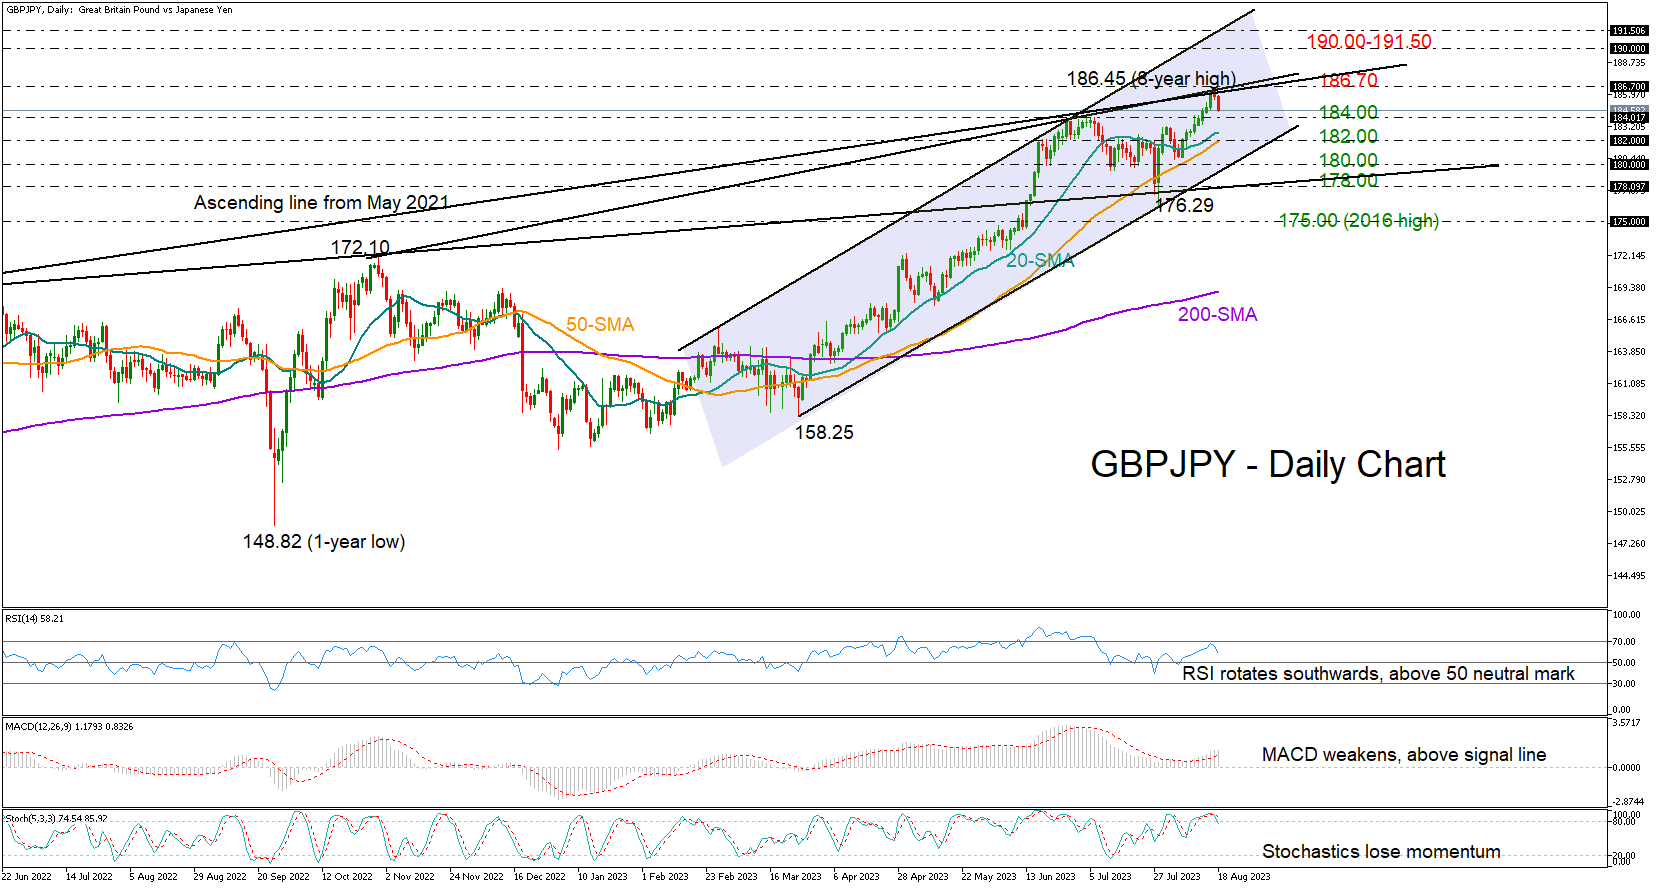
GBPJPY Switches to Losses Near 8-Year High
GBPJPY turned red after its one-week-old 3.2% rally reached an 8-year high of 186.45 near a trendline area. The longer-term ascending line from May 2021 and the shorter-term upward-sloping trendline from October 2022 cemented that ceiling, sending the price slightly lower on Thursday.
The pair continued to weaken during Friday’s early European trading hours, heading towards the former resistance of 184.00. The 20- and 50-day simple moving averages (SMAs) could also come to the rescue slightly lower. If the SMAs allow more declines below 182.00, sellers could drive towards the channel’s lower boundary seen near 180.00. The 178.00 constraining zone could next come into consideration, as a step lower from there would switch the short-term outlook to bearish.
Technically, the pullback in the momentum indicators is endorsing the current negative mode in the market. That said, the RSI is still clearly above its 50 neutral mark, while the stochastic oscillator has not exited the overbought zone yet, suggesting that an upside reversal cannot be excluded. Note that the MACD is also standing above its red signal line.
If the market finds enough buyers to crawl above the trendline area of 186.70, the price could advance towards the 190.00 psychological level or slightly higher to test the channel’s upper boundary around 191.50. A decisive close above the bullish formation could lift the price straight up to the 2015 top of 195.55-195.87.
In brief, GBPJPY came under pressure before reaching the upper band of a bullish channel, increasing the risk for more downside corrections in the coming sessions.
USDCAD Extends Steep Advance to 2-month Peak
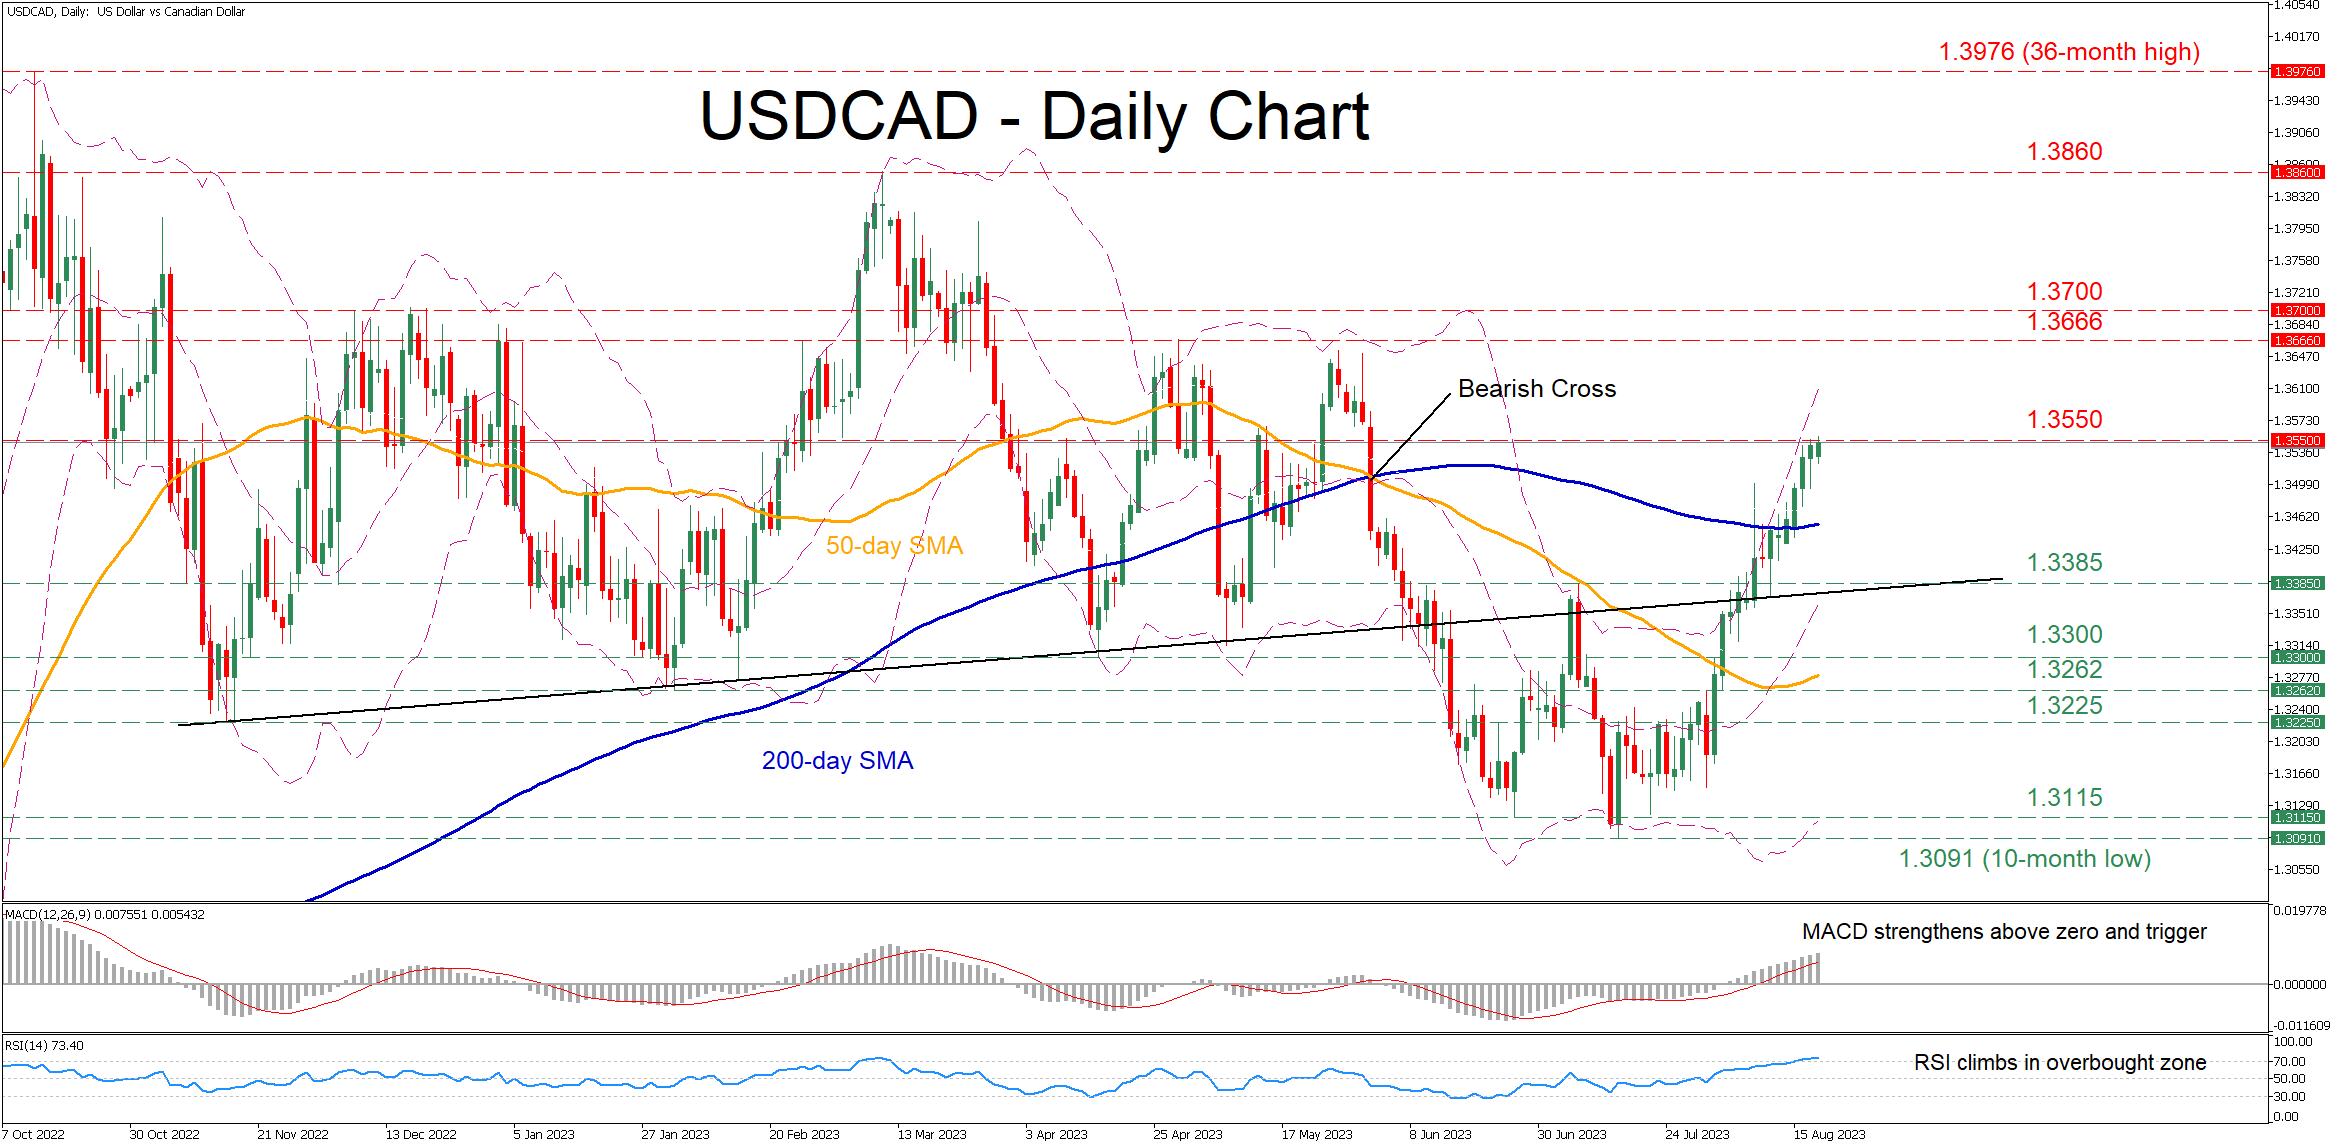
USDCAD had been trending higher in the short term after finding its feet at the 10-month low of 1.3091 in mid-July. Moreover, the pair has sliced through important technical zones such as both the 50- and 200-day simple moving averages (SMAs), while posting a fresh 2-month high in today's session.
The momentum indicators currently suggest that the recent rally could be overstretched. Specifically, the MACD is strengthening above zero and its red signal line at its highest level since March, while the RSI is hovering within its 70-overbought territory.
Should the bulls conquer the crucial 1.3550 zone, immediate resistance could be found at the April peak of 1.3666. Jumping above the latter, the pair may ascend towards the 1.3700 psychological mark, which held strong in December 2022. Further advances could then cease at the 2023 high of 1.3860.
Alternatively, if the recent advance fizzles out, the price may retrace lower to test the 1.3385 resistance, which could serve as support in the future. A violation of that territory could open the door for the April bottom of 1.3300. Failing to halt there, the pair could attempt to halt its retreat at the February low of 1.3262.
In brief, USDCAD has been staging a strong comeback, which accelerated after the pair pierced through the ascending trendline that connects its higher lows from November 2022 until early May. However, a pullback should not be ruled out as the price has approached overbought conditions.
GBP/USD: Cable Eases on Downbeat UK Data, But Needs to Clear Key Supports to Signal Reversal
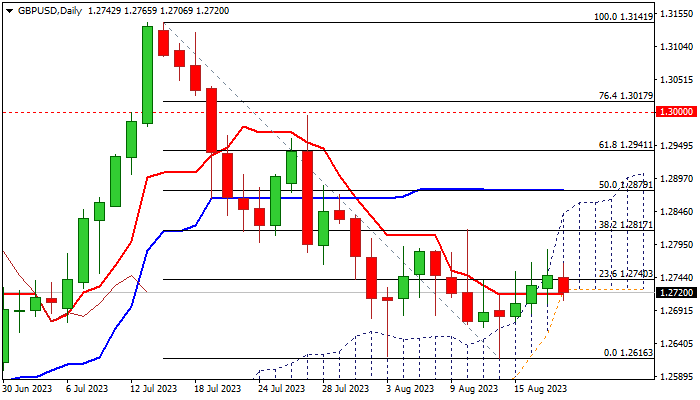
GBP/USD dips on Friday morning following much bigger than expected drop in UK retail sales, which fell by 3.2% in July after 1.6% drop in June and strongly beating forecast for 2.2% fall.
Traders sold pound after downbeat data further boosted fears about the negative impact on the economy, already hit by high inflation and 14 consecutive interest rate increases, which push the borrowing cost to 5.25%.
Fresh weakness cracked pivotal supports at 1.2724/17 zone (daily cloud base / Fibo 38.2% of 1.2616/1.2787 recovery leg / daily Tenkan-sen) but needs to register close below these levels to confirm bearish signal.
Although recent weakness was contained by daily Ichimoku cloud and subsequent recovery was moving along with rising cloud top, long upper shadows of daily candles in past three days, warned of strong offers and persisting risk of recovery stall, as near-term bulls likely got trapped above 20DMA (1.2770).
Daily studies are bearishly aligned as momentum indicator remains in the negative territory and RSI is heading south, with sustained break below the base of rising and thickening daily cloud, to boost reversal signal and allow for deeper drop.
Conversely, failure to clearly break below cloud base would reduce immediate downside risk and likely keep near-term action in a sideways mode, while under pivotal barriers at 1.2817/18 (Fibo 38.2% of 1.3141/1.2616 fall / Aug 10 spike high.
Res: 1.2765; 1.2787; 1.2817; 1.2879.
Sup: 1.2701; 1.2681; 1.2656; 1.2616.
GBP/JPY Daily Outlook
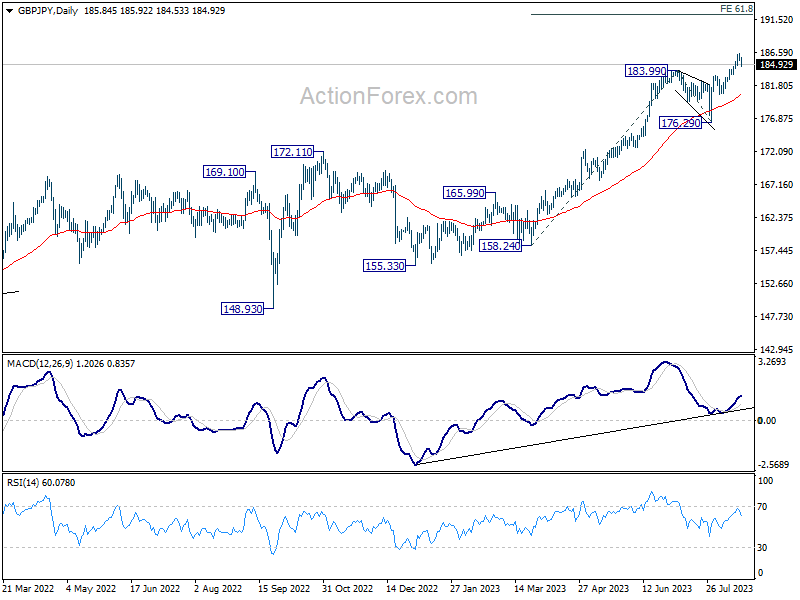
Daily Pivots: (S1) 185.52; (P) 185.99; (R1) 186.41; More...
Intraday bias in GBP/JPY is turned neutral with current retreat. Firm break of 184.67 minor support will suggests that deeper pull back in underway to 55 D EMA (now at 180.44). Nevertheless, break 186.45 will resume larger up trend to 61.8% projection of 158.24 to 183.99 from 176.29 at 192.20.
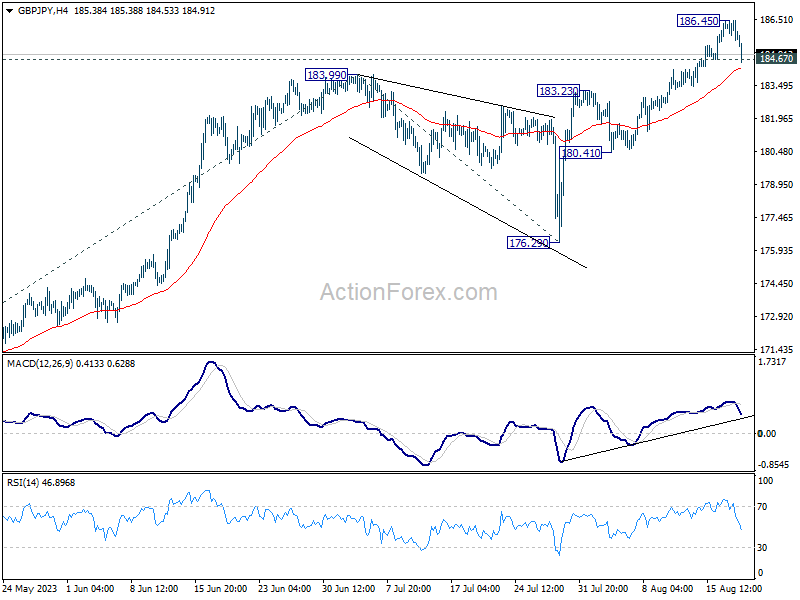
In the bigger picture, up trend from 123.94 (2020 low) is in progress. Next target is 195.86 (2015 high). This will now remain the favored case as long as 176.29 support holds, even in case of deeper pull back.
EUR/JPY Daily Outlook
Daily Pivots: (S1) 158.11; (P) 158.73; (R1) 159.21; More....
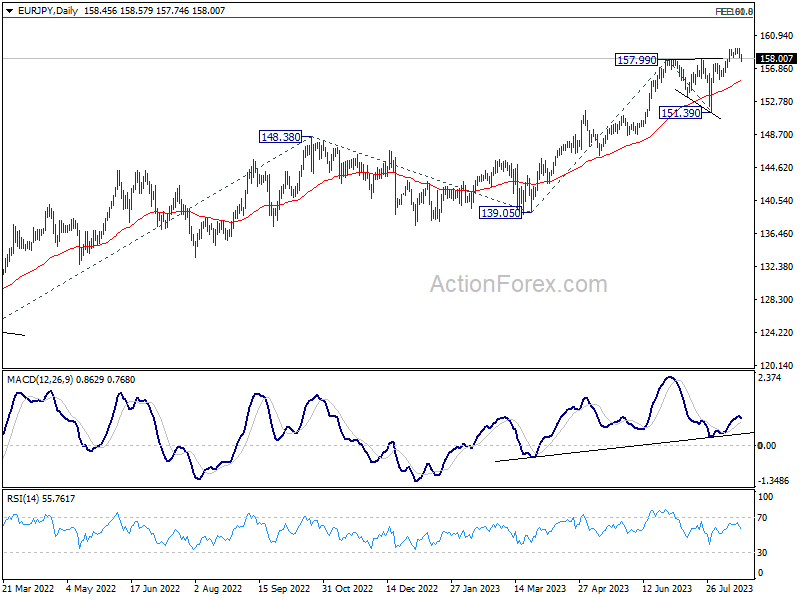
Break of 158.17 minor support indicate short term topping at 159.32. Intraday bias in EUR/JPY is mildly on the downside for deeper pull back to 55 D EMA (now at 155.31). On the upside, though, break of 159.32 will resume larger up trend to 61.8% projection of 139.05 to 157.99 from 151.39 at 163.09 next.
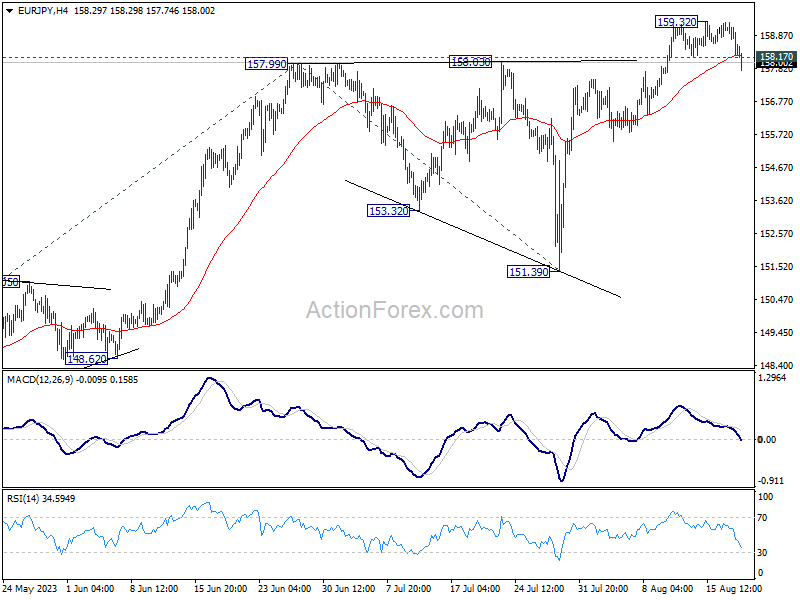
In the bigger picture, rise from 114.42 (2020 low) is in progress. Next target is 100% projection of 124.37 to 148.38 from 139.05 at 163.06. Sustained break there will pave the way to retest long term resistance at 169.96. This will now remain the favored case as long as 151.39 support holds, even in case of deep pull back.