

Sample Category Title
USD/CHF Daily Outlook
Daily Pivots: (S1) 0.8761; (P) 0.8785; (R1) 0.8810; More....
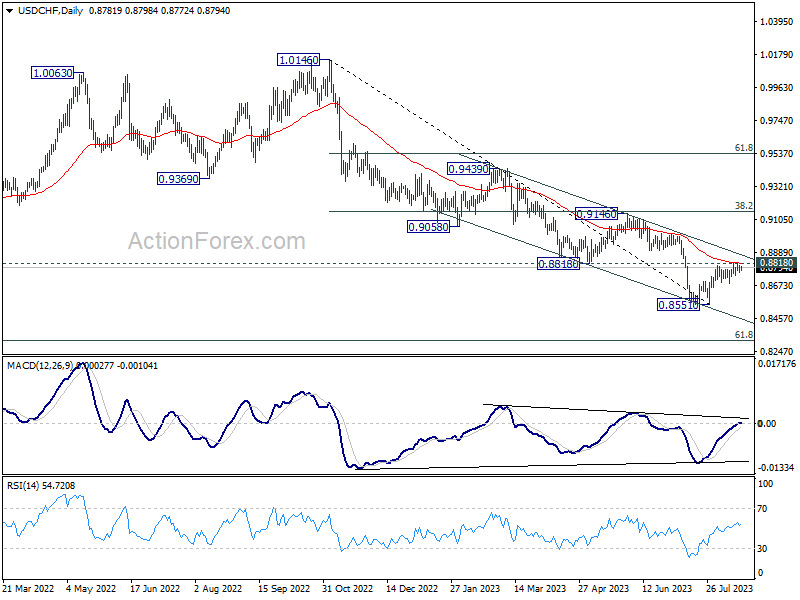
Intraday bias in USD/CHF remains neutral and outlook is unchanged. On the upside, sustained trading above 0.8818 support turned resistance will carry larger bullish implication. Further rally should then be seen to 0.9146 cluster resistance next. However, break of 0.8688 support will indicate rejection by 0.8818, and turn bias back to the downside for retesting 0.8551 low.
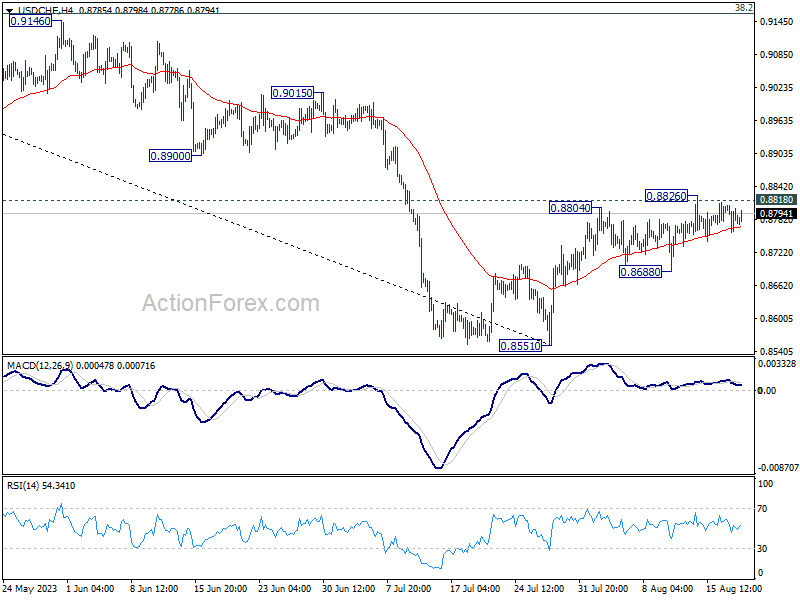
In the bigger picture, a medium term bottom could be in place at 0.8551 already, on bullish convergence condition in D MACD. Sustained trading above 0.8818 will bring further rise to 0.9146 cluster resistance (38.2% retracement of 1.0146 to 0.8551 at 0.9160), even as a correction. Nevertheless, break of 0.8851 will resume the down trend from 1.0146 instead.
GBP/USD Daily Outlook
Daily Pivots: (S1) 1.2704; (P) 1.2746; (R1) 1.2789; More...
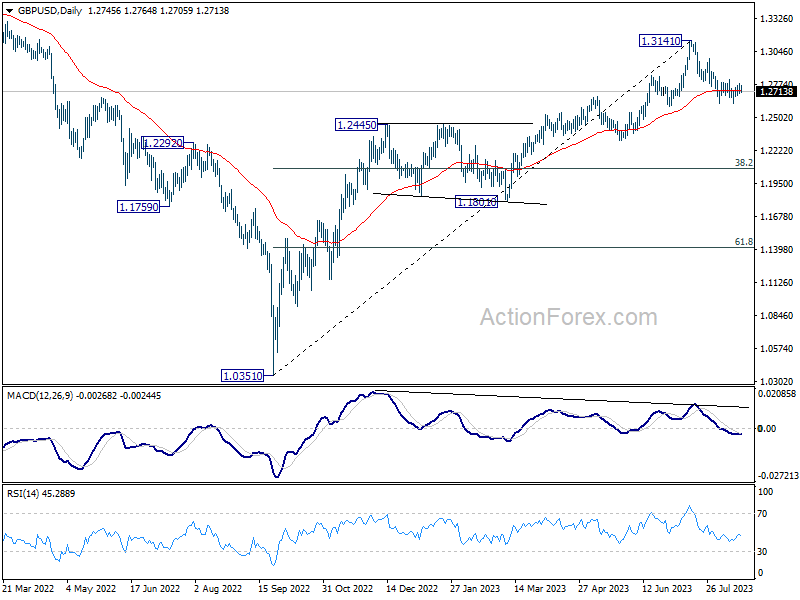
No change in GBP/USD's outlook as range trading continues. Intraday bias stays neutral at this point. On the downside, firm break of 1.2615, and sustained trading below 1.2678 resistance turned support will argue that it's already in a larger correction. Deeper decline would then be seen to 1.2306 support next. Nevertheless, break of 1.2817 minor resistance will indicate that the pull back from 1.3141 has completed, and turn bias back to the upside for stronger rebound.
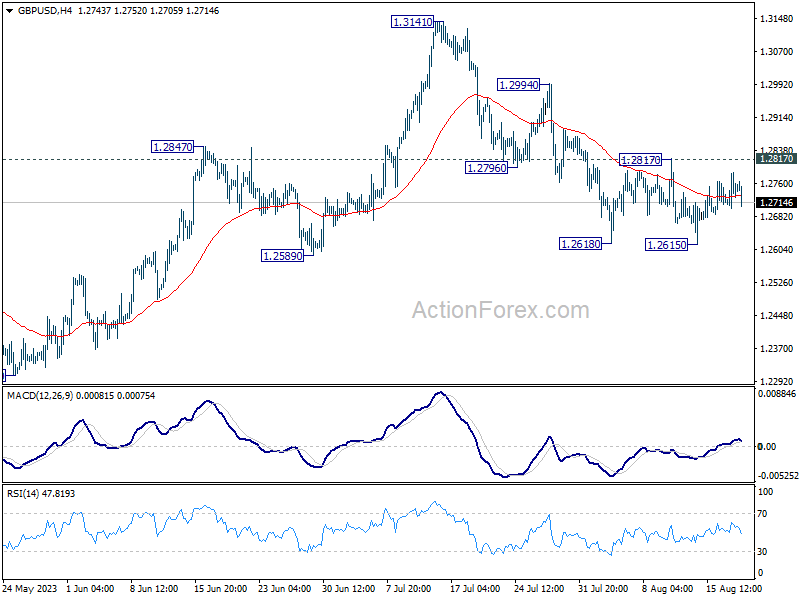
In the bigger picture, a medium term top could be in place at 1.3141 already, on bearish divergence condition in D MACD. Sustained trading below 55 D EMA (now at 1.2723) should confirm this case, and bring deeper fall to 38.2% retracement of 1.0351 to 1.3141 at 1.2075, as a correction to up trend from 1.0351 (2022 low). For now, rise will stay mildly on the downside as long as 1.3141 resistance holds, in case of strong rebound.
Nikkei 225 Technical: Overstretched Decline, Potential Rebound Looms
- Nine-week corrective decline from the 16 June 2023 high has almost reached a key inflection/support level of 31,130.
- Short-term momentum indicates an overstretched down move from the 10 August 2023 minor swing high, increasing the odds of a potential rebound in price actions.
- Intermediate resistances to watch will be at 31,760 and 32,380.
The price actions of the Japan 225 Index (a proxy of the Nikkei 225 futures) have staged the expected corrective decline and tumbled by -3.5% from 2 August to print a current intraday low of 31,248 in today, 18 August Asian session at this time of the writing.
Interestingly, several key elements are now advocating for a potential rebound.
The current decline has almost reached a key inflection/support level of 31,130
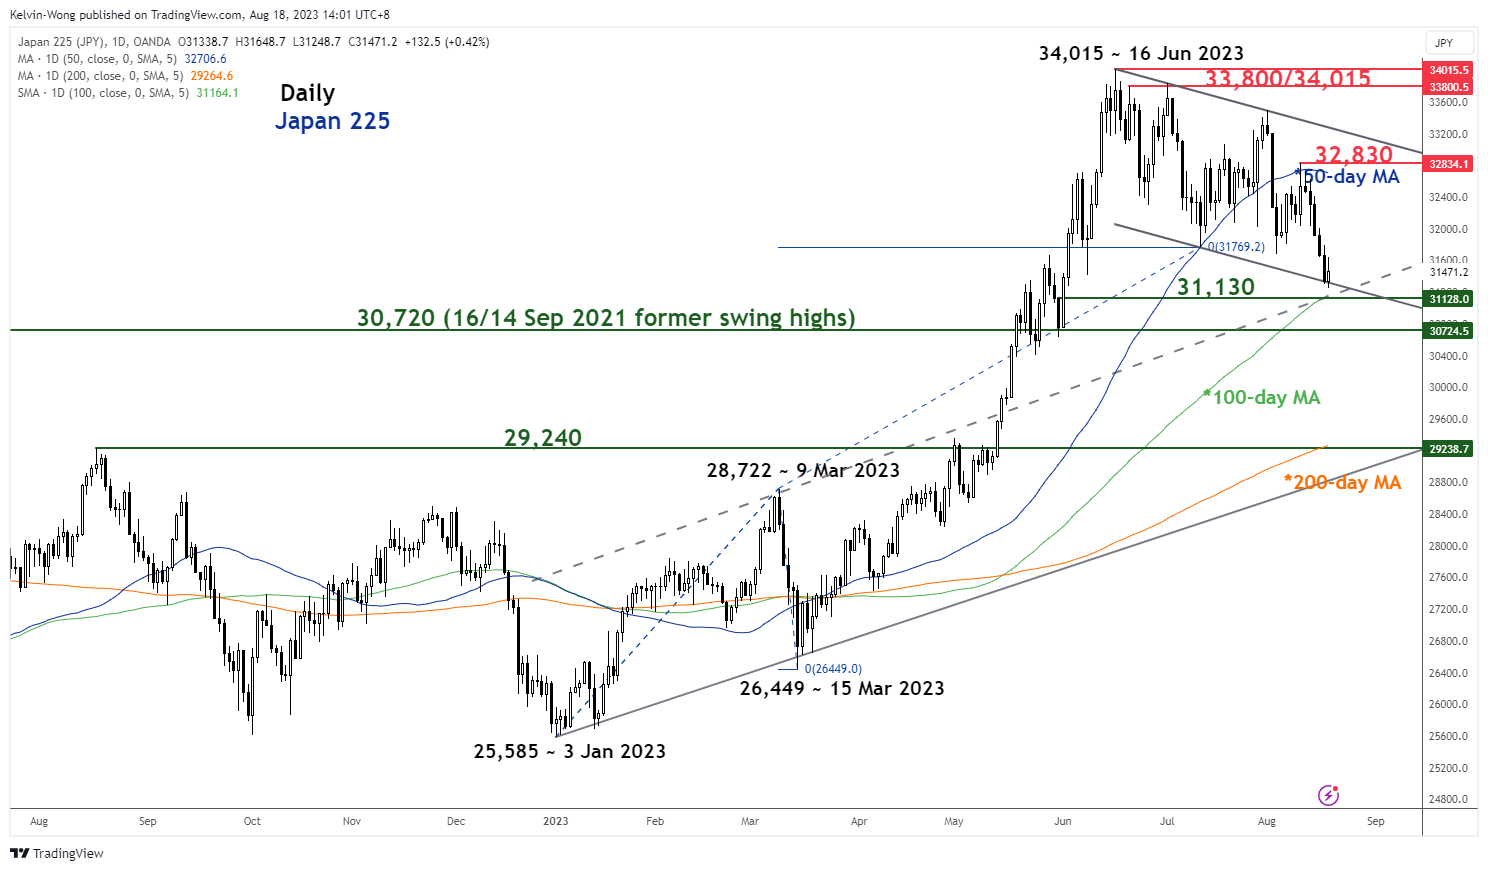
Fig 1: Japan 225 medium-term trend as of 18 Aug 2023 (Source: TradingView, click to enlarge chart)
The current intraday low of 31,248 is now right above the upward-sloping 100-day moving average, former ascending channel resistance from the 9 March 2023 high, and 38.2% Fibonacci retracement of the prior medium-term up move from the 15 March 2023 low to 16 June 2023 high that all confluences with the 31, 130 support.
Downside momentum of current minor down move has shown signs of easing
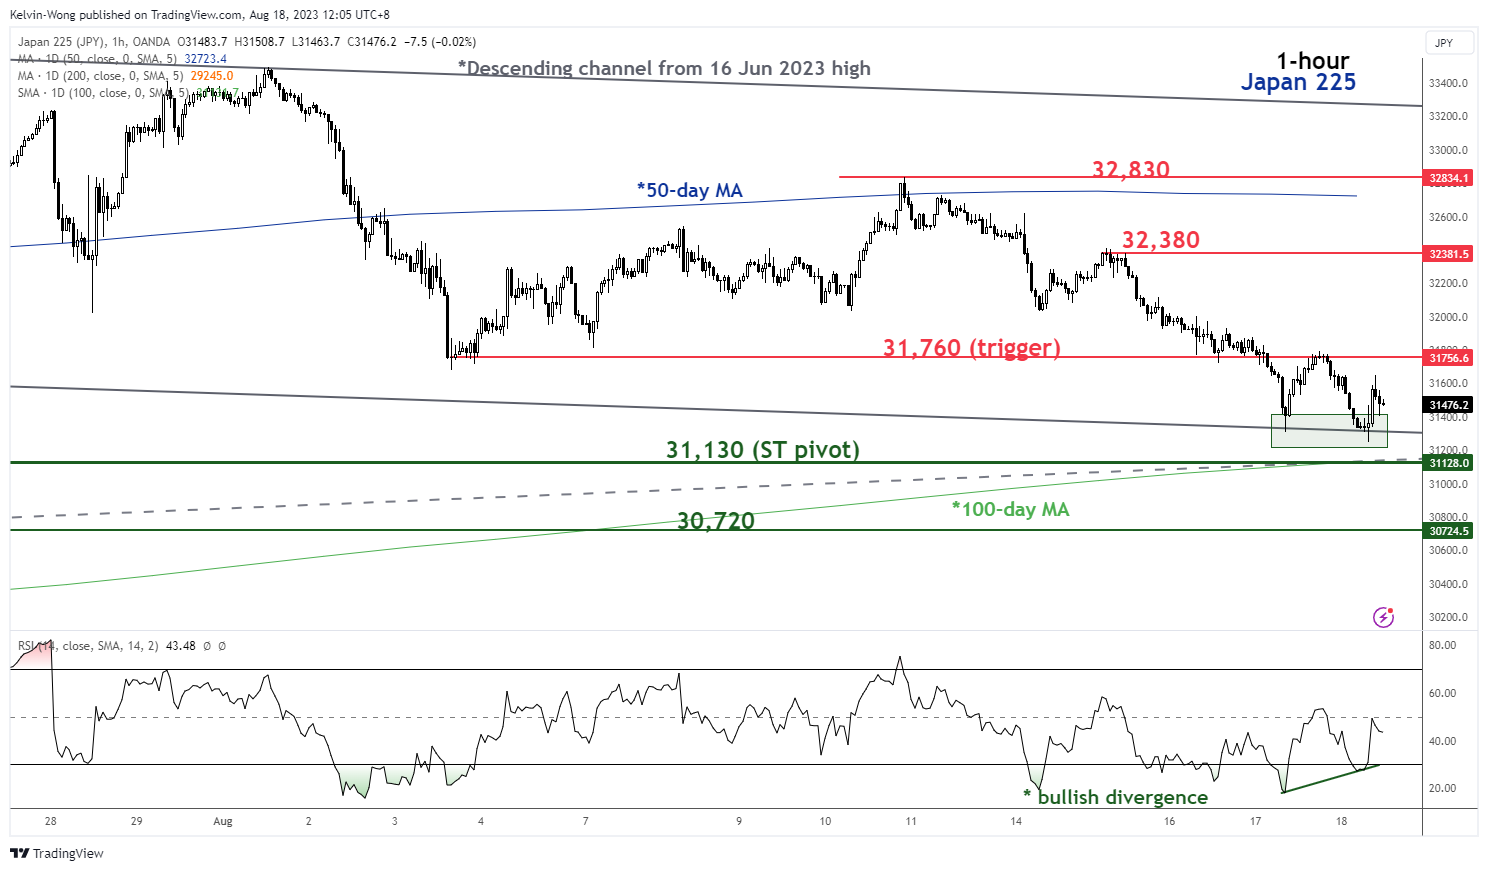
Fig 2: Japan 225 minor short-term trend as of 18 Aug 2023 (Source: TradingView, click to enlarge chart)
The most recent down move in place since 10 August 2023 minor swing high of 32,830 has started to ease in terms of momentum analysis as depicted by the bullish divergence condition flashed out today on the hourly RSI oscillator at its oversold region.
Given that the nine-week of corrective decline from the 16 June 2023 high of 34,015 within its major uptrend phase that is still intact has reached close to key support of 31,130 coupled with positive short-term momentum, the Index may see a short-term rebound at this juncture.
Watch the 31,130 short-term pivotal support and a clearance above 31,760 sees the next intermediate resistance at 32,380.
However, failure to hold at 31,130 exposes the next support coming in at 30,720 which is also the former swing high areas of 16 February/14 September 2014.
Dollar Gained Some Ground But Failed to Really Gain Momentum
Markets
Both the US 10-yr and 30-yr yield tested the autumn 2022 cycle high yesterday, respectively at 4.34% and 4.42% and matching highest levels in over a decade. We pointed out before that higher (US) real yields are driving the move. It’s a combination of reduced recession risks, a higher credit risk premium and a return of the term premium as markets embrace the higher for even longer scenario in combination with a likely increase of the Fed (and other central banks for that matter) neutral rate. The UK 10-yr yield broke above the cycle high (4.71%) with the German 10-yr yield on the brink of testing it (2.77%). The intensity of this month’s sell-off and the nearby resistance levels could prevent a break short term, but we stick to our view of higher rates medium to long term as we return to the “old normal” (pre-GFC). The Fed’s symposium at Jackson Hole is the next high profile event with Fed Chair Powell announced to speak on the economic outlook on Friday August 25 at 4:05 pm CET.
Higher real rates weighed on risk sentiment over the past sessions with main European and US indices losing over 1% again yesterday. The EuroStoxx 50 (4227) is near a test of key support around 4200 (May and July lows). The S&P 500 is showing a toppish pattern with the June low at 4328 being first minor support. The dollar gained some ground but the greenback failed to really gain momentum. The trade weighted dollar (DXY) tested the July high at 103.57 but a break didn’t occur. EUR/USD 1.0834 support is close, but not tested yet. The combination of higher (real) rates and a difficult risk environment stays USD-supportive especially with a September Fed rate hike -our preferred scenario – only partly discounted. Today’s eco calendar is extremely thin with UK retail sales being the only highlight.
News Headlines
The Spanish parliament voted Francina Armengol as next Speaker of Congress, about a month after inconclusive general elections. She gathered 178 votes (2 above the required absolute majority threshold) coming from a leftist bloc around acting Socialist PM Sanchez. Socialists came in second last month, but unlike the election-winning center-right Partido Popular, they do have a tiny path to power. Therefore, they need the backing of six other parties, including Together for Catalonia. The party led by former Catalan president Puigdemont who still lives in exile in Belgium said though that the Speaker vote was in no way linked to the choice of a new PM. To secure backing for the Speaker vote, Sanchez agreed a pact to promote the use of regional languages and to investigate alleged spying on Catalan leaders. He will have to pay a much higher price (referendum, amnesty,…) if he wants Together for Catalonia to be kingmaker in a (September?) government formation process. Without a deal, Spain will be forced to hold fresh election by the end of the year or early in 2024. That is still the most likely outcome.
National Japanese inflation figures for the month of July showed headline inflation rising by 0.5% M/M with the Y/Y-figure stabilizing at 3.3%. The BoJ’s preferred core inflation gauge (excluding fresh food) rose by 0.4% M/M and by 3.1% Y/Y (from 3.3% Y/Y in June). However, there’s no reason to declare victory yet with the measure excluding fresh food and energy accelerating from 4.2% Y/Y to 4.3% Y/Y on a 0.5% M/M gain. Details showed that service inflation is quickening and offsetting lower utility prices and negative base-effects. Looking forward, services inflation is only expected to speed up with Japan enjoying first Covid-free August summer holidays for the first time in 4 years. It suggests that the BoJ will need to stay alert to upside inflation risks as flagged at their July policy meeting. At that meeting, they raised the tolerance band around the 0% yield target for the 10y yield from 50 bps to 100 bps. Japanese bond yields joined this week’s global move higher with a weak 20-y bond auction causing significant underperformance at the very long end of the curve. The Japanese yen remains in dire straits as higher core bond yields hurt with the BoJ still unwilling to really normalize its monetary policy. Officials have been sending out verbal FX intervention warnings with USD/JPY 150 a possible line in the sand (vs 145.50 currently).
The Everything Selloff
The global selloff intensified yesterday, after the FOMC minutes released Wednesday highlighted that the Federal Reserve (Fed) continues to see significant risks to inflation. And if that’s not enough, Atlanta Fed’s GDPNow printed an eye-popping growth forecast of 5.8% for Q3 on Wednesday, up from 5% printed a day before. Atlanta Fed computes this number using the data available to them at a time t, therefore the number is not necessarily accurate, but it reflects the positive data released lately, and fuels worries that with such a strong growth, the US inflation could only make a U-turn and take a lift. Yesterday, the Philly Fed index printed a surprisingly strong number, as well. This is why, we continue to see the upside pressure in yields persist, in the US and around the world, though we saw some respite in the US 2-year yield that bounced lower from the 5% mark earlier in the week, and the 10-year yield spiked above 4.30% before falling back to 4.25% this morning.
But note that there is more to this story. Long story short, the US Treasury has been printing a lot of T bills lately, and fell well behind the government bond issuance, and the latter helped keeping US liquidity well contained since the US exited its debt ceiling crisis after which the Treasury started refilling its general account. That was supposed to pull liquidity away from the market. But in the meantime, the Fed was pushing liquidity into the system by reverse repo operations, allowing the money market funds to buy T bills and release cash. The problem is, nowadays, the percentage of T bills approaches the 20% level, which is a self-induced limit for the Treasury, and the Treasury will shift back to issuing bonds, instead of T bills. The latter will increase the amount of sovereign bonds in the system at a time the Fed is decreasing its balance sheet by QT, and the banks don’t necessarily want to buy bonds either. So, the increasing supply, and the decreasing demand for US sovereigns will be one major force pushing the US yield curve higher. And if the strong economic data translates into higher inflation, the impact on yields will likely be higher. So, yes, the US 30-year yield is at the highest levels since 2011 and that looks appetizing, especially if the risk sentiment sours – due to multiple reasons ranging from geopolitical tensions to China worries – but the downside risks in the US sovereign bonds market prevails. And Bill Ackman said earlier this month that the 30-year yield could hit the 5% mark.
And the upside pressure in sovereign yields is true for other parts of the world as well, because obviously when the US coughs the world catches a cold. More precisely, higher US yields also translate into a stronger US dollar, and a stronger US dollar is inflationary for the rest of the world. If nothing, the energy and raw material prices that are negotiated in USD terms on international markets simply become more expensive when imports are reverted back to local currencies, and that, alone, is enough to push inflation higher in the rest of the world when the US dollar appreciates. The EURUSD fell to 1.0856, the AUDUSD slipped below 64 cents and the USDJPY spiked above 146.50. The correction is in play this morning and we could see the US dollar retreat further into the weekly closing bell, but the stronger dollar trend is clearly in play and it is worrying. Looking at yields elsewhere the US, the 10-year gilt yield has now surpassed the levels last seen during the Liz Truss induced disaster peak and is headed toward the 5% psychological mark while the German 10-year yield hit 2.70%, a level last seen in 2011 as well. Even the Japanese 10-year yield, which is controlled by the BoJ and should not exceed the 50bp benchmark by ‘too much’, goes up significantly.
As a result, the selloff in equities deepens. The S&P500 sank to 4370 yesterday and is getting ready to test the minor 23.6% Fibonacci retracement on October to July rally, and the base of that positive trend, while Nasdaq 100 is no more than 8 points from its own 23.6% retracement and already fell below the ascending trend base. The Stoxx600 slumped below the 200-DMA and is flirting with its own 23.6% retracement level, and the Japanese Nikkei, which was one of the rising stars of the year, and which recorded a rally past 30% since January, has fallen below its 23.6% retracement and is preparing to test the 100-DMA.
And note that this simultaneous selloff in stocks and bonds is a sign that the market liquidity is draining. Bitcoin, which is a gauge of market liquidity, slumped more than 7% yesterday and traded close to the $25K level. According to CoinGlass, $1 billion left cryptocurrencies over the past 24 hours and Bitcoin suffered almost half of the liquidations.
Final July Euro Area Inflation
Market movers today
We head towards weekend with an almost empty data calendar.
We get Q2 GDP data from Norway in the morning.
Also, euro area final HICP for July will be released, including detailed data on different components.
The 60 second overview
EUR/USD is still range bound around the 1.09 mark as has been the case for most of this week. Yesterday was a rather quiet session, and global risk sentiment continues to be the main driver of the cross, together with the rise in especially long US yields - probably driven by a confluence of factors like a large supply of Treasuries, better-than-expected economic data, US credit rating downgrade and BoJ's relaxation of the YCC. The weekly jobless claims were more or less in line with expectations at 239k, while the Philadelphia Fed index, as opposed to the Empire manufacturing index earlier this week, surprised significantly to the upside at 12.0 (consensus: -10.4, prior: -13.5). We likely have to wait until next week's PMI data to get firm indications on how growth momentum has developed in August. There are no significant events on the calendar today - global risk sentiment looks to be the ongoing driving force of the cross for the time being. We still think the mix of US outperformance, rising US yields and declining equities seem to be a good cocktail for further USD appreciation.
Norway: As expected, Norges Bank raised the policy rate by 25 bp. to 4.00 % yesterday. At the same time, NB keeps the tightening bias: 'Based on the Committee's current assessment of the outlook and balance of risks, the policy rate will most likely be raised further in September'. There is no reference to the rate path beyond September, but NB sees the incoming data since the June meeting as well in line with expectations. This implies that NB still keeps the possibility for further hikes, but that will of course be data dependent. Both the decision and signal should be well in line with market expectations.
In our monthly Geopolitical radar - No peace in sight for Ukraine, 17 August, we discuss that Ukraine has likely launched its main counter-offensive but their progress remains limited. Saudi Arabia recently hosted peace talks regarding Ukraine. Talks will continue but a peace agreement in near future remains unlikely. Also, US-China relations have remained fairly calm over the summer. Biden has put a ban on US investments in Chinese tech related to AI, microchips and super computers but the scope of the ban is narrower than the first draft proposals.
Equities: Equities saw another round of falls yesterday. US and Europe sold off about -1%. However, sector performance shifted in the US session, away from demand fear and into yields fear. Growth stocks underperformed with sectors like consumer discretionary and communication at the bottom. Value cyclicals, such as banks or materials, actually fared quite well. Hence, China is not fully to blame for the weak performance yesterday. VIX rose for a third straight day to 18, the highest level since May. Although Western markets are down 2-3% this week, there is no rebound in the cards today. Asian markets are in broad sell-off this morning and US futures are directionless.
FI: After an initial 6bp spike higher in yields in the 10y point, European rates traded mostly sideways through the day. The curve ended with a bearish steepening as the front end rose only 2-3bp. The US steepening of the curves, driven by the long end, is in the driver's seat right now. 30y UST at the long end of the US curve is setting new highs since the banking turmoil in March. Next signals are the PMIs and the Fed's Jackson Hole conference next week.
FX: GBP continues to rise driven by higher UK rates and NOK found some tailwind from a still hawkish Norges Bank yesterday. Meanwhile, SEK struggled yesterday together with AUD and NZD.
Credit: The credit markets were largely unchanged yesterday, with a slight bearish tilt amid renewed fears of central bank hawkishness. In this light iTraxx Main widened 0.1bp to 76.6bp and Xover widened 0.5bp to 424.8bp.
Technical Outlook and Review
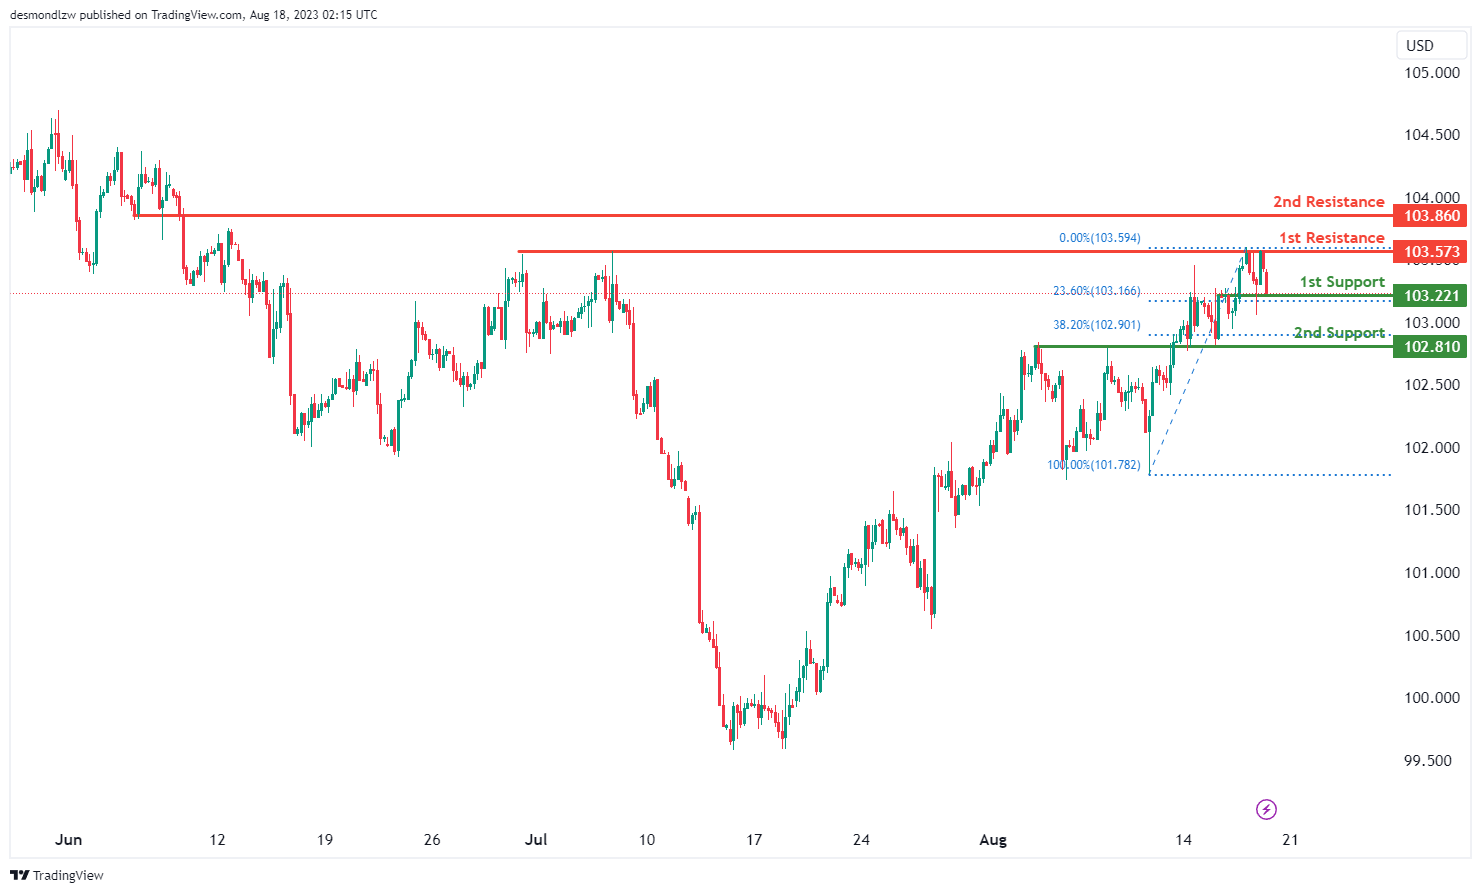
DXY:
The DXY chart is currently demonstrating a bullish momentum, indicating a prevailing upward trend.
There’s a potential scenario where the price could experience a bullish bounce off the 1st support at 103.22 and advance towards the 1st resistance at 103.57.
The significance of the 1st support level at 103.22 is due to its classification as an overlap support, further reinforced by its alignment with a 23.60% Fibonacci Retracement. Similarly, the 2nd support at 102.81 gains strength as an overlap support, coinciding with a 38.20% Fibonacci Retracement.
On the resistance side, the 1st resistance level at 103.57 holds importance as a multi-swing high resistance. The 2nd resistance at 103.86 is noted as a pullback resistance.
Given the bullish momentum, a potential bounce off the support could lead the price towards the resistance levels.
EUR/USD:
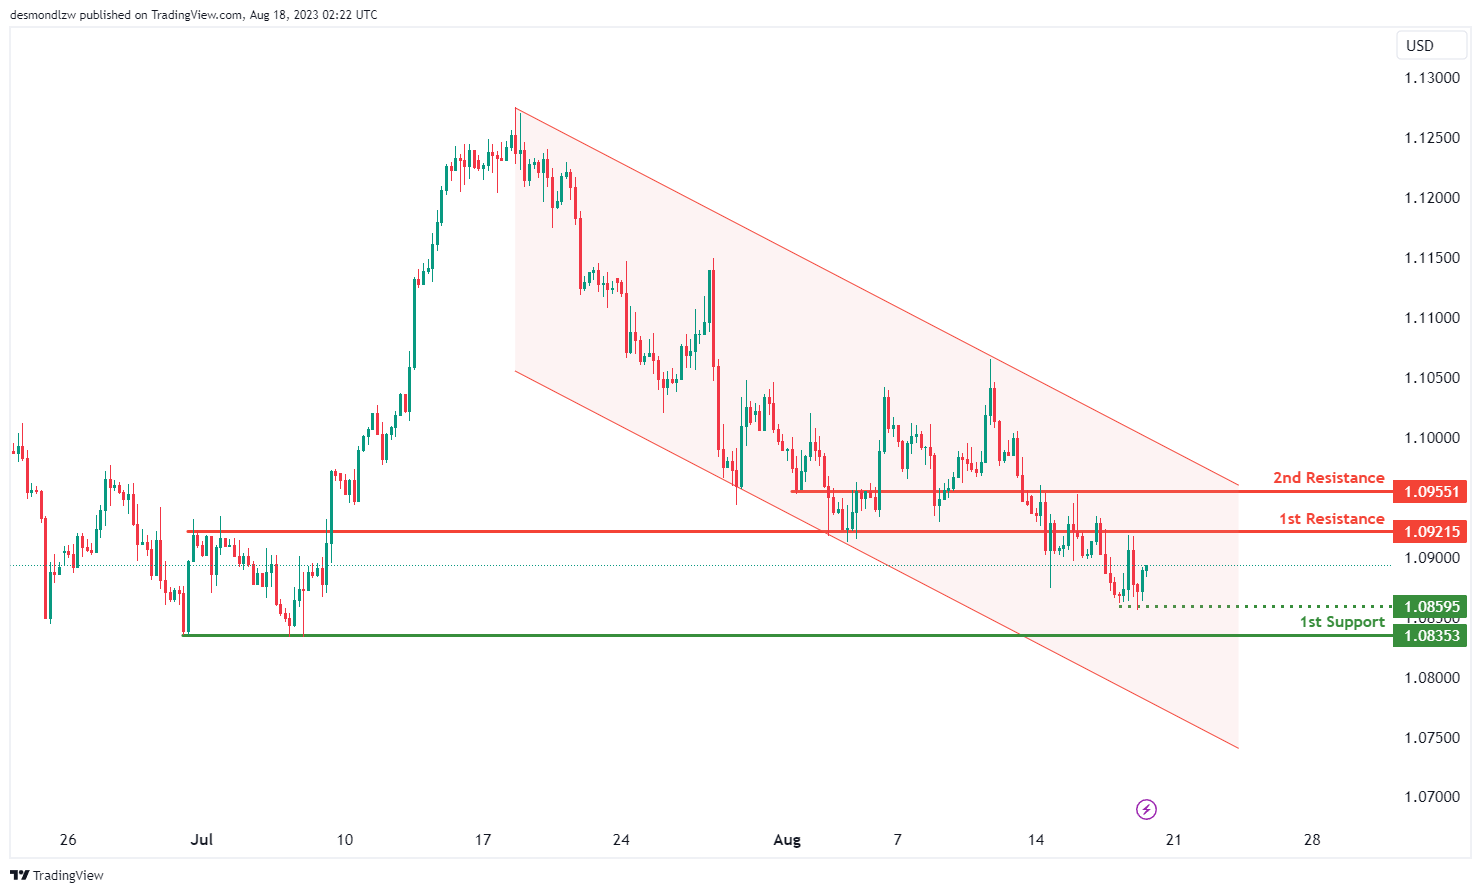
The EUR/USD chart is currently reflecting a bearish momentum, indicating a prevailing downward trend.
This bearish momentum is reinforced by the fact that the price is within a bearish descending channel, which suggests the potential for further downward movement.
In this context, there is a possibility that the price could continue its bearish trend towards the 1st support level at 1.0835. This support is considered significant due to its alignment with multi-swing low points.
Moreover, an intermediate support at 1.0859 adds further reinforcement as an overlap support.
On the resistance side, the 1st resistance level at 1.0921 is noted as an overlap resistance. Similarly, the 2nd resistance at 1.0955 holds significance as an overlap resistance.
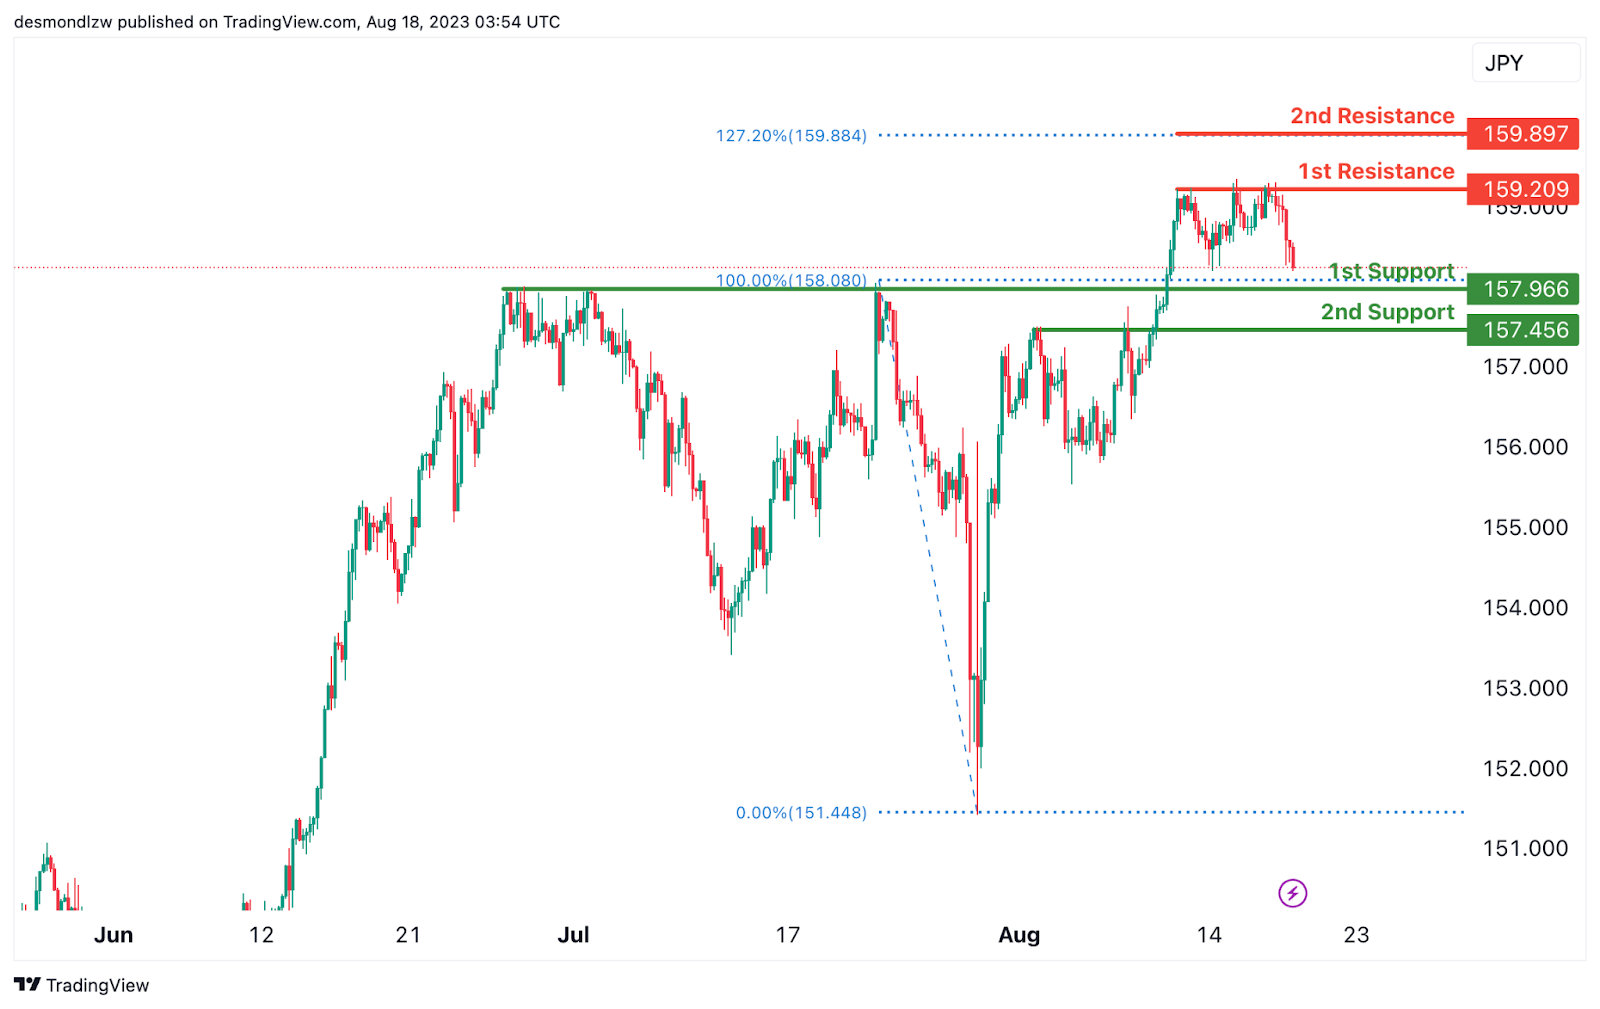
EUR/JPY:
The EUR/JPY chart indicates a bearish overall momentum. There is a potential for a bearish continuation towards the 1st support level.
The 1st support is positioned at 157.96 and is considered advantageous due to its pullback support characteristics. Furthermore, the 2nd support at 157.45 is also seen as valuable because it represents a pullback support.
On the resistance side, the 1st resistance level at 159.20 is noteworthy as it represents a multi-swing high resistance. Additionally, the 2nd resistance at 159.89 is also significant due to its association with the 127.20% Fibonacci Extension.
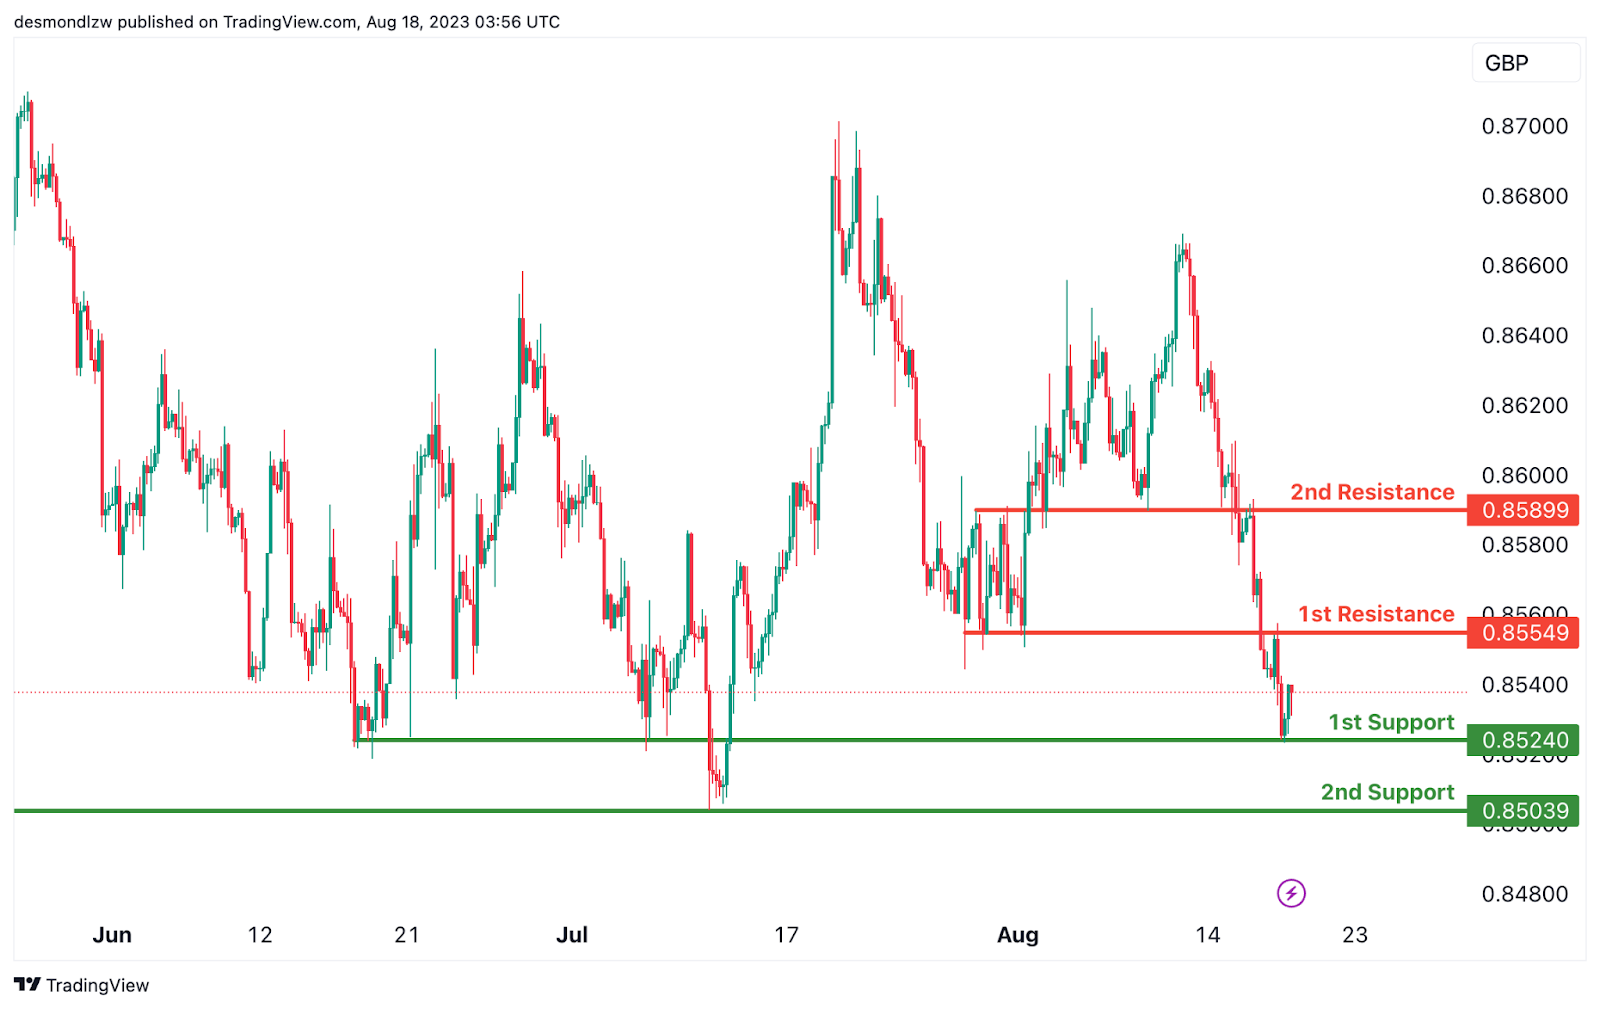
EUR/GBP:
The EUR/GBP chart indicates a bullish overall momentum. There is a potential for a bullish continuation towards the 1st resistance level.
The 1st support is situated at 0.8524 and is considered advantageous due to its overlap support characteristics. Additionally, the 2nd support at 0.8503 is also seen as valuable because it represents an overlap support.
On the resistance side, the 1st resistance level at 0.8554 is noteworthy as it represents a pullback resistance. Furthermore, the 2nd resistance at 0.8589 is also significant due to its overlap resistance characteristics.
GBP/USD:
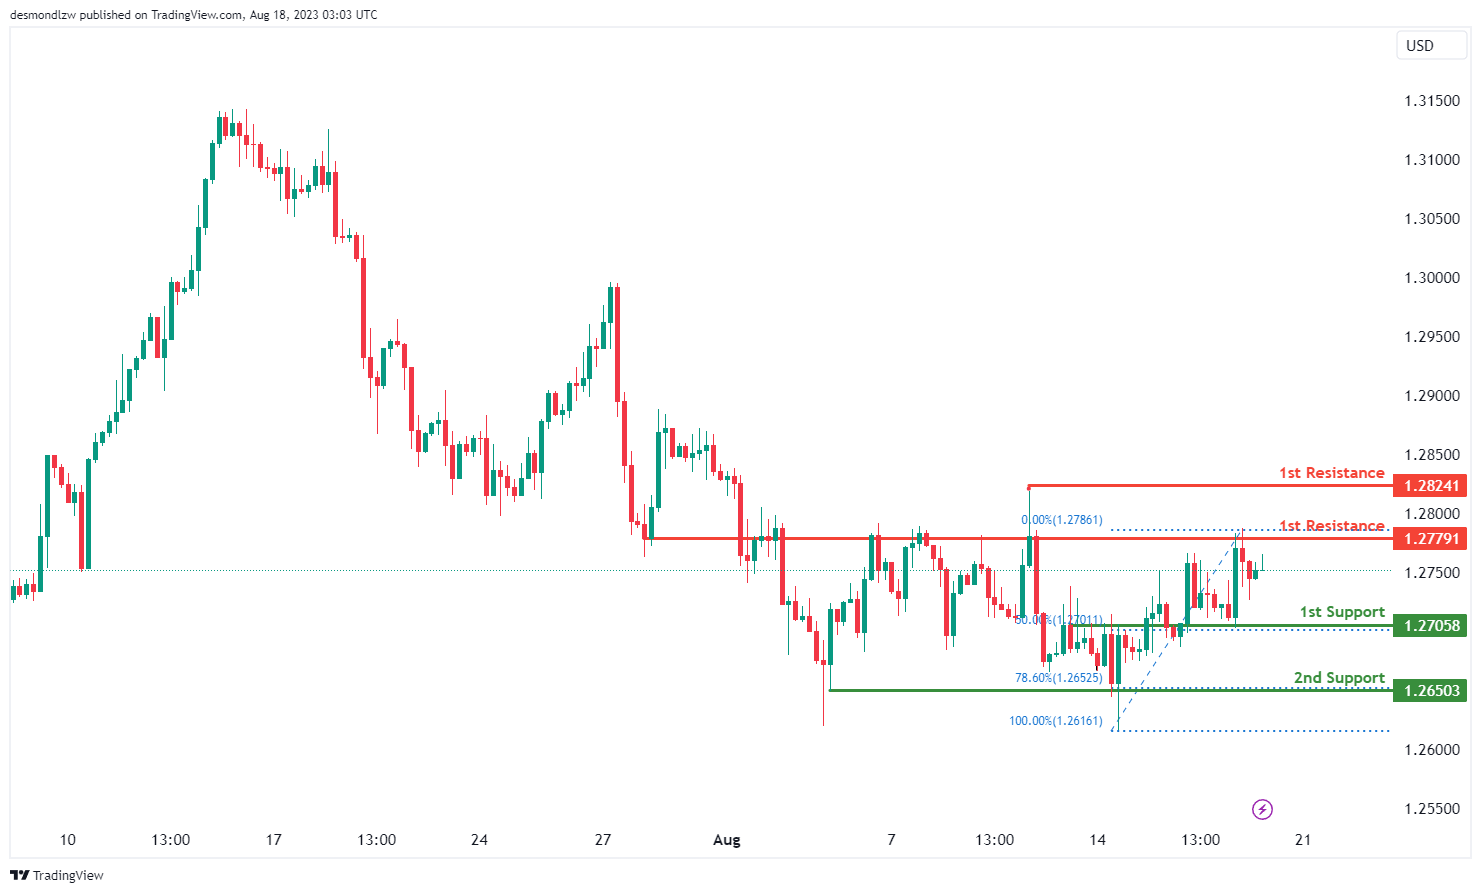
The GBP/USD chart is currently exhibiting a bearish momentum, indicating a prevalent downward trend.
In the context of this bearish momentum, there is a potential scenario where the price continues its bearish movement towards the 1st support level at 1.2705. This support level is considered significant as it aligns with a 50% Fibonacci retracement, enhancing its potential to provide support.
Furthermore, a 2nd support at 1.2650 gains importance due to its identification as a swing low support and its alignment with a 78.60% Fibonacci retracement.
On the resistance side, the 1st resistance level at 1.2779 is noted as an overlap resistance, indicating a potential area of resistance against upward movement.
Similarly, the 2nd resistance at 1.2824 is identified as a swing high resistance, reinforcing its potential to impede upward price action.
GBP/JPY:
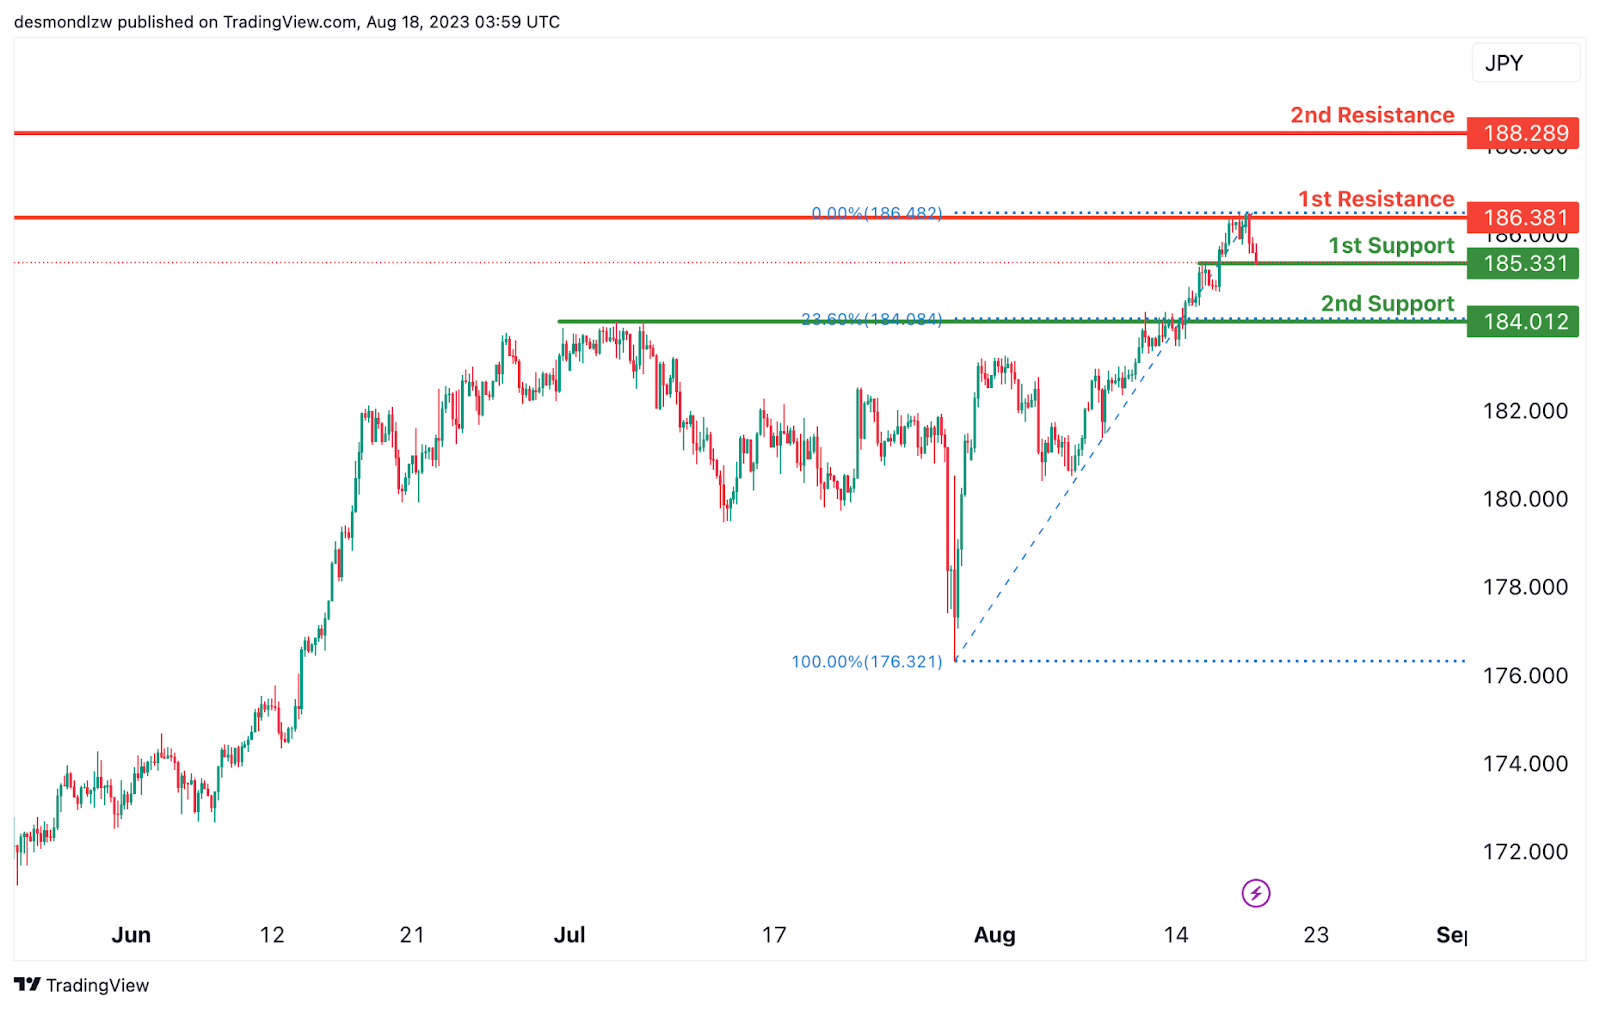
The GBP/JPY chart indicates a weak bullish momentum with low confidence. There is a potential for a bullish bounce off the 1st support level, leading the price towards the 1st resistance.
The 1st support is positioned at 185.33 and is considered advantageous due to its pullback support characteristics. Furthermore, the 2nd support at 184.01 is also seen as valuable because it represents a pullback support along with a 23.60% Fibonacci Retracement.
On the resistance side, the 1st resistance level at 186.38 is noteworthy as it represents a swing high resistance. Additionally, the 2nd resistance at 188.28 is also significant due to its multi-swing high resistance characteristics.
USD/CHF:
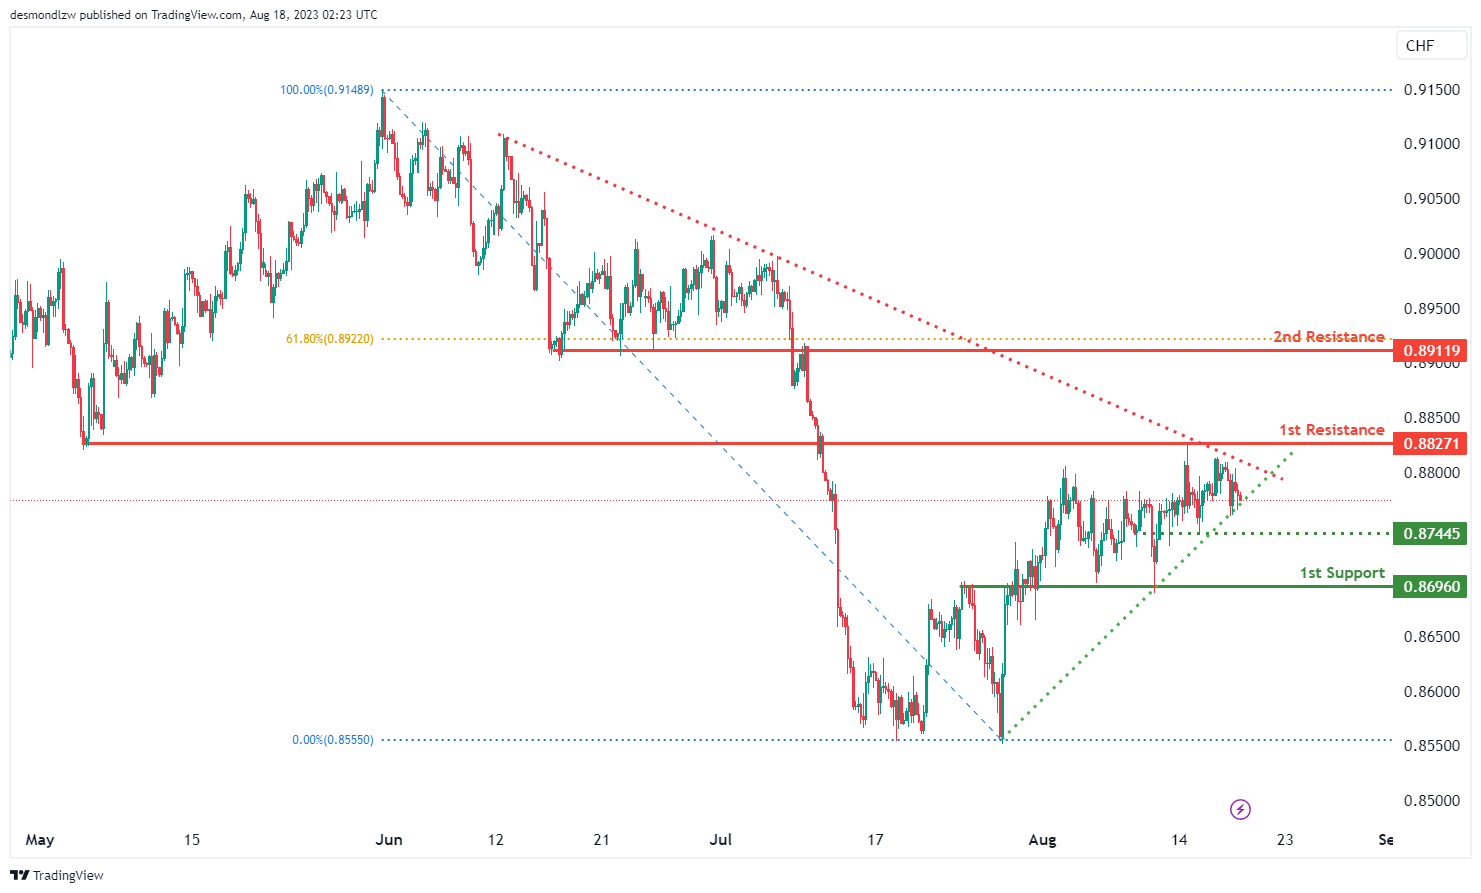
The USD/CHF chart currently presents a neutral momentum, suggesting a lack of a clear trend.
Considering this neutral momentum, there is a possibility that the price might exhibit fluctuations between the 1st resistance and 1st support levels.
The 1st support at 0.8696 is identified as an overlap support, potentially providing a level where price could find temporary stability.
An intermediate support at 0.8744 holds significance as a swing low support, reinforcing its potential to act as a point of temporary price reversal.
Conversely, the 1st resistance at 0.8827 is characterized as an overlap resistance, potentially causing price to face resistance when moving upwards.
Further resistance is found at the 2nd resistance level of 0.8911, which is marked as a pullback resistance, indicating a potential barrier to upward price movement.
Adding to the analysis, a symmetrical triangle chart pattern is observed. Such patterns represent periods of consolidation before a breakout or breakdown occurs. If the price breaks above the upper trendline of the pattern, it could signify a bullish breakout, while a break below the lower trendline might indicate a bearish breakdown. This pattern suggests that a significant price move might be on the horizon.
USD/JPY:
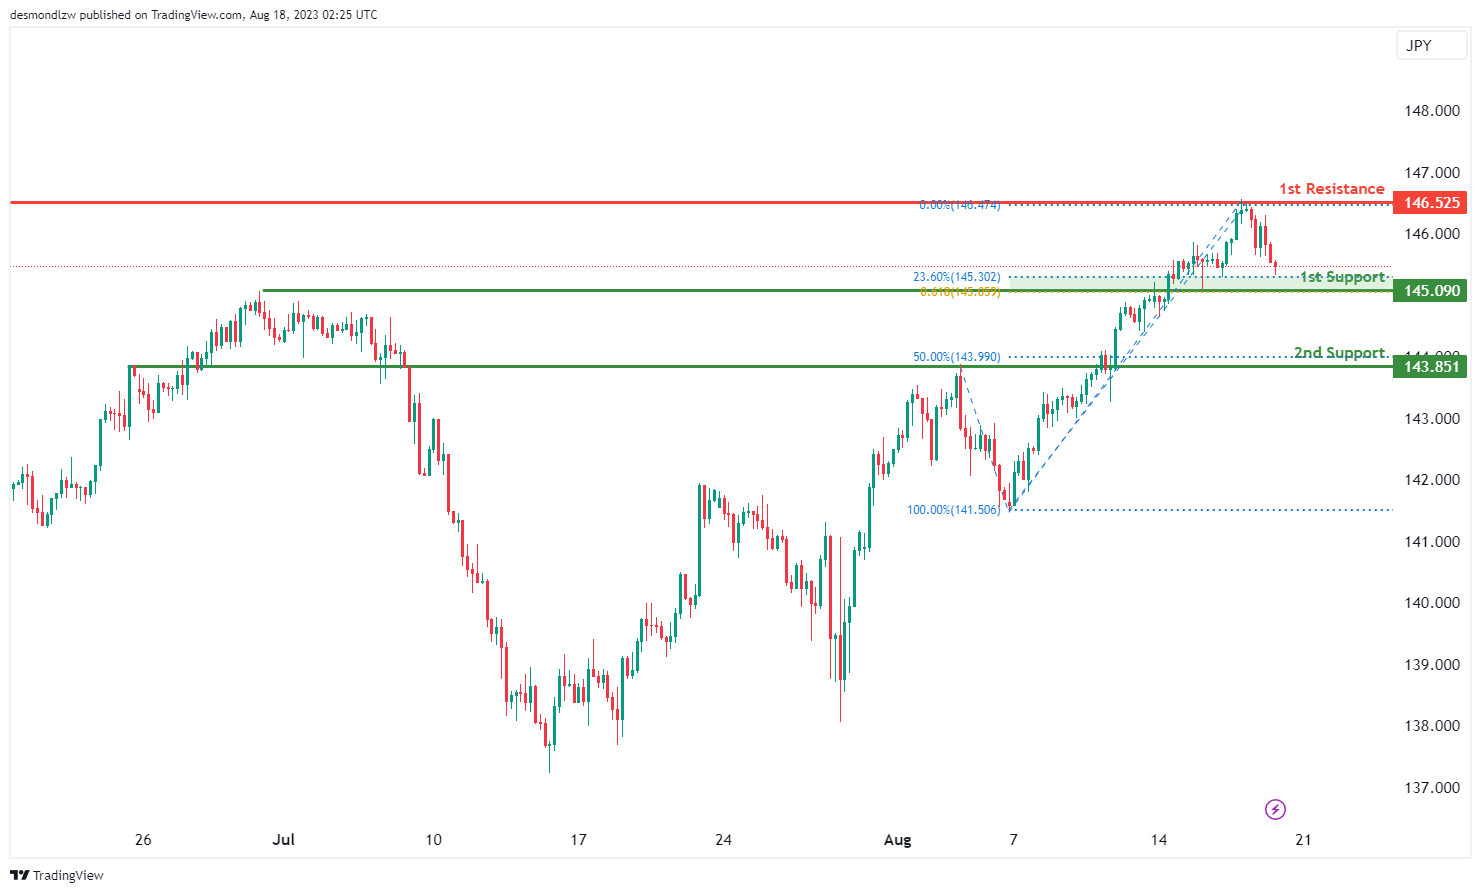
The USD/JPY chart currently exhibits a bullish momentum, indicating a prevalent upward trend.
Given this bullish momentum, there is a potential scenario where the price bounces off the 1st support level and continues its upward movement towards the 1st resistance.
The 1st support level at 145.09 gains significance due to its designation as an overlap support. This level is further reinforced by its alignment with both a 23.60% Fibonacci Retracement and a 61.80% Fibonacci Projection, indicating a notable Fibonacci confluence.
Additionally, a 2nd support level at 143.85 is identified as a pullback support, strengthened by its alignment with a 50% Fibonacci Retracement.
On the opposing side, the 1st resistance level at 146.52 is important as it represents a swing high resistance, possibly causing the price to face resistance when moving upwards.
USD/CAD:
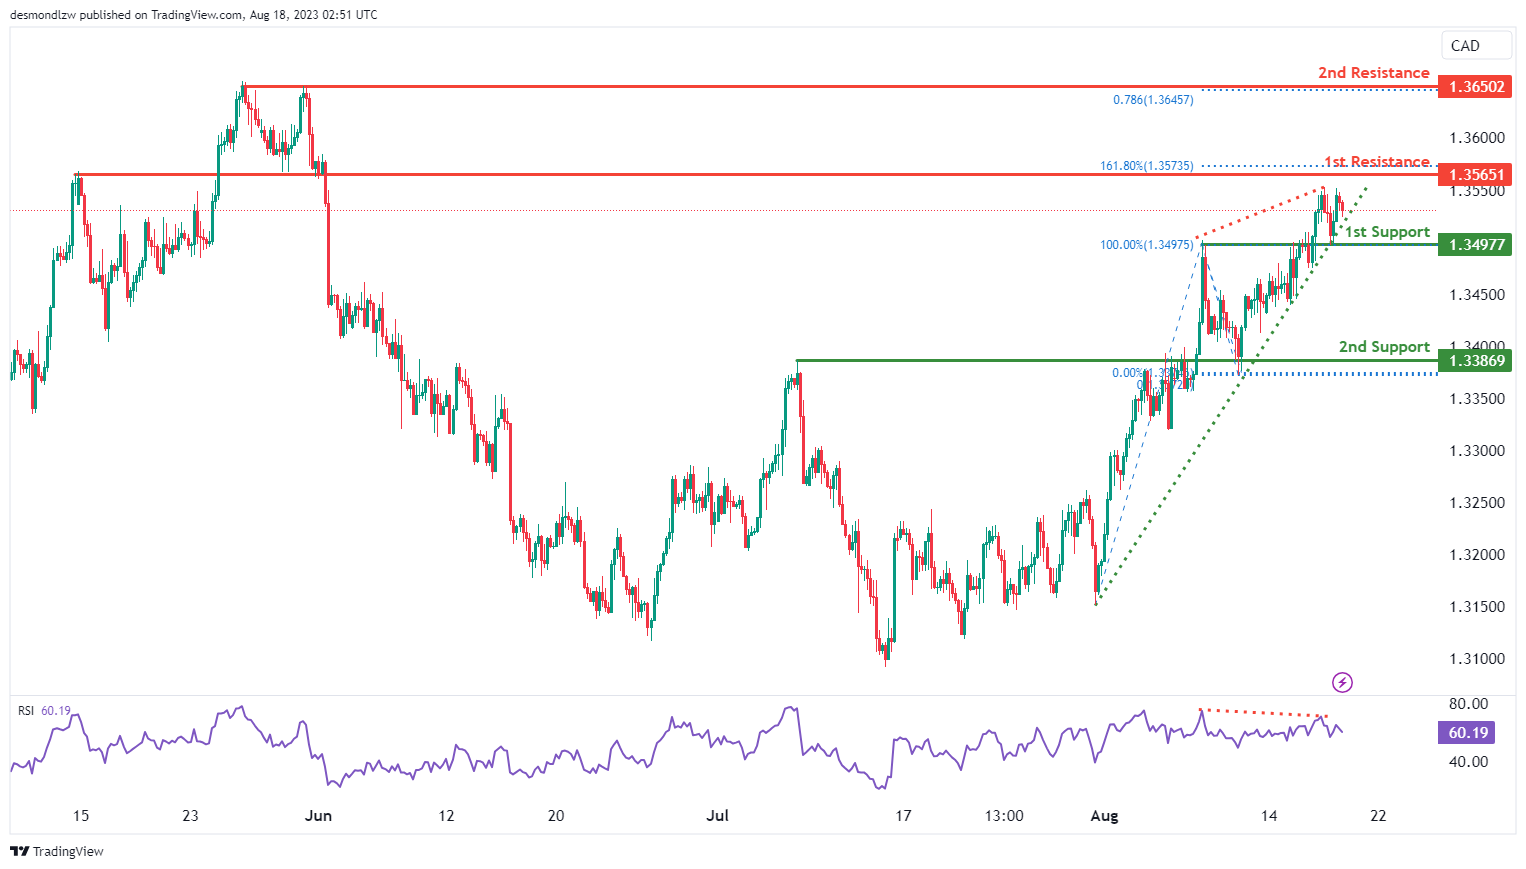
The USD/CAD chart currently exhibits a bearish momentum, implying a dominant downward trend. The RSI indicator is also contributing to the analysis by displaying bearish divergence versus the price, suggesting that the bearish reversal is already in play.
There is a possibility that the price could continue its downward movement towards the 1st support level at 1.3498, which is identified as an overlap support. Furthermore, the 2nd support level at 1.3387 is also identified as an overlap support.
To the upside, the 1st resistance level at 1.3565 is identified as an overlap resistance that aligns with the 161.80% Fibonacci extension level. Additionally, the 2nd resistance at 1.3650 is identified as a multi-swing high resistance that aligns with the 78.60% Fibonacci projection level.
AUD/USD:
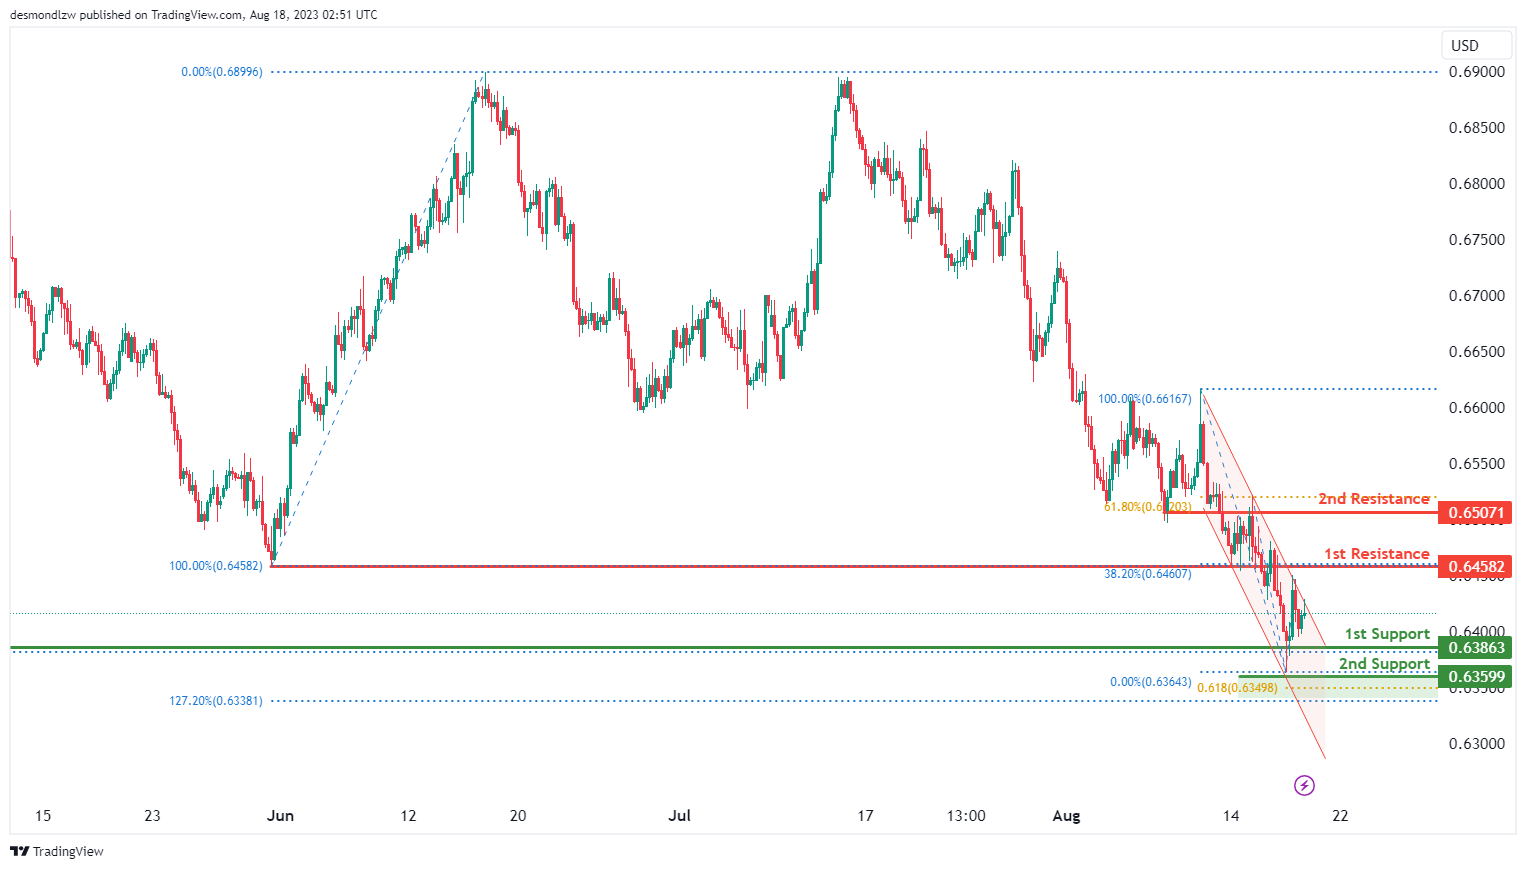
The AUD/USD chart currently displays a bearish momentum, indicating a predominant downward trend. This bearish momentum is influenced by the price’s movement within a descending channel pattern.
Considering this bearish context, there is a potential scenario where the price continues its downward trajectory towards the 1st support level at 0.6386 that is identified as an overlap support and aligns the 78.60% Fibonacci retracement level. Furthermore, the 2nd support at 0.6359 is identified as a swing-low support that aligns with the 61.80% Fibonacci projection level.
To the upside, the 1st resistance level at 0.6458 is identified as an overlap resistance that aligns with the 38.20% Fibonacci retracement level. Additionally, the 2nd resistance level at 0.6507 is also identified as an overlap resistance that aligns with the 61.80% Fibonacci retracement level.
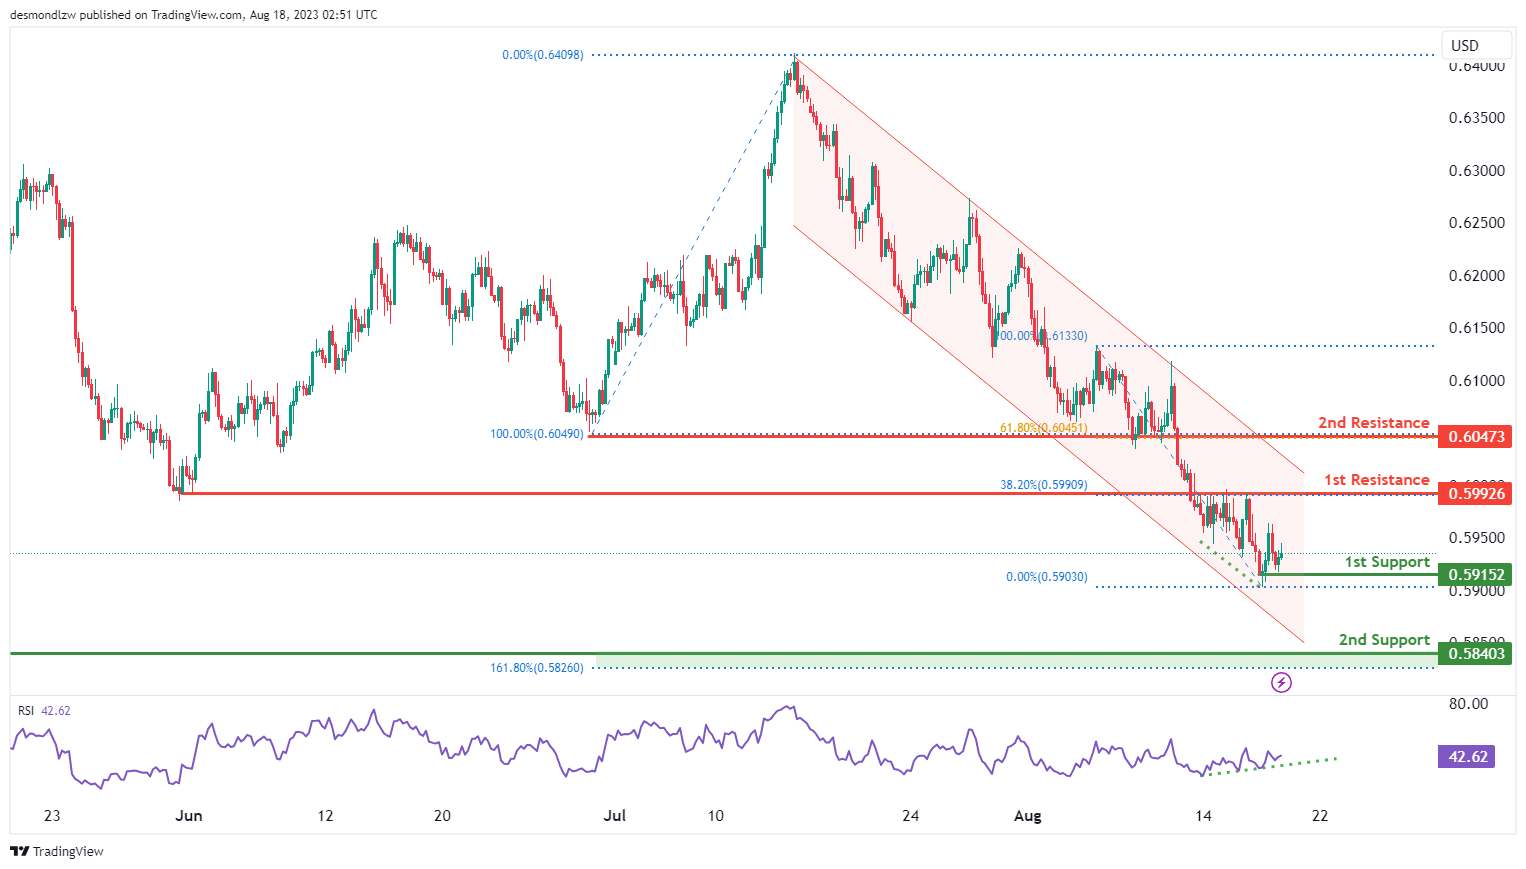
NZD/USD
The NZD/USD chart exhibits a bearish momentum, indicating a prevailing downward trend. This bearish momentum is supported by the price’s movement within a descending channel pattern.
The price could continue its downward movement towards the 1st support level at 0.5915 that is identified as a swing-low support. Additionally, the 2nd support at 0.5840 is also identified as a swing-low support that aligns with the 161.80% Fibonacci extension level.
To the upside, the 1st resistance level at 0.5993 is identified as an overlap resistance that aligns with the 38.20% Fibonacci retracement level. Furthermore, the 2nd resistance at 0.6047 is identified as an overlap resistance that aligns with the 61.80% Fibonacci retracement level.
It is also worth noting that the RSI is showing bullish divergence versus price, which could suggest a potential bounce in the near future. This divergence might influence a temporary reversal in the ongoing bearish trend.
DJ30:
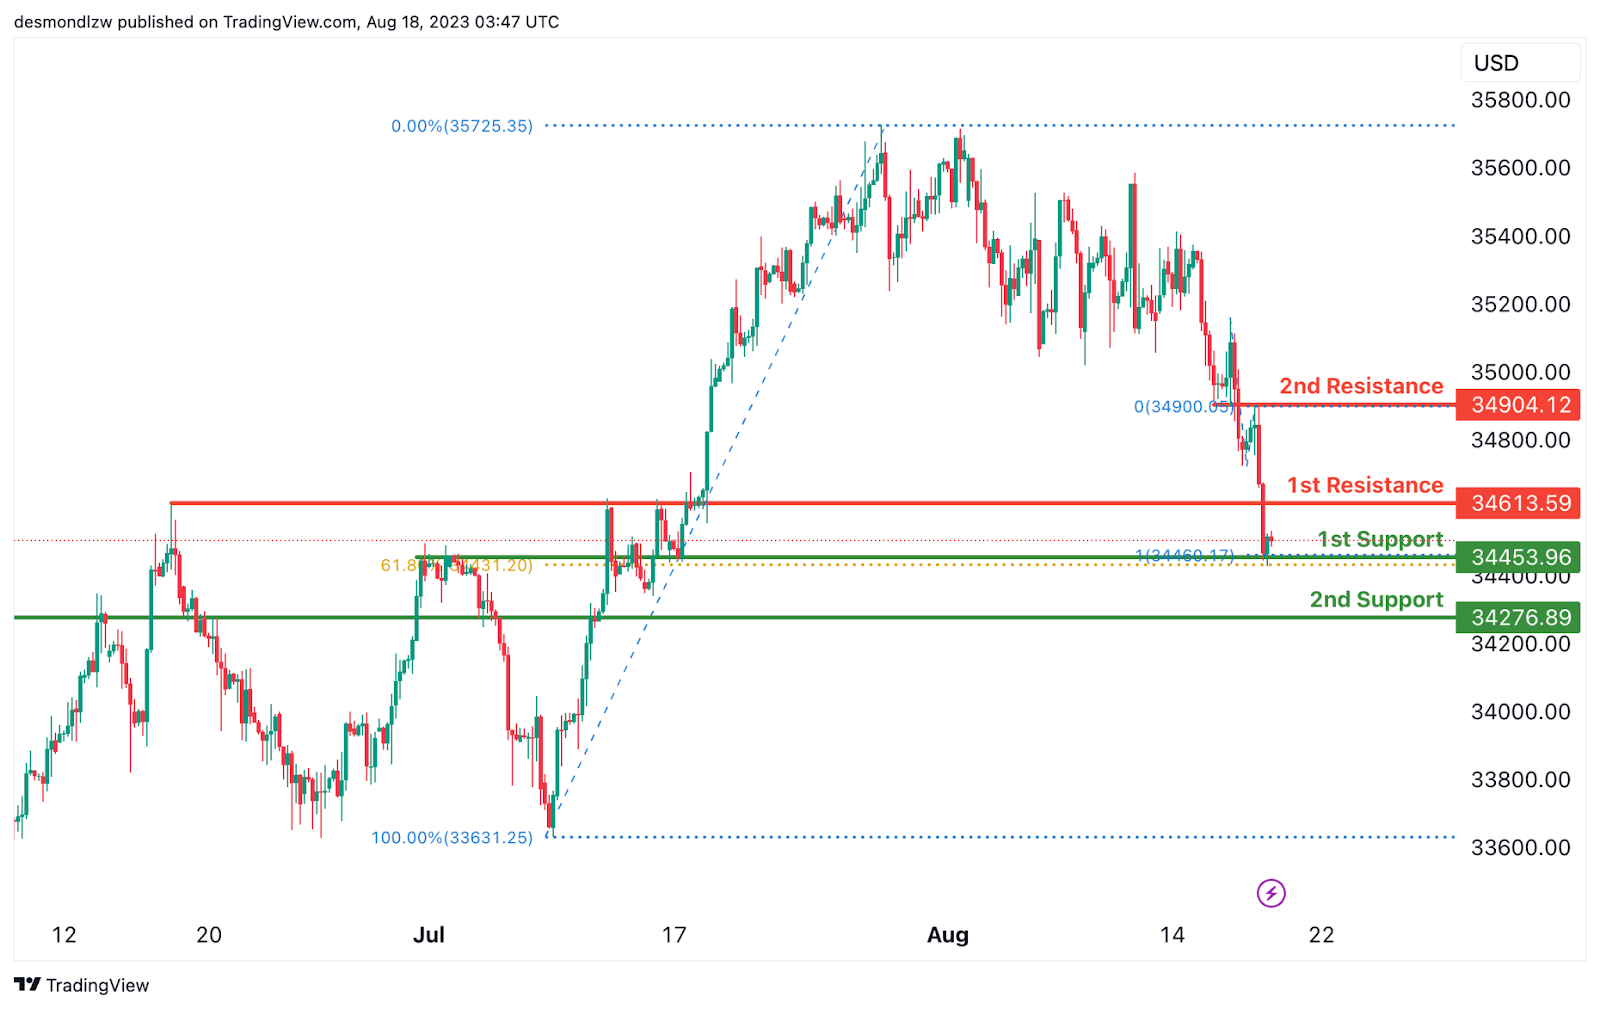
The DJ30 chart indicates a bullish overall momentum. There is a potential for a bullish bounce off the 1st support level, leading the price towards the 1st resistance.
The 1st support is positioned at 34453.96 and is considered advantageous due to its overlap support and a 61.80% Fibonacci Retracement. Furthermore, the 2nd support at 34276.89 is also seen as valuable because it represents an overlap support.
On the resistance side, the 1st resistance level at 34613.59 is noteworthy as it represents a pullback resistance. Additionally, the 2nd resistance at 34904.12 is also significant due to its pullback resistance characteristics.
GER30:
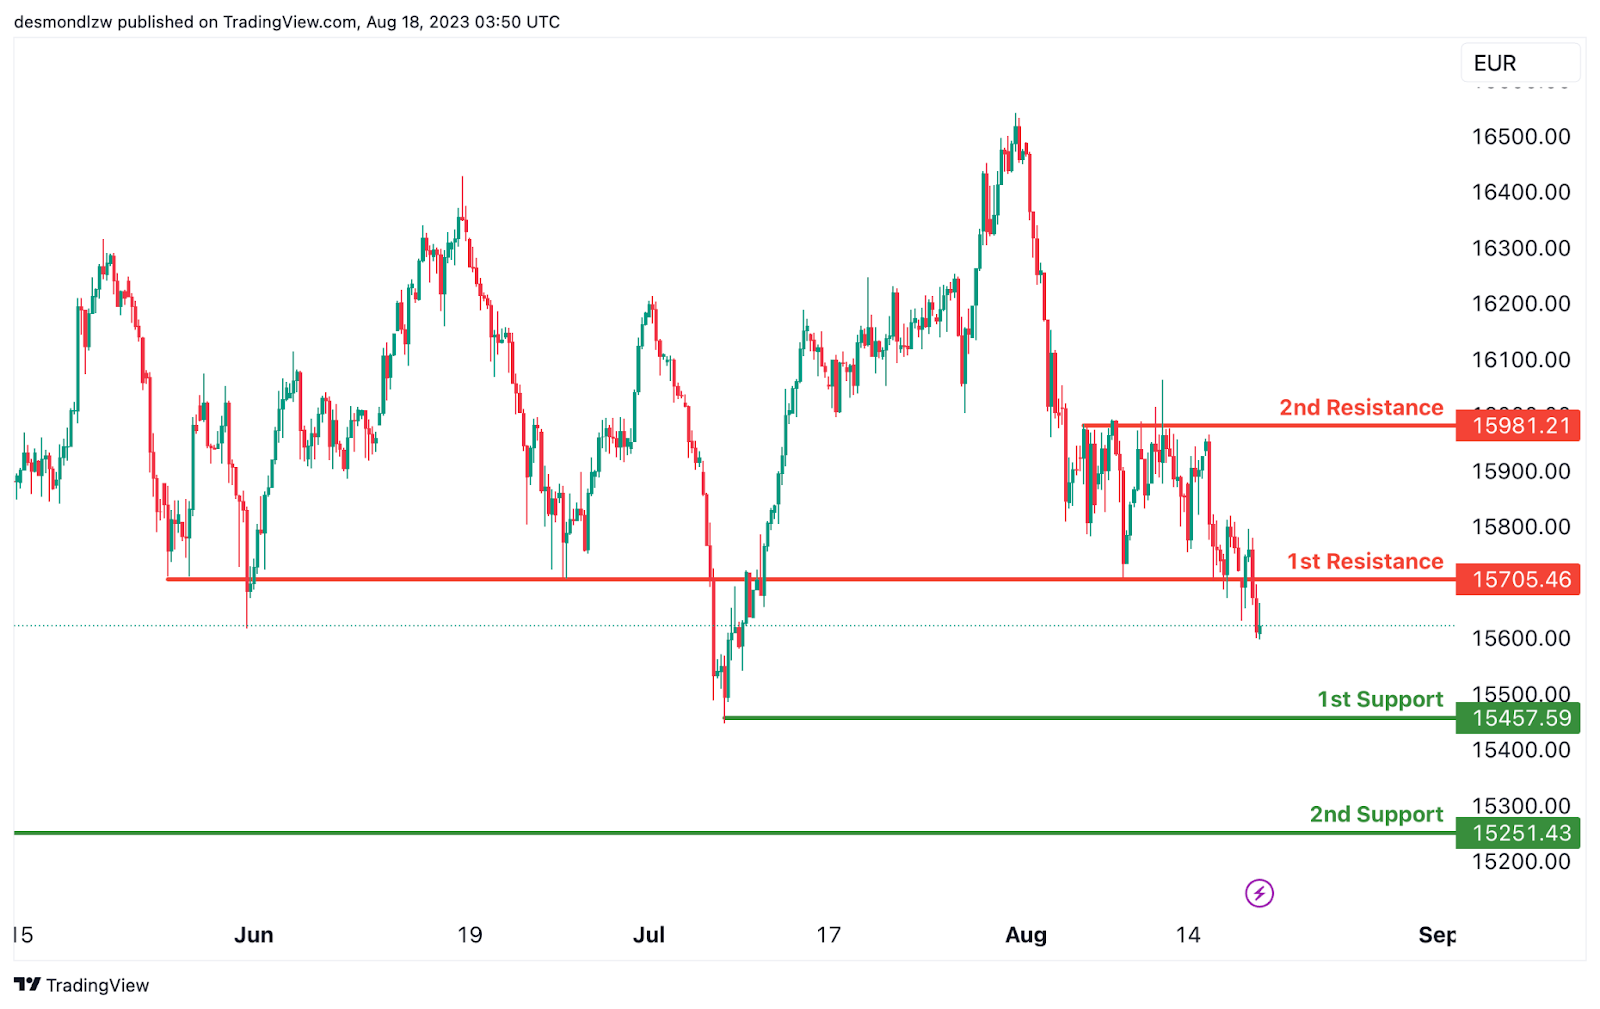
The GER30 chart indicates a bearish overall momentum. There is a potential for a bearish continuation towards the 1st support level.
The 1st support is situated at 15457.59 and is considered advantageous due to its swing low support characteristics. Furthermore, the 2nd support at 15251.43 is also seen as valuable because it represents an overlap support.
On the resistance side, the 1st resistance level at 15705.46 is noteworthy as it represents an overlap resistance. Additionally, the 2nd resistance at 15981.21 is also significant due to its pullback resistance characteristics.
US500
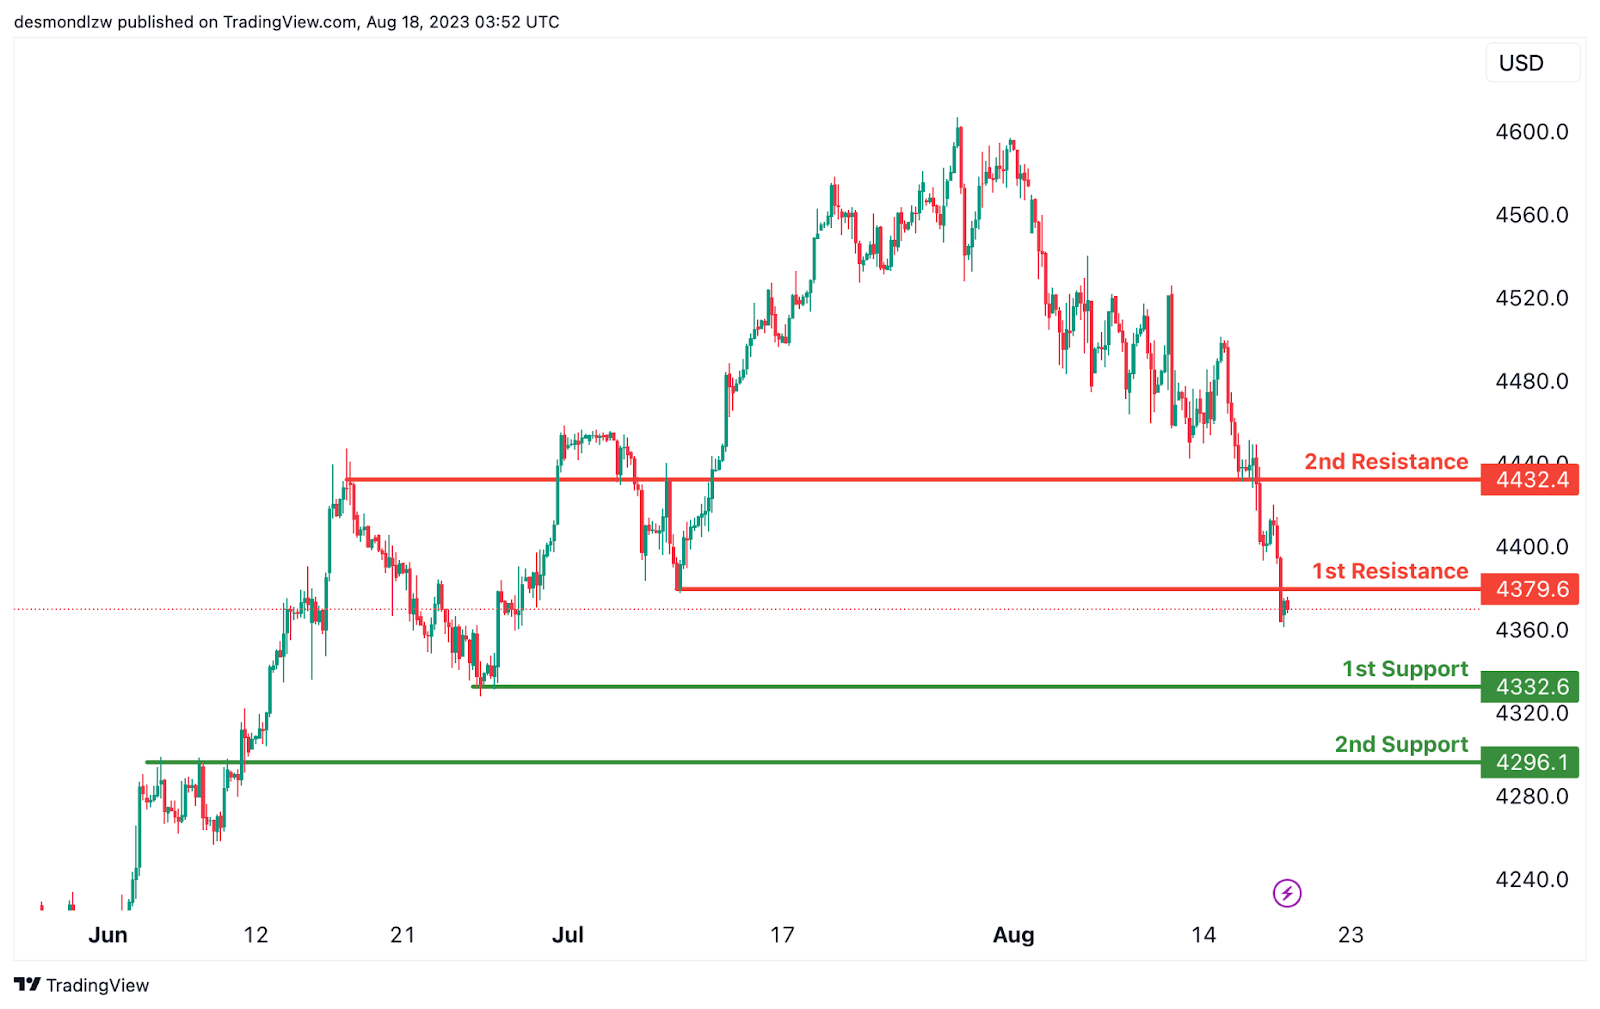
The US500 chart indicates a bearish overall momentum. There is a potential for a bearish continuation towards the 1st support level.
The 1st support is located at 4332.6 and is considered advantageous due to its swing low support characteristics, along with a 100% Fibonacci Projection.
Furthermore, the 2nd support at 4296.1 is also seen as valuable as it represents a pullback support.
On the resistance side, the 1st resistance level at 4379.6 is noteworthy as it represents a pullback resistance. Additionally, the 2nd resistance at 4432.4 is also significant due to its overlap resistance characteristics.
BTC/USD:
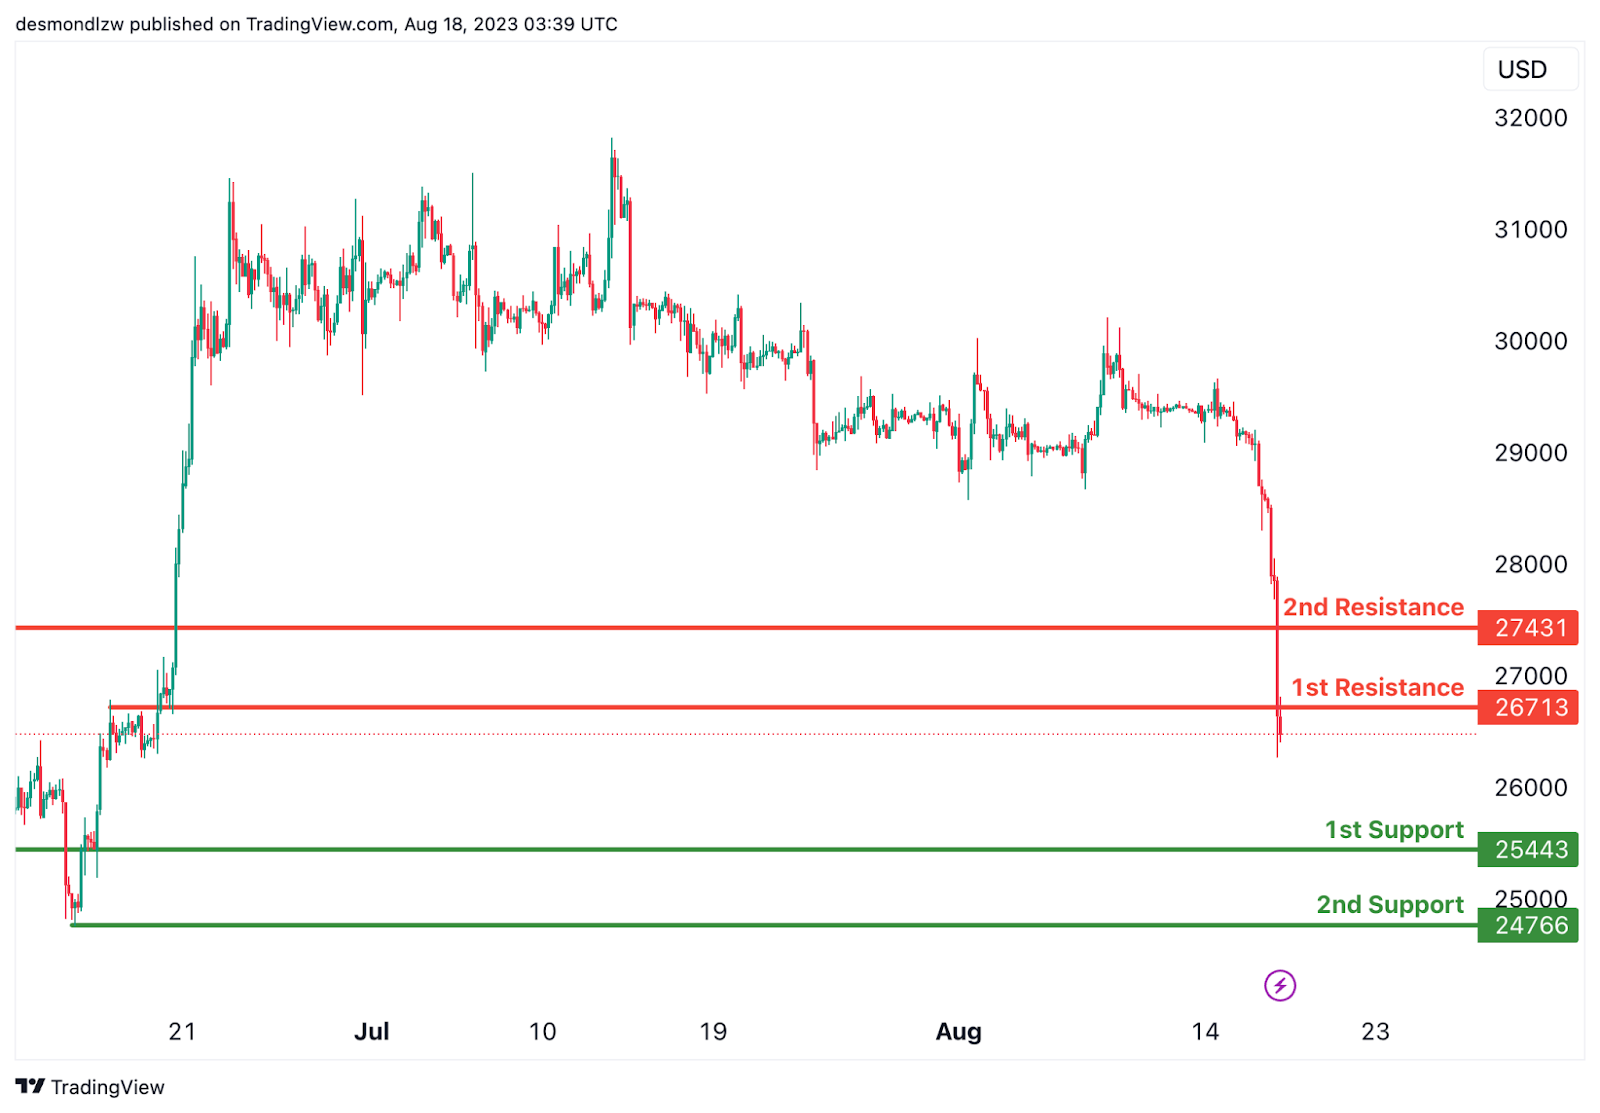
The BTC/USD chart indicates a bearish overall momentum. There is a potential for a bearish reaction off the 1st resistance level, leading to a drop towards the 1st support level.
The 1st support is situated at 25443 and is considered advantageous due to its overlap support characteristics. Additionally, the 2nd support at 24766 is viewed as valuable because it represents a swing low support.
On the resistance side, the 1st resistance level at 26713 is noteworthy as it represents an overlap resistance. Furthermore, the 2nd resistance at 27431 is also seen as significant due to its overlap resistance characteristics.
ETH/USD:
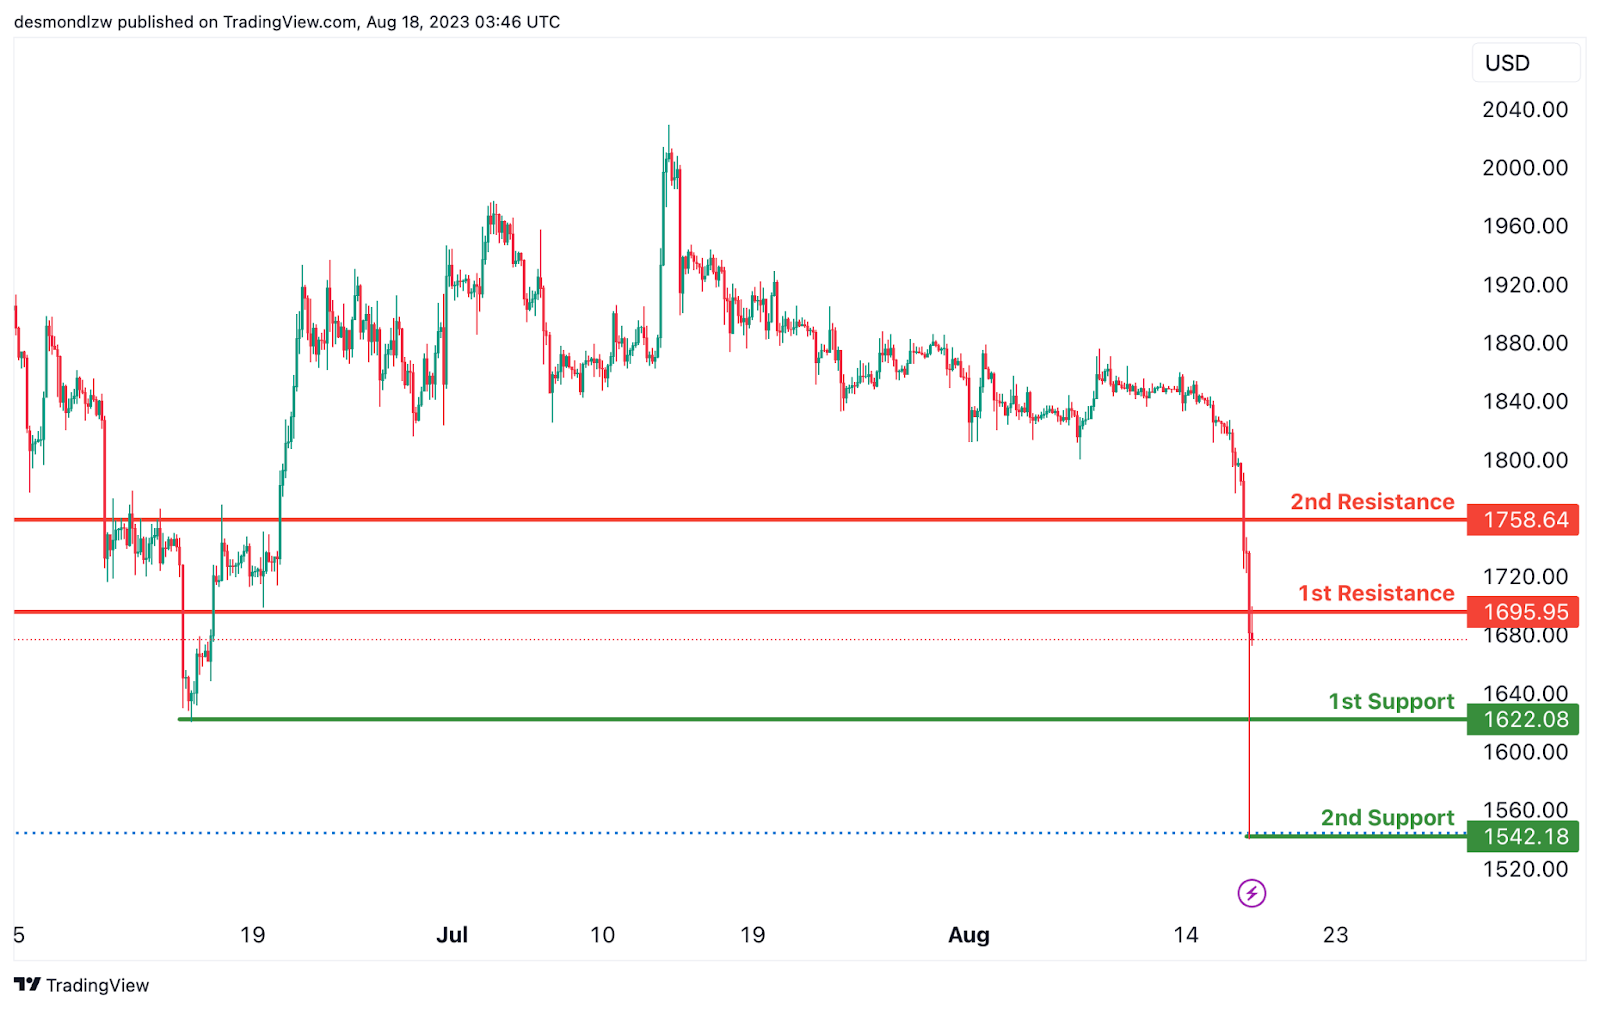
The ETH/USD chart shows a bearish overall momentum. There is a potential for a bearish reaction off the 1st resistance level, leading to a drop towards the 1st support level.
The 1st support is located at 1622.08 and is considered advantageous due to its pullback support characteristics. Furthermore, the 2nd support at 1542.18 is also seen as valuable because it represents a swing low support along with a 78.60% Fibonacci Retracement.
On the resistance side, the 1st resistance level at 1695.95 is noteworthy as it represents an overlap resistance. Additionally, the 2nd resistance at 1758.64 is also significant due to its overlap resistance characteristics.
WTI/USD:
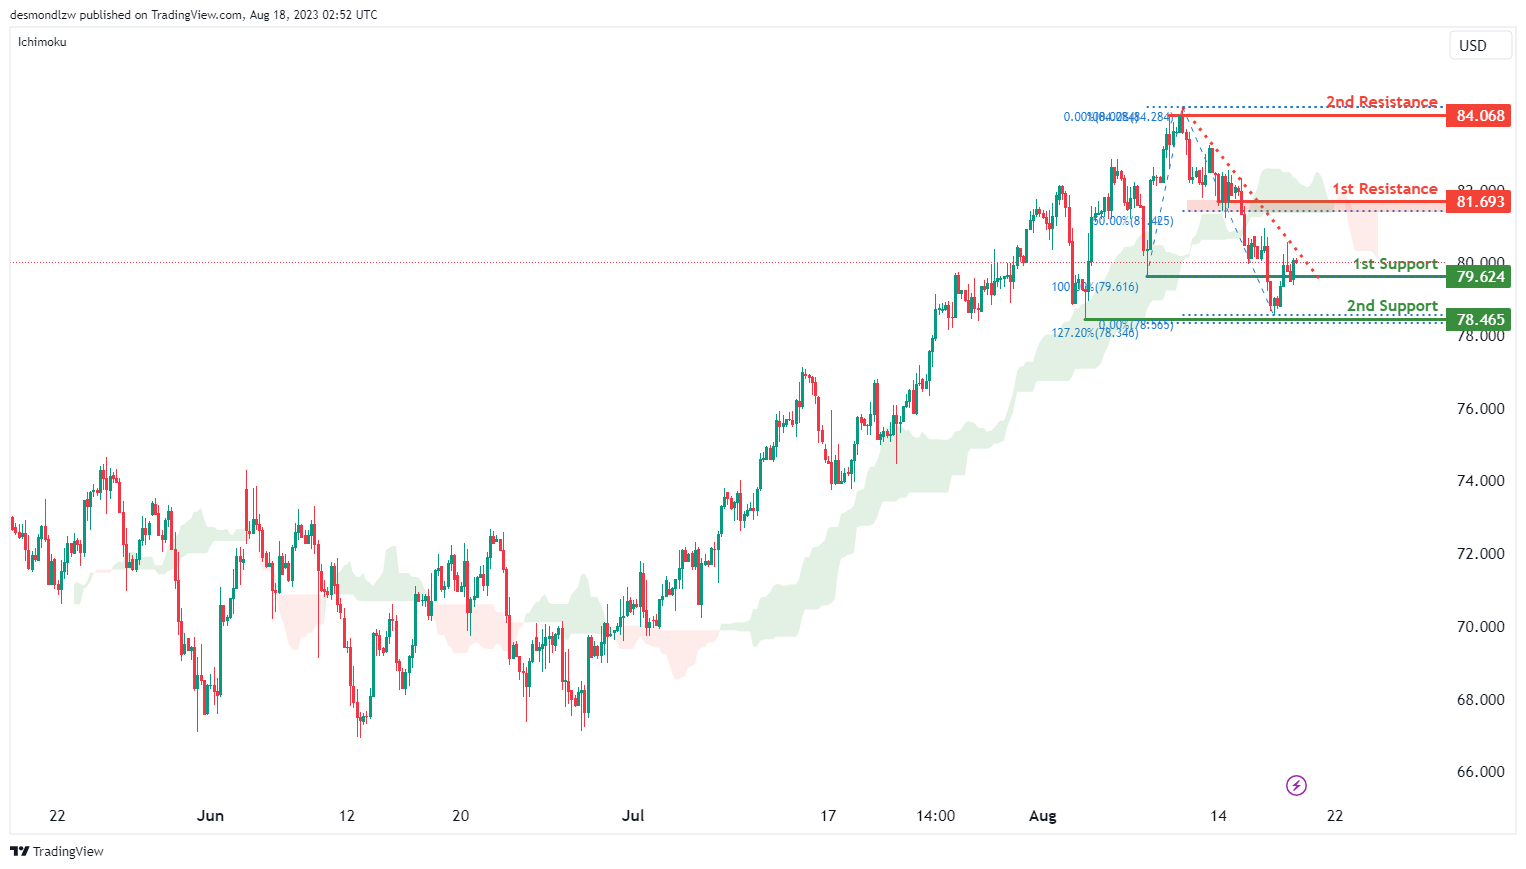
The WTI/USD chart is currently displaying a bearish momentum, suggesting a prevailing downward trend. This bearish momentum is supported by the price being below a significant descending trend line and also below the Ichimoku cloud.
Given this bearish momentum, there is a potential scenario where the price could continue its downward movement towards the 1st support level at 79.62 which is identified as an overlap support. The 2nd support at 78.47 is identified as an overlap support that aligns with the 127.20% Fibonacci extension level.
To the upside, the 1st resistance level at 81.69 is identified as a pullback resistance that aligns close to the 50.0% Fibonacci retracement level. Additionally, the 2nd resistance at 84.07 is notable for being a swing-high resistance.
XAU/USD (GOLD):
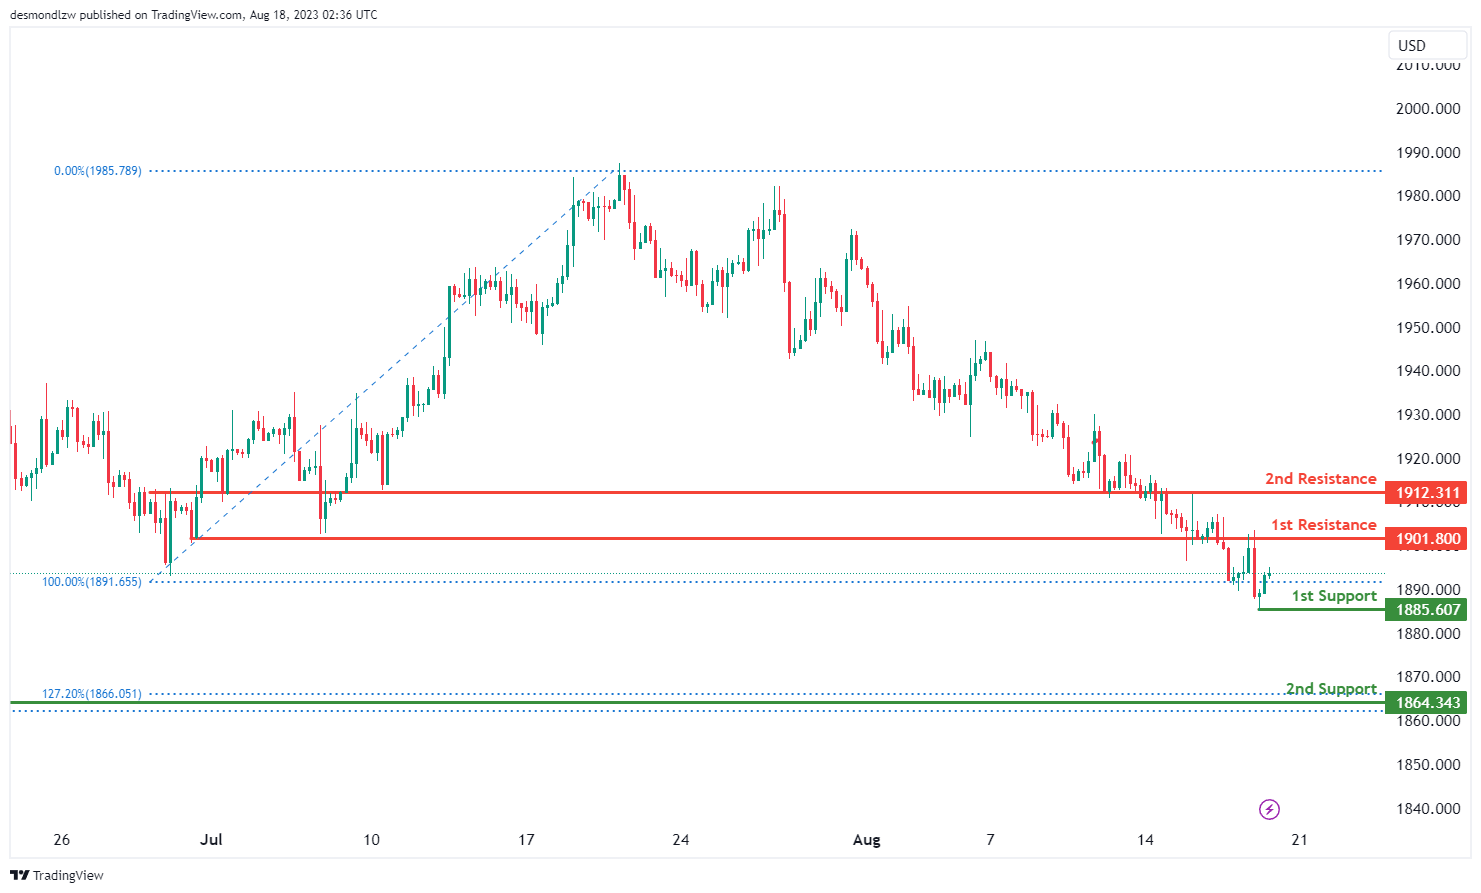
The XAUUSD chart currently demonstrates a bearish momentum, indicating a prevailing downward trend.
Considering this bearish momentum, there is a possibility that the price might experience a temporary upward movement towards the 1st resistance level in the short term before reversing direction and dropping towards the 1st support.
The significance of the 1st support level at 1885.60 lies in its role as a swing low support. Similarly, the 2nd support at 1864.34 is reinforced as a pullback support, and its importance is further highlighted by its alignment with a 127.20% Fibonacci Extension.
Conversely, the 1st resistance level at 1901.80 is noted as an overlap resistance, possibly acting as a temporary barrier for the price during its upward movement. Furthermore, the presence of a 2nd resistance at 1912.31 adds to the potential resistance zones, where the price might face hurdles in its upward trajectory.
UK retail sales volumes down -1.2% in Jul, sales value down -1.0% mom
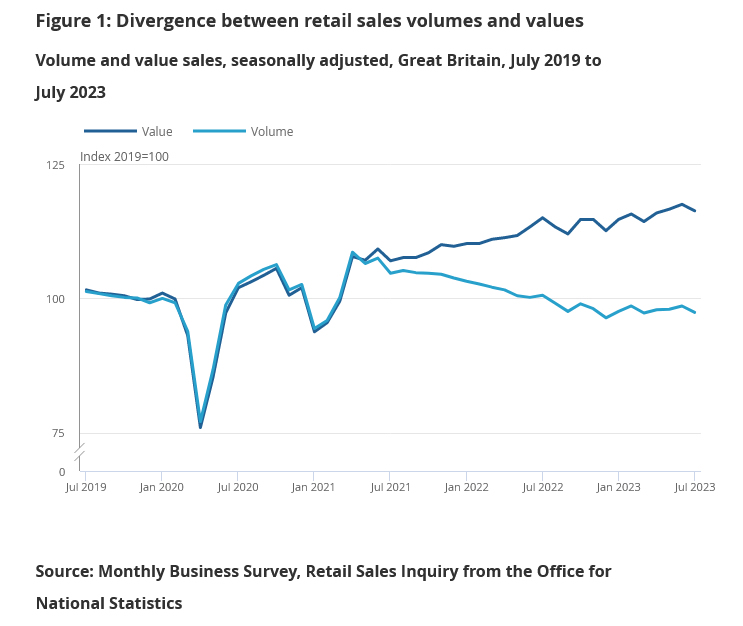
UK retail sales volumes dropped -1.2% mom in July, much worse than expectation of -0.4% mom. Ex-automotive fuel sales volume dropped -1.4% mom. In value term, sales dropped -1.0% mom while ex-fuel sales contracted -1.4% mom.
Food stores sales volumes fell by -2.6% mom. Non-food stores sales volumes fell by -1.7% mom. Automotive fuel stores sales volumes rose by 0.7% mom. Non-store retailing sales volumes rose by 2.8% mom.
ONS also noted, shoppers switching to online shopping because of poor weather and increased promotions led to 27.4% of retail sales taking place online in July 2023, up from 26.0% in June 2023; this is the highest proportion since February 2022 (28.0%).
EUR/USD Daily Outlook
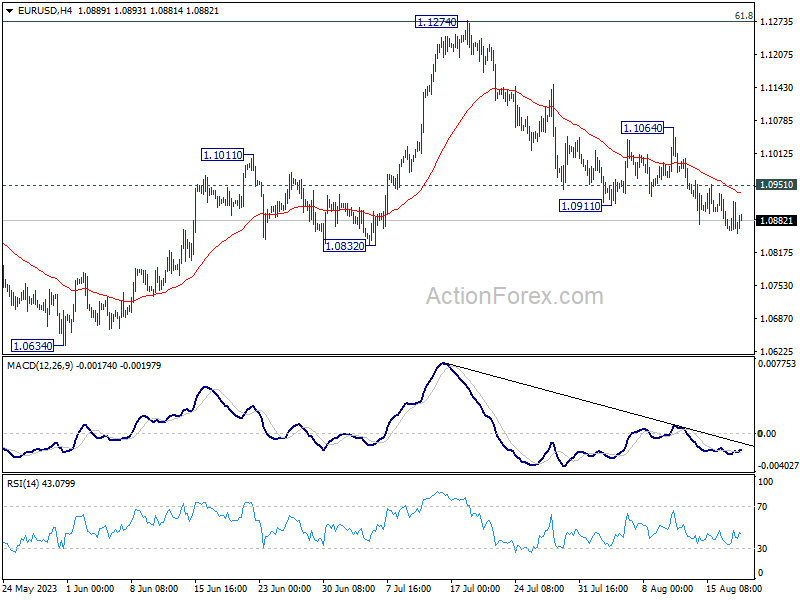
Daily Pivots: (S1) 1.0847; (P) 1.0883; (R1) 1.0908; More...
Intraday bias in EUR/USD stays on the downside at this point, even though downside momentum is relatively unconvincing. Break of 1.0832 will extend the fall from 1.1274 to 1.0609/34 cluster support. On the upside, above 1.0951 minor resistance will turn intraday bias neutral first. But risk will stay on the downside as long as 1.1064 resistance holds, in case of rebound.
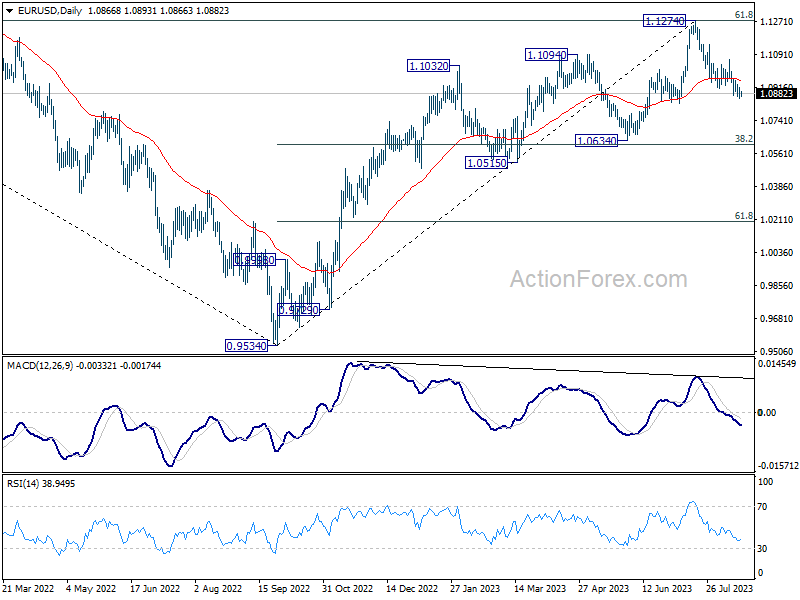
In the bigger picture, a medium term top should be formed at 1.1274, after failing to break through 61.8% retracement of 1.2348 (2021 high) to 0.9534 at 1.1273 decisively, on bearish divergence condition in D MACD. Fall from there is seen as a correction to the uptrend from 0.9534 (2022 low). Deeper decline would be seen to 1.0634 cluster support (38.2% retracement of 0.9534 to 1.1274 at 1.0609). Strong support could be seen there, at least on first attempt, to set the range for consolidation. Yet, medium term outlook will be neutral for now, as long as 1.1274 resistance holds.
Dollar Struggling to Gain Momentum Despite Global Market Shakeup
In the face of mounting tumult across stocks, bonds, and the crypto realm, the currency market projects an island of relative calm. Despite the extended rout in equities and treasuries and the dramatic tumble in Bitcoin, the forex market has responded with comparative restraint. A discernible dip in commodity currencies is on display, with Australian Dollar leading the downturn as the worst performer of the week, trailed closely by its New Zealand and Canadian counterparts. However, a rapid downward spiral hasn't taken hold as of yet.
On the flip side, while Dollar and Swiss Franc chart among the top performers, British Pound (Sterling) continues its reign, retaining its premier top position. In the mix, both the Euro and Yen tread a middle ground, neither significantly surging nor plummeting. But there is prospect of a stronger rise in Yen ahead.
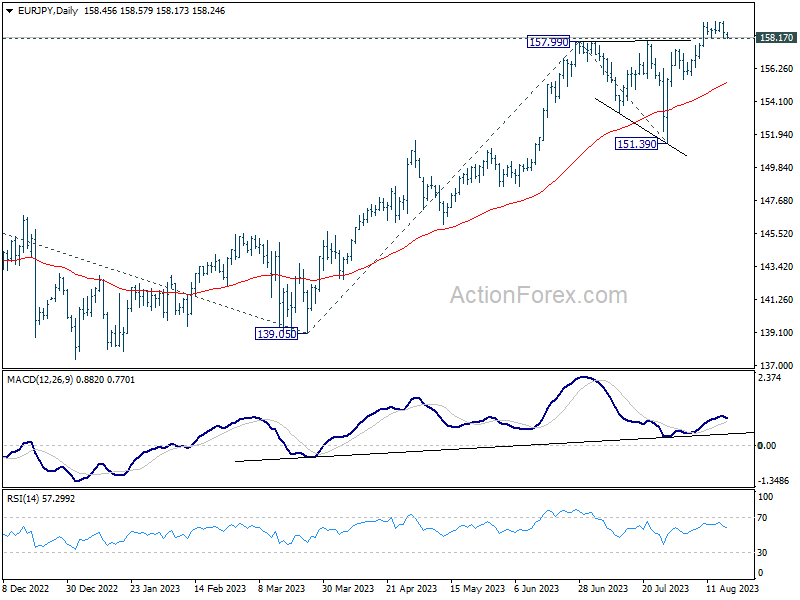
From a technical perspective, as the week draws to a close, the spotlight could shift to potential movements in Yen pairs. Should EUR/JPY breaks 158.17 support, it would likely signal a short-term peak, ushering in a more pronounced dip towards the 55 D EMA (now at 155.32). Such a move could correspondingly pull USD/JPY downwards, and possibly, a parallel dip in EUR/USD.
In Asia, at the time of writing, Nikkei is down -0.41%. Hong Kong HSI is down -1.12%. China Shanghai SSE is down -0.06%. Singapore Strait Times is down -0.69%. Overnight, DOW dropped -0.84%. S&P 500 dropped -0.77%. NASDAQ dropped -1.17%. 10-year yield rose 0.050 to 4.308.
Japan CPI core eased to 3.1% in Jul, but core-core back at four decade high
Japan's core CPI, which excludes fresh food, eased slightly from 3.3% yoy in June to 3.1% yoy in July, aligning with market expectations. Notably, this metric continued its streak above BoJ's 2% inflation target for a commendable 16 consecutive months.
Diving deeper, core-core CPI, which subtracts both fresh food and energy, inched higher to 4.3% yoy, equalling the peak seen in May. This current rate hasn't been witnessed since 1981, underscoring the latent inflationary pressures within the Japanese economy.
Processed food costs are a particular hotspot, skyrocketing by 9.2% yoy – a surge not seen in nearly half a century. Adding to this, durable goods saw a robust rise of 6.0% yoy. Furthermore, possibly driven by travel and vacationing demand, accommodation fees witnessed a significant 15.1% yoy hike during the prime summer holiday period.
Conversely, energy prices painted a contrasting picture, plummeting by -8.7% yoy. This decline can largely be attributed to government interventions, with subsidies introduced to mitigate household utility expenses. These subsidies, in turn, have played a pivotal role, dragging the core CPI lower by approximately one percentage point.
Service prices also shifted gears, moving up to 2% yoy from 1.6% yoy – the most substantial leap since 1993 if we set aside the aftermath of the 1997 sales tax hike.
Despite these intricate dynamics, headline CPI remained steadfast at 3.3% yoy.
Market turbulence: Bitcoin crash and NASDAQ selloff
Markets witnessed Bitcoin's dramatic plunge over the last 12 hours, fueled by a succession of negative headlines: the escalating Ripple-SEC legal drama, reports of SpaceX's substantial Bitcoin write-down, and the bankruptcy filing of China's Evergrande. But a more important question is whether the cryptocurrency's slide mirrors is part of a larger shift in risk sentiment, underscored by this week's drop in US stocks.
The tremors in the crypto market seemed to intensify post US Federal Judge Analisa Torres' nod to the SEC's interlocutory appeal, which came shortly after a preliminary ruling favoring Ripple. The narrative was further dented the Wall Street Journal's disclosure about SpaceX's USD 373m Bitcoin value markdown in recent years, combined with the "unexpected" news of Evergrande's Chapter 15 bankruptcy protection in New York.
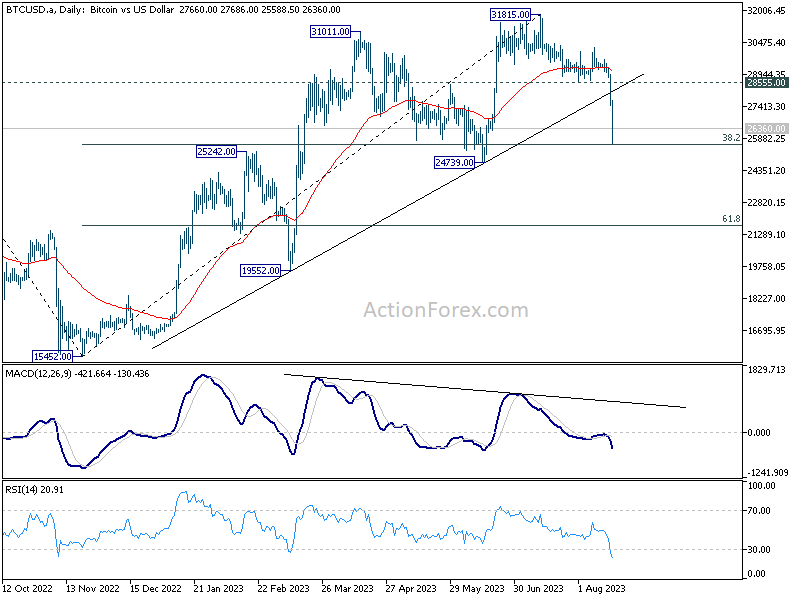
Bitcoin fell to as low as 25588 in Asian session, and recovered just ahead of 38.2% retracement of 15452 to 31815 at 25564. Risk will stay heavily on the downside as long as 28555 support turned resistance holds. Attention will be on the reaction to support zone between 24739 and 25564.
Strong rebound from this level will keep price actions from 31815 as a medium term correction only, i.e. the up trend from 15452 is not over yet. However, decisive break of this support zone will significantly raise the chance of trend reversal, and could trigger deeper acceleration to 61.8% retracement at 21702 at least.
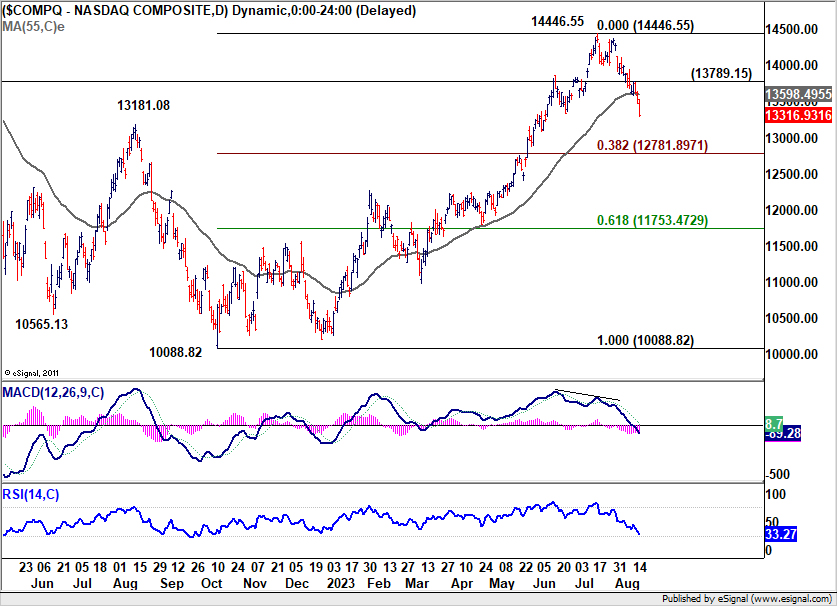
At the same time, NASDAQ also closed sharply lower by -1.17%. Deeper fall is expected as long as 13789.15 resistance holds, to 38.2% retracement of 10088.82 to 14446.55 at 12781.89. Reaction from there will unveil whether the decline is just a correction to the rise from 10088.82, or reversing the whole trend.
Looking ahead
UK retails sales and Eurozone CPI final are the main features in European session. later in the day, Canada will release IPPI and RMPI.
EUR/USD Daily Outlook
Daily Pivots: (S1) 1.0847; (P) 1.0883; (R1) 1.0908; More...
Intraday bias in EUR/USD stays on the downside at this point, even though downside momentum is relatively unconvincing. Break of 1.0832 will extend the fall from 1.1274 to 1.0609/34 cluster support. On the upside, above 1.0951 minor resistance will turn intraday bias neutral first. But risk will stay on the downside as long as 1.1064 resistance holds, in case of rebound.
In the bigger picture, a medium term top should be formed at 1.1274, after failing to break through 61.8% retracement of 1.2348 (2021 high) to 0.9534 at 1.1273 decisively, on bearish divergence condition in D MACD. Fall from there is seen as a correction to the uptrend from 0.9534 (2022 low). Deeper decline would be seen to 1.0634 cluster support (38.2% retracement of 0.9534 to 1.1274 at 1.0609). Strong support could be seen there, at least on first attempt, to set the range for consolidation. Yet, medium term outlook will be neutral for now, as long as 1.1274 resistance holds.
Economic Indicators Update
| GMT | Ccy | Events | Actual | Forecast | Previous | Revised |
|---|---|---|---|---|---|---|
| 23:30 | JPY | National CPI Y/Y Jul | 3.30% | 3.30% | ||
| 23:30 | JPY | National CPI ex-Fresh Food Y/Y Jul | 3.10% | 3.10% | 3.30% | |
| 23:30 | JPY | National CPI ex Food Energy Y/Y Jul | 4.30% | 4.20% | ||
| 06:00 | GBP | Retail Sales M/M Jul | -0.40% | 0.70% | ||
| 09:00 | EUR | Eurozone CPI Y/Y Jul F | 5.30% | 5.30% | ||
| 09:00 | EUR | Eurozone Core CPI Y/Y Jul F | 5.50% | 5.50% | ||
| 12:30 | CAD | Industrial Product Price M/M Jul | 0.20% | -0.60% | ||
| 12:30 | CAD | Raw Material Price Index Jul | 2.10% | -1.50% |