

Sample Category Title
Gold Looks Heading Towards $1800
Gold has gained 0.3% since the start of the day on Friday, marking only its third session of gains since the beginning of August. Despite signs of local oversold conditions suggesting a bounce, the ultimate downside target looks to be the $1800 area.
Gold’s sharp decline began a month ago when the bears once again prevented the metal from consolidating above $1980, a critical resistance level since May.

On the way down in August, gold first broke below the 50-day MA and then two days ago below the 200-day MA. Both curves act as medium and long-term trend indicators. Gold failed to rally higher after a drop below the 50-day MA, but the failure only intensified the sell-off.
Tuesday and Wednesday saw a battle for the 200-day, which the Bears also won. Since the beginning of 2021, at least a month of sustained pressure on prices has followed such a signal.
This week, gold also broke below previous local lows – another signal of a downtrend formation in addition to lower local highs: $1985 in July vs. $2080 in May.
A crucial fundamental factor putting pressure on gold is the rise in government bond yields in developed countries with falling inflation. It is becoming increasingly difficult for gold to compete on yield.
We also expect China’s attempts to protect its currency from depreciation to lead to US government bonds and gold sales.
And we must consider the possibility that other major emerging market reserve holders will do the same as they face diminishing returns from the economic slowdown.
If there is no strong rally above $1905 today or Monday, confidence will grow that gold’s downtrend is already established. The $1800-1810 area is a potential technical target in this case. This is where gold has been supported or surrendered many times over the past three years.
The 200-week MA, which has attracted buyers for the past six years, passes through these levels, and we expect the battle to be much more intense at these levels.

Dollar Index Hits New Two-Month High
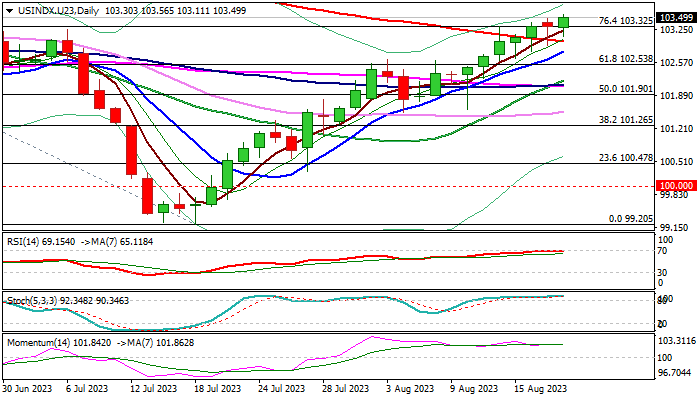
The Dollar Index hit new near two-month high on Friday, after price action slightly reduced speed on Thursday.
Break of Fibo resistance at 103.32 (76.4% of 104.59/99.20) marks fresh bullish signal, which looks for confirmation on weekly close above this level.
Long tails of recent daily candles point to strong demand, which contribute to firmly bullish daily studies and continue to underpin the price, offsetting warnings from overbought conditions.
The index is on track for the fifth consecutive week of gains, the largest uninterrupted advance since Apr/May 2022, which adds to positive outlook.
The downside should remain protected by broken 200DMA (103.01) to keep bulls intact for extension towards 104.59 (May 31 peak), with this week’s twist of weekly cloud also expected to attract bulls.
The dollar remains underpinned by increasing concerns over China’s economic growth and signals that US interest rates my stay high for some time, as recent economic data showed that US economy is resilient despite high interest rates.
Res: 103.72; 104.00; 104.33; 104.59.
Sup: 103.32; 103.01; 102.80; 102.53.
EUR/USD Mid-Day Outlook
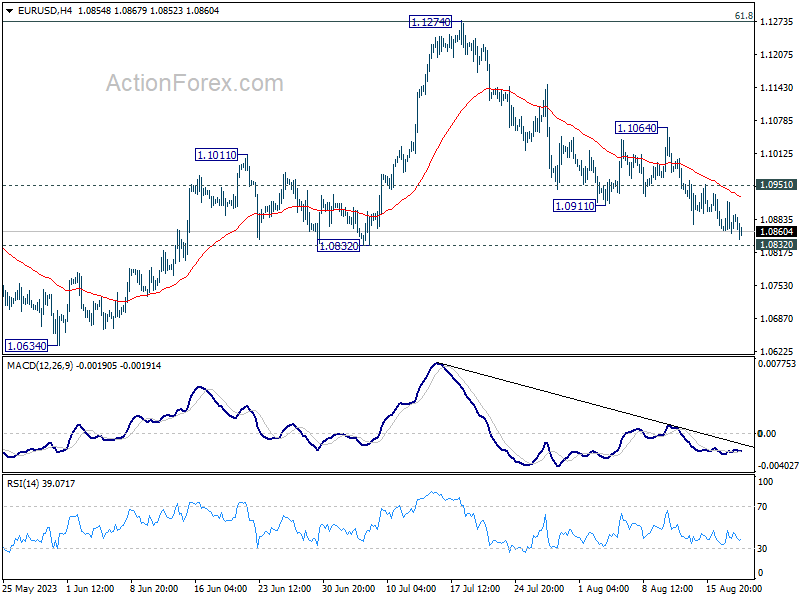
Daily Pivots: (S1) 1.0847; (P) 1.0883; (R1) 1.0908; More...
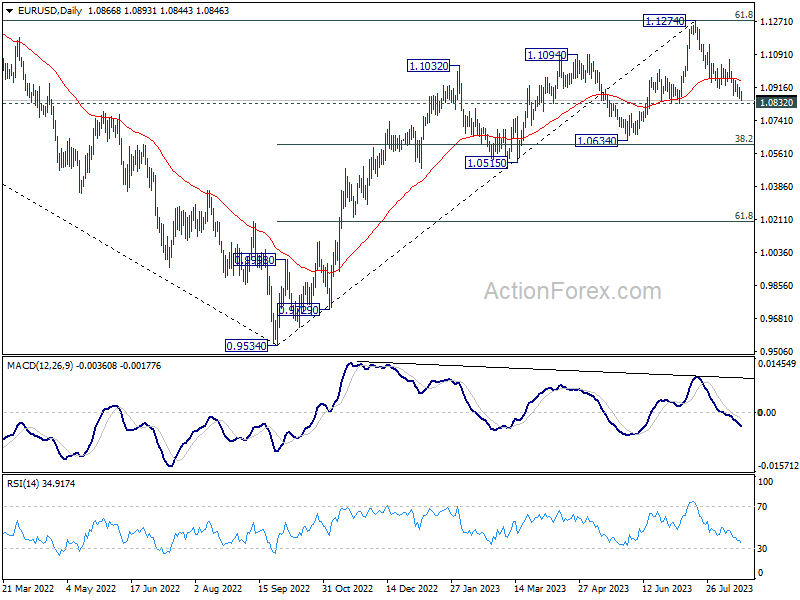
Intraday bias in EUR/USD remains on the downside at this point. Firm break of 1.0832 support will extend the fall from 1.1274 to 1.0609/34 cluster support. On the upside, above 1.0951 minor resistance will turn intraday bias neutral first. But risk will stay on the downside as long as 1.1064 resistance holds, in case of rebound.
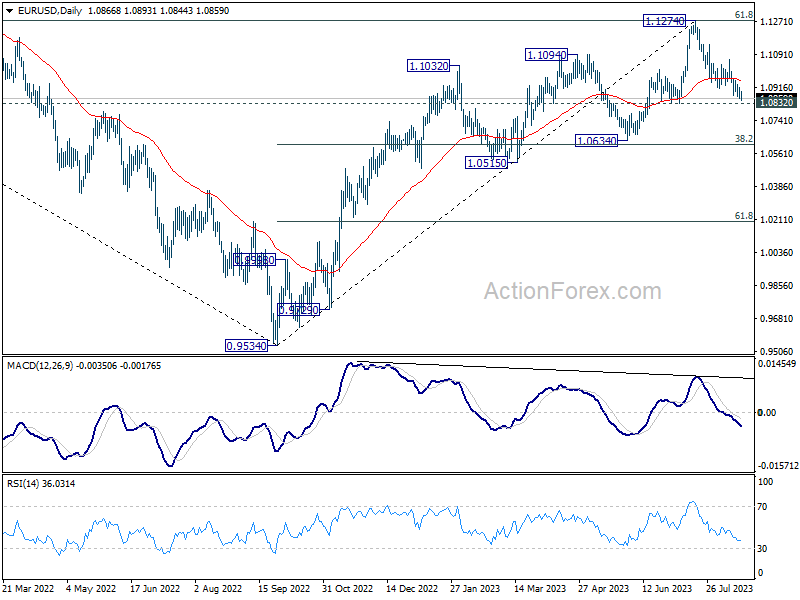
In the bigger picture, a medium term top should be formed at 1.1274, after failing to break through 61.8% retracement of 1.2348 (2021 high) to 0.9534 at 1.1273 decisively, on bearish divergence condition in D MACD. Fall from there is seen as a correction to the uptrend from 0.9534 (2022 low). Deeper decline would be seen to 1.0634 cluster support (38.2% retracement of 0.9534 to 1.1274 at 1.0609). Strong support could be seen there, at least on first attempt, to set the range for consolidation. Yet, medium term outlook will be neutral for now, as long as 1.1274 resistance holds.
GBP/USD Mid-Day Outlook
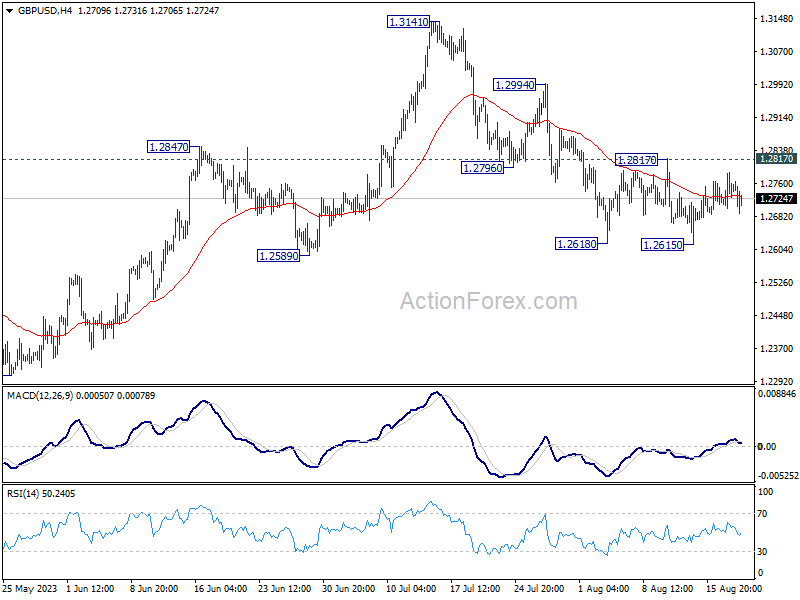
Daily Pivots: (S1) 1.2704; (P) 1.2746; (R1) 1.2789; More...
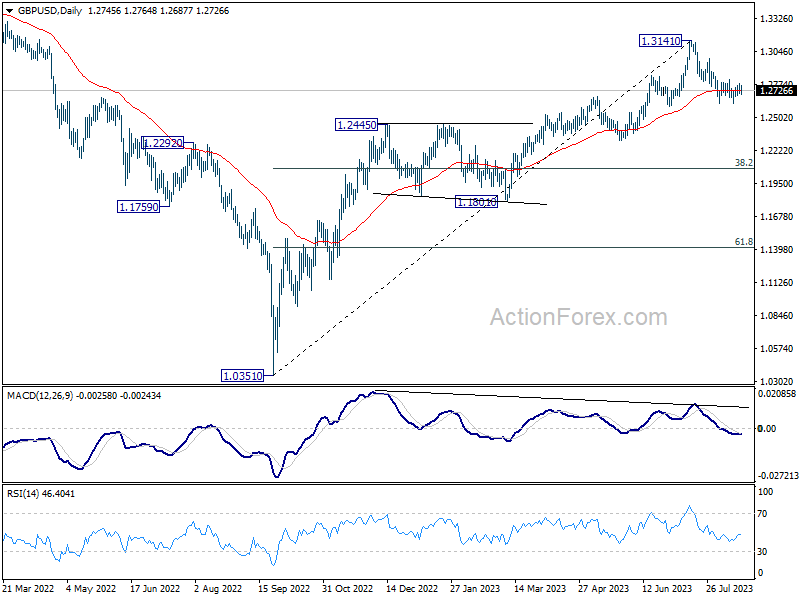
Range trading continues in GBP/USD and intraday bias remains neutral. On the downside, firm break of 1.2615, and sustained trading below 1.2678 resistance turned support will argue that it's already in a larger correction. Deeper decline would then be seen to 1.2306 support next. Nevertheless, break of 1.2817 minor resistance will indicate that the pull back from 1.3141 has completed, and turn bias back to the upside for stronger rebound.
In the bigger picture, a medium term top could be in place at 1.3141 already, on bearish divergence condition in D MACD. Sustained trading below 55 D EMA (now at 1.2723) should confirm this case, and bring deeper fall to 38.2% retracement of 1.0351 to 1.3141 at 1.2075, as a correction to up trend from 1.0351 (2022 low). For now, rise will stay mildly on the downside as long as 1.3141 resistance holds, in case of strong rebound.
USD/JPY Mid-Day Outlook
Daily Pivots: (S1) 145.46; (P) 146.01; (R1) 146.40; More...
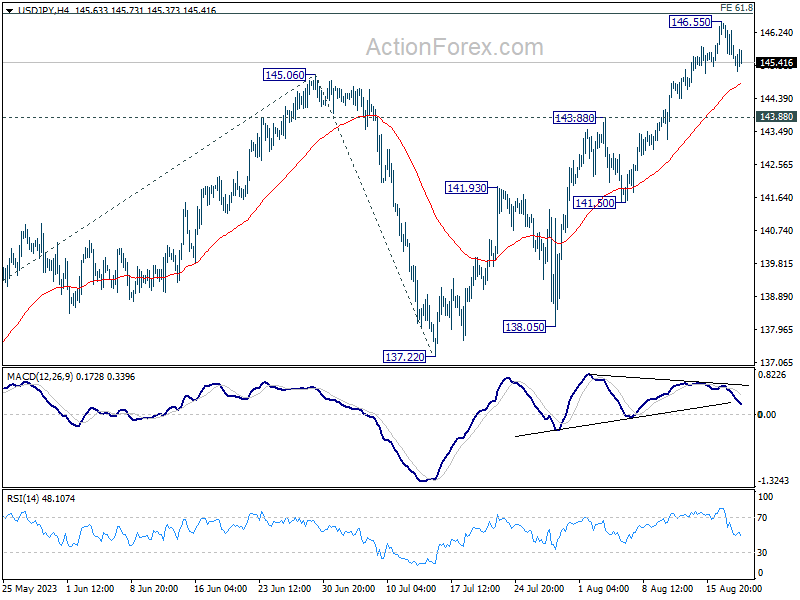
USD/JPY is extending the consolidation from 146.55 and intraday bias stays neutral. On the upside, sustained break of 61.8% projection of 129.62 to 145.06 from 137.22 at 146.76 will pave the way to retest 151.93 high. However, considering bearish divergence condition in 4H MACD, firm break or 143.88 resistance turned support will be a sign of reversal, and turn bias back to the downside for 55 D EMA (now at 141.79).
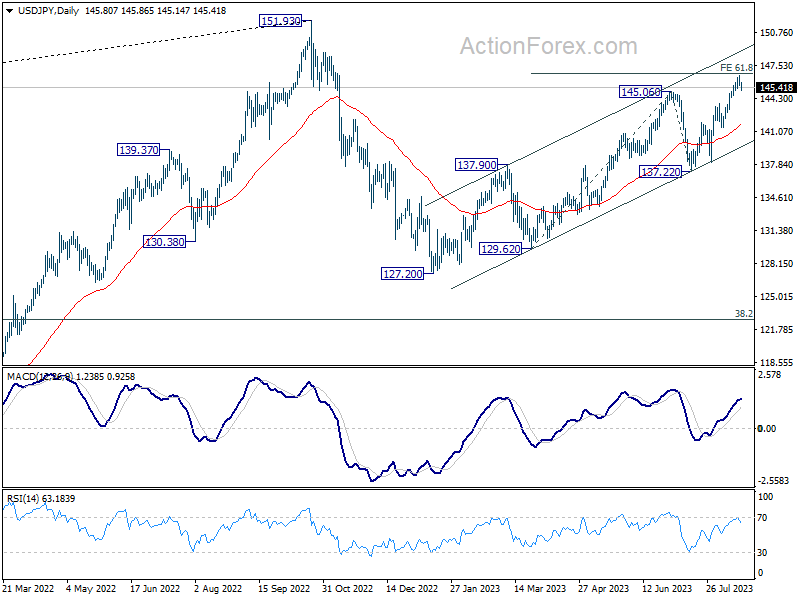
In the bigger picture, overall price actions from 151.93 (2022 high) are views as a corrective pattern. Rise from 127.20 is seen as the second leg of the pattern and could still be in progress. But even in case of extended rise, strong resistance should be seen from 151.93 to limit upside. Meanwhile, break of 137.22 support should confirm the start of the third leg to 127.20 (2023 low) and below.
USD/CHF Mid-Day Outlook
Daily Pivots: (S1) 0.8761; (P) 0.8785; (R1) 0.8810; More....
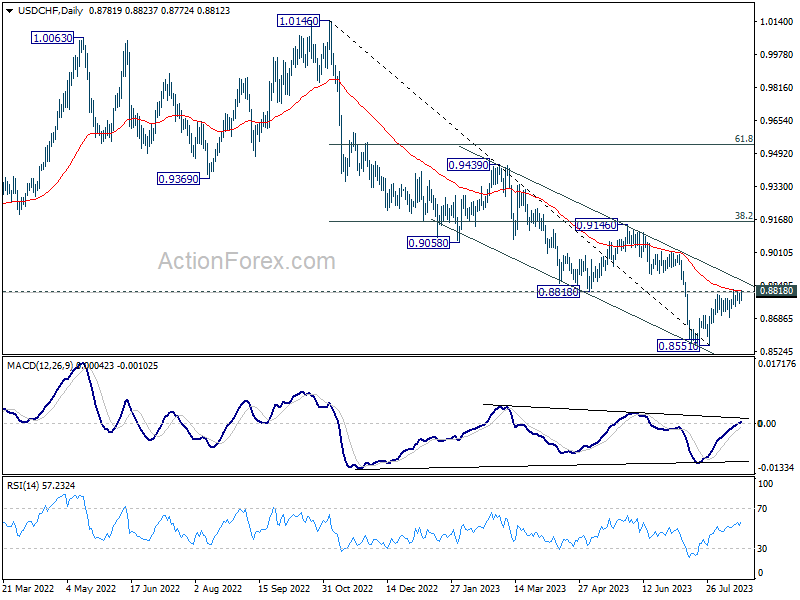
USD/CHF rises slightly again after drawing support from 55 4H EMA (now at 0.8770). Immediate focus is back on 0.8818 support turned resistance and 0.8826 temporary top. Decisive break there will carry larger bullish implication. Further rally should then be seen to 0.9146 cluster resistance next. However, break of 0.8688 support will indicate rejection by 0.8818, and turn bias back to the downside for retesting 0.8551 low.
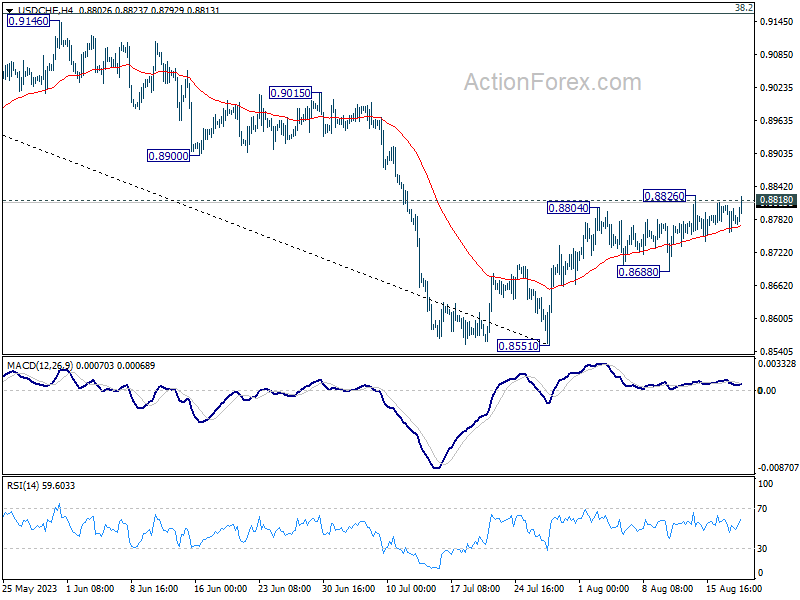
In the bigger picture, a medium term bottom could be in place at 0.8551 already, on bullish convergence condition in D MACD. Sustained trading above 0.8818 will bring further rise to 0.9146 cluster resistance (38.2% retracement of 1.0146 to 0.8551 at 0.9160), even as a correction. Nevertheless, break of 0.8851 will resume the down trend from 1.0146 instead.
Dollar Finally Capitalizes on Intensifying Risk Aversion?
As the trading week draws to a close, Dollar appears to be finally capitalizing on heightened risk aversion, extending its recent surge. Major European stock indexes are painting a gloomy picture, while US futures points to negative opens. British Pound, once the darling of the markets, has started to wane after an unexpectedly dismal retail sales report from the UK. Simultaneously, the Japanese Yen attempting a stronger rebound, especially against European and commodity currencies.
Technically, EUR/USD is now inching closer to 1.0832 support. Decisive break there will further solidify the case that it's at least in correction to whole up trend from 0.9543. Deeper fall would be then seen to 1.0634 support next, which is close to 38.2.% retracement of the up trend from 0.9543 to 1.1274. If materializes, that would likely be accompanied by equally strong rally in the greenback elsewhere.
In Europe, at the time of writing, FTSE is down -0.99%. DAX is down -1.01%. CAC is down -1.06%. Germany 10-year yield is down -0.0827 at 2.627. Earlier in Asian Nikkei dropped -0.55%. Hong Kong HSI dropped -2.05%. China Shanghai SSE dropped -1.00%. Singapore Strait Times dropped -0.71%. Japan 10-year JGB yield dropped -0.0238 to 0.631.
Eurozone CPI finalized at 5.3% in Jul, core CPI at 5.5%
Eurozone CPI was finalized at 5.3% yoy in July, down from June's 5.5% yoy. Core CPI (ex energy, food, alcohol & tobacco) was finalized at 5.5%, unchanged from June's reading. The highest contribution came from services (+2.47%), followed by food, alcohol & tobacco (+2.20%),), non-energy industrial goods (+1.26%),) and energy (-0.62%),).
EU CPI was finalized at 6.1% yoy, down from prior month's 6.4% yoy. The lowest annual rates were registered in Belgium (1.7%), Luxembourg (2.0%) and Spain (2.1%). The highest annual rates were recorded in Hungary (17.5%), Slovakia and Poland (both 10.3%). Compared with June, annual inflation fell in nineteen Member States, remained stable in one and rose in seven.
UK retail sales volumes down -1.2% in Jul, sales value down -1.0% mom
UK retail sales volumes dropped -1.2% mom in July, much worse than expectation of -0.4% mom. Ex-automotive fuel sales volume dropped -1.4% mom. In value term, sales dropped -1.0% mom while ex-fuel sales contracted -1.4% mom.
Food stores sales volumes fell by -2.6% mom. Non-food stores sales volumes fell by -1.7% mom. Automotive fuel stores sales volumes rose by 0.7% mom. Non-store retailing sales volumes rose by 2.8% mom.
ONS also noted, shoppers switching to online shopping because of poor weather and increased promotions led to 27.4% of retail sales taking place online in July 2023, up from 26.0% in June 2023; this is the highest proportion since February 2022 (28.0%).
Japan CPI core eased to 3.1% in Jul, but core-core back at four decade high
Japan's core CPI, which excludes fresh food, eased slightly from 3.3% yoy in June to 3.1% yoy in July, aligning with market expectations. Notably, this metric continued its streak above BoJ's 2% inflation target for a commendable 16 consecutive months.
Diving deeper, core-core CPI, which subtracts both fresh food and energy, inched higher to 4.3% yoy, equalling the peak seen in May. This current rate hasn't been witnessed since 1981, underscoring the latent inflationary pressures within the Japanese economy.
Processed food costs are a particular hotspot, skyrocketing by 9.2% yoy – a surge not seen in nearly half a century. Adding to this, durable goods saw a robust rise of 6.0% yoy. Furthermore, possibly driven by travel and vacationing demand, accommodation fees witnessed a significant 15.1% yoy hike during the prime summer holiday period.
Conversely, energy prices painted a contrasting picture, plummeting by -8.7% yoy. This decline can largely be attributed to government interventions, with subsidies introduced to mitigate household utility expenses. These subsidies, in turn, have played a pivotal role, dragging the core CPI lower by approximately one percentage point.
Service prices also shifted gears, moving up to 2% yoy from 1.6% yoy – the most substantial leap since 1993 if we set aside the aftermath of the 1997 sales tax hike.
Despite these intricate dynamics, headline CPI remained steadfast at 3.3% yoy.
RBNZ Silk: Housing the biggest upside risks to inflation
RBNZ Assistant Governor Karen Silk said today, "Near term, there are still some risks on the upside to inflation." She further identified the housing market as a significant factor, mentioning, "The OCR track is slightly higher and we're saying potentially retaining rates at a higher level for longer. Probably the biggest driver of that is really housing."
The bank's recent projections indicate that OCR could reach its peak at 5.59% by mid-2024, and then slightly pull back to 5.36% by early 2025. This revised forecast surpasses earlier predictions laid out in the previous Monetary Policy Statement.
Silk expressed uncertainty regarding how the stability observed in the housing market, combined with a potential recovery next year, might impact inflation.
"We are looking at it as a gradual resumption in house price trend," Silk elaborated, "but in an environment where labor market pressures continue to ease and at the same time you've got a higher interest rate environment."
Additionally, Silk pointed out broader concerns beyond the local scenario. "One of the medium-term risks for us is global growth," she said. Expressing a keen interest in international trajectories, she added, "We're really focused on global growth and in particular how weak is China. Is China really going to be able to deliver the growth that they're suggesting?"
USD/CHF Mid-Day Outlook
Daily Pivots: (S1) 0.8761; (P) 0.8785; (R1) 0.8810; More....
USD/CHF rises slightly again after drawing support from 55 4H EMA (now at 0.8770). Immediate focus is back on 0.8818 support turned resistance and 0.8826 temporary top. Decisive break there will carry larger bullish implication. Further rally should then be seen to 0.9146 cluster resistance next. However, break of 0.8688 support will indicate rejection by 0.8818, and turn bias back to the downside for retesting 0.8551 low.
In the bigger picture, a medium term bottom could be in place at 0.8551 already, on bullish convergence condition in D MACD. Sustained trading above 0.8818 will bring further rise to 0.9146 cluster resistance (38.2% retracement of 1.0146 to 0.8551 at 0.9160), even as a correction. Nevertheless, break of 0.8851 will resume the down trend from 1.0146 instead.
Economic Indicators Update
| GMT | Ccy | Events | Actual | Forecast | Previous | Revised |
|---|---|---|---|---|---|---|
| 23:30 | JPY | National CPI Y/Y Jul | 3.30% | 3.30% | ||
| 23:30 | JPY | National CPI ex-Fresh Food Y/Y Jul | 3.10% | 3.10% | 3.30% | |
| 23:30 | JPY | National CPI ex Food Energy Y/Y Jul | 4.30% | 4.20% | ||
| 06:00 | GBP | Retail Sales M/M Jul | -1.20% | -0.40% | 0.70% | 0.60% |
| 09:00 | EUR | Eurozone CPI Y/Y Jul F | 5.30% | 5.30% | 5.30% | |
| 09:00 | EUR | Eurozone Core CPI Y/Y Jul F | 5.50% | 5.50% | 5.50% | |
| 12:30 | CAD | Industrial Product Price M/M Jul | 0.40% | 0.20% | -0.60% | |
| 12:30 | CAD | Raw Material Price Index Jul | 3.50% | 2.10% | -1.50% |
Australian Dollar Lower on Evergrande Bankruptcy
- The Australian dollar’s slide continues
- Evergrande bankruptcy raises contagion fears
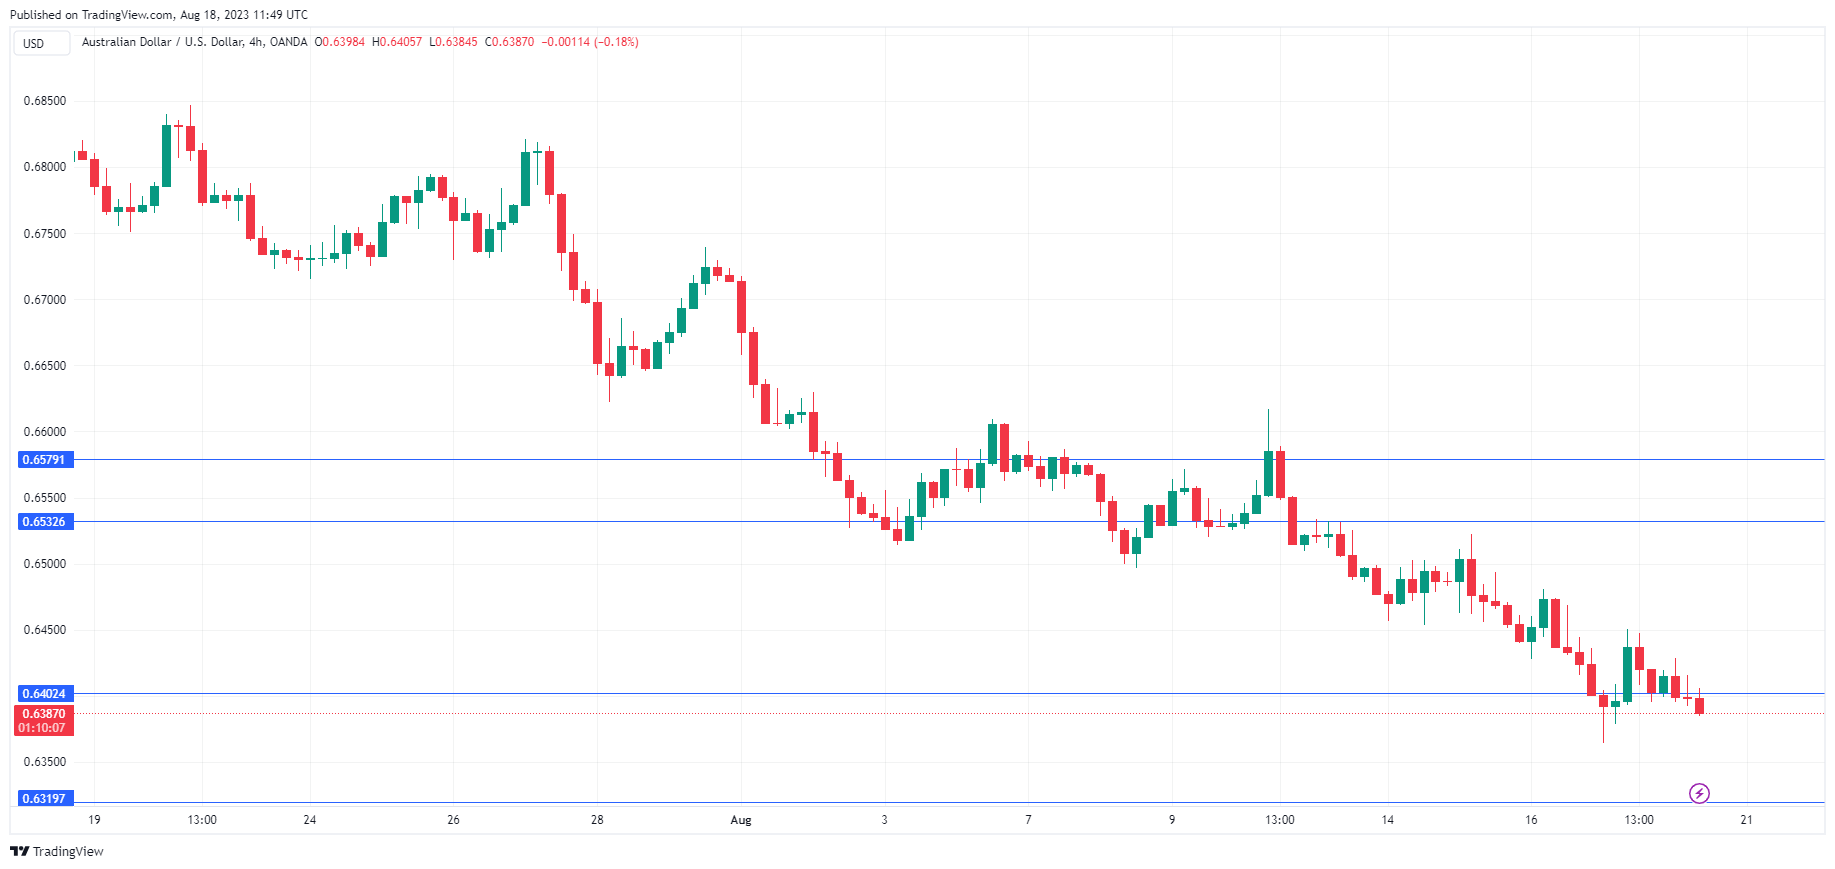
It has been all red for the Australian dollar, as AUD/USD has closed lower for eight straight days and declined 230 basis points during that time. The downswing has continued on Friday, as AUD/USD is trading at 0.6390 in the European session, down 0.20%. There are no Australian or US releases today, so I expect a calm day for AUD/USD.
Evergrande collapse raises contagion fears
Chinese economic releases have looked weak in recent weeks, with exports and imports in decline, a slump in domestic demand, and soft services and manufacturing data. The news from Evergrande, one of the country’s largest property developers, is one more headache that the Chinese economy could do without.
Evergrande filed for bankruptcy in New York on Thursday. The company defaulted on its massive debt in 2021, which triggered a massive property crisis in China and damaged the country’s financial system. The bankruptcy has raised fears that China’s property sector problems could spread to the rest of the economy, which is experiencing deflation and is suffering from weak growth.
There are growing concerns about the stability of the Chinese economy and the Evergrande bankruptcy has raised contagion fears, similar to when the company defaulted on its debt. Australia is particularly sensitive to economic developments in China, which is Australia’s largest trading partner. A slowdown in China has meant less demand for Australian exports, and that has contributed to the Australian dollar’s sharp slide, with the currency plunging a massive 4.93% in August.
In the US, there was unexpected good news from the manufacturing sector on Thursday. Manufacturing has been in the doldrums worldwide, as high inflation and weak demand have taken a heavy toll. The US is no exception, but Philly Fed Manufacturing sparkled in August with a reading of +12, up sharply from -13.5 in July and blowing past the consensus estimate of -10 points.
AUD/USD Technical
- AUD/USD is testing support at 0.6402. This is followed by support at 0.6319
- 0.6449 and 0.6532 are the next resistance lines
Price of Bitcoin Collapses by About 8% in One Day
This morning the BTC/USD price is near 26,500, the lowest price since mid-June.
What is the reason for this? Among the drivers of the decline may be information that Elon Musk's SpaceX company intends to sell (or has already sold) USD 373 million worth of bitcoins. However, the collapse could have been influenced more by technical than by fundamental factors.
On August 8, we wrote that the ADX indicator fell to a minimum since the beginning of the year — that is, the market was in a protracted flat. It was a vulnerable position for the birth of a new impulse.
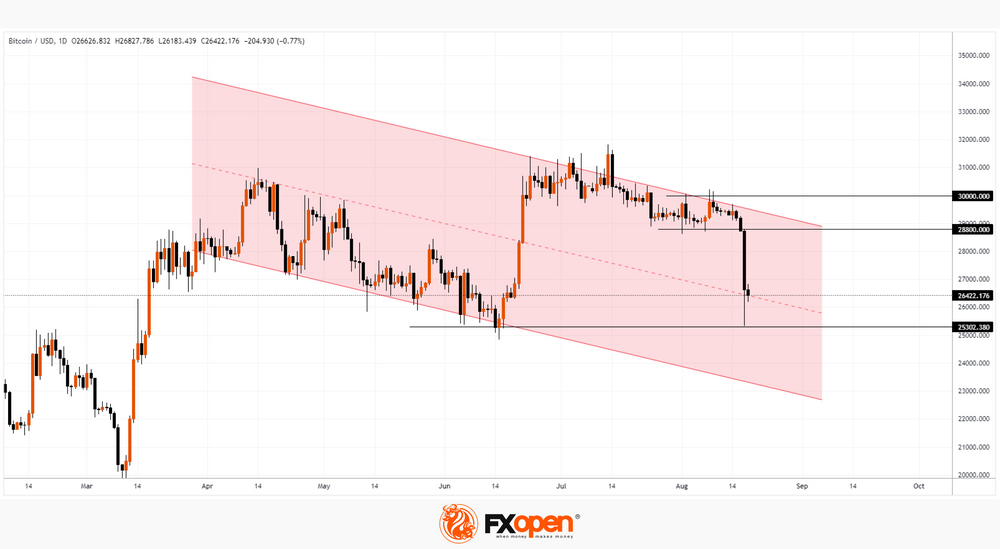
Note that the USD 30K psychological level acted as resistance in August — the price was not able to stay higher for long. It was logical to assume that the bears would try to take the initiative. And it happened this week — notice the widening bearish candles on August 15-16 as we approach the 28,800 support.
The decline triggered a cascade of stop-losses (more than USD 1 billion worth of positions on cryptocurrency exchanges were liquidated), which intensified the selling wave.
The chart shows that the price of BTC/USD today is near the median line of the descending channel, where the demand for cheaper bitcoins has balanced the supply. If the price continues to develop within this channel, we can see a new attempt to break through the psychological level of USD 25,000, which in mid-June led to a sharp increase in the price of bitcoins.
This article represents the opinion of the Companies operating under the FXOpen brand only. It is not to be construed as an offer, solicitation, or recommendation with respect to products and services provided by the Companies operating under the FXOpen brand, nor is it to be considered financial advice.
Bitcoin’s Not-So-Soft Landing
Market picture
The crypto market lost 6.4% in the last 24 hours to $1.063 trillion. The sell-off in illiquid trading after the close of the regular US session has intensified sharply after falling below the $1.1 trillion mark. At the peak of the sell-off, total capitalisation was down to $1.038 trillion, a two-month low.
Bitcoin has lost 7.4% in 24 hours to $26.4K. The reduced traction of risk assets in traditional markets has coincided with increasing bearish signals we observed in the crypto over the past few days. BTCUSD’s downward slide quickly became a high-speed collapse upon the breach of local support at $28.8K.
There was little control over the subsequent decline, as it occurred during low liquidity hours when most participants were out of the market. This added to the negative momentum, and Bitcoin sold off to $25.924.
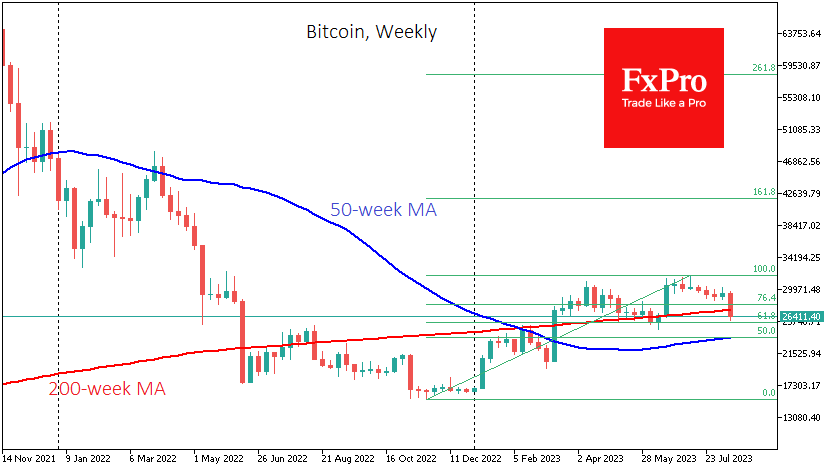
Intraday, BTCUSD traded below its 200-week and 200-day averages, centred around $27.3K. A daily and weekly close below this level would be an essential signal of a break in the uptrend of recent months, with faint hopes of stabilisation around $25.5K.
News background
CryptoQuant recorded several large BTC transfers to crypto exchanges Binance, Gate.io and Coinbase the day before. Whales typically send cryptocurrency to exchanges before selling it.
US institutional crypto platform Bakkt is seeing a substantial influx of new clients focused on trading and storing digital assets, its head Gavin Michael said.
Tether, the issuer of the largest stablecoin by capitalisation, announced that it would no longer support USDT on the Bitcoin blockchain, as well as Bitcoin Cash and Kusama.
The US Office of Government Ethics (CREW) reported that former US President Donald Trump invested over $2.8 million in the cryptocurrency – more than previously disclosed.