Sample Category Title
EUR/AUD Daily Outlook
Daily Pivots: (S1) 1.6944; (P) 1.6980; (R1) 1.7015; More...
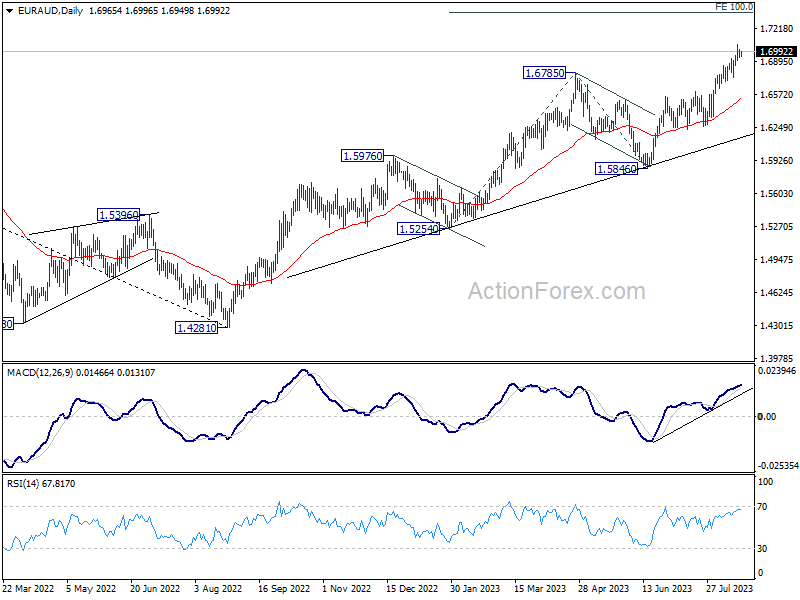
Intraday bias in EUR/AUD is turned neutral first as consolidation from 1.7062 temporary top is extending. Further rally is expected as long as 1.6737 support holds. Break of 1.7062 will resume larger up trend from 1.4281 to 1.7377 projection level.
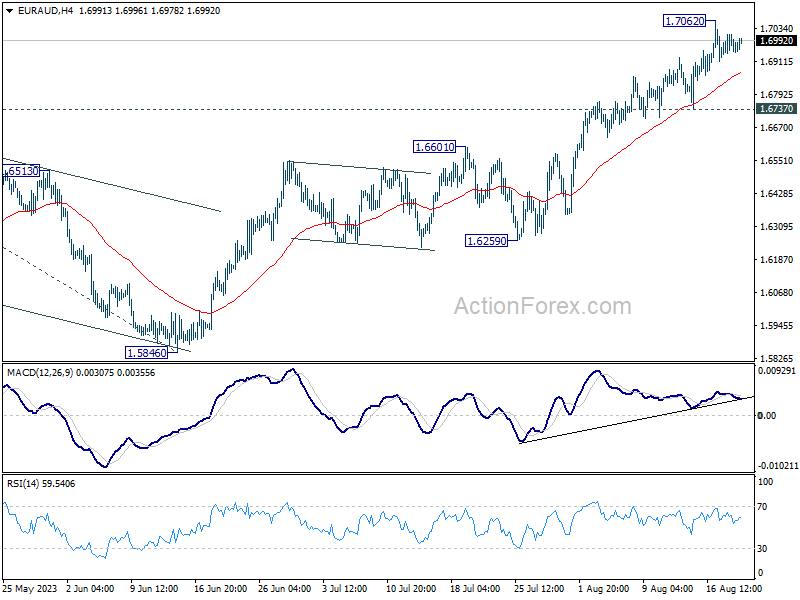
In the bigger picture, the rise from 1.4281 (2022 low) is in progress. Next target is 100% projection of 1.5254 to 1.6785 from 1.5846 at 1.7377. For now, outlook will stay bullish as long as 1.5846 support holds, even in case of another pull back.
Markets Treading Cautiously, as PMIs and Jackson Hole Awaited
As a fresh week unfolds, global markets seem to tread cautiously, keeping a close watch on the recent undertakings in Asian economies. PBoC's modest rate cut decision has catalyzed a minor pullback in stocks across China and Hong Kong. In contrast, Japan's Nikkei shows modest gains, reflecting a divergence in Asian market sentiment. The offshore Chinese Yuan wavers but stays above last week's low against Dollar.
In the currency sphere, Australian and New Zealand dollars are registering mild declines alongside the greenback. On the flip side, Canadian dollar, Euro, and Swiss Franc exhibit a modest uptick. However, any drastic movement in major currency pairs are yet to be seen, with almost all major pairs and crosses stuck inside Friday's range.
Investors should gear up for a potentially subdued trading ambiance in the next couple of days, given the sparse economic calendar. Nevertheless, Wednesday promises some action with release of PMIs from pivotal economies and Canadian retail sales data. Undoubtedly, the week's crescendo will be the eagerly awaited annual Jackson Hole symposium, culminating in Fed Chair Jerome Powell's address.
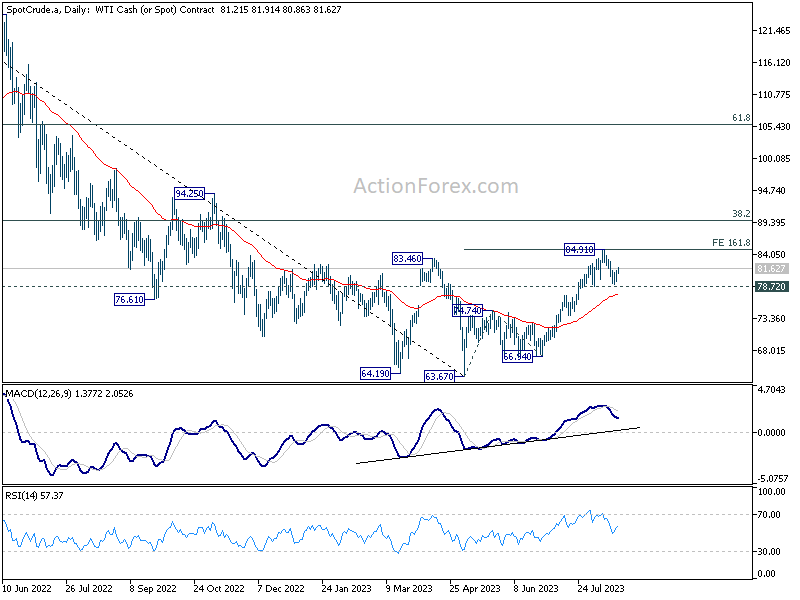
Technically, WTI crude oil recovers notably today and appears to have defended 78.72 near term support well on first attempt. The development keeps near term outlook neutral at worst, with prospect of resuming the larger rise from 63.67 through 84.91 resistance towards 90 handle at a later stage. However, firm break of 78.72 support, will argue that this rebound has completed, and bring deeper fall back to 74.74 resistance turned support, probably together with deterioration in risk sentiment elsewhere.
In Asia, at the time o writing, Nikkei is up 0.61%. Hong Kong HSI is down -1.38%. China Shanghai SSE is down -0.38%. Singapore Strait Times is down -0.45%. Japan 10-year JGB yield is up 0.012 at 0.643.
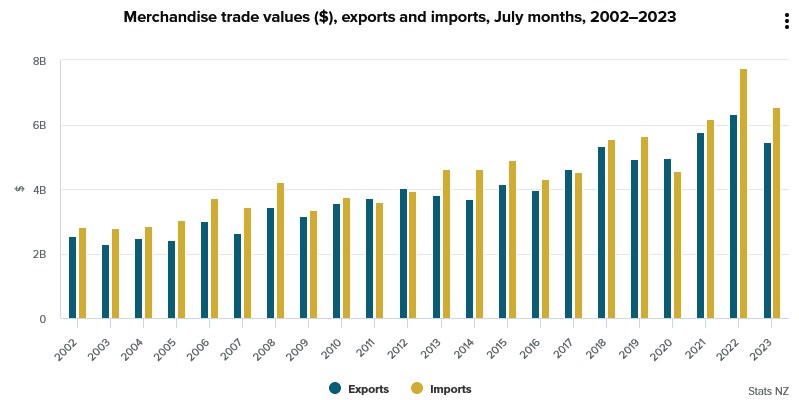
NZ exports down -14% yoy in Jul, imports down -16% yoy, China leads the falls
July 2023 has been a challenging month for New Zealand's trade scenario, as the island nation witnessed a steep fall in both goods exports and imports. Data released depicted a substantial decline, with exports plunging by NZD -890m or -14% yoy, concluding at NZD 5.5B. Concurrently, imports saw a -16% yoy decline, falling NZD -1.2B to settle at NZD 6.6B for the month. This decrease in trade volumes culminated in a monthly trade deficit of NZD -1.1B. This significantly overshadows market expectations of NZD -0.05B.
Zooming in on the country-by-country trade details, China conspicuously led the downturn in both exports and imports. New Zealand's exports to the Asian giant dipped by -24% yoy, translating to a decline of NZD -407m while imports reduced by a staggering NZD -427m, down -25% yoy.
However, not all trade relations showed a contraction. Australia the US emerged as silver linings, with their exports experiencing an upward trajectory. Exports to Australia saw an 8.9% yoy growth, adding NZD 59m to the tally, and US followed suit with a 16% yoy rise, upping the figure by NZD 105m.
Yet, as New Zealand engaged with its other major trade partners, the news wasn't all positive. European Union and Japan both registered a decrease in exports, declining by -16% yoy (NZD -73m) and -21% yoy (NZD -84m) respectively. On the import front, while USA and South Korea posted a rise of 24% (NZD 166m) and 18% (NZD 71m), both European Union (up 1.9% yoy) and Australia (down -2.7% yoy) experienced mixed results.
China cuts 1-yr LPR moderately, keeps 5-yr LPR unchanged
In a somewhat anticipated move, China's PBoC made a cut to its one-year loan prime rate by 10bps, settling it at 3.45%. This is a slight deviation from the 15bps reduction that the majority of economists had forecasted. What stands out is that this marks the second reduction in this rate in just a span of three months.
However, eyebrows were raised when PBOC decided to keep its five-year LPR — the benchmark for most mortgages in the country — steady at 4.2%. This move defied expectations of a 15 bps cut by many market watchers. The unaltered five-year LPR is being read by many as a signal of Chinese banks' hesitancy to compromise their rate differential margin. Such reluctance throws into sharp relief potential concerns about the effective transmission of PBOC's policy decisions into the broader market landscape.
Furthermore, it stirs up conversations about the central bank's capability to invigorate the property sector and the broader economy through monetary easing strategies. This narrative is all the more potent given that this decision on the one-year LPR came on the heels of an unexpected reduction in PBOC's medium-term policy rate just a week earlier. To give specifics, PBOC had reduced the one-year medium-term lending facility rate by 15 basis points, bringing it down to 2.50% from its previous 2.65%.
Considering these rate adjustments, many financial experts are now projecting more proactive measures from the PBOC in the forthcoming months. This may encompass further rate trims as well as potential reductions in the reserve requirement ratio for banks.
Fed Powell's balancing act at Jackson Hole in focus
As the financial world turns its gaze towards the Annual Jackson Hole Symposium from August 24-26, expectations are mounting on the discussions surrounding "Structural Shifts in the Global Economy." This renowned gathering, drawing in elite central bankers from across the globe, stands as a barometer for gauging the future trajectory of monetary policies.
The spotlight is set to shine brightest on Fed Chair Jerome Powell's speech this Friday. The backdrop is intriguing. On one hand, post-July FOMC meeting data reveals easing pressures on prices and wages in the US, tilting the scales towards concluding the ongoing tightening phase. On the other, the undeniable vitality in labor markets coupled with robust consumer spending suggests that price pressure isn't backing down anytime soon. Market stakeholders will be keen to dissect how Powell balances these contrasting narratives in his address.
Yet, for those expecting a seismic shift in Fed's stance, disappointment might be on the horizon. The overarching narrative is likely to remain consistent – a commitment to combating inflation, while leaving the door ajar for a potential September rate hike. It's also prudent to remember that decision-makers at Fed will have another round of CPI and non-farm payroll data at their disposal before the crucial FOMC verdict on September 20. As for hints on the timing of inaugural rate cut, Powell is anticipated to toe the line, emphasizing the need for interest rates to remain restrictive for as long as the situation demands.
While Powell's speech will be the main event, it's the off-stage whispers that could provide invaluable insights. Observers should attune their ears to the informal comments from other Fed officials. Their words might just offer a glimpse into the hawkish vs. dovish balance within the committee.
Amidst the Jackson Hole fervor, the broader economic calendar for the week seems relatively subdued, characteristic of the last full week of August. Yet, there are some metrics worth the watch. PMI figures from the heavyweights – Australia, Japan, Eurozone, UK, and US – are poised to dominate headlines. With the services sector being the bulwark of major economies, even as manufacturing grapples with recessionary winds, any signs of fading momentum here could spark concerns. The looming question: How soon before the manufacturing downturn spills over to services?
Beyond PMIs, analysts will also be tracking US durable goods orders, Germany's Ifo business climate index, Canada's retail sales, and New Zealand's trade balance and retail metrics. All in all, an eventful week beckons for financial market aficionados.
Here are some highlights for the week:
- Monday: New Zealand trade balance; Germany PPI; Canada new housing price index.
- Tuesday: Swiss trade balance; UK public sector net borrowing; Eurozone current account; US existing home sales.
- Wednesday: New Zealand retail sales; Australia PMIs; Japan PMIs; Eurozone PMIs; UK PMIs; Canada retail sales; US PMIs, news home sales.
- Thursday: US jobless claims, durable goods orders.
- Friday: Japan Tokyo CPI, corporate services prices; Germany GDP final, Ifo business climate; US U of Michigan consumer sentiment final.
EUR/AUD Daily Outlook
Daily Pivots: (S1) 1.6944; (P) 1.6980; (R1) 1.7015; More...
Intraday bias in EUR/AUD is turned neutral first as consolidation from 1.7062 temporary top is extending. Further rally is expected as long as 1.6737 support holds. Break of 1.7062 will resume larger up trend from 1.4281 to 1.7377 projection level.
In the bigger picture, the rise from 1.4281 (2022 low) is in progress. Next target is 100% projection of 1.5254 to 1.6785 from 1.5846 at 1.7377. For now, outlook will stay bullish as long as 1.5846 support holds, even in case of another pull back.
Economic Indicators Update
| GMT | Ccy | Events | Actual | Forecast | Previous | Revised |
|---|---|---|---|---|---|---|
| 22:45 | NZD | Trade Balance (NZD) Jul | -1107M | -50M | 9M | -111M |
| 23:01 | GBP | Rightmove House Price Index M/M Aug | -1.90% | -0.20% | ||
| 06:00 | EUR | Germany PPI M/M Jul | -0.20% | -0.30% | ||
| 06:00 | EUR | Germany PPI Y/Y Jul | -5.10% | 0.10% | ||
| 12:30 | CAD | New Housing Price Index M/M Jul | 0.00% | 0.10% |
Technical Outlook and Review
DXY:
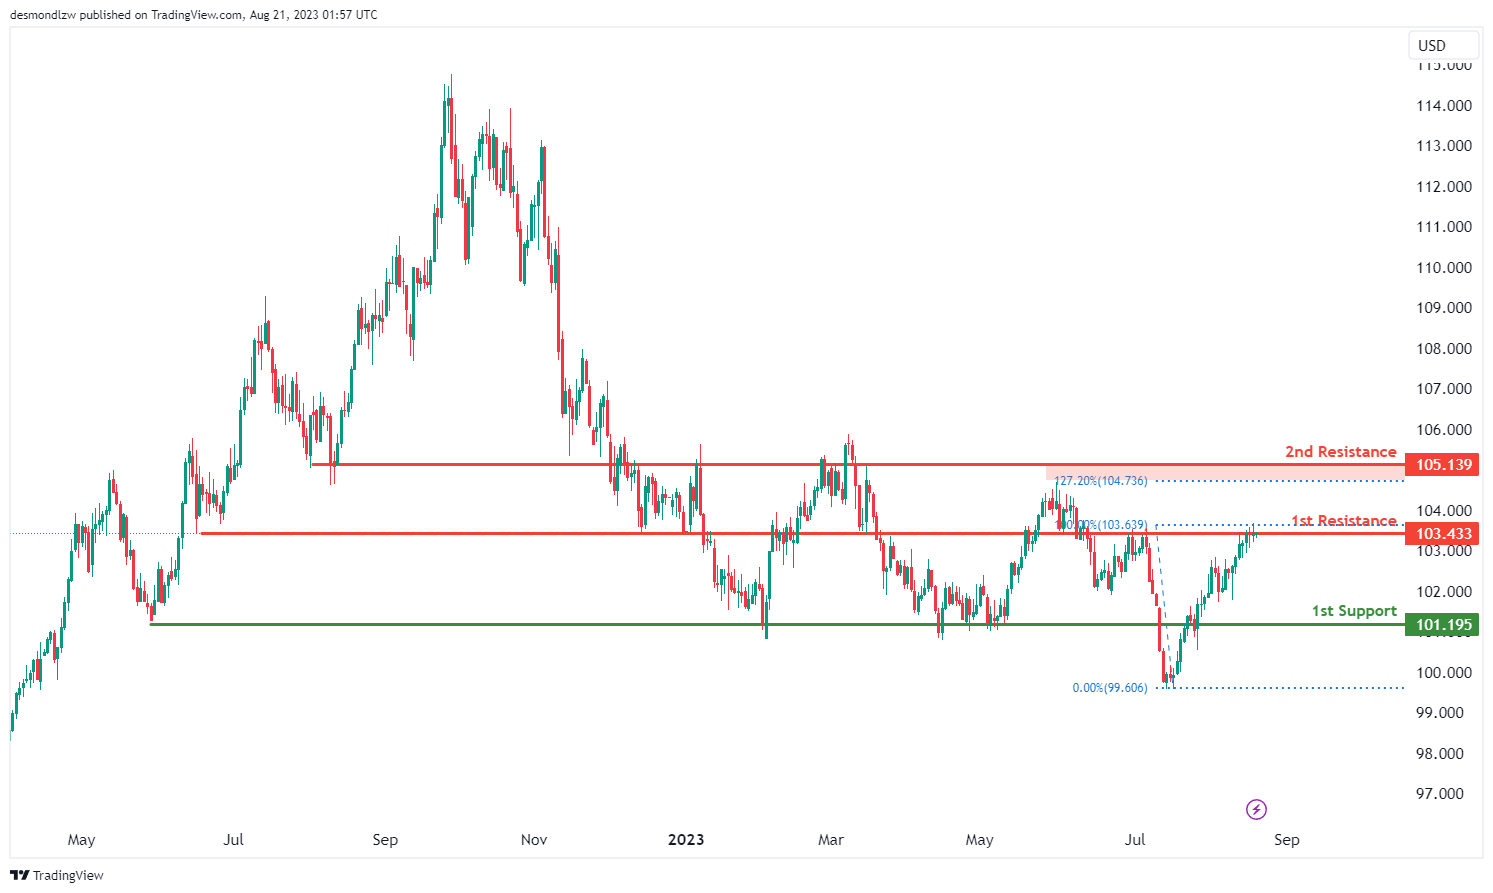
The DXY chart currently displays a bearish momentum, suggesting a prevailing downward trend.
Within this context, there’s a potential scenario where the price could experience a bearish reaction upon reaching the 1st resistance level at 103.43. This level is significant as an overlap resistance, potentially causing a downward movement.
On the support side, the 1st support at 101.19 gains importance due to its classification as an overlap support. It could potentially provide a floor for any potential price decline.
Moreover, the 2nd resistance level at 105.13 is noted as an overlap resistance and is further reinforced by its alignment with a 127.20% Fibonacci Extension, adding to its potential as a resistance level.
EUR/USD:
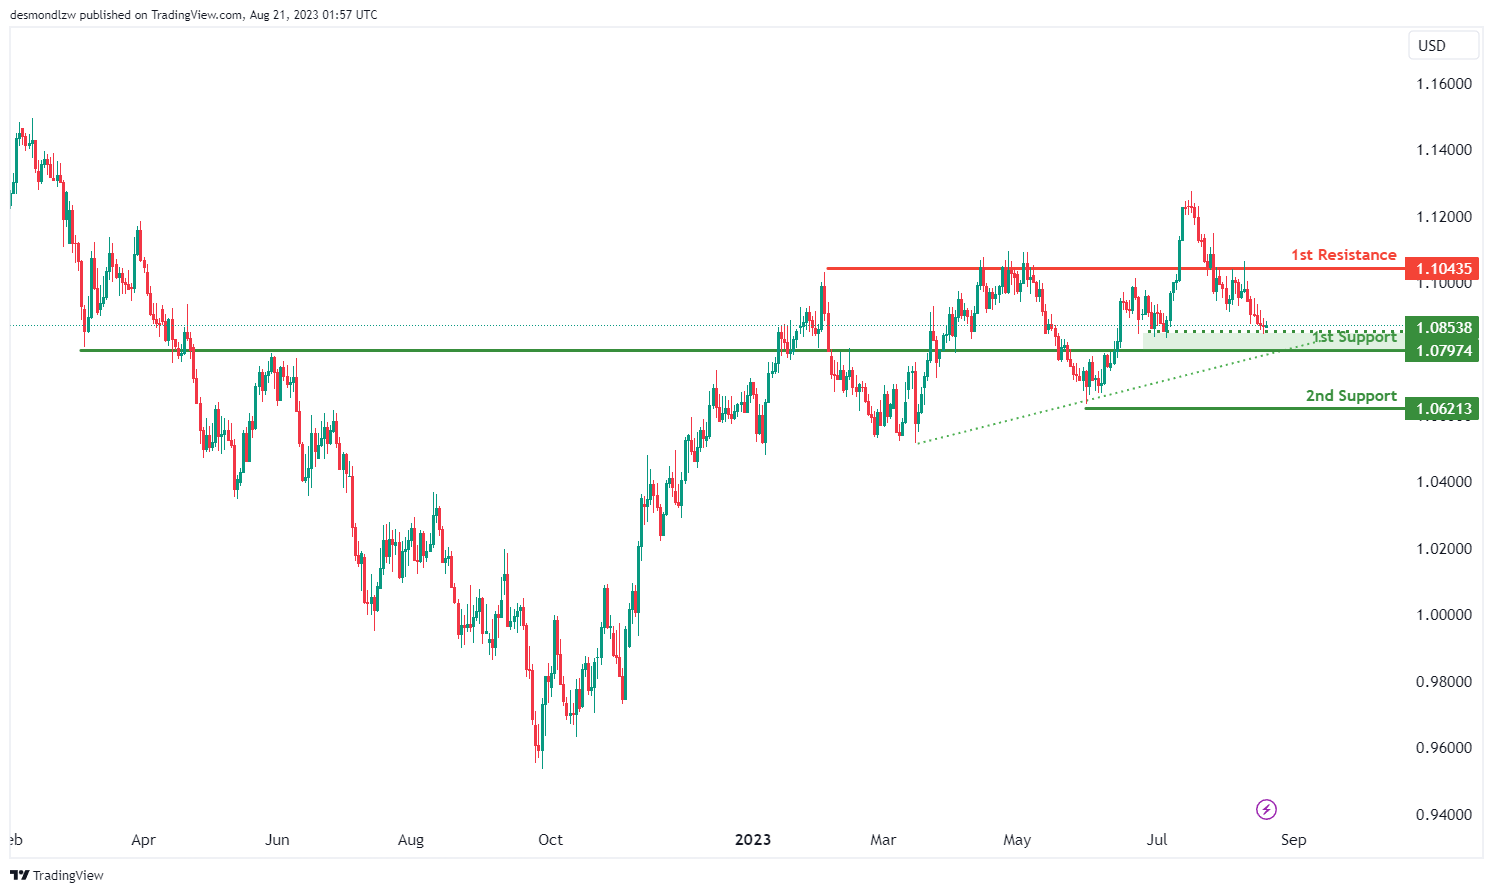
The EUR/USD chart is currently exhibiting a bullish momentum, with the presence of a major ascending trend line suggesting the potential for further upward movement.
Within this momentum context, there’s a potential scenario where the price could experience a bullish rebound upon reaching the 1st support level at 1.0797, possibly driving it towards the 1st resistance at 1.1043. The significance of the 1st support at 1.0797 lies in its role as a pullback support, potentially serving as a foundation for a potential price increase. Similarly, the identification of the 2nd support at 1.0621 as a swing low support adds to its significance.
Additionally, the intermediate support level at 1.0853 gains importance due to its classification as a multi-swing low support. This collective analysis contributes to the overall bullish outlook.
EUR/JPY:
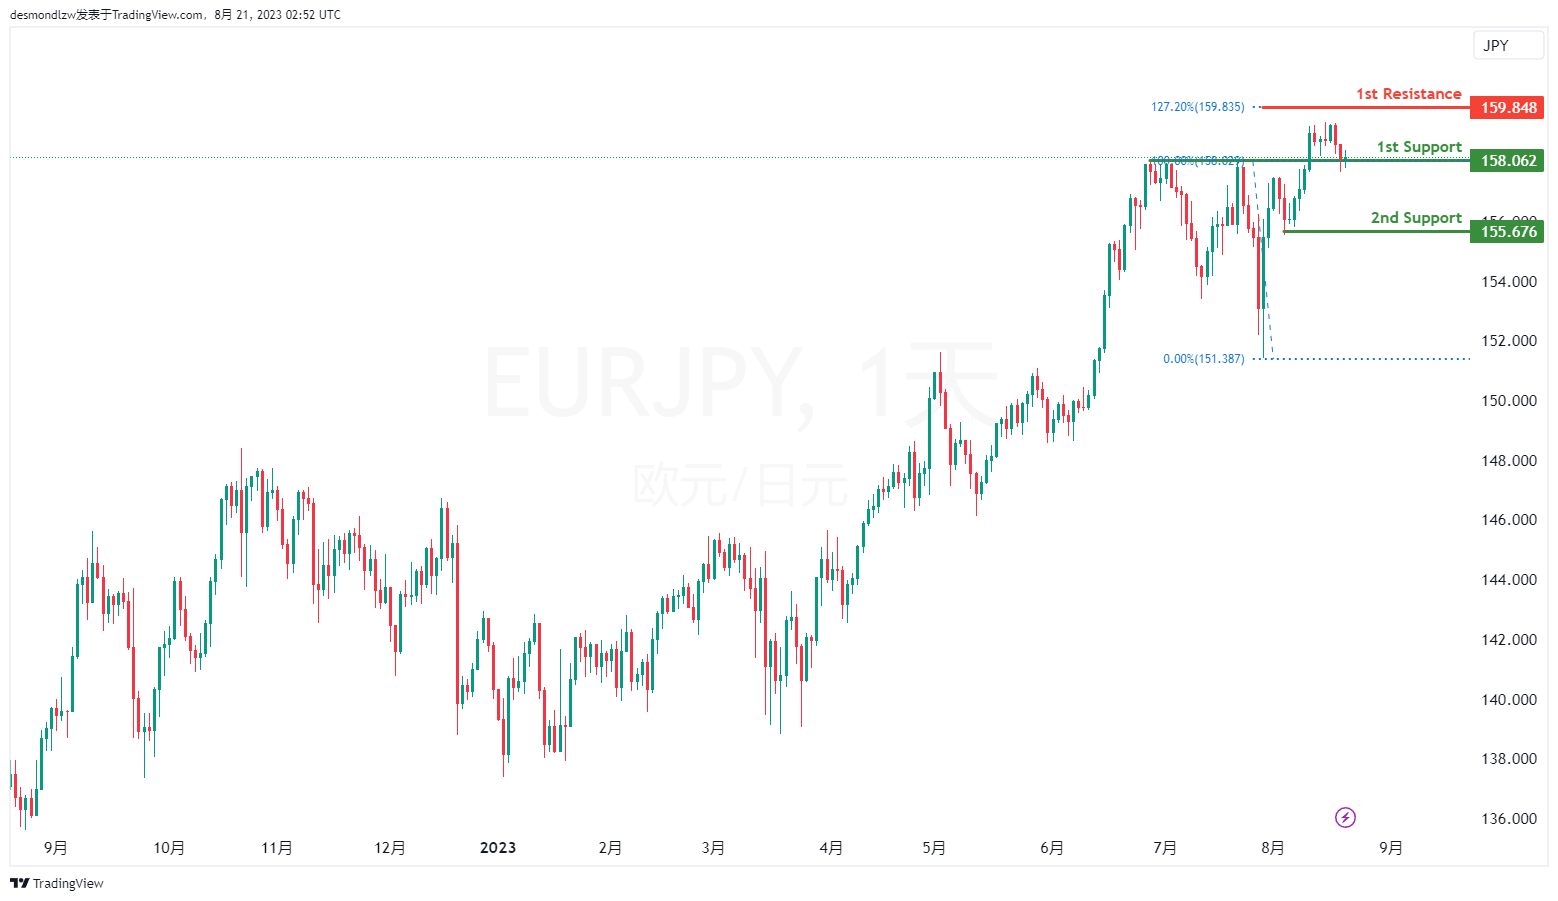
The EUR/JPY chart indicates a bullish overall momentum. There is a potential for a bullish bounce off the 1st support level, leading the price towards the 1st resistance.
The 1st support is located at 158.06 and is considered advantageous due to its pullback support characteristics. Additionally, the 2nd support at 155.67 is seen as valuable because it represents a swing low support.
On the resistance side, the 1st resistance level at 159.84 is significant due to its association with the 127.20% Fibonacci Extension.
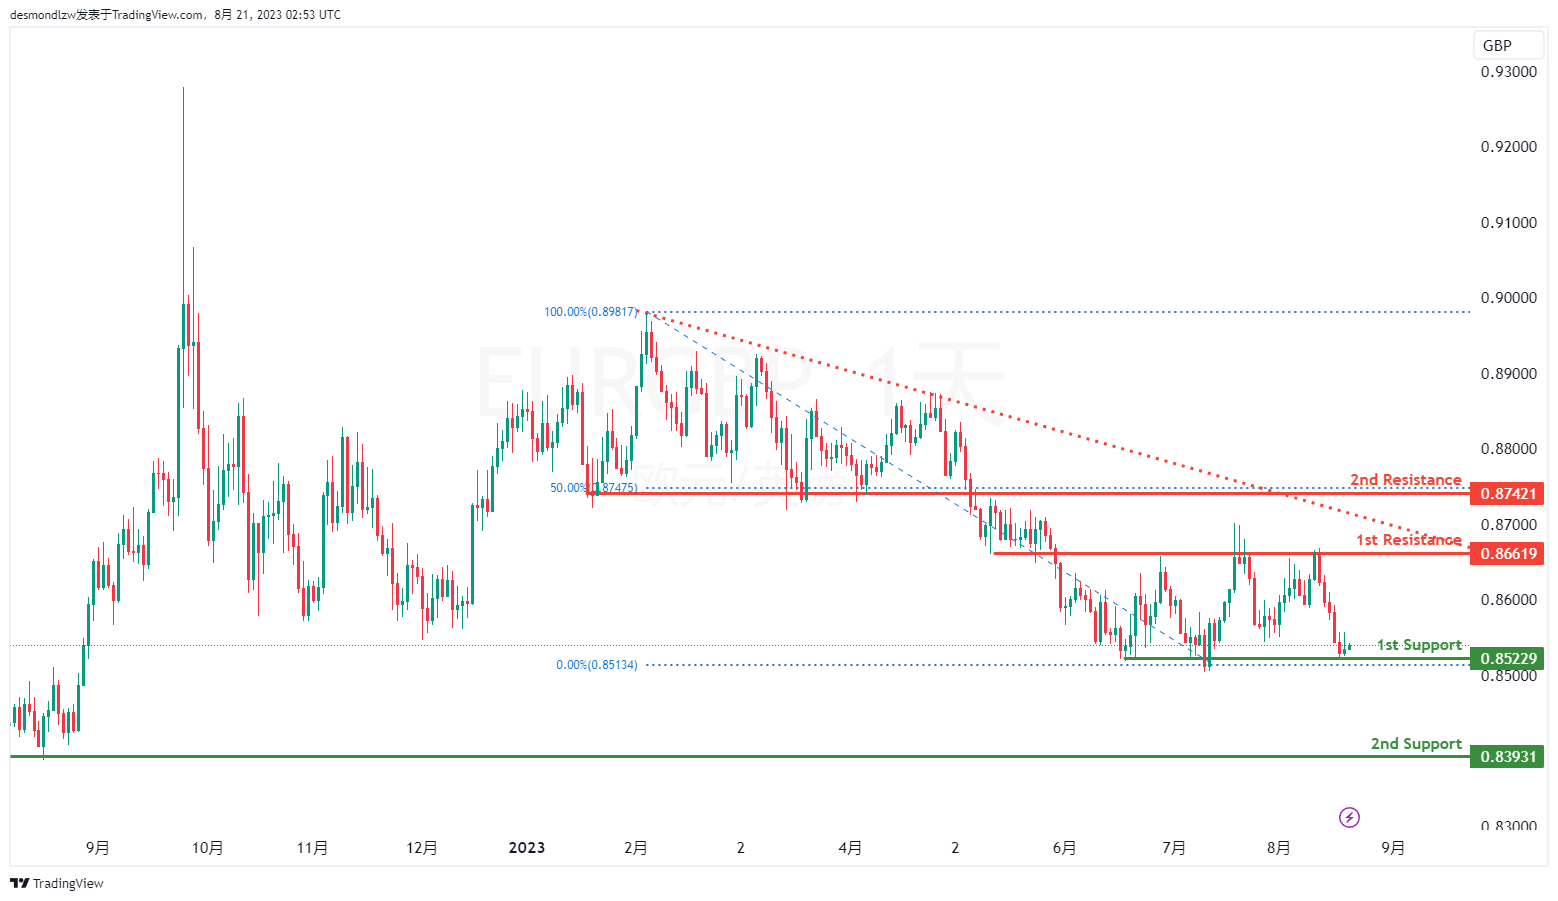
EUR/GBP:
The EUR/GBP chart indicates a bullish overall momentum. There is a potential for a bullish bounce off the 1st support level, leading the price towards the 1st resistance.
The 1st support is positioned at 0.8522 and is considered advantageous due to its multi-swing low support characteristics. Additionally, the 2nd support at 0.8393 is valuable as it represents an overlap support.
On the resistance side, the 1st resistance level at 0.8661 is noteworthy as it represents a pullback resistance. Furthermore, the 2nd resistance at 0.8742 is also significant due to its pullback resistance characteristics, along with its association with the 50% Fibonacci Retracement.
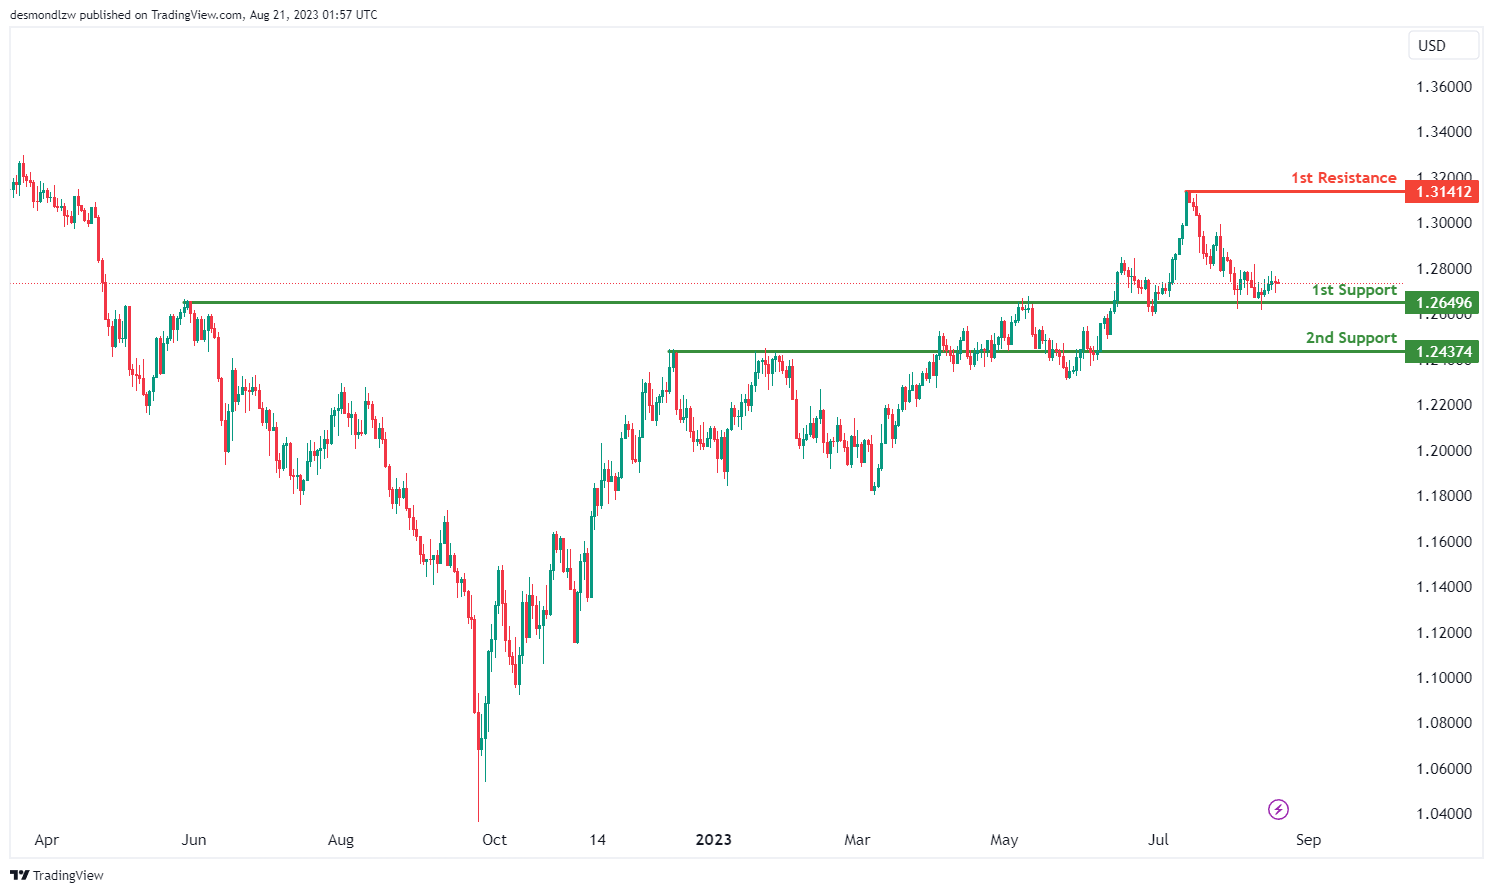
GBP/USD:
The GBP/USD chart currently displays a bullish momentum, indicating a prevalent upward trend.
Within this context, there’s a potential scenario in which the price could experience a bullish rebound upon reaching the 1st support level at 1.2649, potentially leading to an upward movement towards the 1st resistance level at 1.3141. The 1st support at 1.2649 holds significance as an overlap support, possibly providing a foundation for a potential upward price reversal. Similarly, the 2nd support at 1.2437 is noted as an overlap support, reinforcing its role in supporting the price.
On the other hand, the 1st resistance level at 1.3141 is considered a swing high resistance, which could pose a potential obstacle to upward price movement.
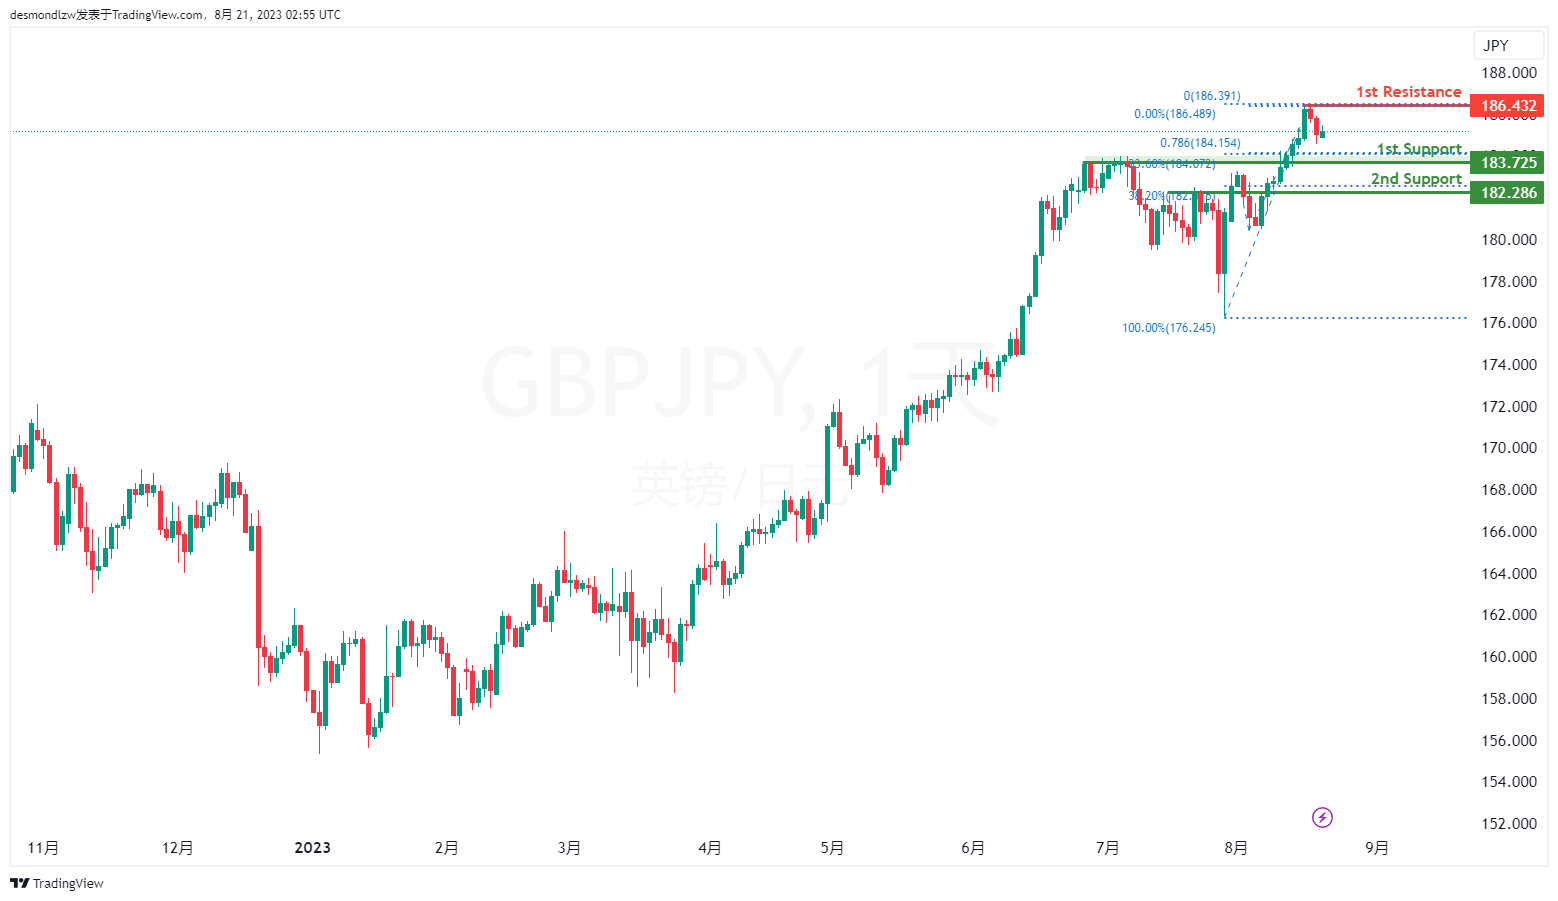
GBP/JPY:
The GBP/JPY chart indicates a bearish overall momentum. There is a potential for a bearish continuation towards the 1st support level.
The 1st support is located at 183.72 and is considered advantageous due to its pullback support characteristics. Additionally, the 1st support exhibits a Fibonacci confluence with a 78.60% Fibonacci Projection and a 23.60% Fibonacci Retracement.
Furthermore, the 2nd support at 182.28 is seen as valuable because it represents an overlap support, along with a 38.20% Fibonacci Retracement.
On the resistance side, the 1st resistance level at 186.43 is noteworthy as it represents a swing high resistance.
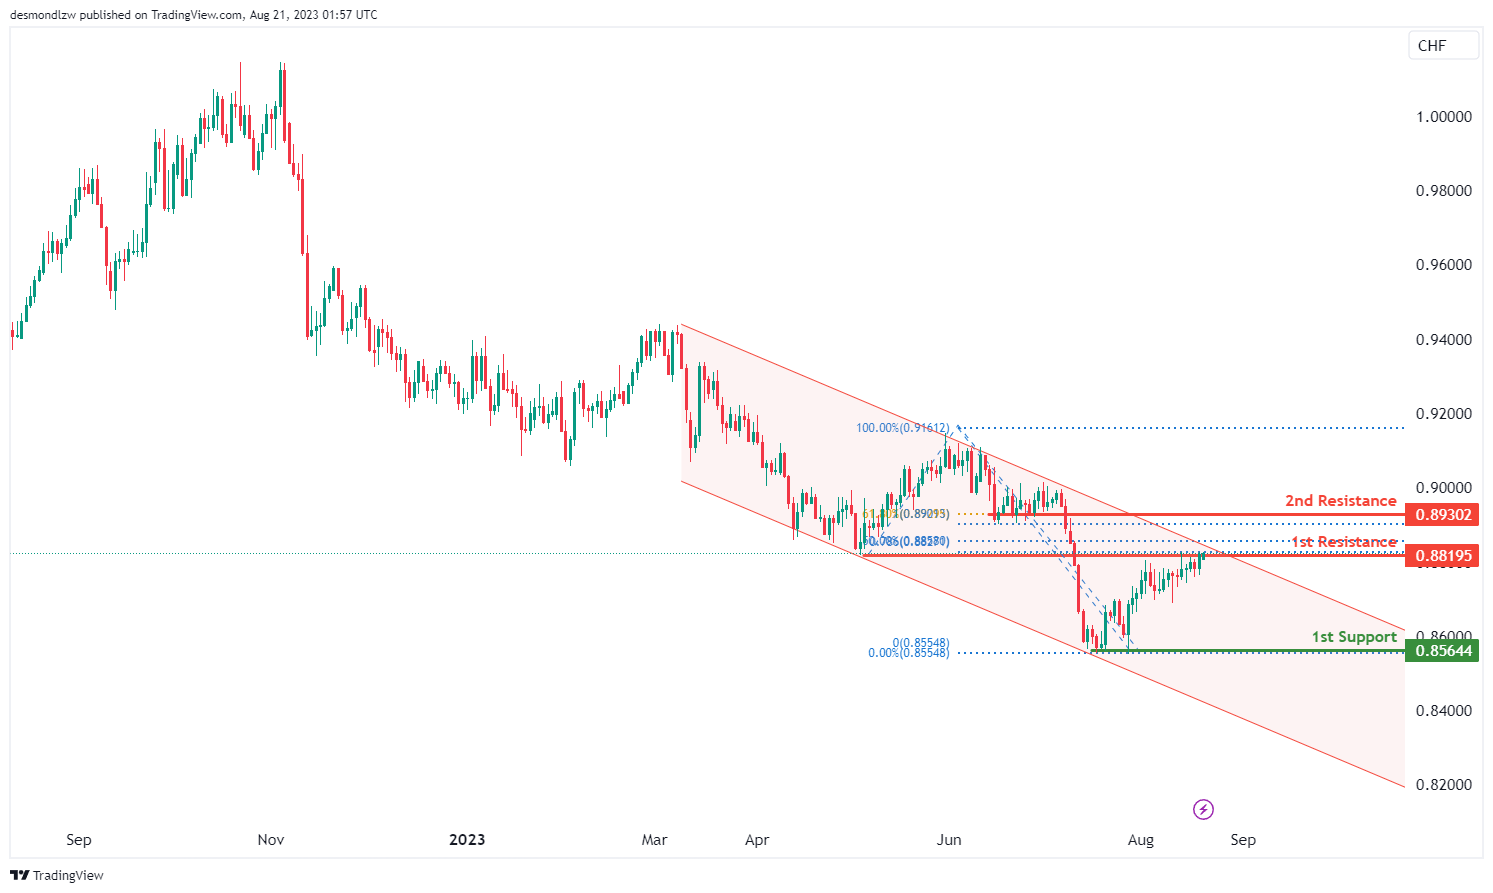
USD/CHF:
The USD/CHF chart’s overall momentum reflects a bearish trend, which is supported by the fact that the price is confined within a descending channel, indicating a persistent downward movement.
Within this context, there is a potential scenario in which the price reacts bearishly upon reaching the 1st resistance level at 0.8819, possibly resulting in a drop towards the 1st support level at 0.8564. The significance of the 1st support lies in its identification as a multi-swing low support, suggesting a potential area where the price might find temporary stability.
Conversely, the 1st resistance level at 0.8819 holds importance as an overlap resistance, potentially acting as a barrier to upward price movement. Further reinforcing potential resistance, the 2nd resistance at 0.8930 is noted as a pullback resistance and aligns with a 61.80% Fibonacci retracement level, which adds to its significance.
USD/JPY:
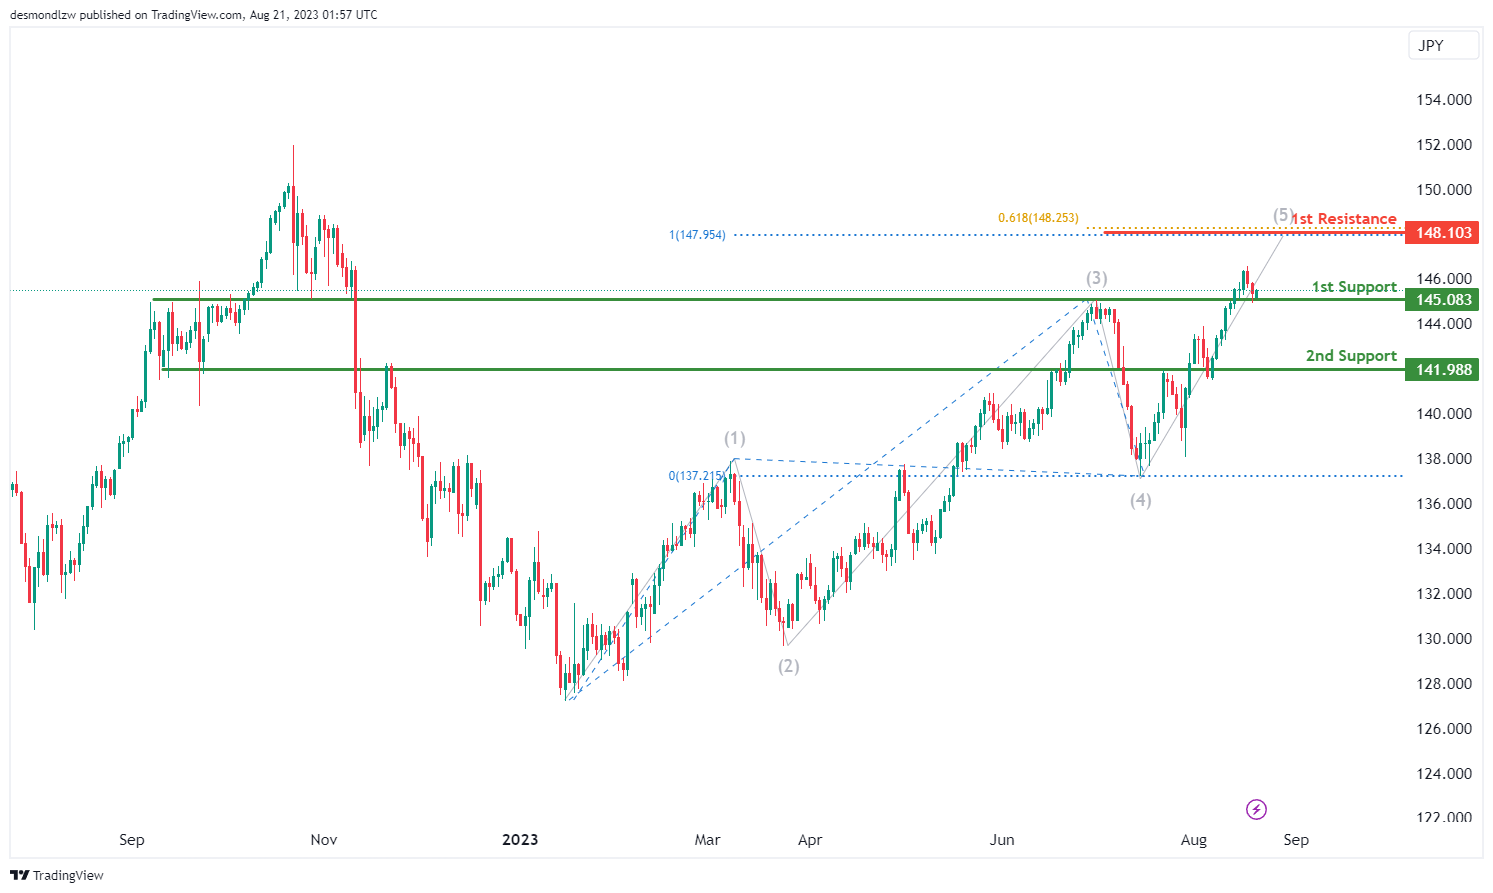
The USD/JPY chart currently exhibits a bullish momentum, suggesting a prevailing upward trend.
In light of this momentum, a potential scenario arises in which the price experiences a bullish rebound upon reaching the 1st support level at 145.08, possibly leading to an upward movement towards the 1st resistance at 148.10.
The significance of the 1st support at 145.08 is attributed to its identification as an overlap support, indicating a potential area where buyers might step in to drive the price higher. Additionally, the 2nd support level at 141.98 reinforces the support structure as a pullback support, potentially offering a stronger foundation for the price.
On the other side, the 1st resistance at 148.10 gains importance due to its alignment with both a 61.80% Fibonacci Projection and a 100% Fibonacci Projection. This confluence of Fibonacci levels enhances its potential as a significant resistance level where selling pressure might increase.
USD/CAD:
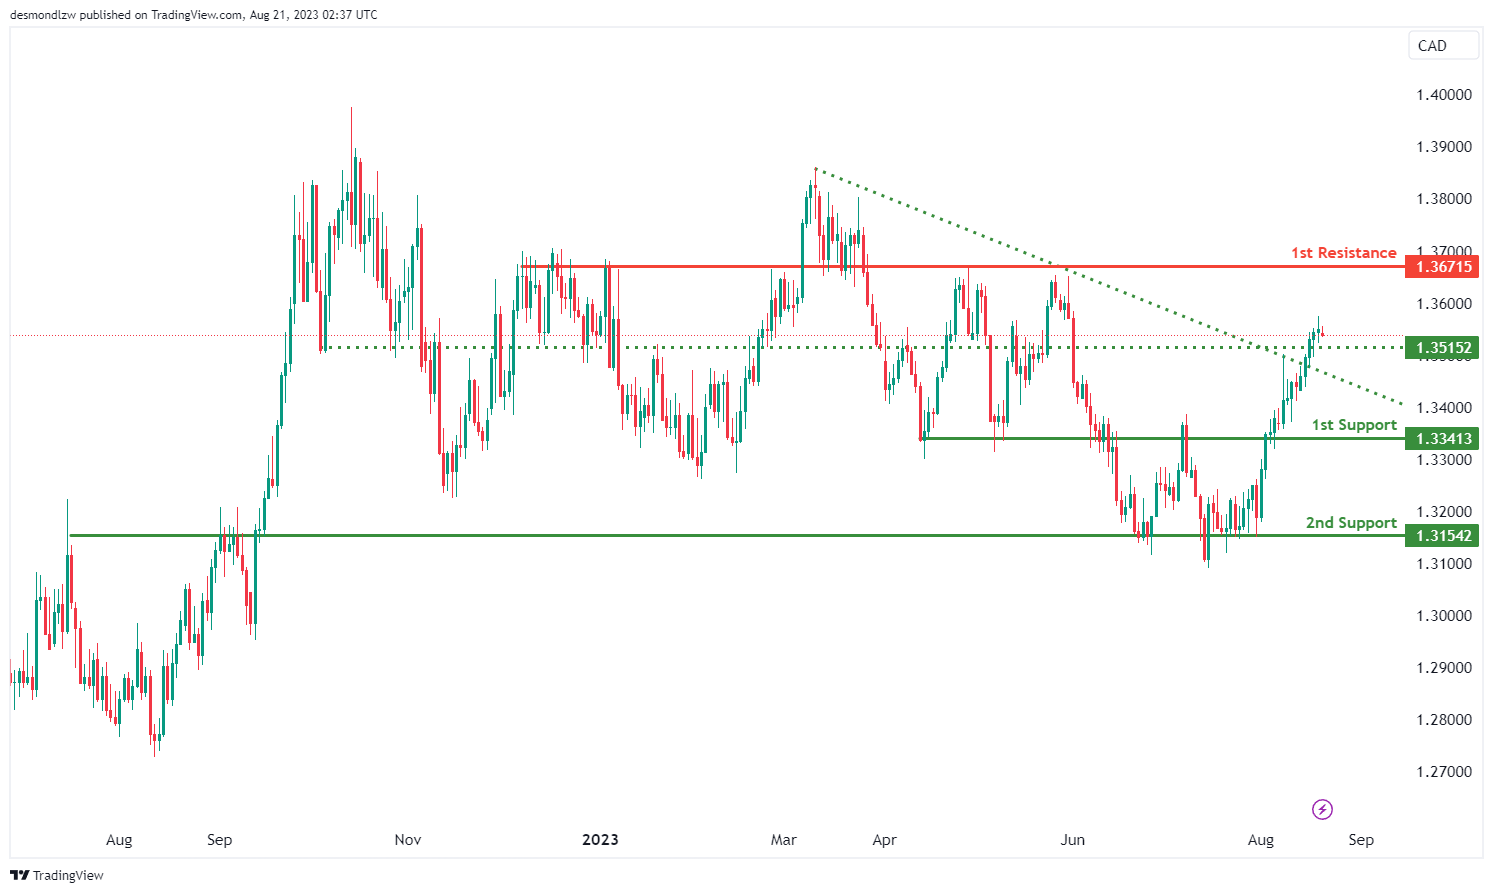
The USD/CAD chart currently shows a bullish momentum, indicating a potential upward trend.
Contributing to this momentum is the fact that the price has broken above a descending resistance line, suggesting the potential for a bullish move.
In the context of this bullish momentum, there’s a possibility that the price could continue its upward movement towards the 1st resistance level at 1.3671.
The importance of the 1st support level at 1.3341 is due to its designation as an overlap support. Similarly, the 2nd support at 1.3154 reinforces the support structure as another overlap support.
Additionally, the intermediate support at 1.3515 strengthens the pullback support zone, potentially providing a significant area for price to find support.
AUD/USD:
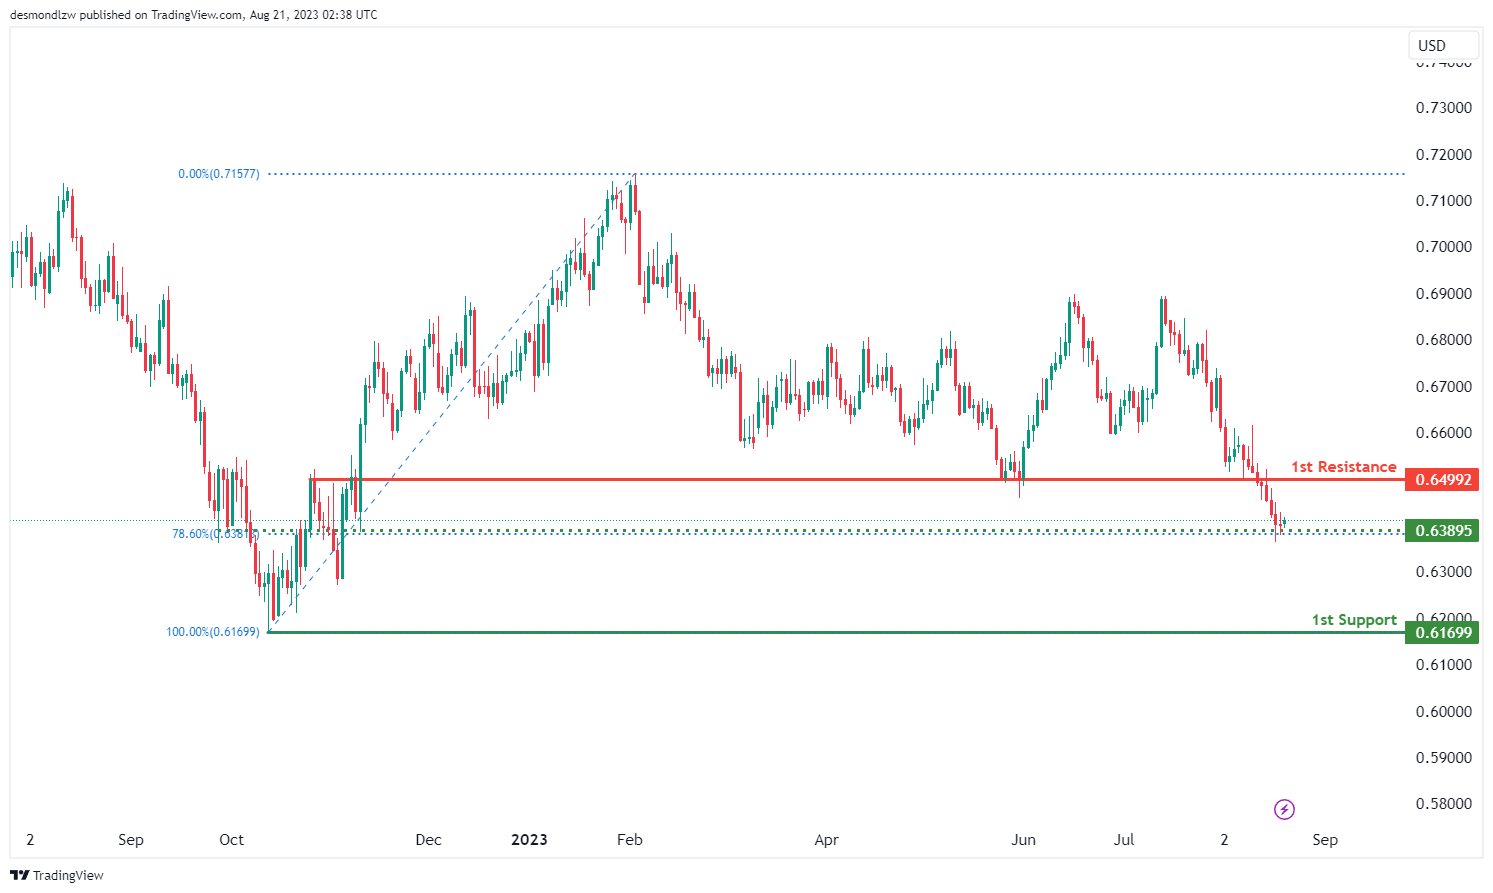
The AUD/USD chart is currently displaying a bearish momentum, indicating a potential downward trend.
Considering this bearish momentum, there’s a possibility that the price might continue its downward movement towards the 1st support level at 0.6169, which is bolstered by its role as a swing low support.
Furthermore, the intermediate support at 0.6389 adds to the support structure, as it aligns with a pullback support level and the 78.60% Fibonacci Retracement.
On the resistance side, the 1st resistance level at 0.6499 is significant due to its categorization as a pullback resistance.
These technical aspects help to provide insight into the potential price movement dynamics of the AUD/USD chart, highlighting key support and resistance levels.
NZD/USD
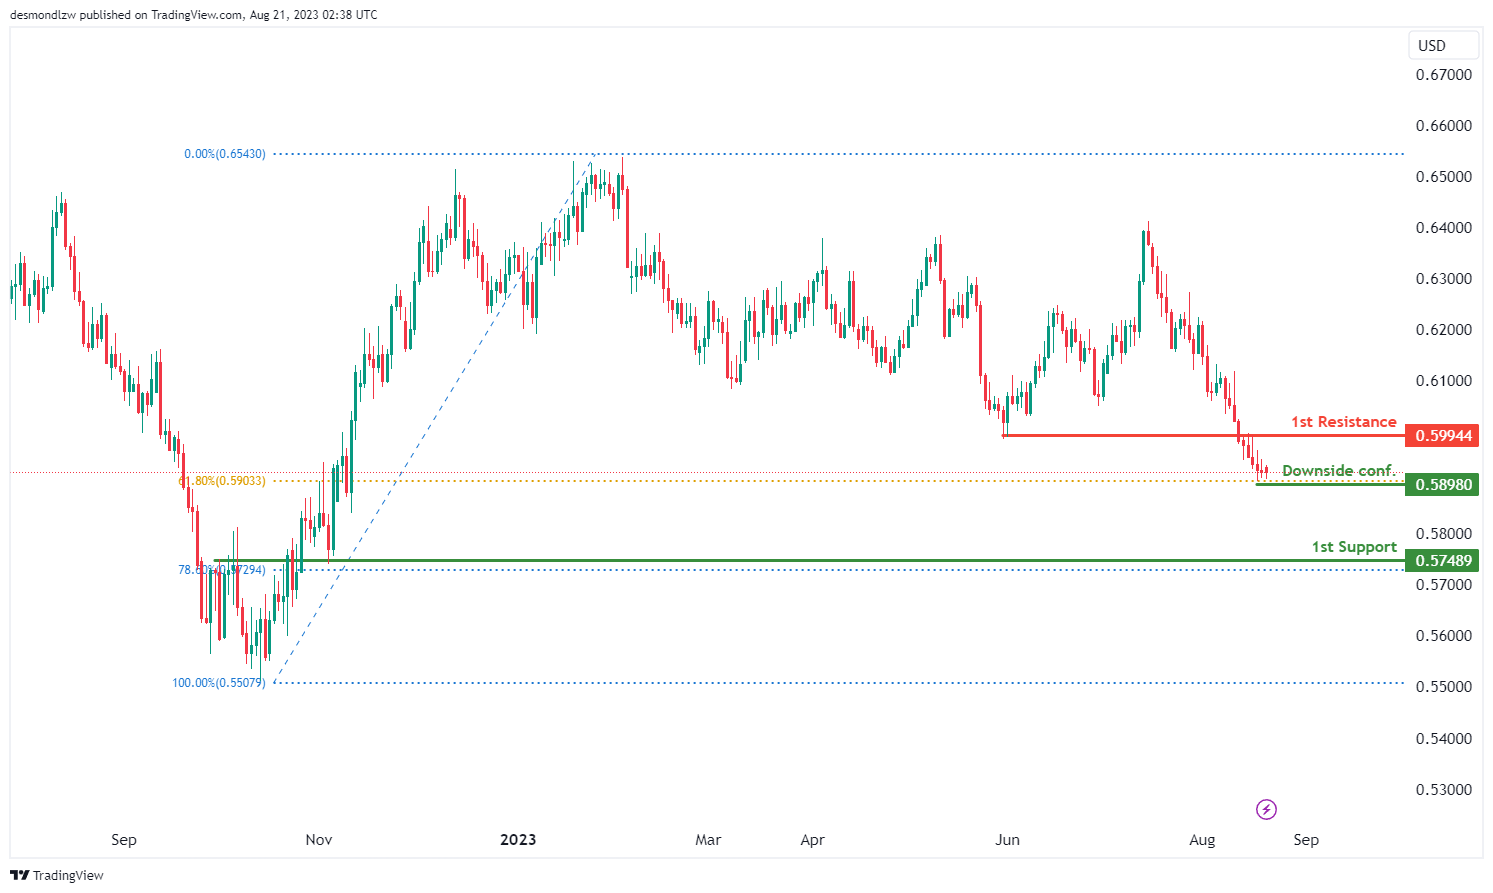
The NZD/USD chart currently displays a bearish momentum, indicating a prevailing downward trend in the market.
Considering this bearish momentum, there’s a potential scenario in which the price continues its downward movement towards the 1st support level at 0.5748. This level gains significance as a swing low support, indicating a possible area of price consolidation or reversal.
Additionally, the intermediate support at 0.5898 that aligns with the 61.8% Fibonacci retracement reinforces the potential support structure by aligning with a swing low support as well. Waiting for downside confirmation if the body closes below this level could provide further insight.
On the resistance side, the 1st resistance level at 0.5994 is notable due to its classification as an overlap resistance.
DJ30:
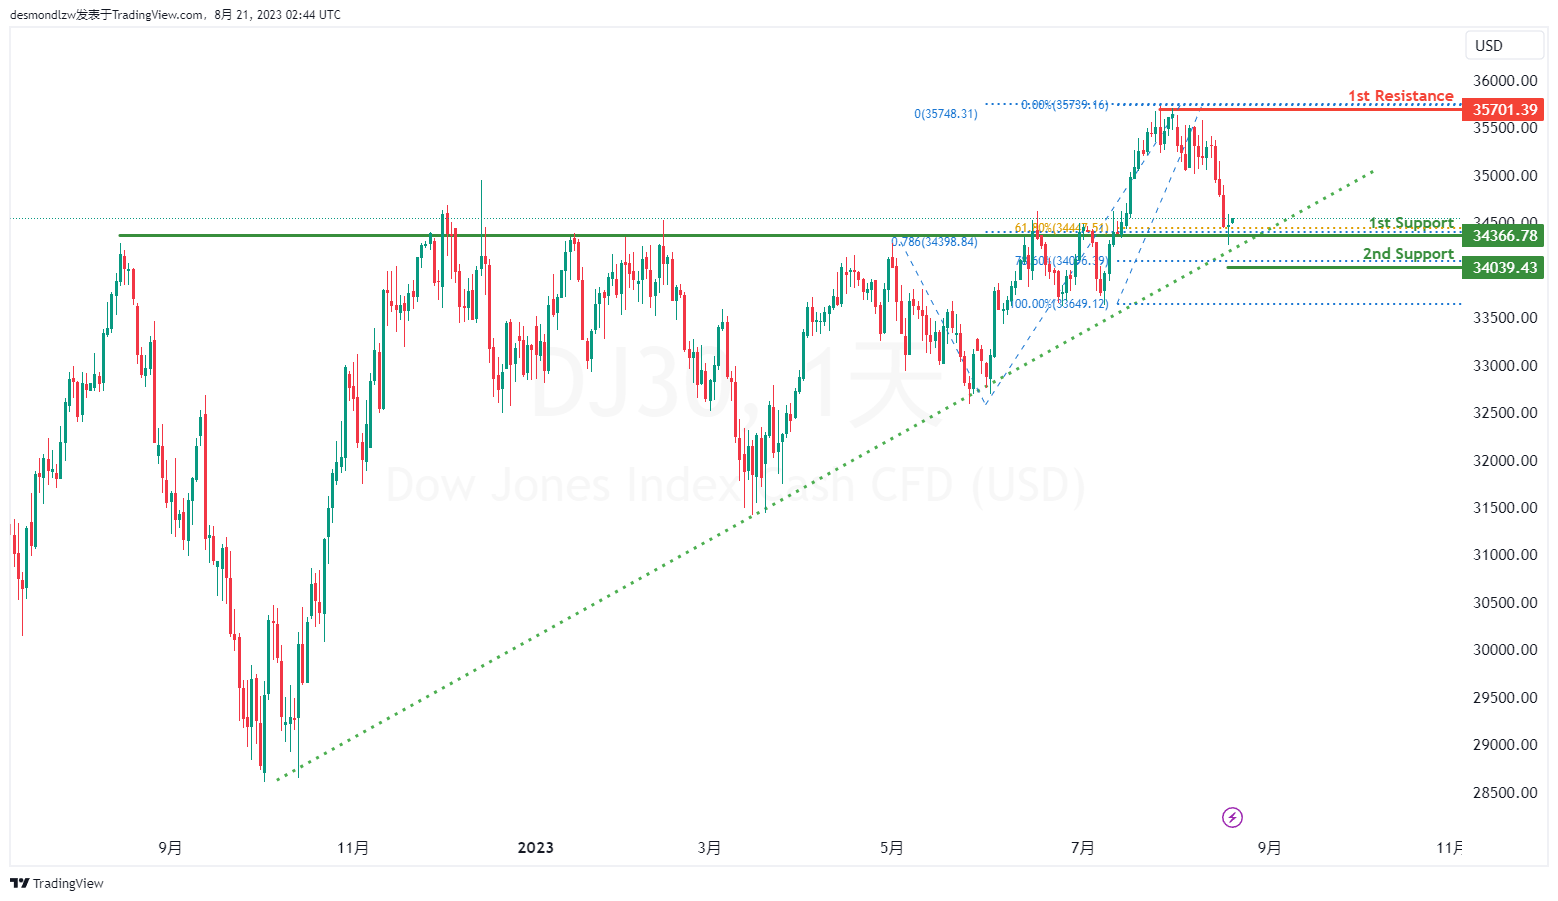
The DJ30 chart indicates a bullish overall momentum, and this is further supported by the fact that the price is above a major ascending trend line, which suggests the potential for further bullish momentum. There is a possibility for a bullish bounce off the 1st support level, leading the price towards the 1st resistance.
The 1st support is located at 34366.78 and is considered advantageous due to its overlap support characteristics, along with a Fibonacci confluence of a 61.80% Fibonacci Retracement and a 78.60% Fibonacci Projection. Additionally, the 2nd support at 34039.43 is also seen as valuable due to its association with a 78.60% Fibonacci Retracement.
On the resistance side, the 1st resistance level at 35701.39 is noteworthy as it represents a swing high resistance.
GER30:
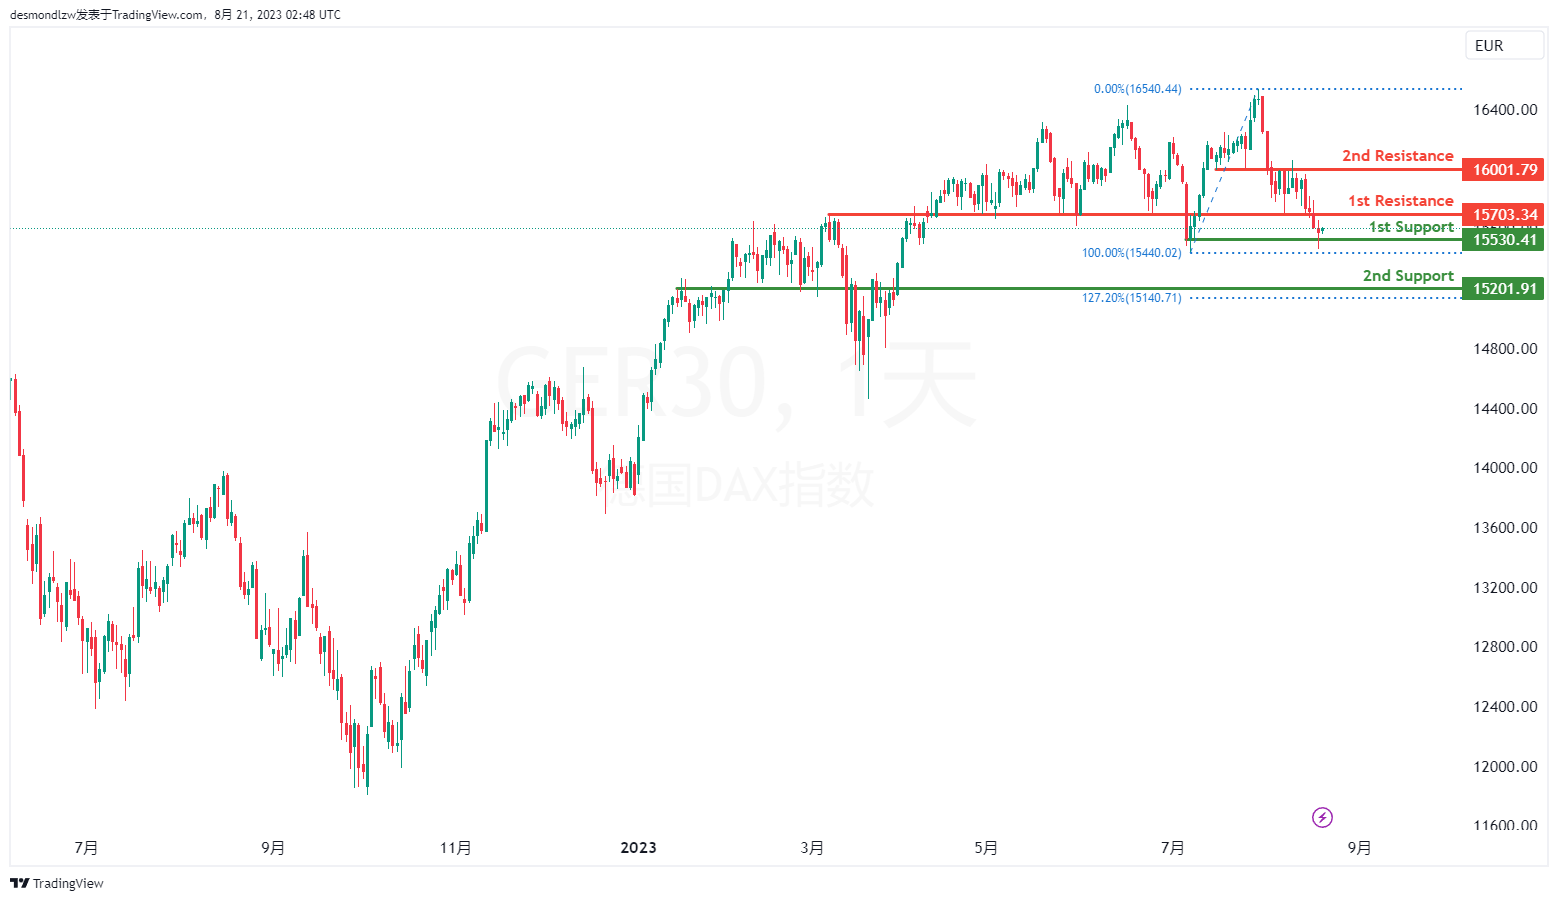
The GER30 chart indicates a bullish overall momentum. There is a potential for a bullish bounce off the 1st support level, leading the price towards the 1st resistance.
The 1st support is situated at 15530.41 and is considered advantageous due to its swing low support characteristics. Furthermore, the 2nd support at 15201.91 is also seen as valuable because it represents an overlap support.
On the resistance side, the 1st resistance level at 15703.34 is noteworthy as it represents an overlap resistance. Additionally, the 2nd resistance at 16001.79 is also significant due to its pullback resistance characteristics.
US500
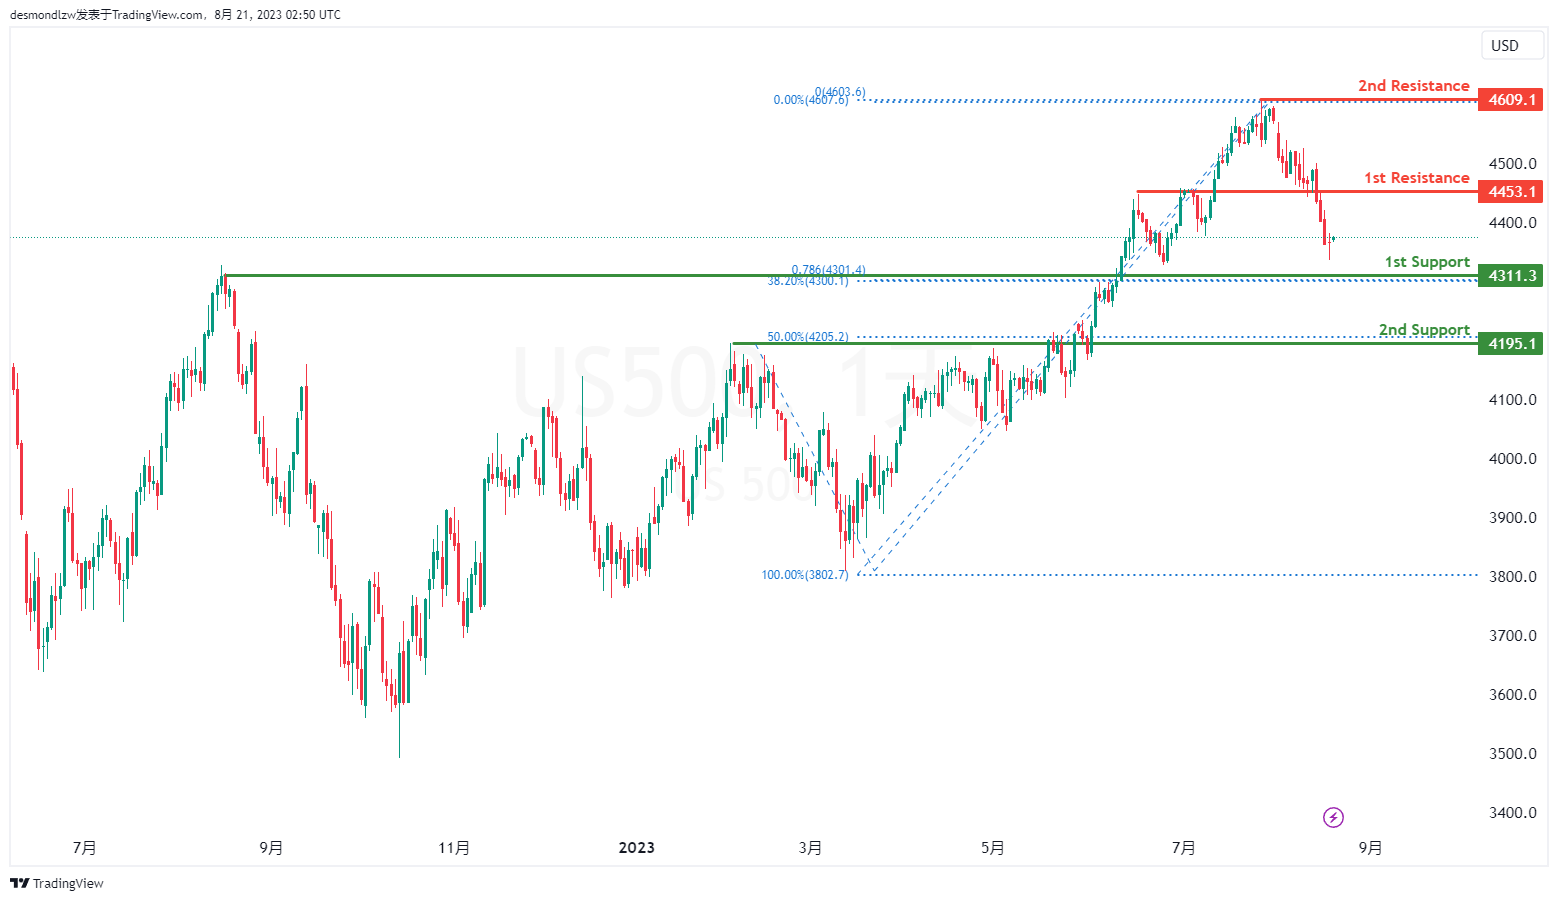
The US500 chart indicates a bearish overall momentum. There is a potential for a bearish continuation towards the 1st support level.
The 1st support is positioned at 4311.30 and is considered advantageous due to its pullback support characteristics. Furthermore, the 1st support exhibits a Fibonacci confluence with a 78.60% Fibonacci Projection and a 38.20% Fibonacci Retracement.
Additionally, the 2nd support at 4195.10 is also seen as valuable due to its pullback support attributes, as well as its association with a 50% Fibonacci Retracement.
On the resistance side, the 1st resistance level at 4453.10 is noteworthy as it represents an overlap resistance. Furthermore, the 2nd resistance at 4609.10 is significant due to its swing high resistance characteristics.
BTC/USD:
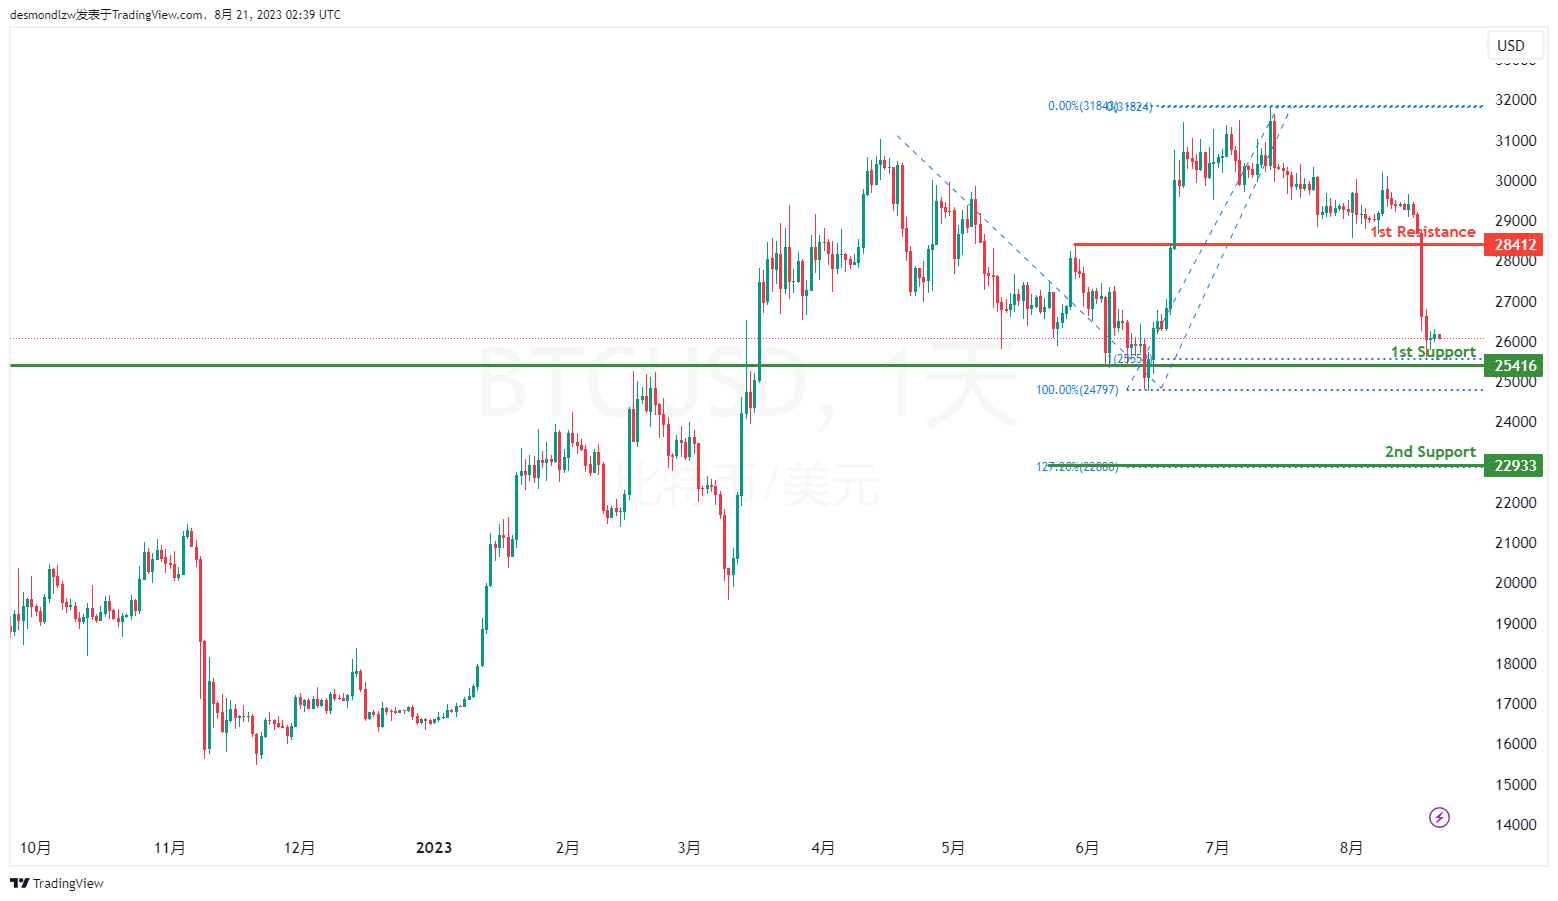
The BTC/USD chart indicates a bearish overall momentum. There is a potential for a bearish continuation towards the 1st support level.
The 1st support is located at 25416 and is considered advantageous due to its overlap support characteristics along with a 100% Fibonacci Projection. Furthermore, the 2nd support at 22933 is also seen as significant due to its association with the 127.20% Fibonacci Extension.
On the resistance side, the 1st resistance level at 28412 is noteworthy as it represents an overlap resistance.
ETH/USD:
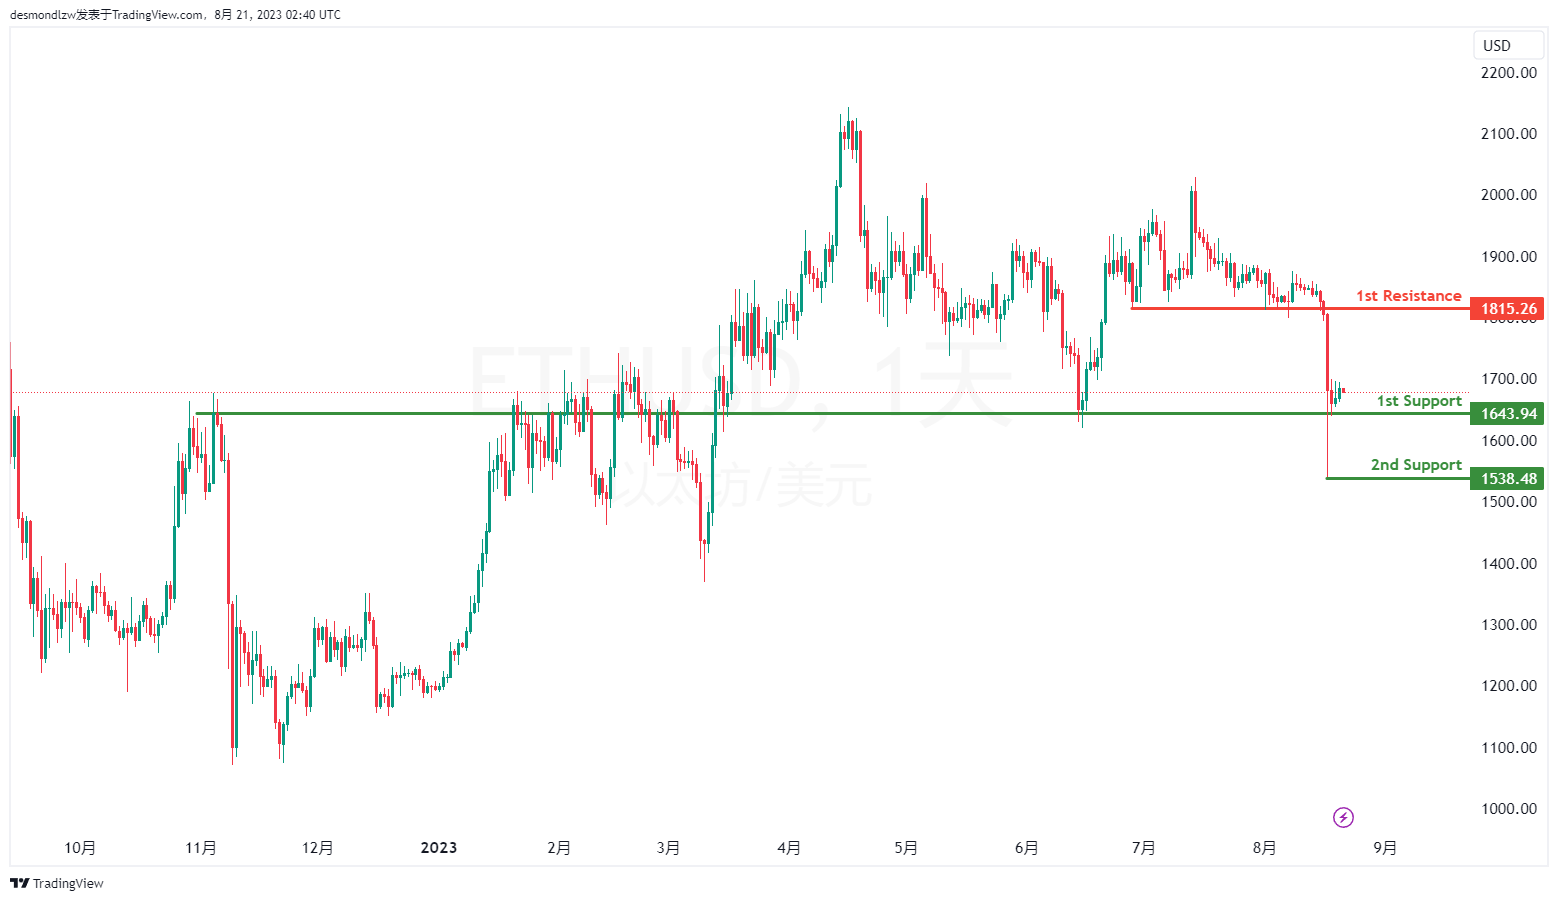
The ETH/USD chart indicates a bearish overall momentum. There is a potential for a bearish continuation towards the 1st support level.
The 1st support is positioned at 1643.94 and is considered advantageous due to its overlap support characteristics. Additionally, the 2nd support at 1538.48 is viewed as valuable because it represents a swing low support.
On the resistance side, the 1st resistance level at 1822.21 is noteworthy as it represents a pullback resistance, along with a 61.80% Fibonacci Retracement.
WTI/USD:
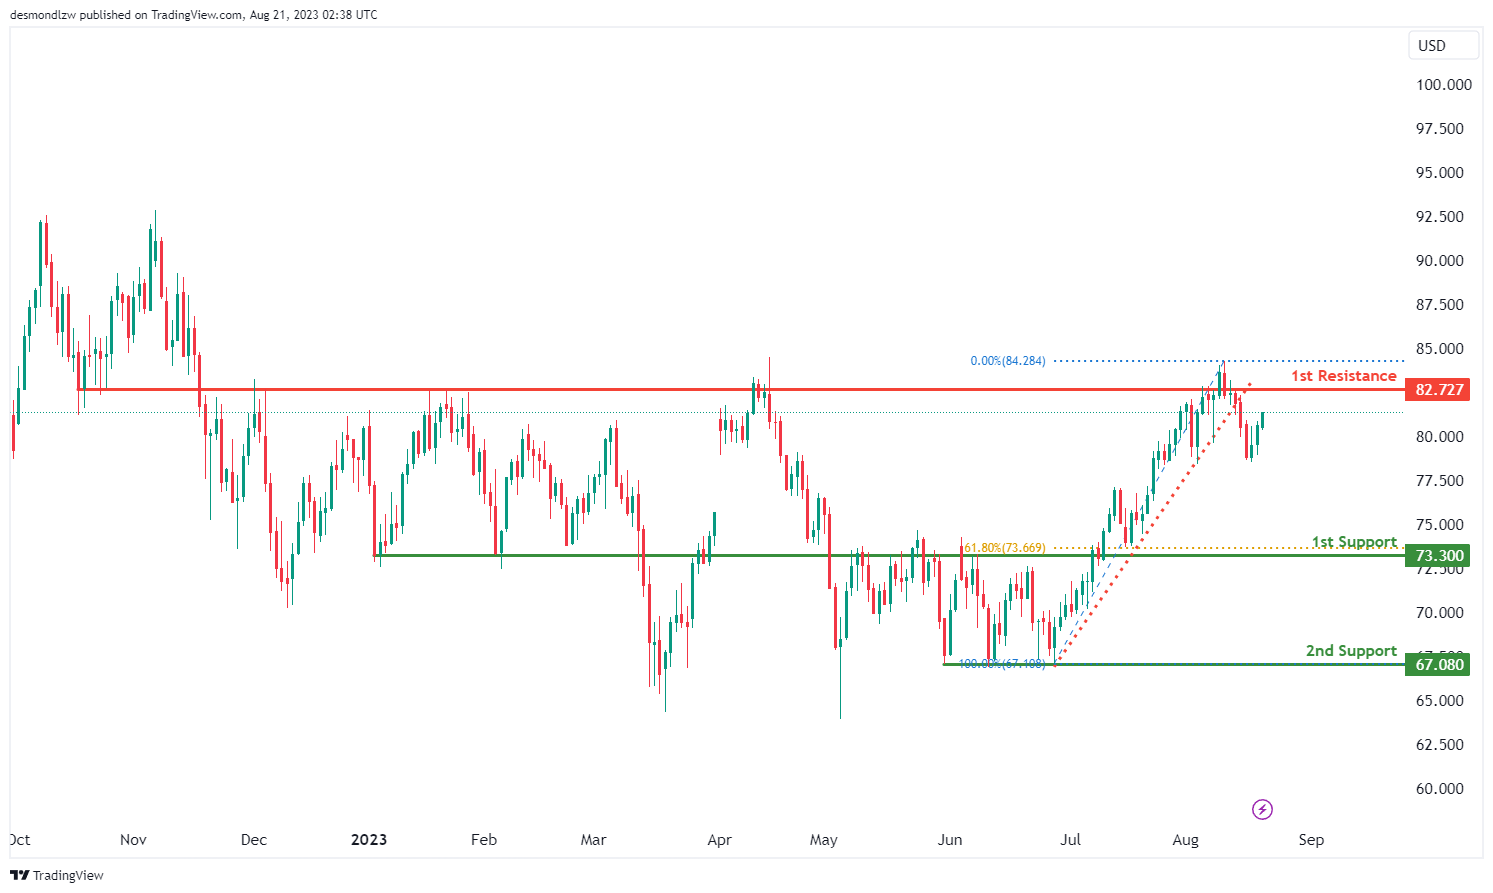
The WTI/USD chart currently exhibits a bullish momentum, indicating a prevailing upward trend in the market.
Considering this bullish momentum, there’s a possibility that the price might experience a continuation of its upward movement towards the 1st resistance level at 82.73. This level gains significance as an overlap resistance, suggesting a potential area where the price could face resistance.
On the support side, the 1st support level at 73.30 is notable due to its identification as an overlap support that aligns with the 61.80% Fibonacci retracement level. Additionally, the 2nd support level at 67.08 is reinforced by its association with multiple swing-lows, enhancing its support potential.
XAU/USD (GOLD):
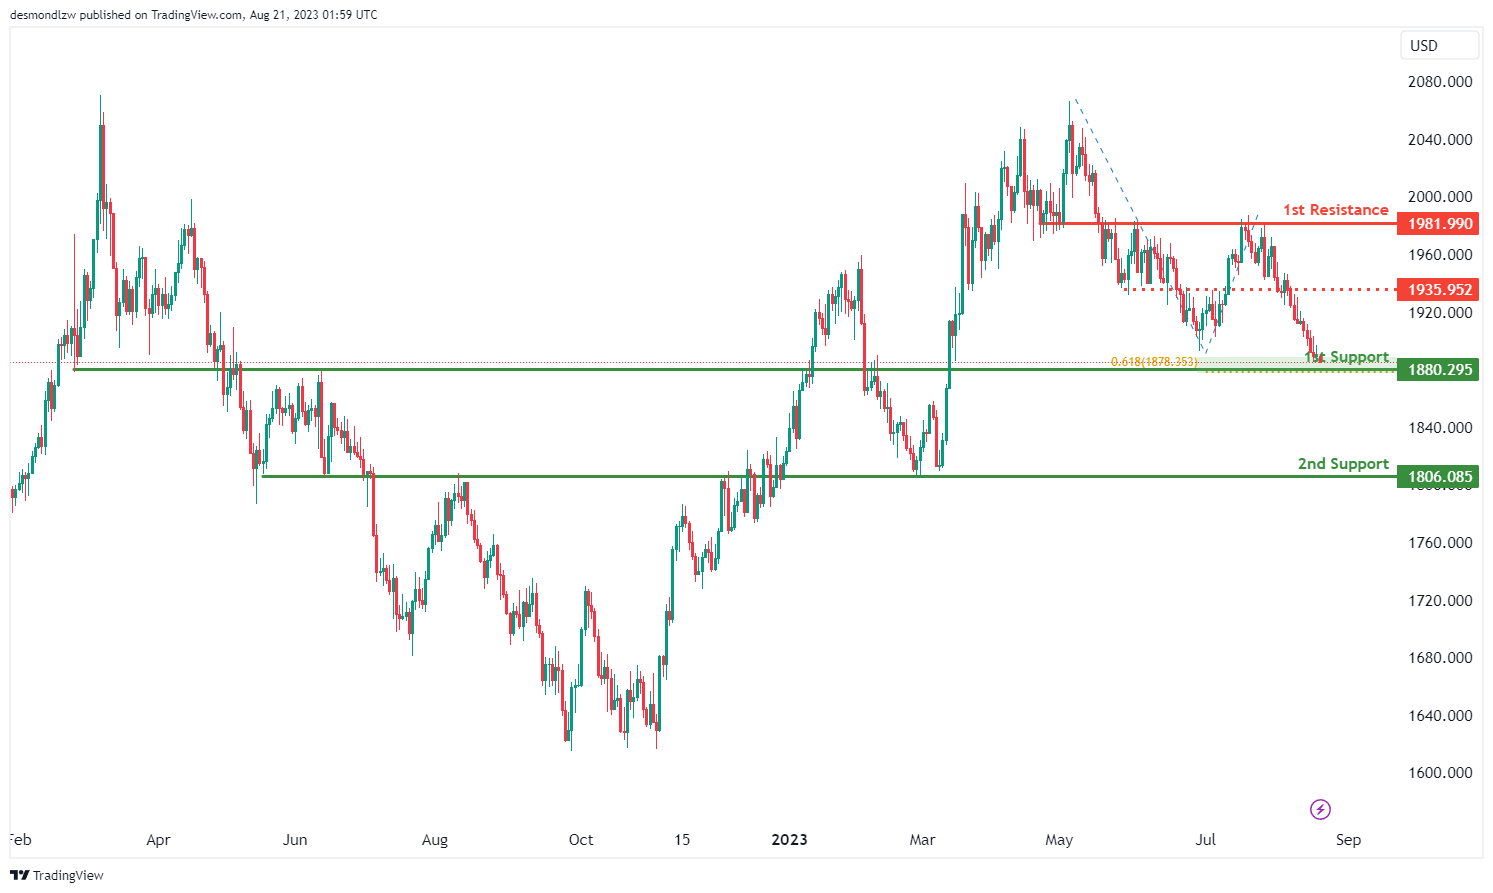
The XAU/USD chart currently indicates a bullish momentum, signifying a prevailing upward trend.
Within this momentum context, there’s a potential scenario where the price undergoes a bullish rebound upon reaching the 1st support level at 1880.29. This rebound might drive the price towards the 1st resistance at 1981.99.
The significance of the 1st support at 1880.29 lies in its identification as a pullback support, further reinforced by its alignment with a 61.80% Fibonacci Projection. Additionally, the 2nd support level at 1806.08 adds to the support structure as an overlap support, potentially providing a strong base for price movements.
Conversely, the 1st resistance level at 1981.99 is notable due to its designation as an overlap resistance, suggesting a potential area where selling interest might arise. Similarly, the 2nd resistance at 1935.95 strengthens the resistance zone as another overlap resistance.
China cuts 1-yr LPR moderately, keeps 5 yr LPR unchanged
In a somewhat anticipated move, China's PBoC made a cut to its one-year loan prime rate by 10bps, settling it at 3.45%. This is a slight deviation from the 15bps reduction that the majority of economists had forecasted. What stands out is that this marks the second reduction in this rate in just a span of three months.
However, eyebrows were raised when PBOC decided to keep its five-year LPR — the benchmark for most mortgages in the country — steady at 4.2%. This move defied expectations of a 15 bps cut by many market watchers. The unaltered five-year LPR is being read by many as a signal of Chinese banks' hesitancy to compromise their rate differential margin. Such reluctance throws into sharp relief potential concerns about the effective transmission of PBOC's policy decisions into the broader market landscape.
Furthermore, it stirs up conversations about the central bank's capability to invigorate the property sector and the broader economy through monetary easing strategies. This narrative is all the more potent given that this decision on the one-year LPR came on the heels of an unexpected reduction in PBOC's medium-term policy rate just a week earlier. To give specifics, PBOC had reduced the one-year medium-term lending facility rate by 15 basis points, bringing it down to 2.50% from its previous 2.65%.
Considering these rate adjustments, many financial experts are now projecting more proactive measures from the PBOC in the forthcoming months. This may encompass further rate trims as well as potential reductions in the reserve requirement ratio for banks.
EUR/USD At Clear Risk of Additional Losses
Key Highlights
- EUR/USD declined below the 1.0920 and 1.0900 levels.
- A key bearish trend line is forming with resistance near 1.0885 on the 4-hour chart.
- Bitcoin price saw a major decline below the $27,000 level.
- GBP/USD is consolidating below the 1.2800 zone.
EUR/USD Technical Analysis
The Euro started a major decline from well above 1.0000 against the US Dollar. EUR/USD traded below the 1.0950 support to move into a bearish zone.
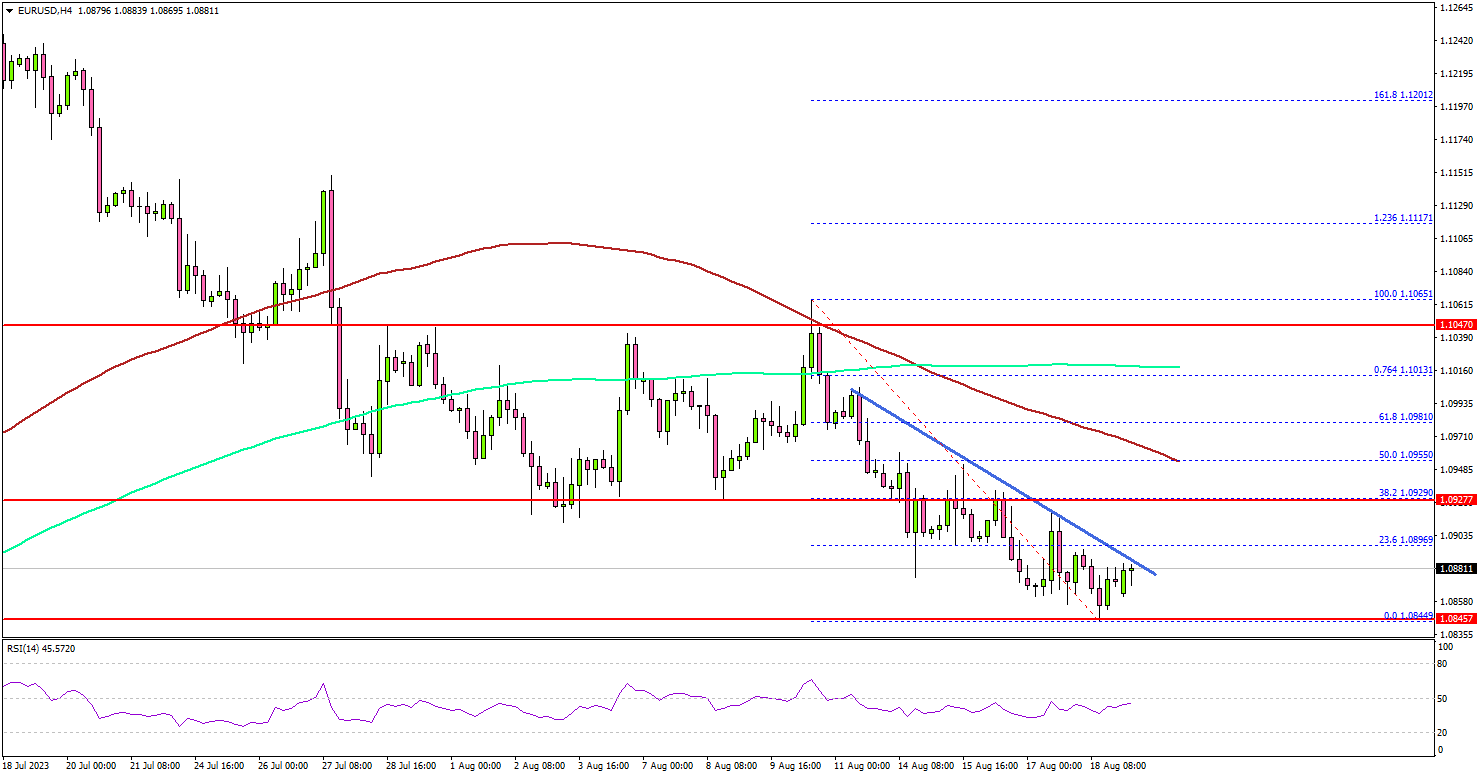
Looking at the 4-hour chart, the pair settled below the 1.0950 level, the 100 simple moving average (red, 4 hours), and the 200 simple moving average (green, 4 hours).
There was also a drop below the 1.0900 level and the pair tested 1.0845. The pair is now consolidating losses and facing many hurdles. On the upside, an initial resistance is near the 1.0885 level. There is also a key bearish trend line forming with resistance near 1.0885 on the same chart.
The first major resistance is near 1.0930. A close above the 1.0930 resistance could start a decent increase. In the stated case, the pair could rise toward the 1.0955 level. Any more gains could start a fresh increase toward the 1.1020 level.
If not, the pair might continue lower below the 1.0845 level. The first key support is seen near the 1.0800 level. If there is a move below 1.0800, the pair could dive toward 1.0720.
Looking at Bitcoin, there was a sharp bearish reaction and the price declined below the $27,000 support zone.
Economic Releases
- German Producer Price Index for July 2023 (MoM) – Forecast -5.1%, versus +0.1% previous.
NZ exports down -14% yoy in Jul, imports down -16% yoy, China leads the falls
July 2023 has been a challenging month for New Zealand's trade scenario, as the island nation witnessed a steep fall in both goods exports and imports. Data released depicted a substantial decline, with exports plunging by NZD -890m or -14% yoy, concluding at NZD 5.5B. Concurrently, imports saw a -16% yoy decline, falling NZD -1.2B to settle at NZD 6.6B for the month. This decrease in trade volumes culminated in a monthly trade deficit of NZD -1.1B. This significantly overshadows market expectations of NZD -0.05B.
Zooming in on the country-by-country trade details, China conspicuously led the downturn in both exports and imports. New Zealand's exports to the Asian giant dipped by -24% yoy, translating to a decline of NZD -407m while imports reduced by a staggering NZD -427m, down -25% yoy.
However, not all trade relations showed a contraction. Australia the US emerged as silver linings, with their exports experiencing an upward trajectory. Exports to Australia saw an 8.9% yoy growth, adding NZD 59m to the tally, and US followed suit with a 16% yoy rise, upping the figure by NZD 105m.
Yet, as New Zealand engaged with its other major trade partners, the news wasn't all positive. European Union and Japan both registered a decrease in exports, declining by -16% yoy (NZD -73m) and -21% yoy (NZD -84m) respectively. On the import front, while USA and South Korea posted a rise of 24% (NZD 166m) and 18% (NZD 71m), both European Union (up 1.9% yoy) and Australia (down -2.7% yoy) experienced mixed results.
Forex and Cryptocurrencies Forecast
EUR/USD: What Strengthens the Dollar and What Can Weaken It
The US currency maintained its ascent last week. The minutes from the Federal Open Market Committee (FOMC)'s July meeting of the US Federal Reserve were published on Wednesday, August 16, suggesting the possibility of further monetary policy tightening.
Before the minutes were unveiled, market players debated how long the central interest rate would linger at 5.5%. However, once the document's content was revealed, discussions shifted to how much more this rate could increase. Several FOMC members expressed in the minutes that the current economic landscape might not see as significant a decrease in inflation as hoped. This sentiment paves the way for the Fed to consider another rate hike. As a result, the likelihood that the interest rate could climb to 5.75% or even higher in 2023 has surged from 27% to 37%, reinforcing the dollar's position.
Other factors bolstering the US dollar include the favourable state of the securities market and the robust health of the US economy. Positive retail sales figures prompted the Federal Reserve Bank of Atlanta to revise its Q3 GDP forecast for the country, raising it from 5.0% to 5.8%. The real estate market is also showing promising signs: the monthly issued construction permits rose by 0.1%. Furthermore, the construction of new homes increased by 3.9%, reaching 1.452 million units, surpassing the projected 1.448 million. Retail sales statistics released on August 15th further supported the Dollar Index (DXY), with consumer activity in July expanding by 0.7%: outpacing the anticipated 0.4% and the prior 0.2% figure. Collectively, these data points underscore a diminishing risk of the US economy entering a recession, suggesting a likely continuation of the monetary restriction phase. Additionally, escalating oil prices might nudge the regulator towards subsequent rate hikes, potentially spurring another inflationary wave.
On the other hand, the situation in the US banking sector could pose challenges for the dollar. Neil Kashkari, the President of the Federal Reserve Bank of Minneapolis, believes that the crisis that began in March, leading to the bankruptcy of several major banks, might not yet be over. He opines that if the Federal Reserve continues to raise interest rates, it will significantly complicate the operations of banks and could trigger a new wave of bankruptcies. This perspective is echoed by analysts at Fitch Ratings. Their projections even consider the possibility of downgrading the ratings of several US banks, including giants like JPMorgan Chase & Co.
Strategists at Goldman Sachs believe that the Federal Reserve might only consider reducing the key rate in Q2 2024. A potential trigger for this move could be the inflation rate stabilizing at the target level of 2.0%. However, Goldman Sachs acknowledges that the actions of the regulator remain unpredictable, which means the rate could stay at peak levels for a more extended period. Overall, according to the CME FedWatch Tool, 68% of market participants anticipate that by May 2024, the rate will be reduced by at least 25 basis points (b.p.).
Regarding the Eurozone's economy, data published on August 16th showed that it grew by 0.3% (quarter-on-quarter) for Q2 2023. This figure aligns perfectly with predictions and matches the growth rate of Q1. On an annual basis, the GDP growth stood at 0.6%, which is consistent with both forecasts and the previous quarter's numbers. The inflation figures released on Friday, August 18, were also unsurprising. They matched both market expectations and previous figures. In July, the Core Consumer Price Index (CPI) was recorded at 5.5% (year-on-year) and -0.1% (month-on-month).
Amid such consistently modest economic performance, the euro continues to face downward pressure. Factors contributing to this include the potential energy crisis in Europe this upcoming winter and uncertainties surrounding the monetary policy of the European Central Bank (ECB).
Starting the five-day trading period at 1.0947, EUR/USD closed at 1.0872. As of the evening of August 18, when this review was written, 50% of analysts predict a rise for the pair in the near future, 35% favour the dollar, and the remaining 15% maintain a neutral stance. Regarding oscillators on the D1 timeframe, 100% are leaning towards the US currency, but 25% of them indicate that the pair is oversold. Trend indicators show 85% pointing southward, while the remaining 15% look north. The nearest support levels for the pair lie in the range of 1.0845-1.0865, followed by 1.0780-1.0805, 1.0740, 1.0665-1.0680, 1.0620-1.0635, and 1.0525. Bulls will encounter resistance in the range of 1.0895-1.0925, then at 1.0985, 1.1045, 1.1090-1.1110, 1.1150-1.1170, 1.1230, 1.1275-1.1290, 1.1355, 1.1475, and 1.1715.
Next week, the spotlight will be on the symposium of heads of major central banks in Jackson Hole, taking place from August 24 to 26. If the Federal Reserve Chairman, Jerome Powell, even hints at the imminent conclusion of the current rate-hike cycle in his speech on August 25, the DXY (Dollar Index) might turn downward. However, it's evident that currency pair dynamics will also depend on what leaders of other central banks say, naturally including ECB President Christine Lagarde.
Other notable events for the week include the release of US labour market data on August 22 and 23. On Wednesday, August 23, business activity indicators (PMI) for the United States, Germany, and the Eurozone will be disclosed. Additionally, on Thursday, August 24, statistics on durable goods orders and unemployment in the US will be made available.
GBP/USD: BoE's Indecision - A Disaster for the Pound
GBP/USD has oscillated within the 1.2620-1.2800 range for the past two and a half weeks, with neither bulls nor bears establishing a clear upper hand. Despite the Bank of England (BoE) recently raising interest rates, bullish momentum for the pound remains elusive.
There's growing concern among market stakeholders that an aggressive monetary policy tightening could further destabilize the UK's already fragile economy, which teeters on the brink of recession. In July, the unemployment rate rose notably by 0.2%, settling at 4.2%. More worryingly, youth unemployment surged by 0.9%, moving from 11.4% to 12.3%. Additionally, there was an increase of 25K in those claiming unemployment benefits compared to the prior month. This rise in unemployment can be largely attributed to the wave of business bankruptcies that initiated in 2021. This trend saw a stark acceleration in early 2022, matching levels witnessed only during the late 1980s crisis and the 2008 financial meltdown.
As per the latest data released by the Office for National Statistics (ONS) on August 18, retail sales in the UK for July declined by 1.2% on a monthly basis, a more significant drop than the 0.6% seen the previous month. On an annual basis, there was a 3.2% contraction, compared to the 1.6% decrease observed in June.
The inflation data (CPI) released on August 16 indicates that despite dropping from 7.9% to 6.8% year-on-year (YoY), inflation remains notably high. Moreover, the core rate remained steady at 6.9%. The rising cost of energy could potentially lead to a further inflationary surge.
The market firmly believes that the Bank of England must take appropriate action in response. The central bank might need to continue increasing rates not only this year but potentially into 2024. However, as economists from Commerzbank suggest, if in the coming weeks the market gets the impression that the BoE is wavering in its commitment to tackle inflationary risks for fear of hampering the economy too much, it could have catastrophic implications for the pound.
GBP/USD closed at 1.2735 n Friday, August 18. Experts' forecast for the near future is as follows: 60% lean bullish on the pound, 20% are bearish, and the remaining 20% prefer a neutral stance. On the D1 oscillators, 50% are coloured red, indicating a bearish trend, while the other 50% are in a neutral gray. For trend indicators, the ratio of red to green is 60% to 40%, favouring the bullish side.
Should the pair move downward, it will encounter support levels and zones at 1.2675-1.2690, 1.2620, 1.2575-1.2600, 1.2435-1.2450, 1.2300-1.2330, 1.2190-1.2210, 1.2085, 1.1960, and 1.1800. If the pair ascends, resistance will be met at 1.2800-1.2815, 1.2880, 1.2940, 1.2980-1.3000, 1.3050-1.3060, 1.3125-1.3140, 1.3185-1.3210, 1.3300-1.3335, 1.3425, and 1.3605.
In terms of macroeconomic data, Wednesday, August 23 will be the "PMI day" not only for Europe and the USA but also for the UK, as business activity indicators in various sectors of the British economy will be released. And, of course, one cannot forget about the annual symposium in Jackson Hole.
USD/JPY: Anticipating Currency Interventions
The release of the FOMC minutes and the rise in yields of 10-year U.S. Treasuries to levels not seen since 2008 propelled USD/JPY even higher, reaching 146.55. As noted by economists from Japan's MUFG Bank, "The dollar's strengthening has pushed USD/JPY into a danger zone where the risk of intervention to halt its upward movement is increasing." Colleagues from the Dutch banking group ING concur that the pair is now in the territory of currency interventions. "However," ING believes, "it likely lacks the necessary volatility to alarm Japanese officials."
Recall that the Ministry of Finance (MOF) had intervened in USD/JPY at levels above 145.90 last September. But currently, neither the Ministry of Finance nor the Bank of Japan (BoJ) are in a hurry to defend the domestic currency. Contrary to the U.S., Eurozone, and the UK, where inflation is on a decline (albeit at different rates), inflation in Japan is on the rise. On Friday, August 18, the country's Statistical Bureau published the National Consumer Price Index (CPI) for July, which stood at 3.3%, whereas a result of 2.5% (year-on-year) was anticipated.
Commerzbank analysts don't see much chance for the yen to appreciate again, even though the country's GDP is growing. (Preliminary data indicates growth in the second quarter was at 1.5% (year-on-year) compared to a forecast of 0.8% and a previous rate of 0.9%). On the contrary, there are concerns that under current conditions, the yen could weaken further if the Ministry of Finance doesn't take action to halt the decline. "Perhaps the Bank of Japan and the Ministry of Finance are hoping the situation will shift once U.S. interest rates begin to drop again," Commerzbank economists suggest. "We also anticipate a weakening of the dollar at that point. However, that moment is still some time away. The only thing the Ministry of Finance will achieve with its interventions up until then is to buy time. In our view, going against the prevailing winds cannot succeed in strengthening the yen. It might work temporarily, but that's not a certainty.".
However, market participants are growing increasingly concerned that a weak yen might at some point prompt action from Japanese officials. As suggested by ING, the oversold status of the Japanese currency coupled with the threat of interventions will likely exacerbate any bearish corrections in USD/JPY. It was following such a correction, albeit a modest one, that the pair concluded the past week at a level of 145.37.
Regarding the near-term outlook, the median forecast from experts is as follows: An overwhelming majority (60%) anticipates the dollar to strengthen and expects USD/JPY to continue its upward trajectory. The remaining 40% anticipate a bearish correction. On the D1 oscillators, a full 100% are colored green, although 20% indicate overbought conditions. For the trend indicators, 80% are in green while 20% are in red. The nearest support level is situated at the 144.50 zone, followed by 143.75-144.04, 142.90-143.05, 142.20, 141.40-141.75, 140.60-140.75, 139.85, 138.95-139.05, 138.05-138.30, and 137.25-137.50. Immediate resistance lies at 145.75-146.10, then 146.55, 146.90-147.15, 148.45, 150.00, and finally, the October 2022 high of 151.95.
The Consumer Price Index (CPI) for the Tokyo region will be released on Friday, August 25. No other significant data releases pertaining to the state of the Japanese economy are scheduled for the upcoming week.
CRYPTOCURRENCIES: How Elon Musk Crashed the "People's Dollar"
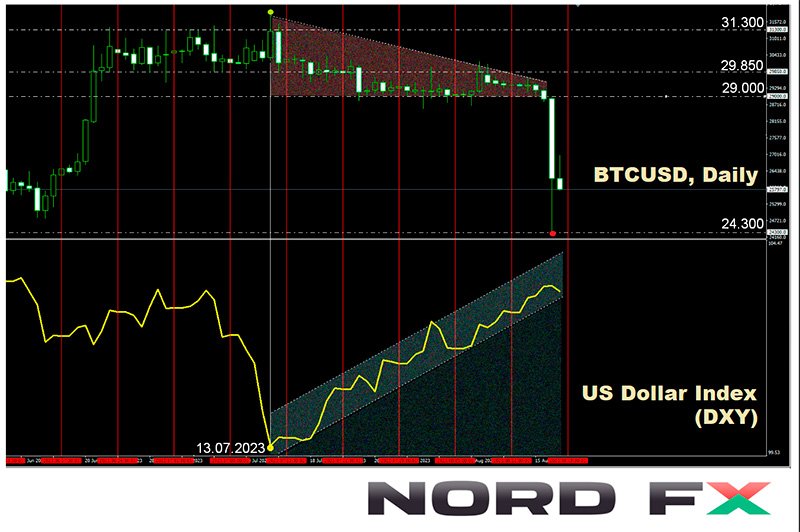
From July 14, the primary cryptocurrency, and the digital asset market as a whole, have been under the pressure of a strengthening dollar. Clearly, when the weight on the BTC/USD scale tips towards the dollar, bitcoin becomes lighter. In fact, from August 11 to 15, it seemed as if the market had completely forgotten about cryptocurrencies, with the BTC/USD pair's chart thinly stretching from west to east, hugging the Pivot Point of $29,400.
Glassnode analysts noted at the time that the digital gold market had reached a phase of extreme apathy and exhaustion. Volatility metrics at the beginning of the week hit record lows, with the Bollinger Bands spread narrowing to 2.9%. Such low levels were only seen twice in history: in September 2016 and January 2023. "The market needs to take steps to...break the investor apathy," concluded Glassnode specialists.
Such actions were taken, though not necessarily in the direction investors would have preferred. The first move occurred on the evening of August 16 when BTC/USD dropped to $28,533. This decline was likely triggered by the publication of the minutes from the Federal Reserve's July meeting, as mentioned earlier. But that modest setback wasn't the end of it. The next significant drop occurred on the night of August 17 to 18. It can be described as a plunge into the abyss, with bitcoin reaching a low of $24,296. The crash came after The Wall Street Journal, citing undisclosed documents, reported that Elon Musk's SpaceX had liquidated its BTC holdings, accounting for a $373 million markdown in cryptocurrency. However, the report did not specify when exactly SpaceX had sold these coins. Still, such details aren't necessary to ignite panic in the market.
Several other events also added pressure to the quotations. For instance, a U.S. Federal Court granted the Securities and Exchange Commission's (SEC) appeal against Ripple, casting doubt on a partial decision made in favour of Ripple a month prior. The ongoing series of legal claims by U.S. authorities against major cryptocurrency exchanges remains another negative influence.
Bitcoin's nosedive dragged the entire crypto market down with it, leading to a mass liquidation of open margin positions. According to Coinglass, over a 24-hour span, positions of more than 175,000 market participants were liquidated, resulting in traders' losses surpassing $1 billion.
The situation could have been much graver had it not been for a report from Bloomberg stating that the SEC was preparing to authorize the creation of the first futures ETFs for Ethereum. As a result, BTC/USD and ETH/USD corrected upwards, returning to levels seen two months prior. As a reminder, the market soared on June 15 after BlackRock filed an application to establish a spot bitcoin ETF. However, after the recent plunge, those gains were virtually erased.
Should we expect further declines? Notably, a trader and analyst known by the pseudonym Dave_the_Wave, renowned for his accurate forecasts, had warned that by the end of 2023, bitcoin could drop to the lower boundary of its Logarithmic Growth Curve (LGC), implying a roughly 38% drop from this year's peak. In such a scenario, the bottom would be around $19,700.
Another well-known trader, Tone Vays, did not rule out a drop in BTC to $25,000 (which has already occurred). In this case, Vays believes there's a high likelihood of a further long-term decline. From his perspective, the premier cryptocurrency is "teetering on the edge, and things look bleak." "The price needs to reverse immediately, I mean – this month. We cannot afford another month of decline; otherwise, panic will set in the market. I wouldn't be surprised if BTC trades below $20,000. Miners might even begin offloading their holdings, which is highly precarious," Vays cautions.
We have previously mentioned another expert, Michael Van De Poppe, founder of the venture company Eight, who has refuted claims of BTC's price dropping to the $12,000 mark. However, in his view, for bitcoin to return to active growth, it needs to surpass the $29,700 level. The next significant target for the coin would be $40,000.
In contrast to Michael Van De Poppe, Kevin Kelly, co-founder, and head of research at Delphi Digital, has already spotted early signs of a bull rally. However, this observation was made before the slump on August 18. According to Kelly, a standard crypto cycle starts when bitcoin reaches an all-time high (ATH), followed by an 80% decline. Roughly two years later, it rebounds to its previous ATH and continues climbing to a new peak. This sequence typically spans around four years.
Kelly believes this pattern isn't random but aligns with a "broader business cycle." He noted that bitcoin's price peak often coincides with the ISM manufacturing index, which currently appears to be in the final phase of its downturn. The current situation reminds Kelly of the market dynamics between 2015 and 2017.
He highlighted that the last two bitcoin halvings occurred roughly 18 months after the asset bottomed out and about seven months before it broke its historical peak. The next halving is anticipated in April 2024. After which, about six months later by the expert's estimates, the digital gold might reach its ATH. However, Kelly warned that there are no guarantees of this scenario unfolding. He also speculated about the possibility of a "false bottom."
A similar cyclical analysis was conducted by an analyst known as Ignas, predicting a bitcoin bull market in 2024. His calculation is based on the pattern that the primary cryptocurrency has showcased for many years: 1. An 80% dip from ATH, lowest point a year later (Q4 2022). 2. Two years for recovery and reaching the previous peak (Q4 2024). 3. Another year of price growth leading to a new ATH (Q4 2025).
According to Ignas, the crypto industry faced macroeconomic challenges in 2022, but the situation is now improving. The bitcoin halving in April 2024 might align with a global liquidity surge, fuelling the anticipated bull rally. Additionally, new use cases for bitcoin and the launch of spot bitcoin ETFs, once approved by the SEC, will influence its price.
From a survey conducted by the popular blogger and analyst known as PlanB, 60% of respondents believe in a bull market's onset post-halving. PlanB himself theorizes that by the time of this event, BTC will be priced around $55,000. Signals from his bitcoin price prediction model, S2F, hint at the coin's potential movement towards this figure.
Robert Kiyosaki, investor, and author of the financial bestseller "Rich Dad Poor Dad" made another prediction. "Bitcoin is heading to $100,000," Kiyosaki believes. "The bad news: if the stock and bond market crashes, gold and silver prices will skyrocket. Worse, if the global economy collapses. Then bitcoin will be worth a million, gold can be bought for $75,000, and silver for $60,000. The national debt is too great. Everyone is in trouble," wrote Kiyosaki. But he added, just in case, "I hope I'm wrong."
Fittingly for a writer, Kiyosaki metaphorically called gold and silver "God's money" and bitcoin the "people's dollar". "I like bitcoin because we have a common enemy - the US federal government, the treasury, the Federal Reserve, and Wall Street. I don't trust them. If you trust, then collect dollars, and you'll get an IOU," he said.
It's worth noting that, in contrast to Robert Kiyosaki's stance, many investors have recently been gravitating towards the US dollar instead of the "people's currency." They view the dollar as a more reliable safe-haven asset. This shift is evident when comparing the DXY and BTC charts. At the time of this review, on the evening of August 18, the market has shown some signs of stabilization, with the BTC/USD trading close to $26,100. The total market capitalization of cryptocurrencies took a significant hit, narrowly maintaining above the psychological threshold of $1 trillion, registering at $1.054 trillion, down from $1.171 trillion just a week prior. Not surprisingly, the Crypto Fear & Greed Index also saw a decline, moving from the Neutral category into the Fear territory, marking a score of 37, a drop from last week's 51 points.
A Stormy Week With Selloff in Bonds, Stocks, Bitcoin and China
Last week, the financial world navigated a storm of uncertainty and volatility. From skyrocketing treasury yields to the extended declines in equities, from the downward spiral of Chinese stock market to the tumultuous Yuan exchange rate, and not forgetting the unexpected nosedive in Bitcoin. At the same time the dynamics of these developments are closely intertwined.
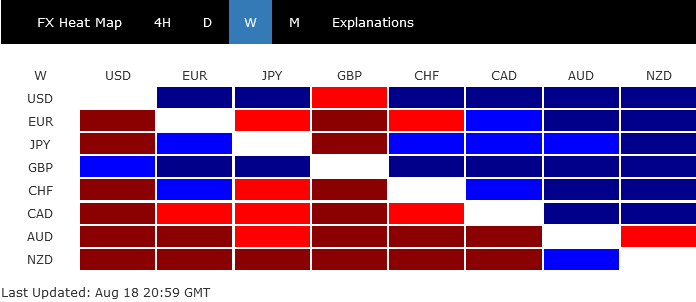
Dollar demonstrated its resilience, buoyed by the widespread risk-averse sentiment in the market. Yet, while it showcased strength, it was British Sterling that took the limelight, clinching the title as the week's star performer. Meanwhile, Japanese Yen hinted at the dawn of a potential sustainable rebound, claiming the third spot on the podium.
However, not all currencies shared in the triumphs. Australian Dollar bore the brunt of the week's tumult, finding itself at the mercy of subpar domestic data and external pressures from China's own financial whirlwind. Trailing closely behind in this downtrend were New Zealand and Canadian Dollars, emblematic of the broader risk-averse climate. Amidst the currency chaos, both Euro and Swiss Franc seemed to tread water, their performances largely overshadowed by the formidable Pound.
Surging yields, falling stocks, and Dollar index
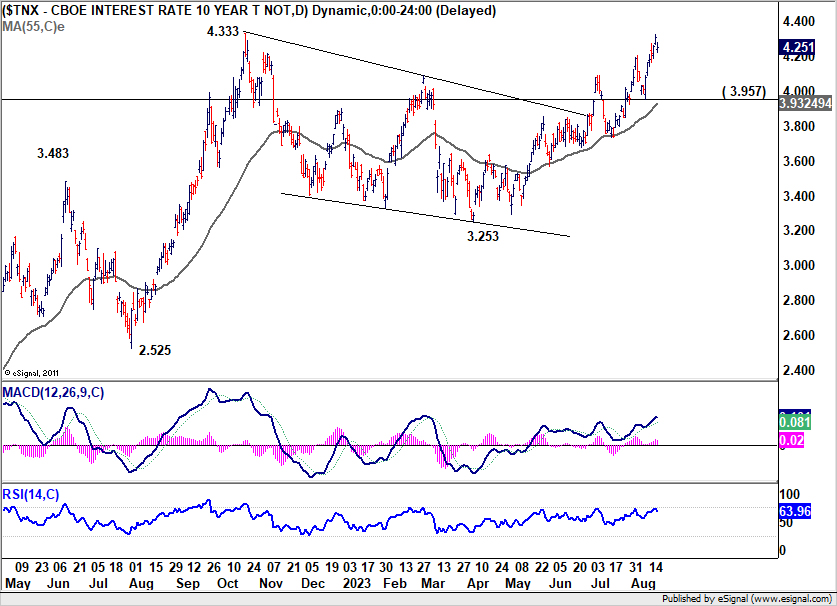
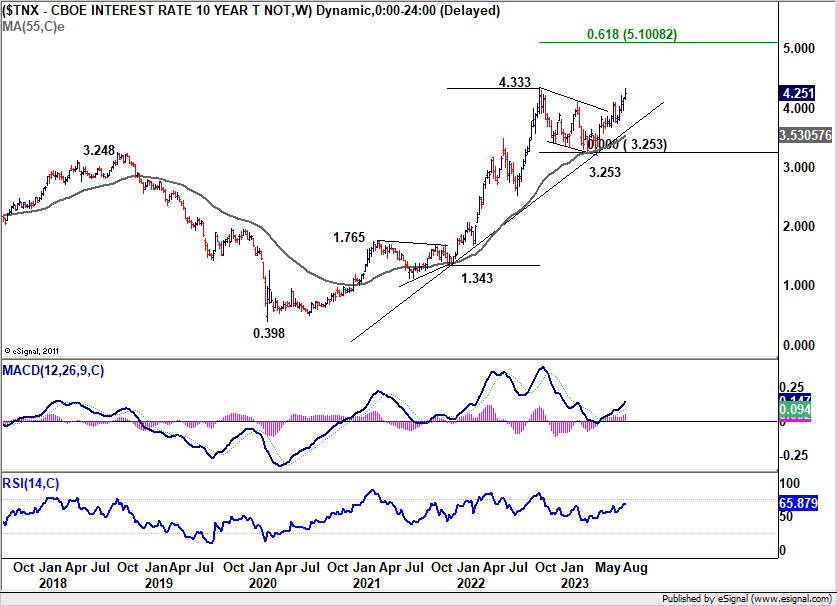
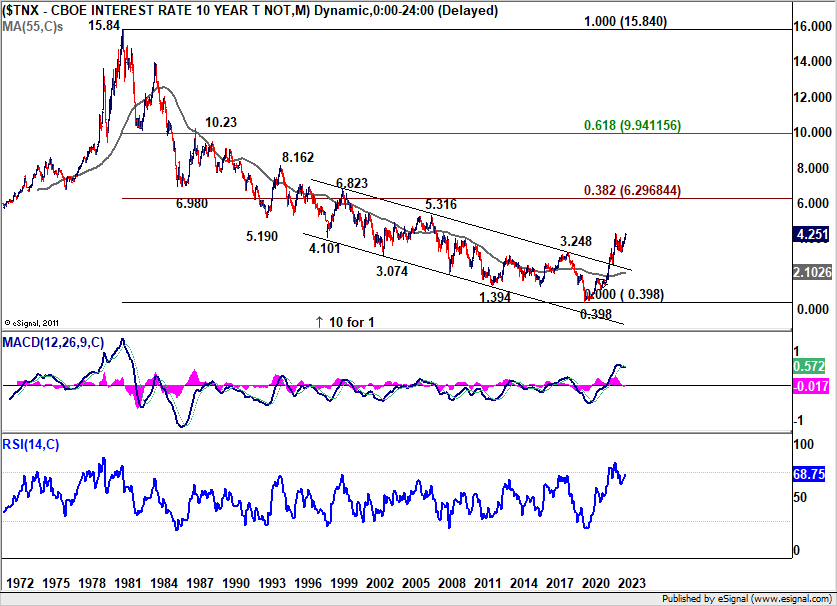
Last week, the financial markets witnessed significant shifts, with US treasury yields surging and stocks undergoing a sharp selloff. 30-year US Treasury bond yield rocketed to its loftiest since 2011, while 10-year yield was nudging levels at 2022 high, which was last observed in 2007.
Driving this dynamic was the mounting belief that interest rates in prominent economies are poised to remain elevated for a prolonged period. US macroeconomic indicators throughout the summer seemingly validate a resilient economy, with concerns about Fed's unresolved battle against inflation. This perspective gained traction, especially after FOMC's July meeting minutes revealed a majority of participants sensing pronounced "upside risks to inflation."
10-year yield touched 4.328 before retracting a bit, concluding at 4.251. While short-term consolidations seem likely with TNX contesting 4.333 high, outlook will stay bullish, as long as 3.957 support remains intact. Decisive break of 4.333 would mark resumption of the long-term uptrend from 2020's 0.398 low, with sights set on the 5% handle and above.
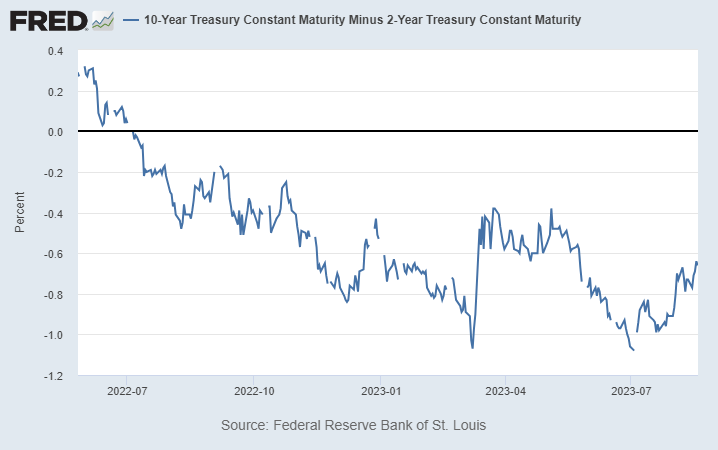
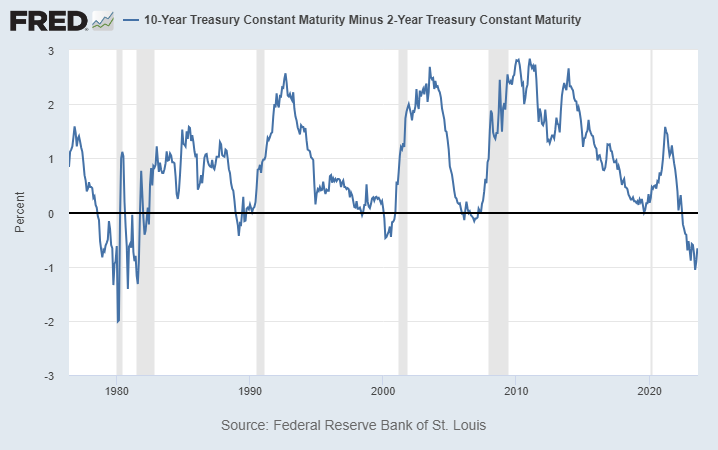
Another noteworthy development was the further normalization of the 2- to 10-year yield curve. Historically, US recessions have typically trailed a complete normalization by a few months. While not immediately alarming, if the yield difference between 2- and 10-year bonds shrinks beneath 0.4%, a crash in risk sentiment could be more imminent.
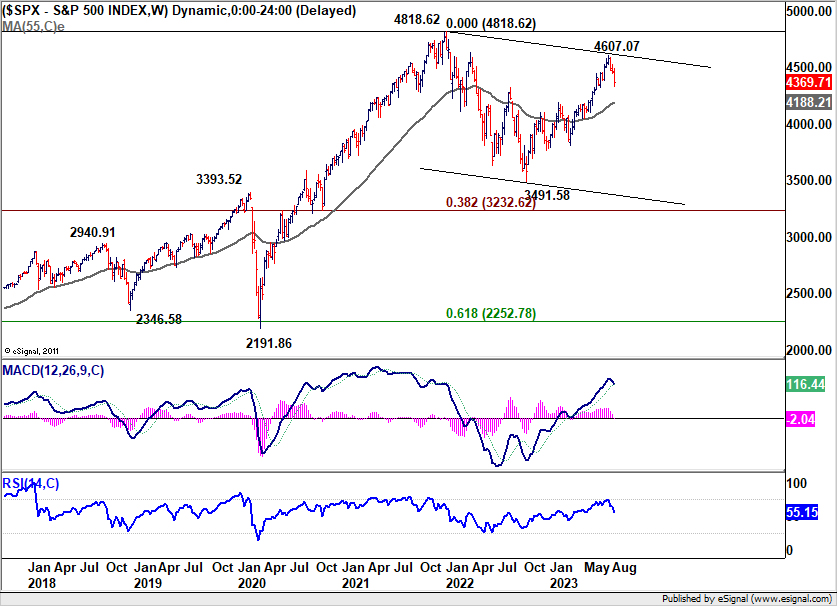
On the equities front, S&P 500's marked break of 55 D EMA, (now at 4414.93), suggests it's already correcting the whole up trend from 3491.58 (2022 low) at least. Further decline is now expected as long as 4443.98 support turned resistance holds, to 38.2% retracement of 3491.58 to 4607.07 at 4180.95.
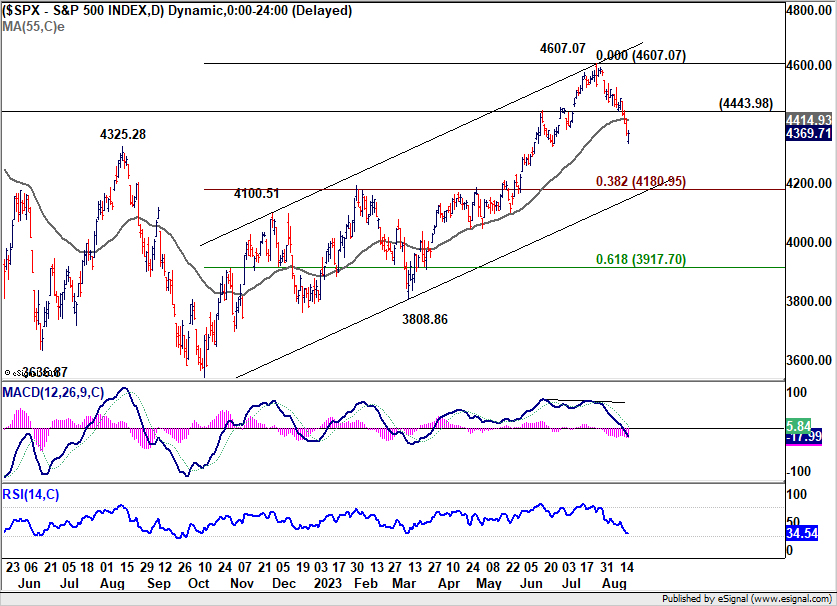
It's also possible that the fall from 4067.07 is indeed the third leg of the pattern from 4818.62 (2022 high). Sustained break of 55 W EMA (now at 4188.21, and close to above mentioned 4180.94 retracement level), will bolster this bearish case and confirm medium term reversal for 3491.58 support again .
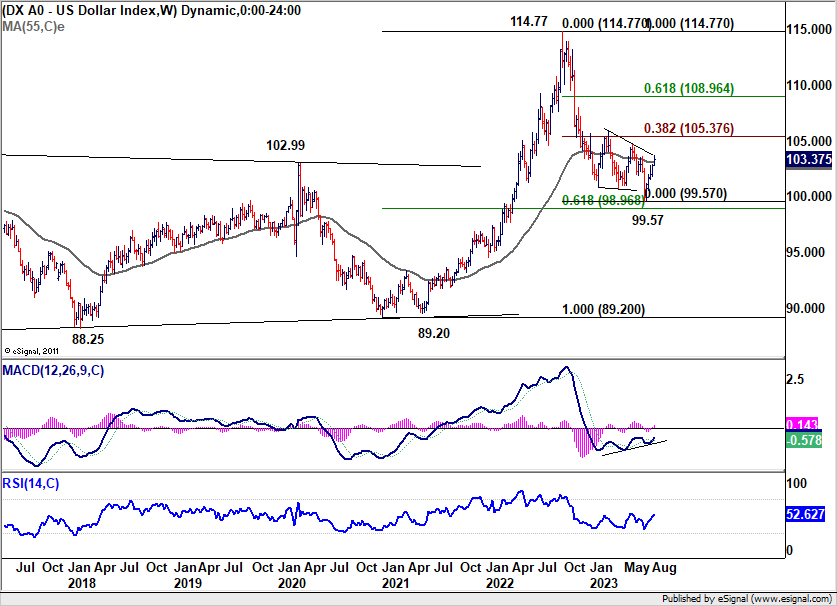
Dollar index's rebound from 99.57 continued last week. While the close above 55 W EMA was a positive, momentum remains unconvincing. This rebound is still viewed as a corrective move for now. Nonetheless, further rally is in favor as long as 101.78 support holds, towards 38.2% retracement of 114.77 to 99.57 at 105.37.
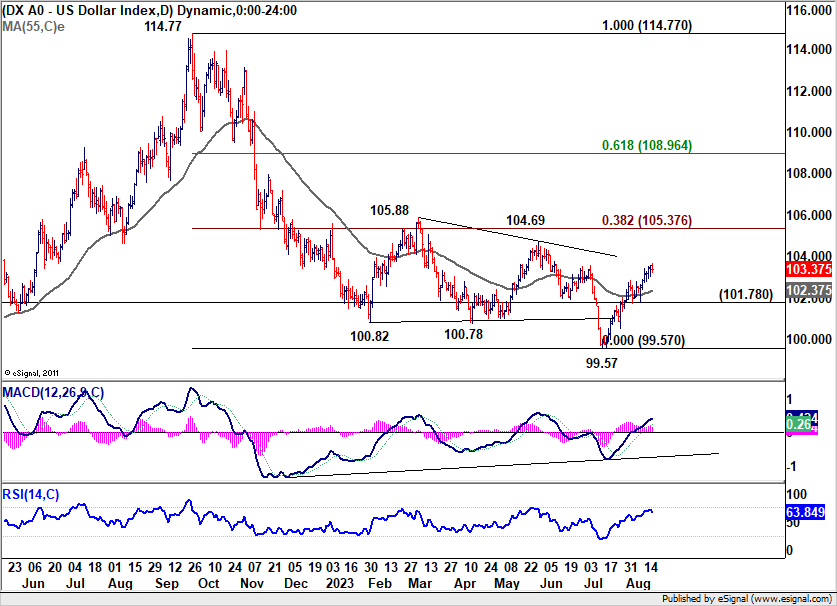
As for the rally to be reversing the down trend from 114.77, rather than correcting it, decisive break of 10-year yield above 4.333 high seems not enough. The strength in benchmark yields in UK and Germany indicated that it's a common development in major economies. Substantial risk aversion would need to be the trigger, like S&P 500 breaking through above mentioned 4180.95 decisively.
China's Economic Concerns Deepen: Echoes Felt in Global Equity Markets
Investor confidence in China's economic trajectory has taken a significant hit in the past few weeks. An onslaught of unfavorable news, encompassing bleak economic figures and corporate financial strains, is eroding assurance among stakeholders. Notably, the shadow banking behemoth Zhongzhi halted payments to a vast number of its customers. Country Garden , a prominent property firm, is teetering on the brink of a public bond default. Adding to the list, the troubled property conglomerate Evergrande has opted for bankruptcy protection.
The reverberations of these setbacks are evident on the trading floors, with equity benchmarks in both Hong Kong and mainland China plunging to their lowest since last November. This downturn in sentiment is expected to ripple through global markets due to China's extensive economic entanglements worldwide, at least until measures to "de-risk" by other countries and regions are wholly actualized.
Hong Kong HSI tumbled through 18044.85 support last week to resume the whole decline from 22700.85. Deeper fall is now expected to 61.8% projection of 22700.85 to 18044.85 from 20361.02 at 17483.61 next. Strong rebound from there would keep the fall from 22700.85 as a corrective move.
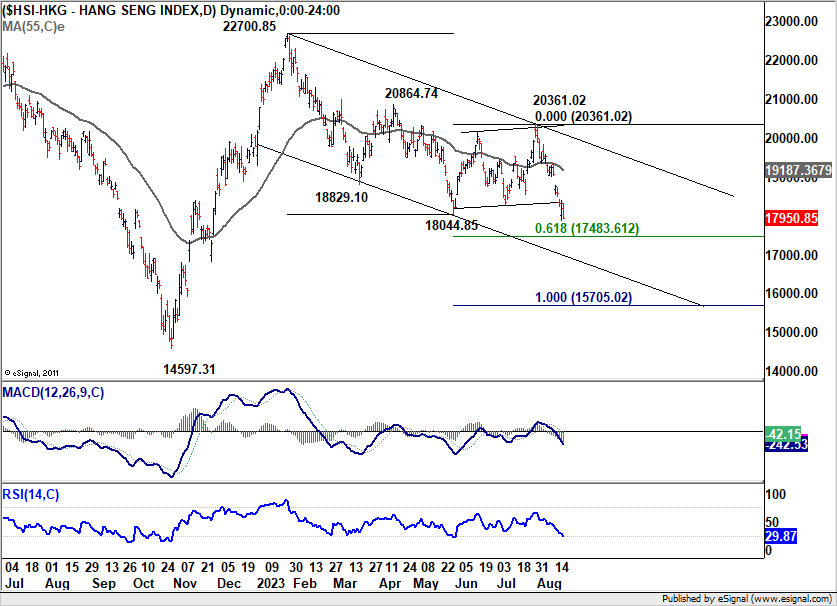
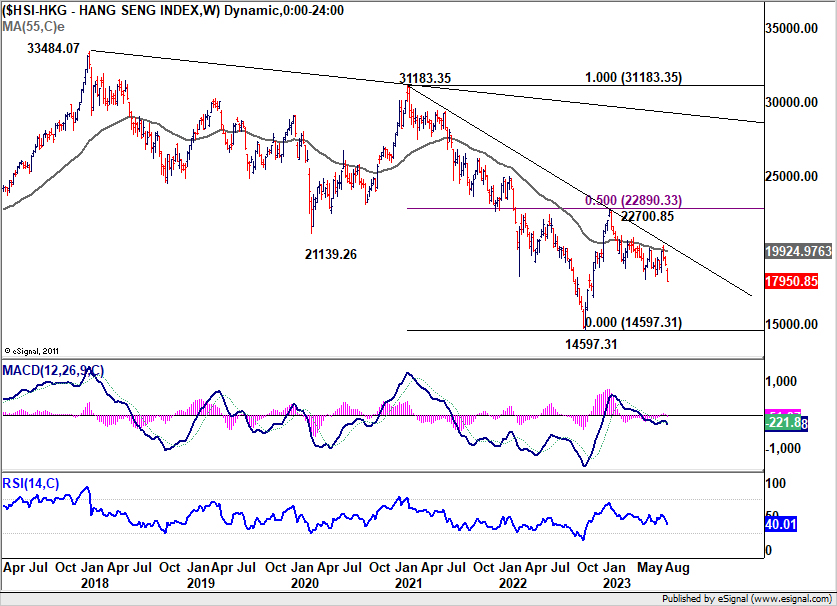
However, decisive break there of 17483.61 could prompt downside acceleration to 100% projection at 15705.02. More importantly, give prior rejection by 55 W EMA (now at 19924.97), this development will raise the chance that HSI is trying to resume the whole down trend from 33484.07 (2018 high), and risk deeper fall through 14597.31 low. Should this grim scenario materialize, it would be a glaring red flag for China's economic landscape, and the repercussions could be felt far beyond its borders.
Offshore Yuan plunges amid Dollar strength: What's next?
Amid the turmoil in China and PBoC's rate cut, offshore Chinese Yuan has plummeted to its lowest in nine months. Signs of stabilization emerged only after China's proactive interventions, aimed at stemming further decline, as the currency neared its 2022 low. Yet, market watchers are grappling with two crucial uncertainties.
First, there remains ambiguity around China's strategic intent — whether Beijing is taking steps to establish a "floor" for Yuan at this juncture or merely attempting to decelerate its descent. The second, and perhaps more pressing, dilemma revolves around the interplay between currencies. While China's ability to curtail Yuan's weakness remains a topic of debate, its capacity to restrain a surging Dollar is undeniably limited. Heightened risk aversion in the US could push Dollar further up, exerting additional pressure on Yuan. This, in turn, might amplify disruptions in China's financial landscape, then spill over across global markets.
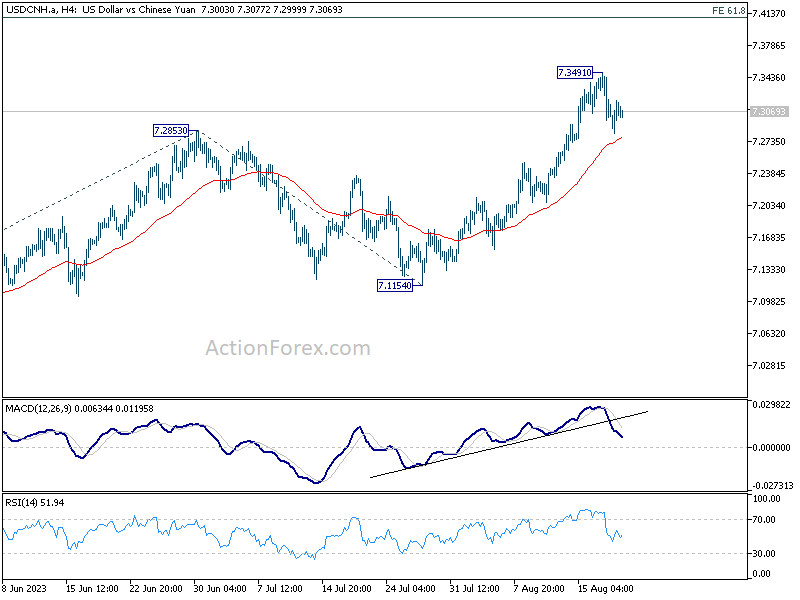
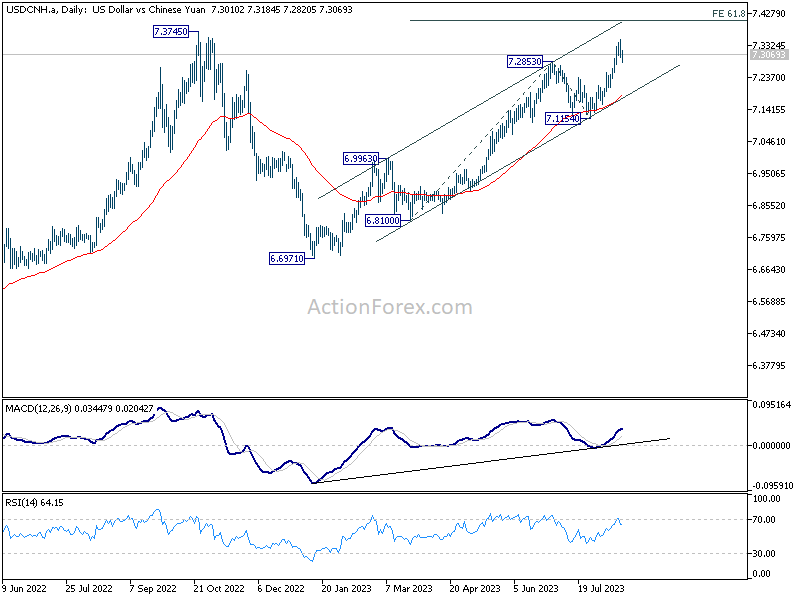
In the immediate term, further rise is still in favor in USD/CNH as long as 55 4H EMA (now at 7.2766) holds. Next target is 61.8% projection of 6.8100 to 7.2853 from 7.1154 at 7.401. Firm break of 55 4H EMA will bring deeper pull back first before setting out the next move.
GBP/AUD broke long term trend line as rally accelerates
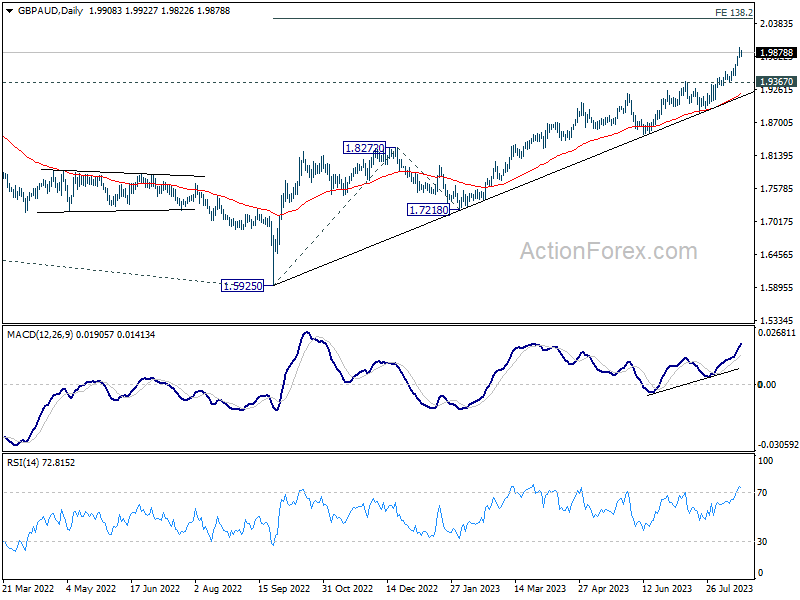
GBP/AUD emerged as the top performer last week, registering 1.72% gain. This momentum is attributed to a combination of factors. In the UK, unprecedented wage growth points towards persistent inflationary pressures. With this backdrop, BoE would need to continuing rat hikes, by 25 bps in September and possibly once more in November, culminating their current tightening cycle. Conversely, Australia's disappointing employment figures have cemented RBA stance to maintain rates at 4.10%. The situation is further exacerbated for Aussie due to uncertainties in the Chinese economy.
From a near term point of view, GBP/AUD's outlook will stay bullish as long as 1.9367 support holds, next target is 138.2% projection of 1.5925 to 1.8272 from 1.7218 at 2.0406.
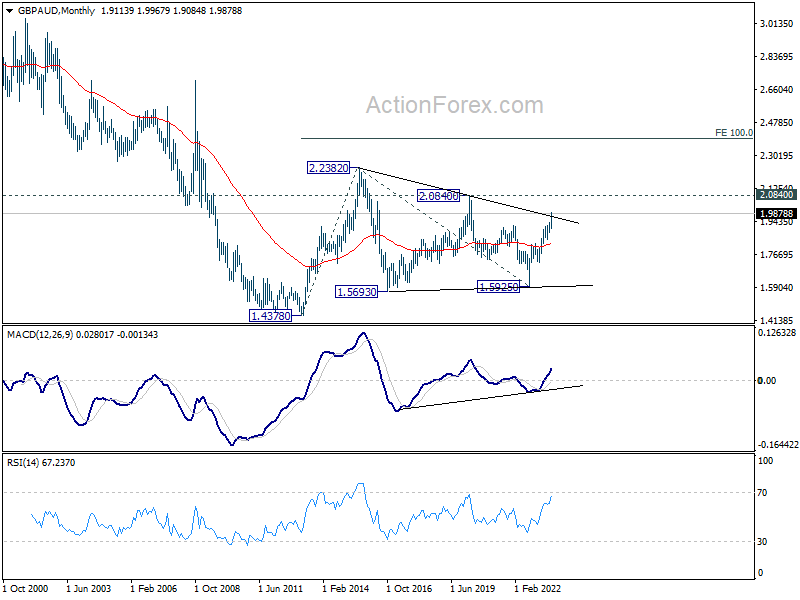
But more important, last week's break of the long term trend line as seen in the monthly chart carries some significance. The consolidation pattern from 2.2382 (2015 high) could have completed with three waves to 1.5925 (2022 low). Decisive break of 2.0840 would affirm this case and set the stage for further rise through 2.2382. If that's true, we'd be looking at 100% projection of 1.4378 to 2.2382 from 1.5925 at 2.3929 as the target. In other words, GBP/AUD is less than half way through the trend at current rate, and the rally may still have considerable ground to cover.
USD/CAD Weekly Outlook
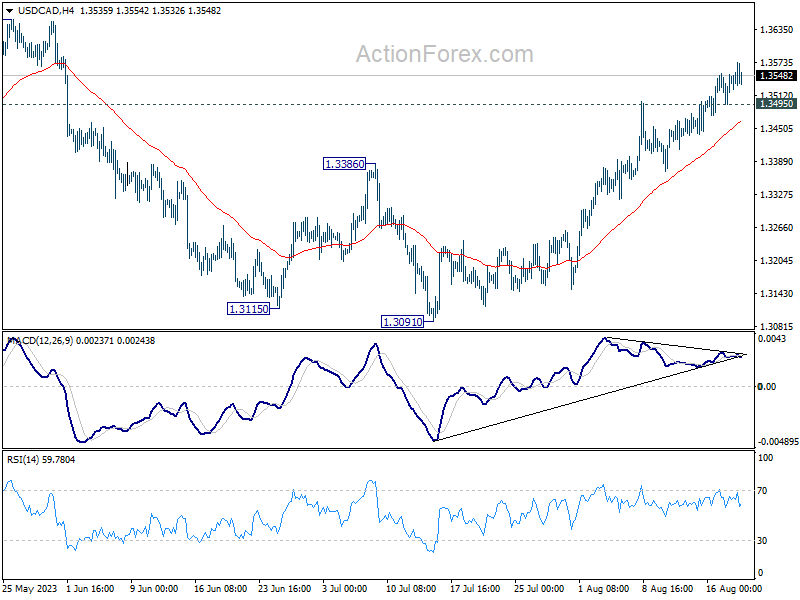
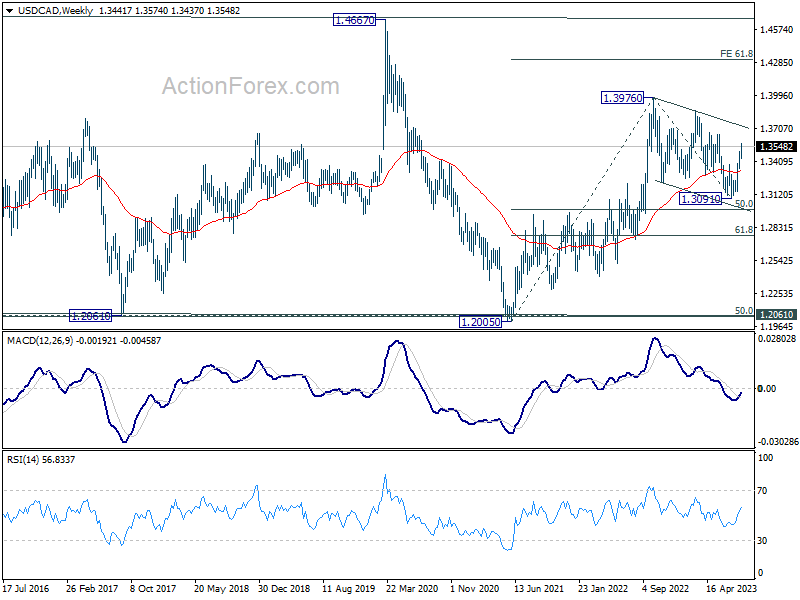
USD/CAD's rally from 1.3091 continued last week and hit as high as 1.3574. Initial bias stays on the upside this week for retesting 1.3653 resistance. Decisive break there will confirm that correction from 1.3976 has completed, a target a test on this high. On the downside, below 1.3495 minor support will turn intraday bias neutral and bring consolidations first, before staging another rise.
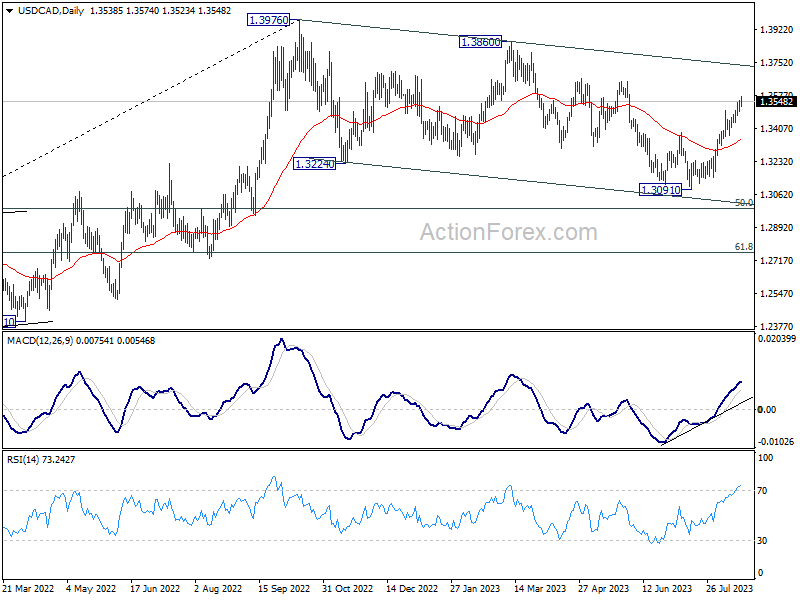
In the bigger picture, price actions from 1.3976 are viewed as a corrective fall only. Upon completion, rise from 1.2005 (2021 low) would resume through 1.3976. Next target is 61.8% projection of 1.2005 to 1.3976 from 1.3091 at 1.4309. In case of another fall, downside should be contained by 61.8% retracement of 1.2005 to 1.3976 at 1.2758.
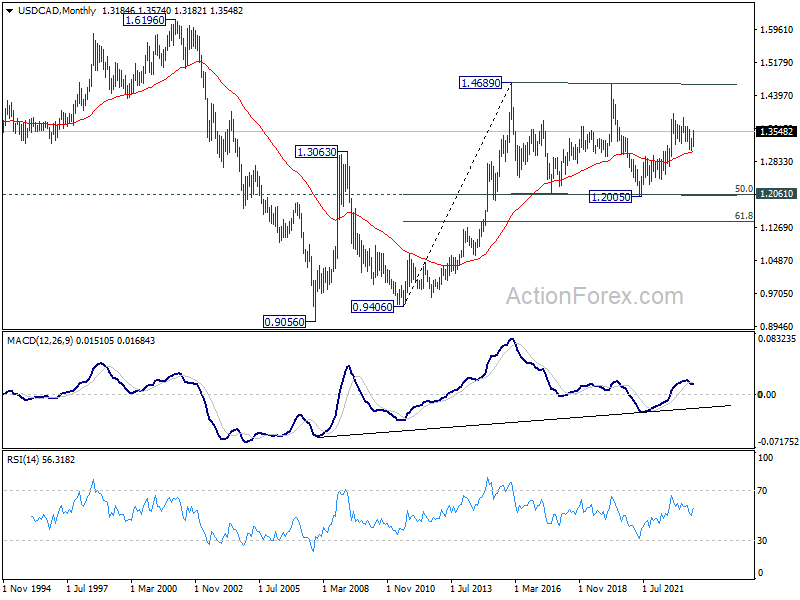
In the longer term picture, price actions from 1.4689 (2016 high) are seen as a consolidation pattern only, which might have completed at 1.2005. That is, up trend from 0.9506 (2007 low) is expected to resume at a later stage. This will remain the favored case as 55 M EMA (now at 1.3044) holds.
EUR/USD Weekly Outlook
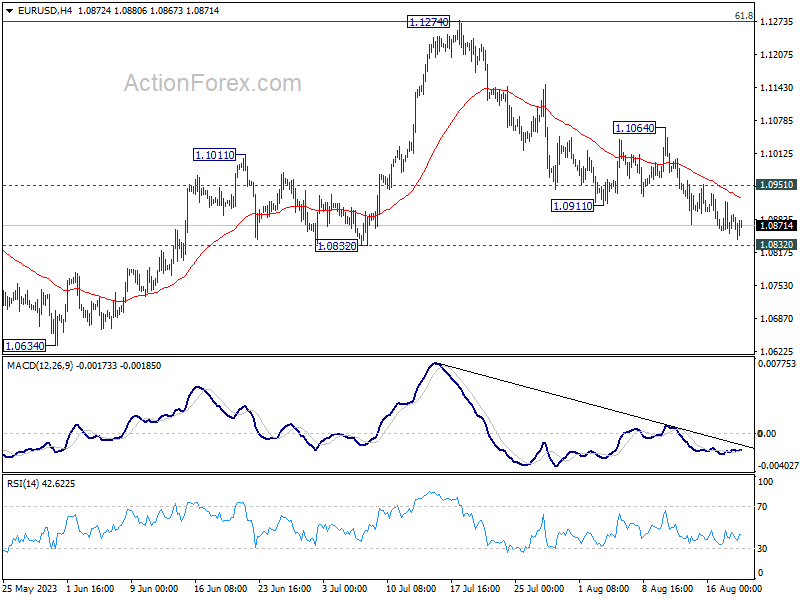
EUR/USD's decline from 1.1274 extended lower last week and there is no sign of bottoming yet. Initial bias stays on the downside this week. Decisive break of 1.0832 support will target 1.0609/34 cluster support next. On the upside, above 1.0951 minor resistance will turn intraday bias neutral first. But risk will stay on the downside as long as 1.1064 resistance holds, in case of rebound.
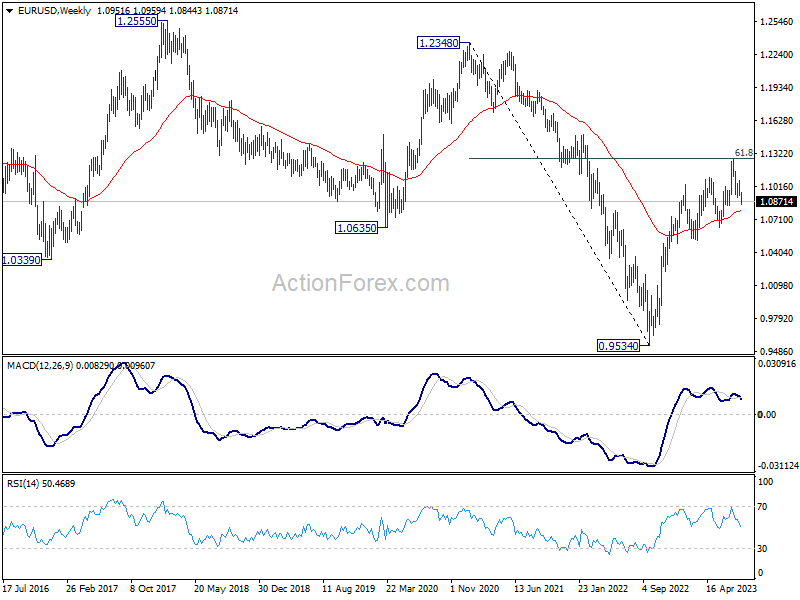
In the bigger picture, a medium term top should be formed at 1.1274, after failing to break through 61.8% retracement of 1.2348 (2021 high) to 0.9534 at 1.1273 decisively, on bearish divergence condition in D MACD. Fall from there is seen as a correction to the uptrend from 0.9534 (2022 low). Deeper decline would be seen to 1.0634 cluster support (38.2% retracement of 0.9534 to 1.1274 at 1.0609). Strong support could be seen there, at least on first attempt, to set the range for consolidation. Yet, medium term outlook will be neutral for now, as long as 1.1274 resistance holds.
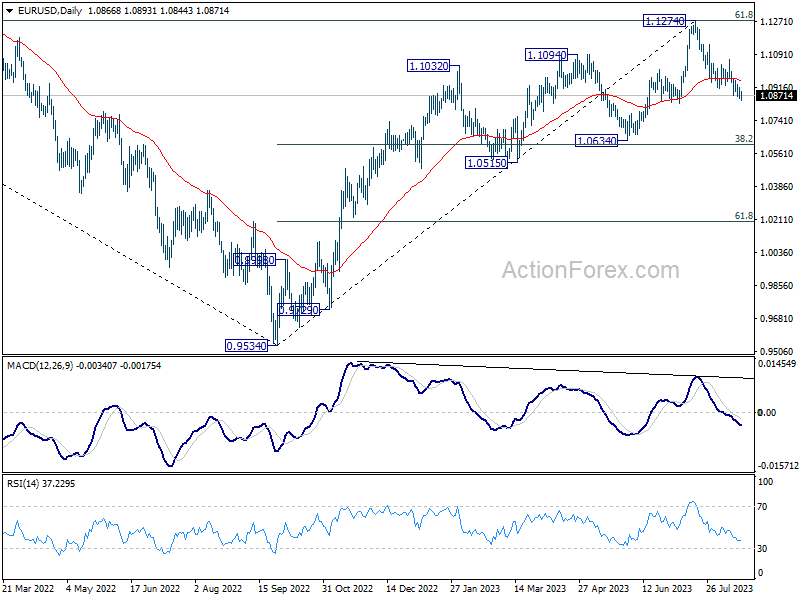
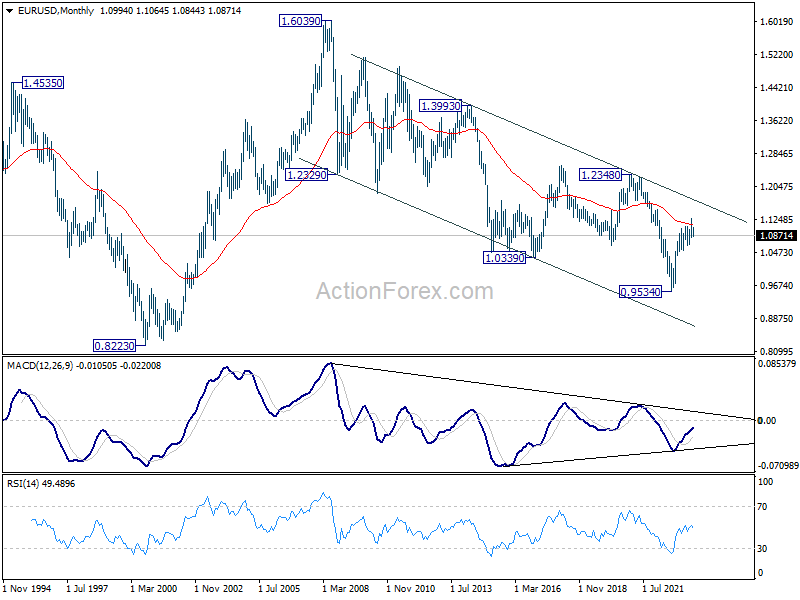
In the long term picture, focus stays on 55 M EMA (now at 1.1136). Rejection by this EMA will revive long term bearishness. However, sustained break above here will be affirm the case of long term bullish reversal and target 1.2348 resistance for confirmation.