Sample Category Title
Gold Price Updates Minimum of the Year Against the Background of Rising Yields of US Govt Bonds
Treasury yields are rising, especially for long-term periods. For example, the yield on 10-year bonds today is 4.28%, and a month ago it was 3.88%, a year ago, 3.02%. Barron's writes that yields may continue to rise amid sustained inflation.
Rising US government bond yields are attracting investors who are diversifying their portfolios by moving capital away from the gold and equity markets, which is having a bearish effect on them.
So, according to information from MarketWatch, August could be the worst month in 2023 for the S&P 500 index precisely because of rising bond yields.
And according to Bloomberg, at the end of last week, the assets of exchange-traded funds (ETFs) investing in gold approached the level of 2.8 thousand tons, having updated the minimum since March 30, 2020.
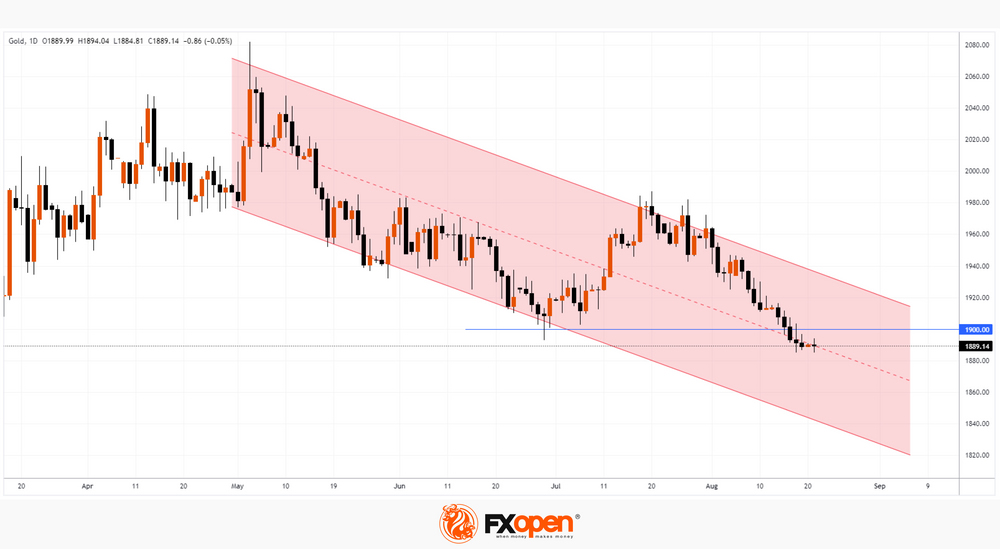
Today, as the chart shows, the price of gold has updated the minimum of the year.
Bearish arguments:
→ The price dynamics is developing within the bearish channel, which has been in effect since May.
→ The price has consolidated below the psychological level of 1900 dollars per ounce, from which we can now expect resistance to the price increase.
Bullish arguments:
→ The market is oversold, as evidenced by the daily RSI indicator. Therefore, the probability of a bullish correction increases.
This week, the BRICS summit and the Jackson Hole conference will take place, the news from which can have a significant impact on the price of gold.
And according to MarketWatch, August could be the worst month in 2023 for the S&P 500 precisely because of rising bond yields.
This article represents the opinion of the Companies operating under the FXOpen brand only. It is not to be construed as an offer, solicitation, or recommendation with respect to products and services provided by the Companies operating under the FXOpen brand, nor is it to be considered financial advice.
Crypto Market Fallen Victim to Safe-Haven Demand
Market picture
The financial markets have been under pressure due to the trend of moving out of risky assets as government bond yields rose. Cryptocurrencies seemed to be immune to this trend for a while, but last week, there was a switch to a sell-off mode amid rising US Treasury yields to 16-year highs and fears about China’s debt problems.
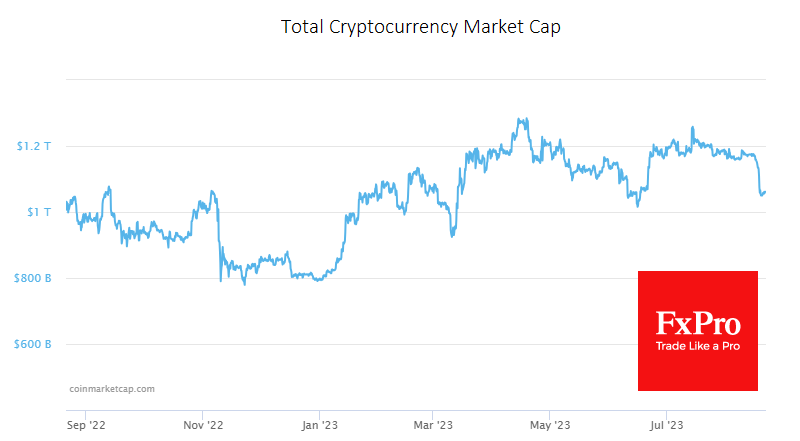
Crypto market capitalisation fell 9.7% last week to stabilise at $1.058 trillion, finding buyers on dips below $1.05 trillion. Technically, the market is still above the previous local lows of June, giving hope for a continued uptrend. However, it is worrying that July’s highs are lower than April’s.
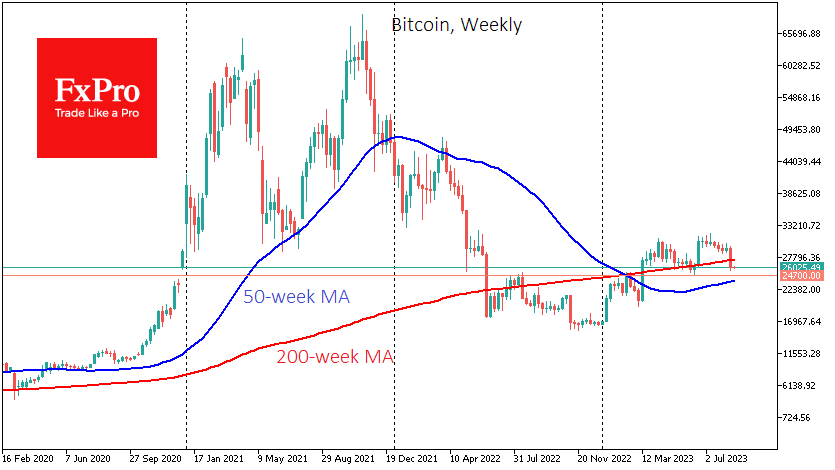
Bitcoin closed the week with a notable drop below its 200-week and 200-day moving averages, signalling a shift to a bearish trend. From current levels near $26.0K, the following area of decline appears to be the last pivot area at $24.7K.
News background
According to JPMorgan, Bitcoin miners are exploring new lines of business ahead of the halving. According to the bank, miners could find it lucrative to provide computing services in the fast-growing artificial intelligence market.
The US Securities and Exchange Commission (SEC) is ready to approve the first applications for Ethereum futures ETFs in October, Bloomberg reported, citing sources. The SEC is now reviewing 11 applications to launch such ETFs.
Payments giant Mastercard has launched a CBDC innovation research partner programme with companies in the blockchain industry, including Ripple, ConsenSys and Fireblocks. Mastercard notes that 93% of the world’s central banks are experimenting with digital currency, and four retail CBDCs are already in circulation.
EURUSD Turns Up; Short-Term Outlook Still Cloudy
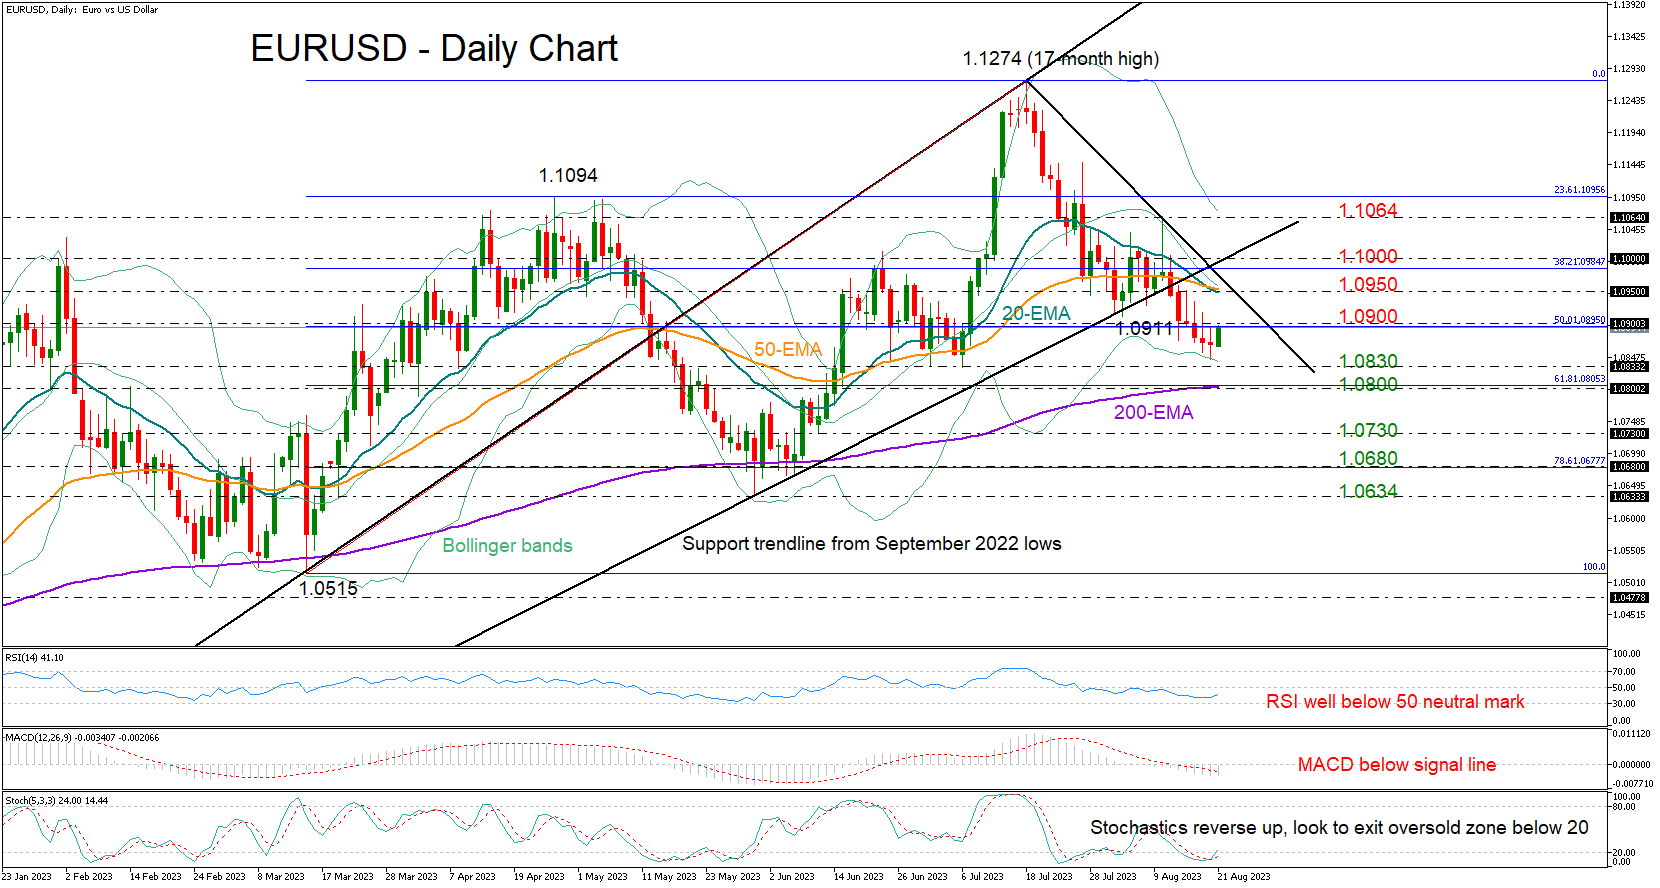
EURUSD opened moderately higher on Monday after almost touching the 1.0830 support area, which sparked the exciting rally to a 17-month high of 1.1275 last month.
The pair experienced five negative weeks in a row, retreating below the trendline that connects the lows from September 2022 and below its 20- and 50-day exponential moving averages (EMAs).
The recent small red candlesticks and an oversold stochastic oscillator suggest that selling pressure is dwindling. Also, the price bounced off the lower Bollinger band last Friday, making an upside correction possible in the coming sessions. That said, the RSI hasn’t touched its 30 oversold level, and the MACD remains negatively charged below its red signal line, suggesting that downside risks are still intact.
The 1.0900 level is currently acting as resistance, while slightly higher, the 1.0950 area, which encapsulates the 20- and 50-day EMAs and the tentative descending trendline from July’s top, could be a bigger hurdle. A decisive close above the latter could battle the broken support trendline around the 1.1000 psychological mark, a break of which is required to boost buying confidence and lift the price straight to August’s high of 1.1064. Then the focus could turn to the 1.1100 mark.
A downside reversal could get congested somewhere between 1.0830 and 1.0800. The 200-day EMA could cement that floor. If the bears breach the latter too, the sell-off could exacerbate towards the 1.0730 constraining zone, while lower, the price may stabilize within the crucial 1.0680-1.0635 area.
In brief, EURUSD seems to be looking for a rebound, but the cloudy short-term outlook may not change unless the pair successfully returns above 1.1000.
UK PMI Surveys on the Agenda But Focus Will be Across the Pond
With the market anxiously expecting this week’s Jackson Hole gathering, on Wednesday we will get the preliminary UK PMI survey results for August. As the pound remains one of the market’s favorites, a positive surprise at this week’s data releases could quickly reignite the BoE’s rate hike expectations and allow the euro/pound pair to record a new 2023 low.
BoE's next steps
Contrary to the Fed, the BoE is still trying to bring inflation under control in the UK. Despite the recent easing recorded, from the double-digit CPI level last seen in March 2023, both the headline and core inflation indicators remain extremely elevated when considering the 500bps of cumulative rate hikes announced since February 2022. The BoE’s own projections have inflation dropping to their target at the two-year horizon, but the recent oil price action is complicating both the short- and medium-term picture. This development could eventually cancel out the strong expectations for a continued inflation easing globally during the remainder of 2023.
In the meantime, the BoE is facing a double-edged sword regarding earnings growth. On the one hand, strong household earnings are extremely helpful amidst the current cost-of-life crisis, supporting consumer spending, and thus somewhat boosting the anemic growth outlook. Friday’s GfK consumer confidence is unlikely to show a significant improvement, but it will remain comfortably above its mid-2022 lows.
On the other hand, there is an increasing and credible risk of second and third round effects manifesting as the higher inflation rate could become part of the public’s mindset. The latter is mentioned in the August 3 meeting’s minutes revealing a real worry from certain BoE members. This could also explain why two BoE members voted for a 50bps rate move at the last meeting, with the 25bps decision reached by a majority vote.
A busy week has just started
The Rightmove house price index showed a -0.1% year-on-year growth, confirming other house price indices, and thus depicting the continued weakness seen in this sector, which is unlikely to abate any time soon considering the current BoE rate’s outlook. The main dish of the week will come on Wednesday with the release of the preliminary figures of the Manufacturing and Services PMI surveys. The former has been a source of concern globally as it remains stuck well below its 50-midpoint in most regions.
In the UK, the Manufacturing PMI survey has been on an acute downward trend since the June 2021 high. It is now preparing to complete a 12-month period of sub-50 prints since Wednesday’s figure is expected to record another small drop to 45 from 45.3 in July. On the flip side, the Services’ PMI survey figures have globally been more positive but the same cannot be said for the UK. The July print came at 51.5, showing an expanding sector, but its recent trend has been negative and thus increasing concerns that the remainder of 2023 could be an even weaker growth period.
Euro/pound ready for a new 2023 low?
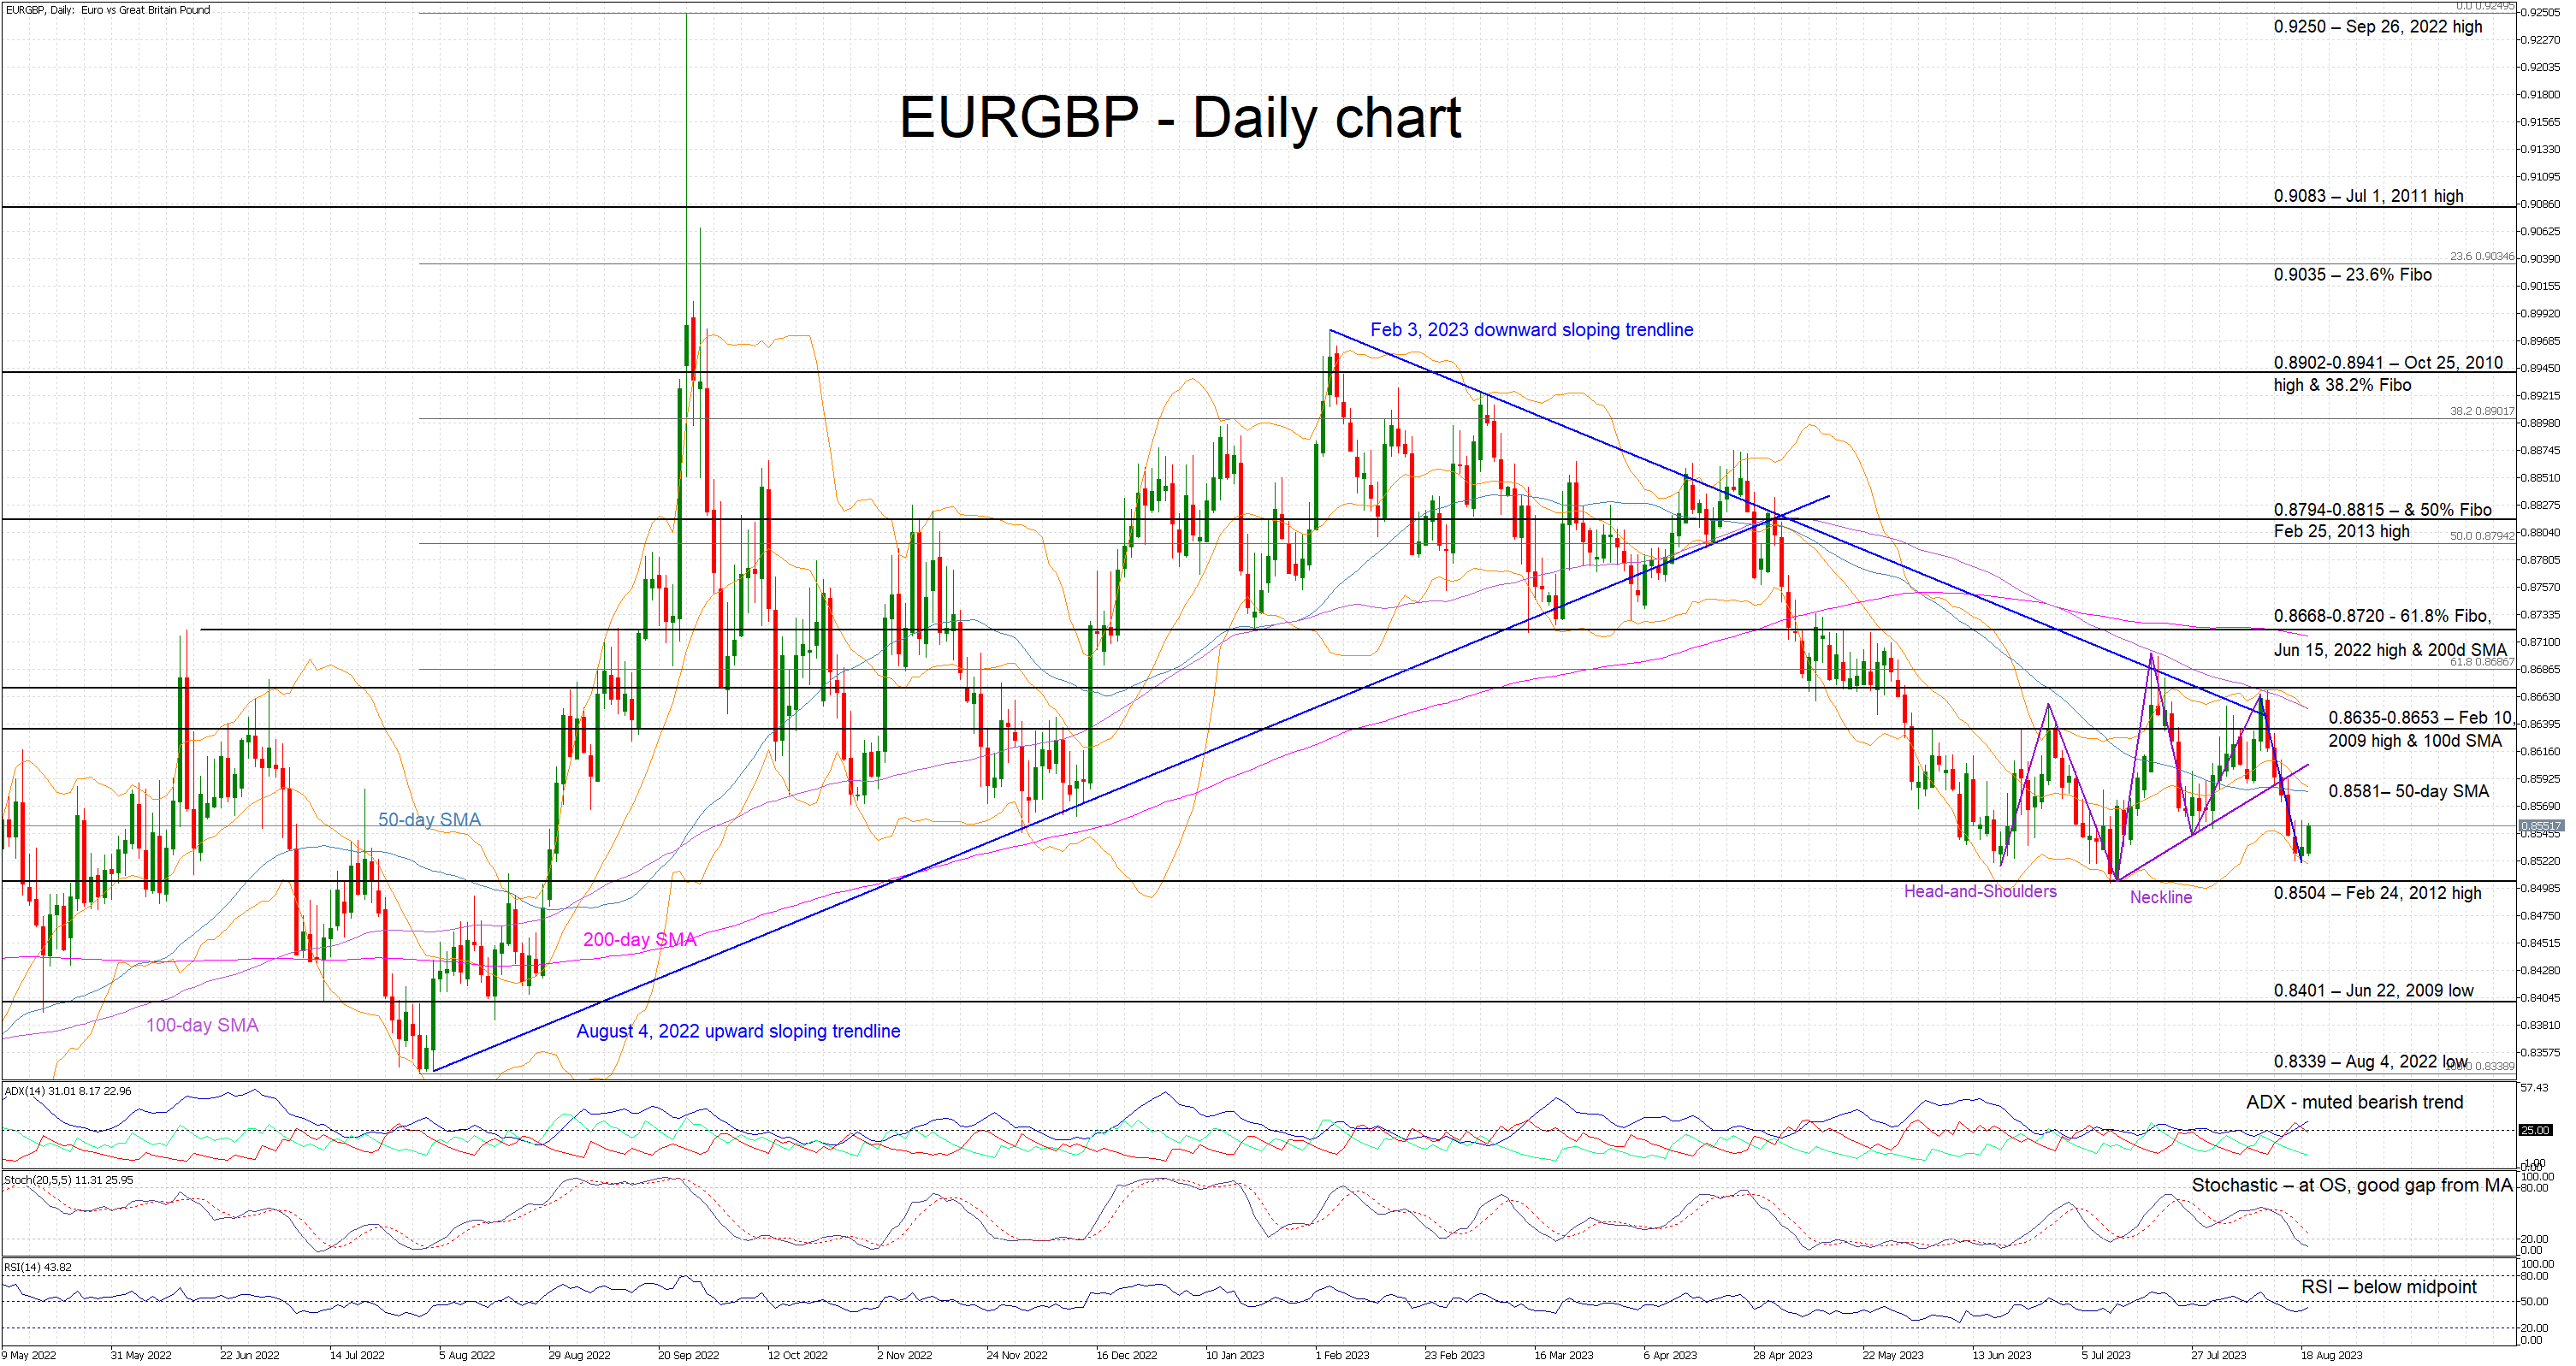
Despite the more hesitant BoE and the mixed data releases, the pound continued to exhibit significant strength against the euro. The overall technical picture appears to still favour the pound, especially considering the developing heads and shoulders structure. Therefore, a good set of PMI survey results on Wednesday morning could prove the boost needed for the euro/pound pair to record a new 2023 low, below the current 0.8503 low.
Gold Drops to Fresh 5-Month Low
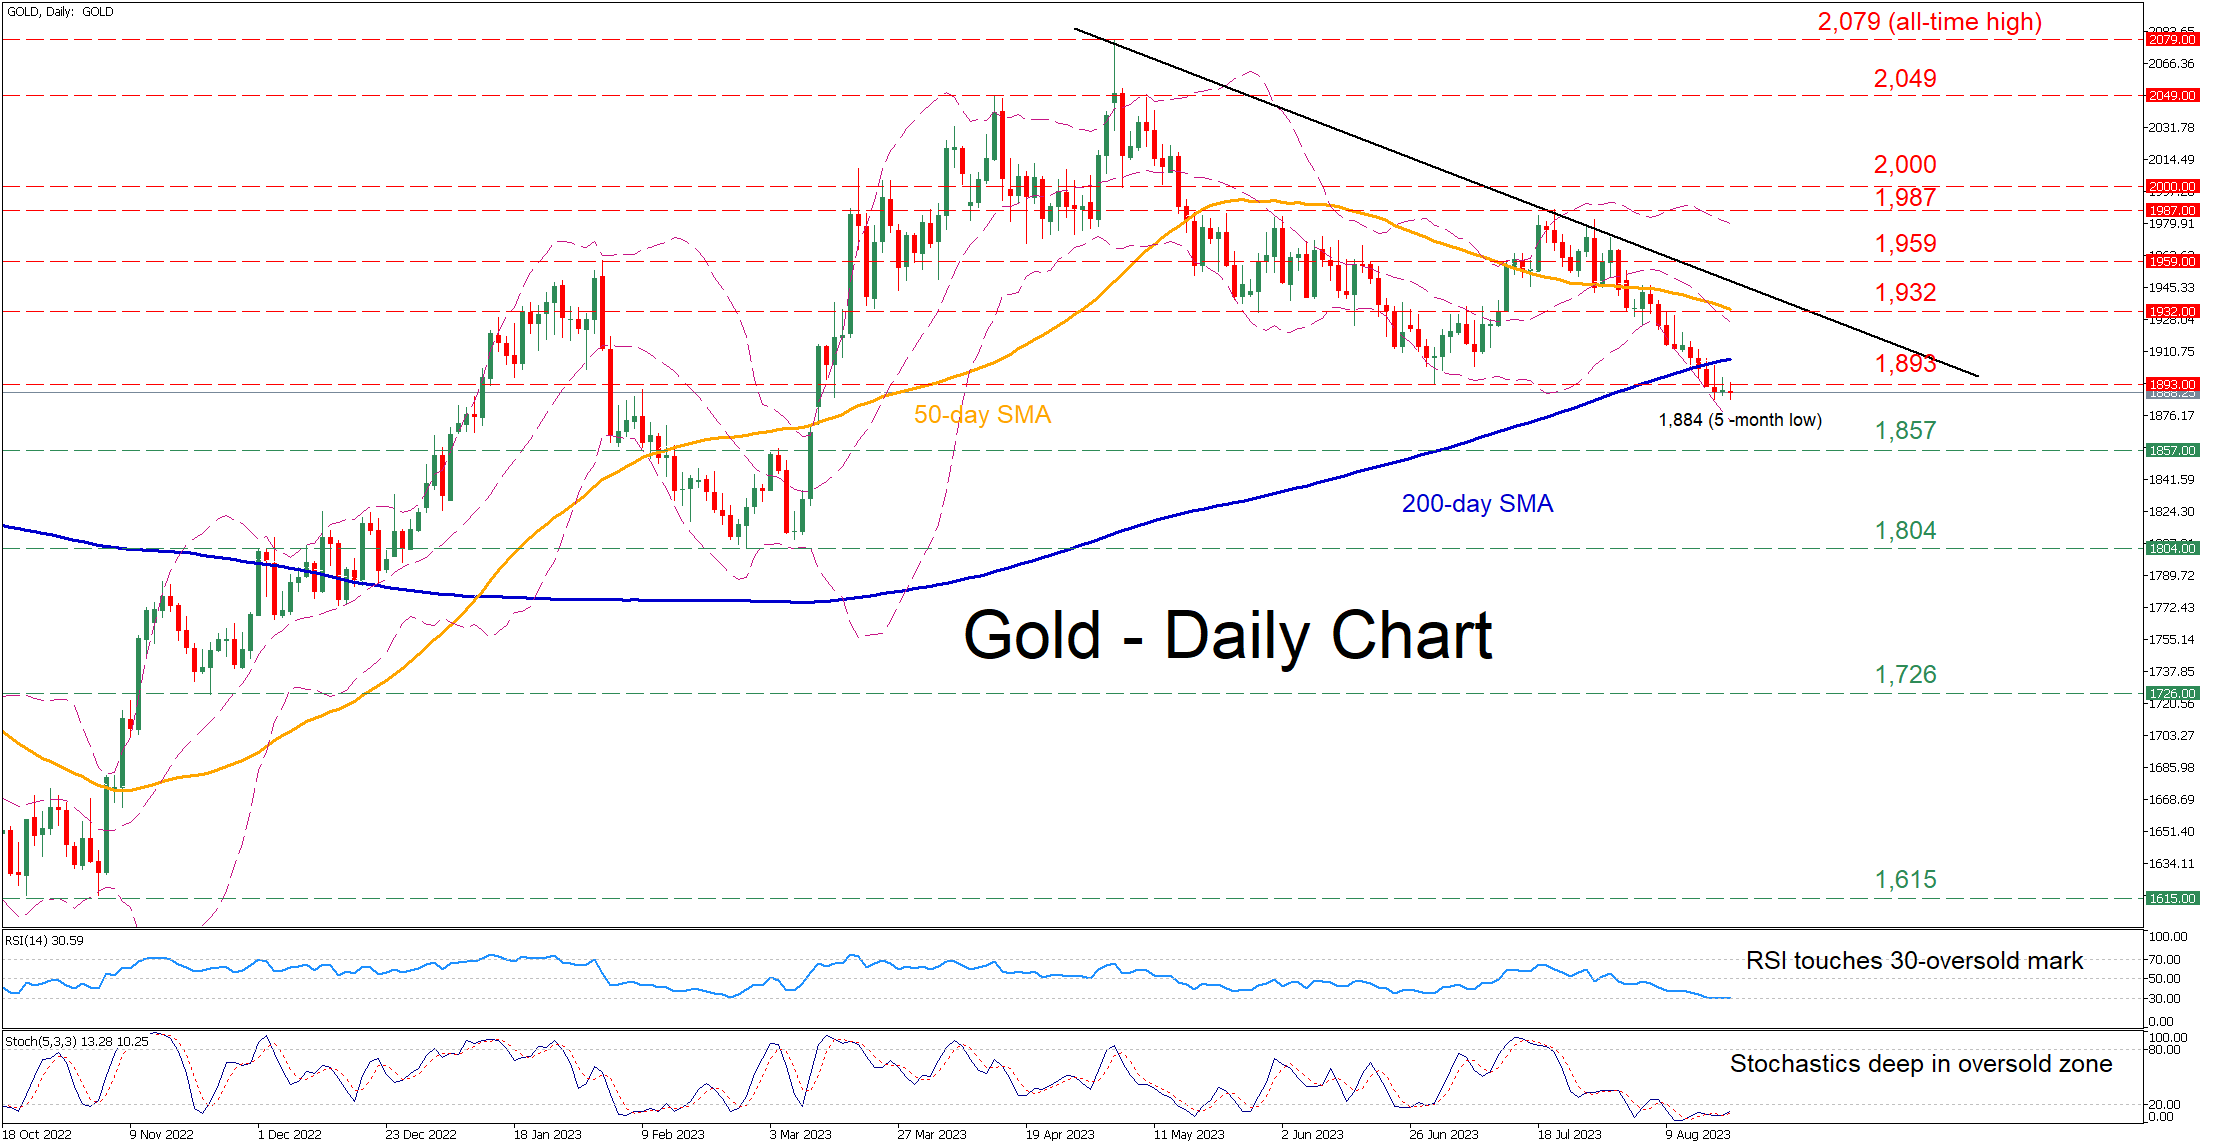
Gold had been experiencing a strong pullback following its recent peak at 1,987, with the price slicing through both its 50- and 200-day simple moving averages (SMAs). Moreover, in today’s session, bullion fell to a fresh five-month bottom as the bulls seem to be staying on the sidelines.
The momentum indicators suggest that the recent decline might be overstretched. Specifically, the RSI is battling with its 30-oversold mark, while the stochastic oscillator has been hovering within its oversold territory for the last 13 days.
If the price manages to stage a comeback, the bulls could initially target the June low of 1,893 ahead of the 1,932 support, which overlaps with the 50-day SMA. Surpassing the latter, gold may ascend to challenge the February high of 1,959. Even higher, the July peak of 1,987 might curb further advances.
On the flipside, should the retreat extend, the March resistance of 1,857 could act as the first line of defense. A violation of that zone could open the door for the 2023 bottom of 1,804. Should that barricade also fail, the spotlight could turn to the November 2022 support of 1,726.
In brief, gold has been undergoing a downside correction, failing to recover some ground despite reaching oversold conditions. Looking forward, bullion’s failure to reclaim the 200-day SMA could induce more downside pressures.
GBP/USD Consolidates While EUR/GBP Takes Hit
GBP/USD is attempting a recovery wave above the 1.2700 resistance. EUR/GBP declined heavily below the 0.8600 and 0.8565 support levels.
Important Takeaways for GBP/USD and EUR/GBP Analysis Today
- The British Pound is attempting a fresh increase above 1.2700.
- There is a key contracting triangle forming with resistance near 1.2740 on the hourly chart of GBP/USD at FXOpen.
- EUR/GBP is trading in a bearish zone below the 0.8565 pivot level.
- There is a major bearish trend line forming with resistance near 0.8545 on the hourly chart at FXOpen.
GBP/USD Technical Analysis
On the hourly chart of GBP/USD at FXOpen, the pair settled below the 1.2800 zone. As mentioned in the previous analysis, the British Pound turned red and extended losses below the 1.2700 pivot level against the US Dollar.
Finally, the pair tested the 1.2620 zone and recently started a recovery wave. There was a decent increase above the 1.2700 pivot level. The pair is now consolidating near the 50-hour simple moving average at 1.2740.
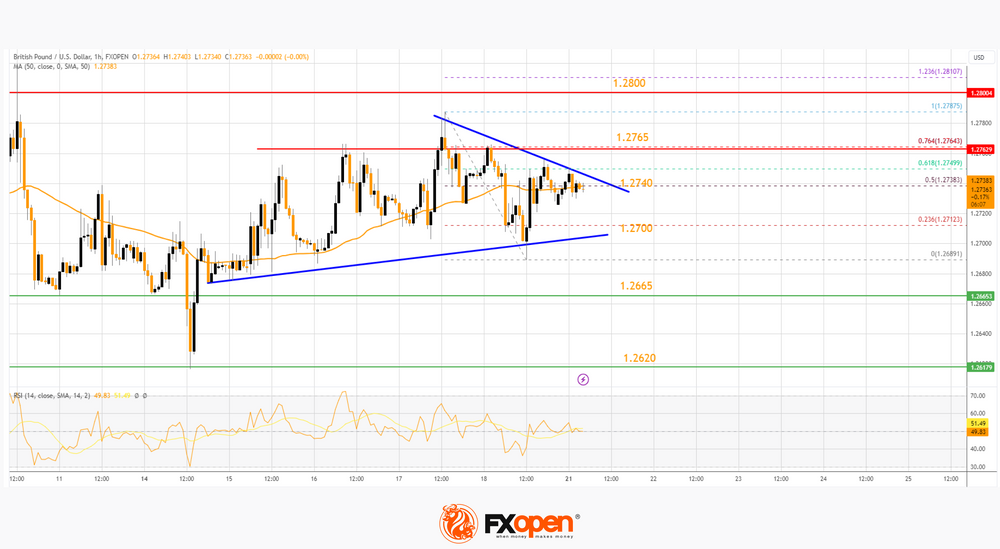
There is also a key contracting triangle forming with resistance near 1.2740. The triangle resistance coincides with the 50% Fib retracement level of the downward move from the 1.2787 swing high to the 1.2689 low.
On the upside, the GBP/USD chart indicates that the pair is facing resistance near 1.2740. The next major resistance is near the 76.4% Fib retracement level of the downward move from the 1.2787 swing high to the 1.2689 low at 1.2765.
A close above the 1.2765 resistance zone could open the doors for a move toward 1.2800. Any more gains might send GBP/USD toward 1.2880.
On the downside, there is a key support forming near 1.2700. If there is a downside break below 1.2700, the pair could accelerate lower. The next major support is near the 1.2665 zone, below which the pair could test 1.2620. Any more losses could lead the pair toward the 1.2550 support.
EUR/GBP Technical Analysis
On the hourly chart of EUR/GBP at FXOpen, the pair started a major decline from well above 0.8630. The Euro traded below the 0.8600 and 0.8565 support levels against the British Pound.
The EUR/GBP chart suggests that the pair even declined below the 0.8545 level and tested 0.8525. It is now consolidating losses and correcting higher above the 50-hour simple moving average and 0.8625.
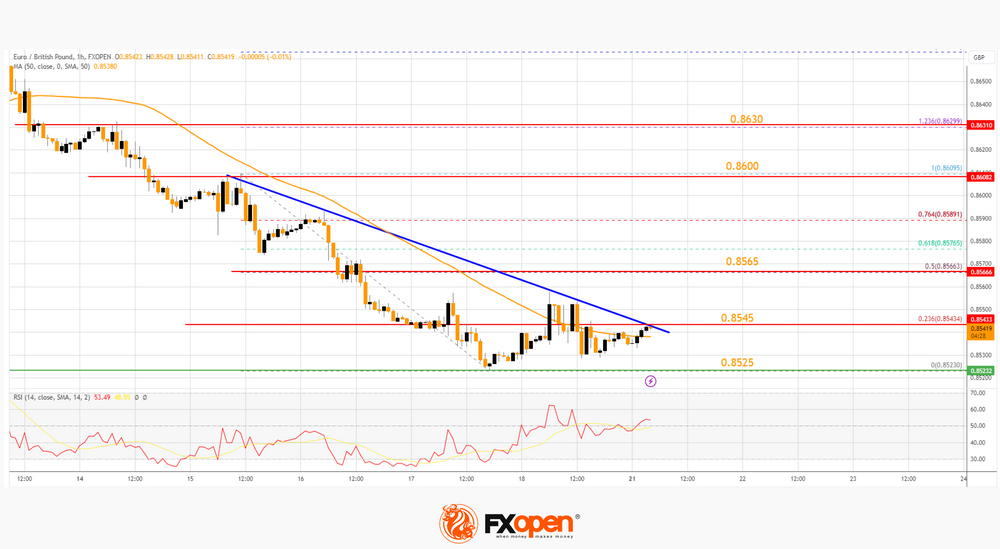
The pair is now facing resistance near a major bearish trend line at 0.8545. It is close to the 23.6% Fib retracement level of the main drop from the 0.8609 swing high to the 0.8523 low. The next major resistance could be 0.8565.
The 50% Fib retracement level of the main drop from the 0.8609 swing high to the 0.8523 low is also at 0.8565. A close above the 0.8565 level might accelerate gains. In the stated case, the bulls may perhaps aim for a test of 0.8600. Any more gains might send the pair toward the 0.8630 level.
Immediate support sits near 0.8525. The next major support is near 0.8500. A downside break below the 0.8500 support might call for more downsides. In the stated case, the pair could drop toward the 0.8440 support level.
Trade global forex with the Innovative Broker of 2022*. Choose from 50+ forex markets 24/5. Open your FXOpen account now or learn more about trading forex with FXOpen.
* FXOpen International, Innovative Broker of 2022, according to the IAFT
This article represents the opinion of the Companies operating under the FXOpen brand only. It is not to be construed as an offer, solicitation, or recommendation with respect to products and services provided by the Companies operating under the FXOpen brand, nor is it to be considered financial advice.
EUR/USD Daily Outlook
Daily Pivots: (S1) 1.0847; (P) 1.0871; (R1) 1.0896; More...
Intraday bias in EUR/USD is turned neutral as it continued to lose downside momentum ahead of 1.0832 support. On the downside, decisive break of 1.0832 support will target 1.0609/34 cluster support next. On the upside, above 1.0951 minor resistance will turn intraday bias neutral to the upside for stronger recovery.
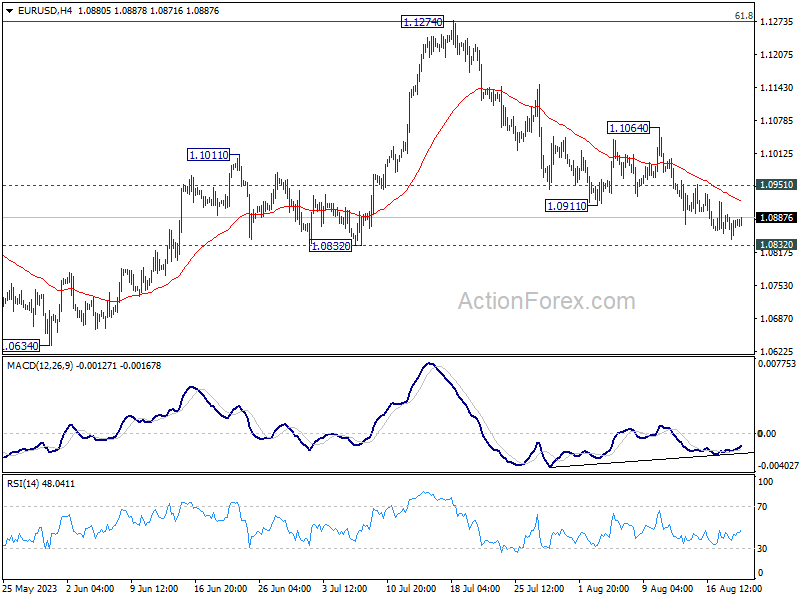
In the bigger picture, a medium term top should be formed at 1.1274, after failing to break through 61.8% retracement of 1.2348 (2021 high) to 0.9534 at 1.1273 decisively, on bearish divergence condition in D MACD. Fall from there is seen as a correction to the uptrend from 0.9534 (2022 low). Deeper decline would be seen to 1.0634 cluster support (38.2% retracement of 0.9534 to 1.1274 at 1.0609). Strong support could be seen there, at least on first attempt, to set the range for consolidation. Yet, medium term outlook will be neutral for now, as long as 1.1274 resistance holds.
GBP/USD Daily Outlook
Daily Pivots: (S1) 1.2696; (P) 1.2731; (R1) 1.2773; More...
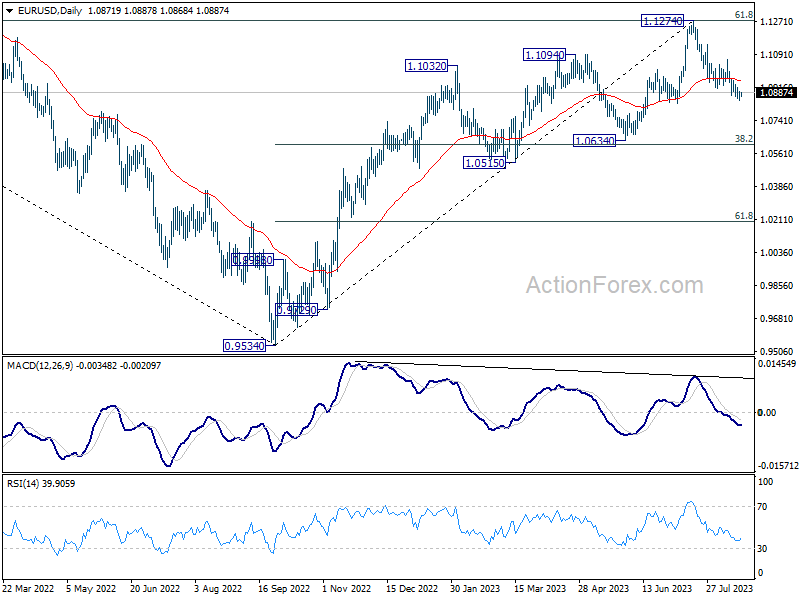
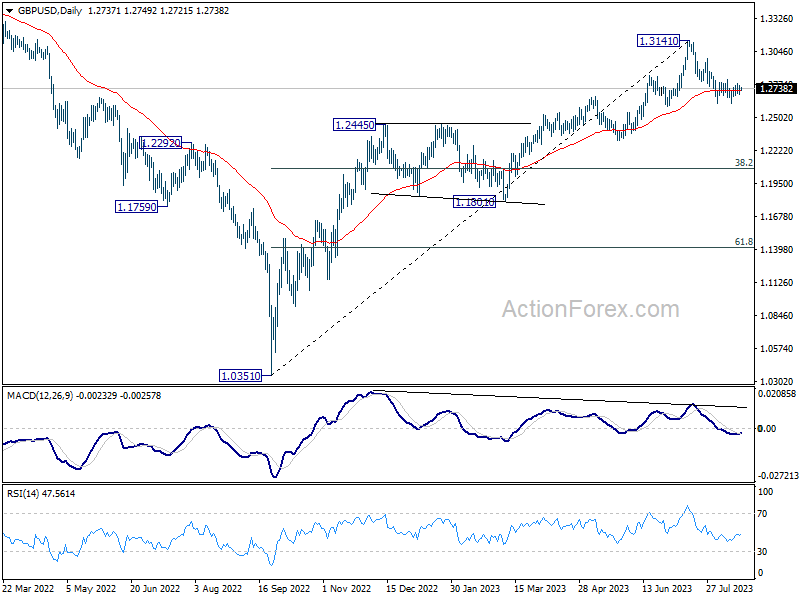
Intraday bias in GBP/USD stays neutral at this point. On the downside, firm break of 1.2615, and sustained trading below 1.2678 resistance turned support will argue that it's already in a larger correction. Deeper decline would then be seen to 1.2306 support next. Nevertheless, break of 1.2817 minor resistance will indicate that the pull back from 1.3141 has completed, and turn bias back to the upside for stronger rebound.
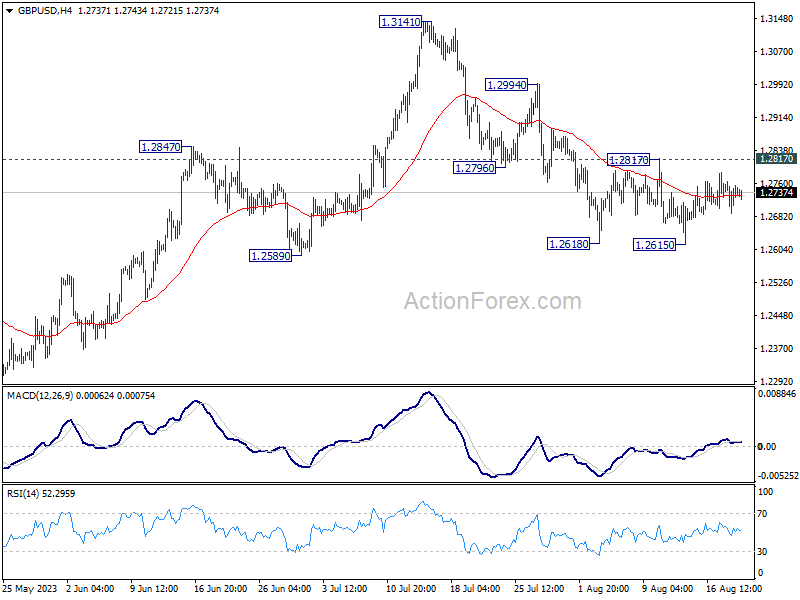
In the bigger picture, a medium term top could be in place at 1.3141 already, on bearish divergence condition in D MACD. Sustained trading below 55 D EMA (now at 1.2723) should confirm this case, and bring deeper fall to 38.2% retracement of 1.0351 to 1.3141 at 1.2075, as a correction to up trend from 1.0351 (2022 low). For now, rise will stay mildly on the downside as long as 1.3141 resistance holds, in case of strong rebound.
USD/CHF Daily Outlook
Daily Pivots: (S1) 0.8783; (P) 0.8806; (R1) 0.8846; More....
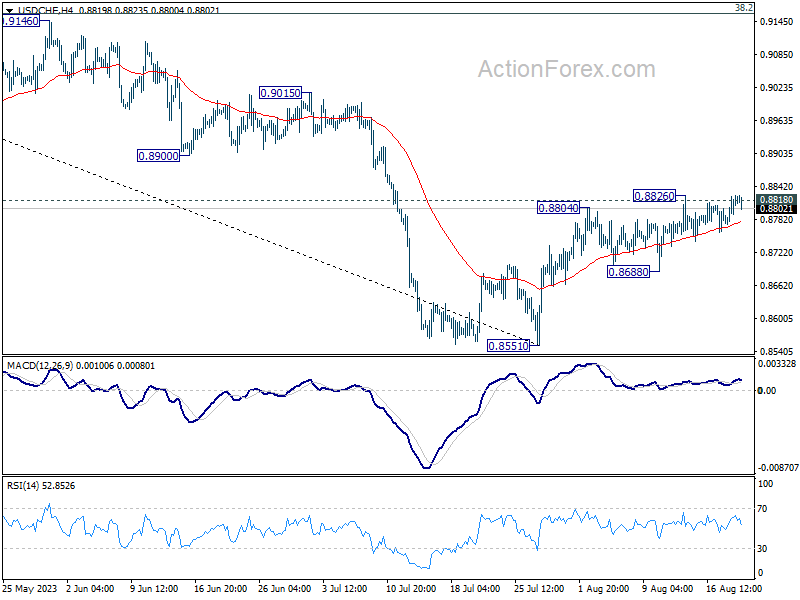
Intraday bias in USD/CHF remains neutral for the moment. Decisive break of 0.8818/26 resistance zone will carry larger bullish implication, and target 0.9146 cluster resistance next. However, break of 0.8688 support will indicate rejection by 0.8818, and turn bias back to the downside for retesting 0.8551 low.
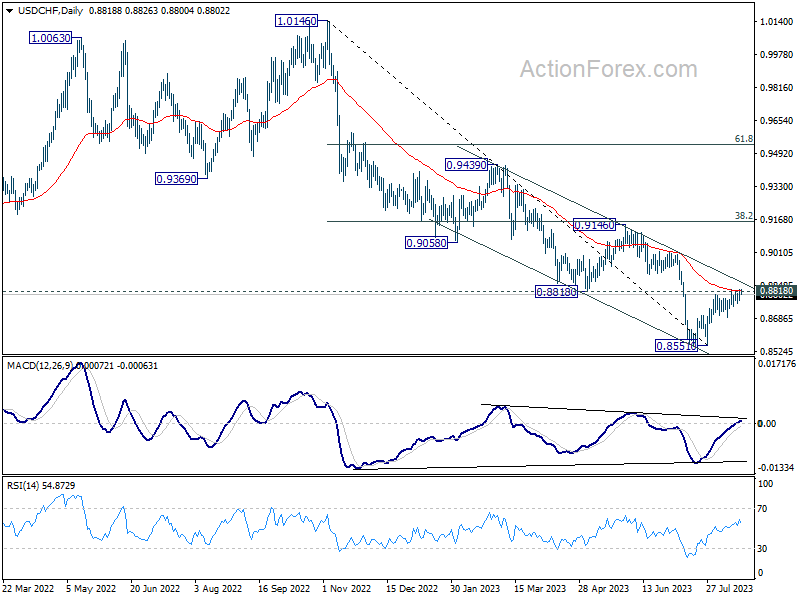
In the bigger picture, a medium term bottom could be in place at 0.8551 already, on bullish convergence condition in D MACD. Sustained trading above 0.8818 support turned resistance will bring further rise to 0.9146 cluster resistance (38.2% retracement of 1.0146 to 0.8551 at 0.9160), even as a correction. Nevertheless, break of 0.8851 will resume the down trend from 1.0146 instead.
USD/JPY Daily Outlook
Daily Pivots: (S1) 144.92; (P) 145.40; (R1) 145.87; More...
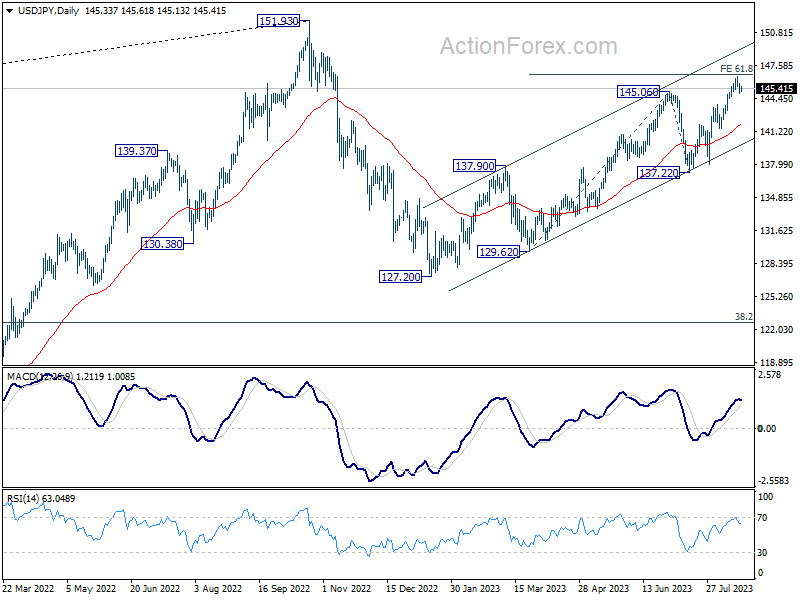
Intraday bias in USD/JPY remains neutral for consolidation below 146.55. On the upside, sustained break of 61.8% projection of 129.62 to 145.06 from 137.22 at 146.76 will pave the way to retest 151.93 high. However, considering bearish divergence condition in 4H MACD, firm break of 143.88 resistance turned support will be a sign of reversal, and turn bias back to the downside for 55 D EMA (now at 141.92).
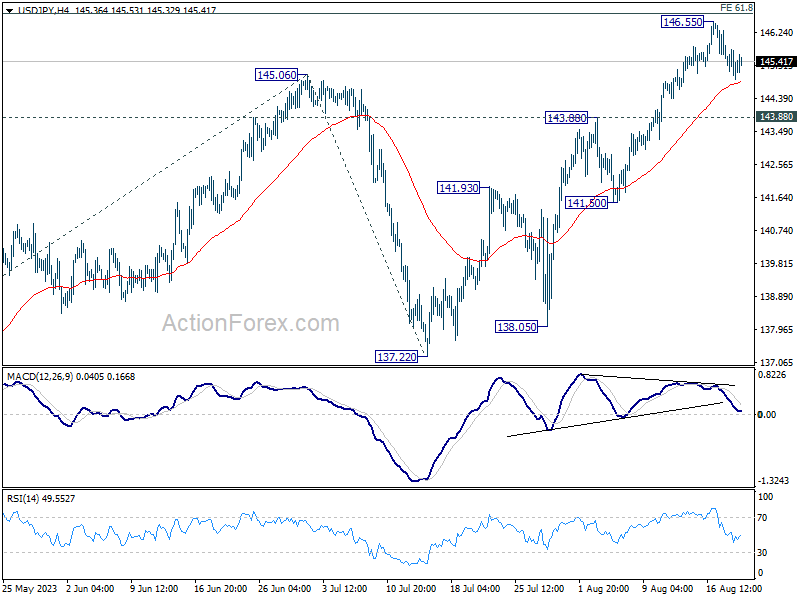
In the bigger picture, overall price actions from 151.93 (2022 high) are views as a corrective pattern. Rise from 127.20 is seen as the second leg of the pattern and could still be in progress. But even in case of extended rise, strong resistance should be seen from 151.93 to limit upside. Meanwhile, break of 137.22 support should confirm the start of the third leg to 127.20 (2023 low) and below.