

Sample Category Title
USD/CHF Technical: Potential Continuation of Medium-Term Downtrend
- The CHF is the second-best performing major currency against the USD based on a one-month rolling basis.
- The recent four weeks of up move of USD/CHF has flashed out bullish exhaustion conditions that advocate the potential continuation of its medium-term impulsive down move.
- 0.8800/8830 is the key resistance zone to watch on the USD/CHF.
In the past four weeks, the Swiss Franc (CHF) is the second best-performing major currency against the USD where the CHF just depreciated by -1.40% with the GBP that has come in the first place (-0.67% against the USD) based on a one-month rolling calculation as of 22 August 2023 at this time of the writing.
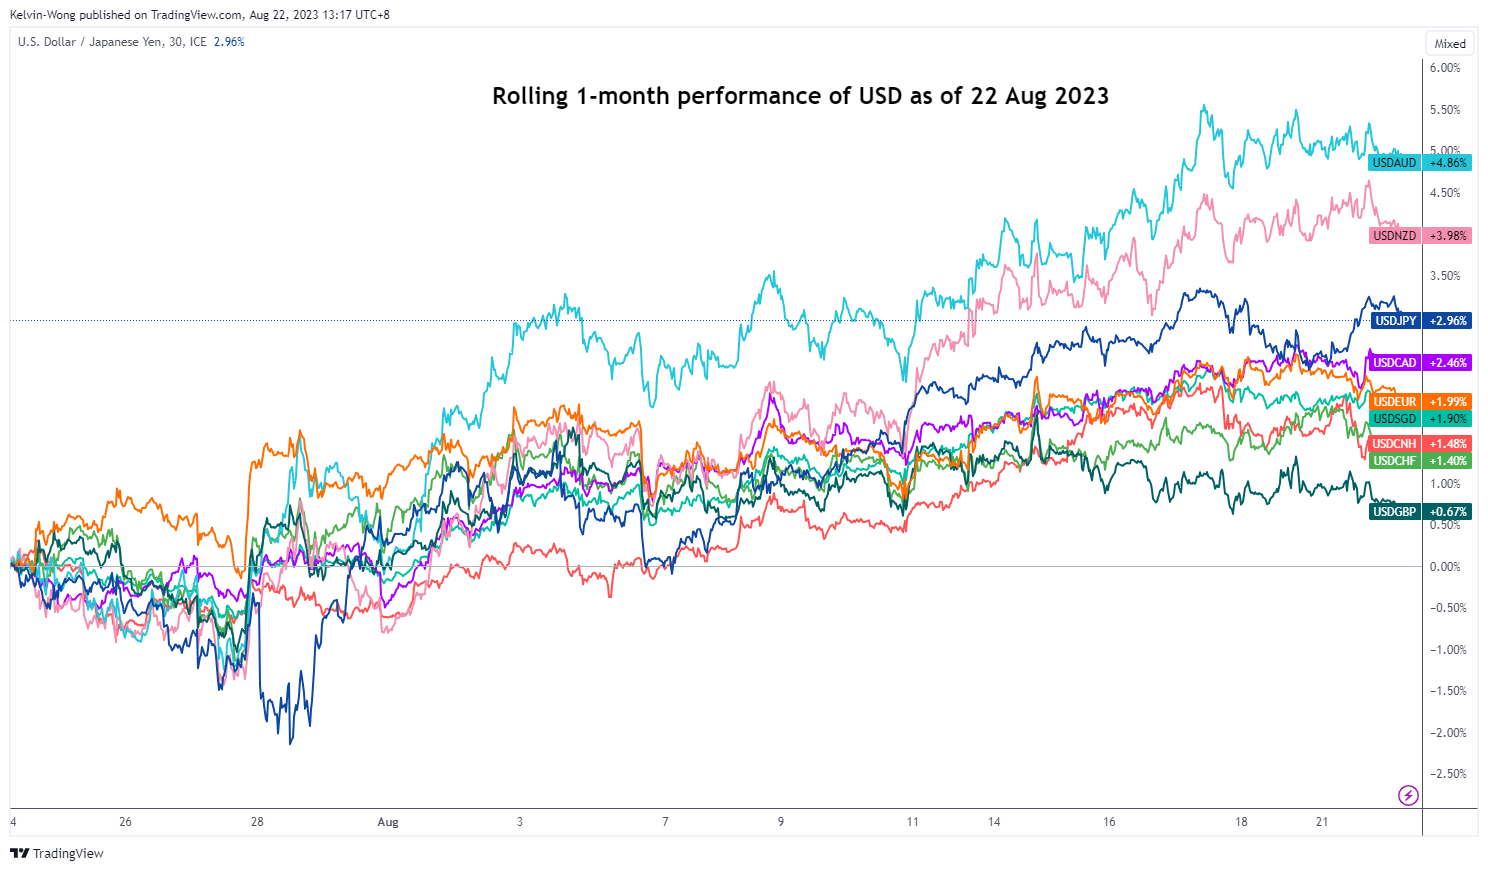
Fig 1: Rolling 1-month performance of USD against major currencies as of 22 August 2023 (Source: TradingView, click to enlarge chart)
In the lens of technical analysis, the rally of +269 pips that was seen on the USD/CHF from its 27 July 2023 low of 0.8553 to the recent 21 August 2023 high of 0.8828 is likely to be a corrective rebound within a medium-term downtrend that is still intact since its 8 March 2023 due to the emergence of several bullish exhaustion elements.
Daily bearish candlestick emerged right at descending channel resistance
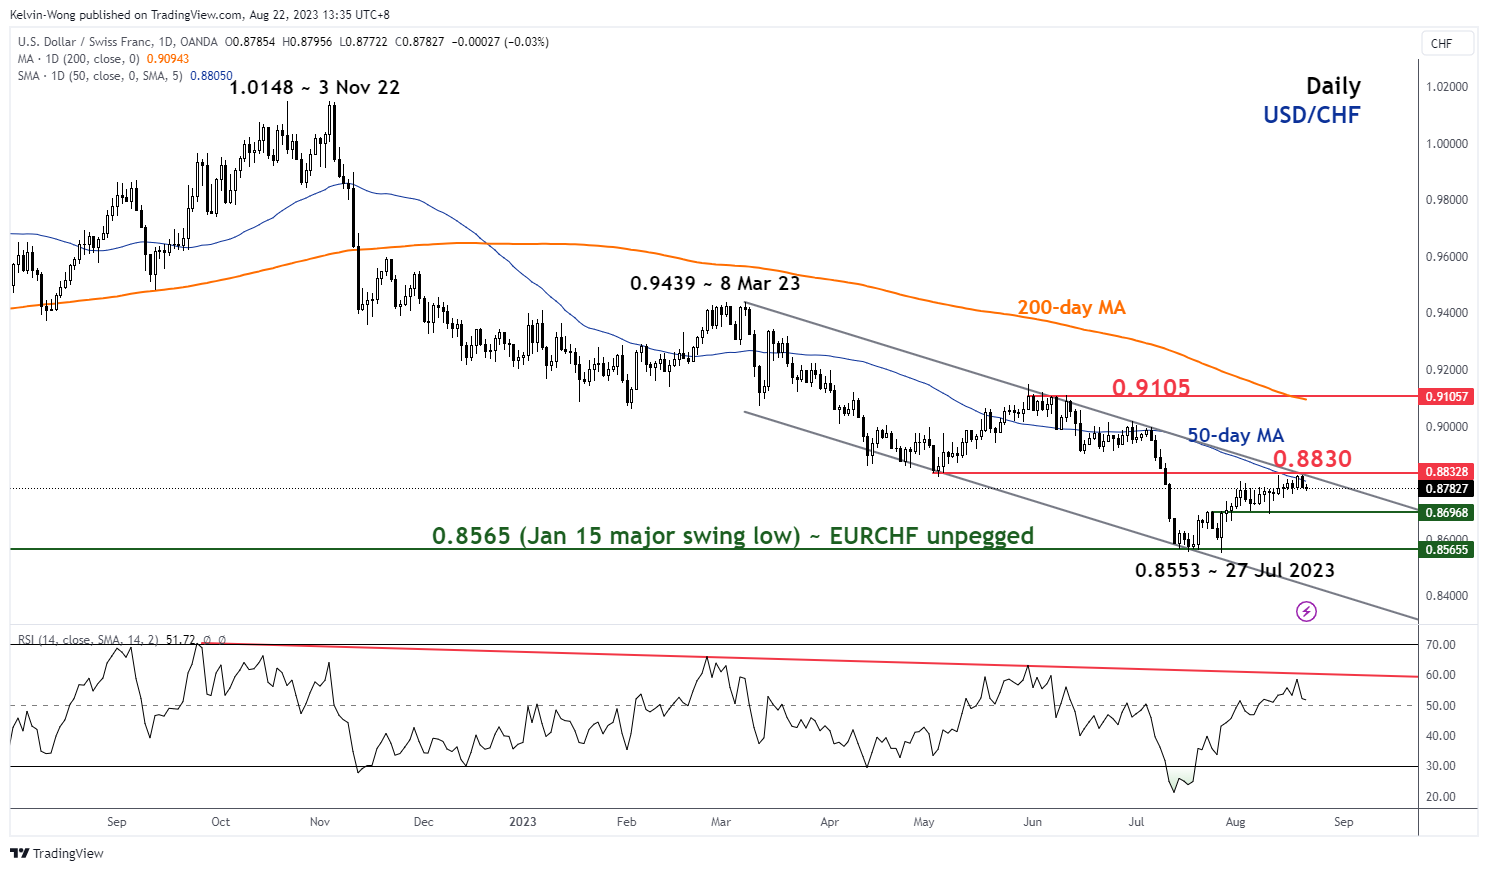
Fig 2: USD/CHF medium-term trend as of 22 Aug 2023 (Source: TradingView, click to enlarge chart)
Yesterday’s price action of USD/CHF has staged a bearish reaction right at the upper boundary of the medium-term descending channel that coincides with the downward-sloping 50-day moving average with both acting as a confluence of resistance at 0.8830.
Started to evolve into a minor downtrend
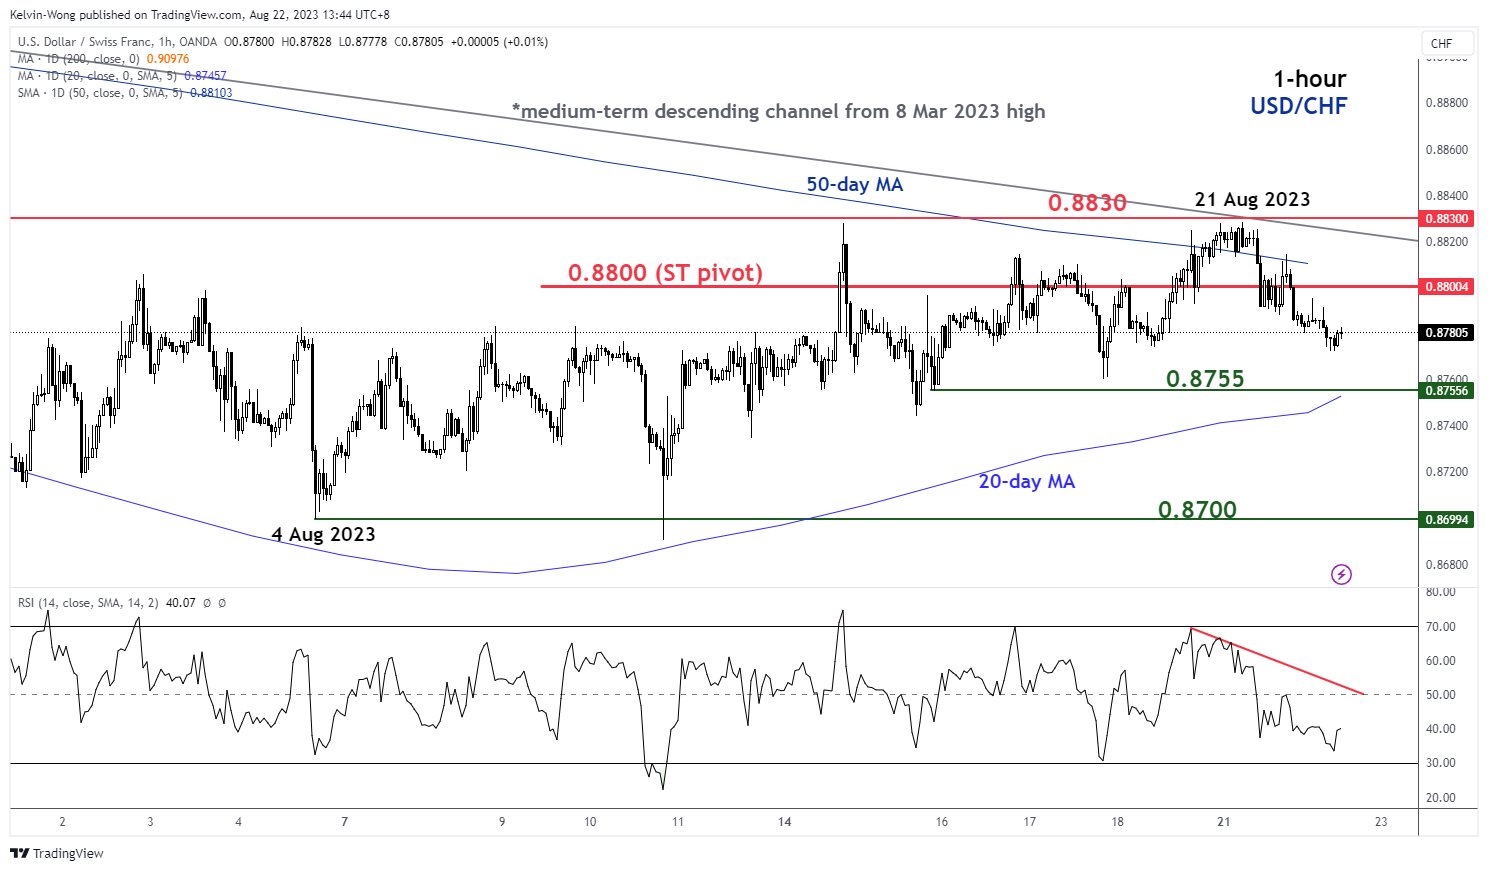
Fig 3: USD/CHF minor short-term trend as of 22 Aug 2023 (Source: TradingView, click to enlarge chart)
Since its 21 August 2023 high of 0.8828, the price actions of USD/CHF have started to oscillate into a minor downtrend in a series of “lower highs and lower lows”.
Watch the 0.8800 key short-term pivotal resistance a break below 0.8755 near-term support (also the 20-day moving average) exposing the next support at 0.8700 (minor swing lows of 4/10 August 2023) in the first step.
On the flip side, a clearance above 0.8800 negates the bearish tone to set sight again on the 0.8830 medium-term resistance.
Overnight Risk Sentiment Generally Positive With China Exception
Markets
Following a warming-up lap during European dealings, US investors went at it again. An empty eco/event calendar didn’t stop them from going for the cycle highs in yields. US yields added 5.8 bps (2-yr) to 8.5 bps (10-yr) with the 2-yr yield closing marginally above the psychological 5% mark, the 5-yr yield testing the cycle high at 4.5%, the 10-yr yield ending at the highest level (4.34%) since 2007 and the 30-yr yield (4.45%) finishing at its best level since 2011. The underlying force? You guessed it… higher real rates! The US 10-yr real rate traded north of 2% intraday for the first time since March 2009. European, UK and even Japanese bond yields join the journey higher. German yields rose by 6.8 bps to 8.2 bps yesterday with he belly of the curve underperforming the wings. Unlike most previous sessions, higher real rates didn’t translate into heavy stock markets and a firmer dollar. On the contrary, a tech rally resulted in a 1.5% gain for the Nasdaq. The Dow Jones ended flat with the S&P winning around 0.7%. The outcome in Europe was more mixed with key 4200 support in the EuroStoxx 50 fighting to live another day. The trade-weighted dollar’s rise is blocked by first resistance at 103.57 while EUR/USD still didn’t test 1.0834 support. The pair ended at 1.0896 yesterday from an open at 1.0877. EUR/GBP ended broadly flat at 0.8545 with the low 0.85-support area remaining untested as well.
Overnight risk sentiment is generally positive with China exception to the rule. The PBOC’s CNY fixing deviated again big time compared to expectations as the central bank tries to slow the currency’s descent. USD/CNY has been toying with the 7.30 2022 high for the past couple of sessions. Core bonds tread water with the dollar slightly in the defensive. Today’s eco calendar is again razor thin with second tier US existing home sales (July) and the Richmond Fed Manufacturing Index (August). We don’t expect them to interact with trading. The path of least resistance remains south for core bonds despite resistance levels in yield terms. For more fundamental trading drivers, we wait for tomorrow’s PMI’s and Friday’s Jackson Hole Symposium by the Kansas City Fed. Both Fed Chair Powell and ECB President Lagarde are scheduled to deliver high profile speeches, setting the tone for policy rate decisions in September. Our preferred scenario (25 bps rate hikes by both) isn’t discounted in money markets.
News and views
The Federal Reserve Bank of New York’s SCE labour market survey showed that the average wage received by American workers for a full time job was sharply higher in July 2023 ($69,475), compared with July of last year ($60,764). The average reservation wage (the lowest wage respondents would be willing to accept for a new job) reached its highest reading of $78,645. However, at the same time there were also signs of an easing in the job market. The expected likelihood of moving to a new employer declined somewhat to 10.6% from 11.0% in July 2022, while the average expected likelihood of becoming unemployed increased to 3.9% from 2.3% in July 2022, the highest reading since March 2020. The average expected likelihood of working beyond age 62 declined to 47.7% from 48.8% in July 2022, the lowest reading since the start of the series in March 2014. The series has largely been on a downward trend since November 2020.
According to long-term economic forecasts to be published by the Australian government on Thursday (seen before by Reuters), the country’s economic growth over the next 40 years is expected to structurally decline due an aging of the population and a decline in population growth. Real gross domestic product (GDP) is forecast to grow 2.2% annually over the 40 years to fiscal 2063, a full 0.9 percentage point slower than the previous four decades. The economy is expected to be around 2.5 times larger in real terms 40 years hence.
Stocks Rebound, But Volatility Rises
Stocks rebounded on Monday, in a move that looked more like a correction than a reaction to fresh news, as there was no fresh news that went against the slowing China rhetoric, nor against the fear that we will hear something sufficiently hawkish this Friday from Jerome Powell’s Jackson Hole speech. At this point, the hawkish Federal Reserve (Fed) expectations are mostly priced in, leaving room for some up and down moves. So yesterday’s session was not only marked by a rebound in the S&P500 from the October to July ascending baseline, but also by a visible rise in volatility. Nasdaq 100 jumped 1.65% as well, but the US 2-year yield returned well above 5%, and the 10-year yield pushed to a fresh high since 2007.
One interesting thing is, in 2007, when the US 10-year yield was at these levels, the positioning in the market was deeply negative – meaning that investors expected the yields to rebound, while today the positioning is deeply positive, meaning that investors expect the yields to bounce lower. And that’s understandable: the US 10-year yield was on a steady falling path in 2007, so there was a reason for investors to expect a rebound – which did not happen. In a similar way, today, we are just coming out of a long period of near zero rates, so for our eyes, the actual levels seem very high. That explains why many asset managers expect the yields to fall. There is also a growing interest in US 10-year TIPS – which are protected against inflation, and which hit the 2% mark for the first time since the GFC as well. But there is not much reason other than our low comparison levels that gives reason to an imminent reversal in market direction. The US data is strong, the labour market is tight, and inflation is slowing but ‘significant upside risks’ prevail. A recent study warned that unless the monthly CPI stays below the 0.2%, inflation is headed higher in 2024. So there is a chance that we won’t see a downside correction in the US 10-year yield, and if that’s not the case, the selloff could extend until the 10-year yield settles somewhere between 5-5.50%.
Anyway, the market mood got significantly better yesterday. Tech stocks fueled the rally in the US, as Nvidia jumped 8.5% yesterday, a day before the release of its Q2 results. Nvidia’d better meet its $11bn sales forecast for last quarter, otherwise, there is a chance that we will see a sizeable downside correction.
In Europe, oil stocks shouldered yesterday’s rally, as the barrel of US crude made an attempt above the $82pb, on lower OPEC+ exports and on the back of a golden cross formation on a daily chart where the 50-DMA crossed above the 200-DMA. But yesterday, that wasn’t the case. Oil’s positive attempt remained short-lived, on the contrary, and the barrel of crude is preparing to test the $80pb support to the downside again this morning. The market is driven by two major forces: the supply tightness and the Chinese demand expectations. These days, the Chinese demand expectations are very much in focus, which could help the oil bears take advantage for selling the recent rally in oil prices. But tighter OPEC rhetoric will remain a major support into the 200-DMA, near $76pb.
Expect the US Dollar rally to extend
The US dollar broadly weakened across the board, helping majors to take some breather. The dollar index fell back towards its 200-DMA, the EURUSD settles above the 1.09 mark this morning, while Cable bulls eye a further rise toward the 50-DMA, which stands a touch below the 1.28 level. But looking at the US dollar and the real yields, the end of last year’s dollar really coincides with a peak in 10-year real yield. Both started retreating in Q3 of last year. The dollar retreated relatively faster. And now that the real yields are on the rise again, there is little reason to keep the USD on a bearish trend for the months ahead. The dollar rally which started by mid-July should further develop, and there is significant room for further correction before we could technically call the end of the dollar’s bearish trend. In numbers, the dollar index will still be in a bearish trend below the 105.40 mark. Until that level is reached, investors don’t have much to lose for jumping on the back of a bull.
USD/JPY Daily Outlook
Daily Pivots: (S1) 144.92; (P) 145.40; (R1) 145.87; More...
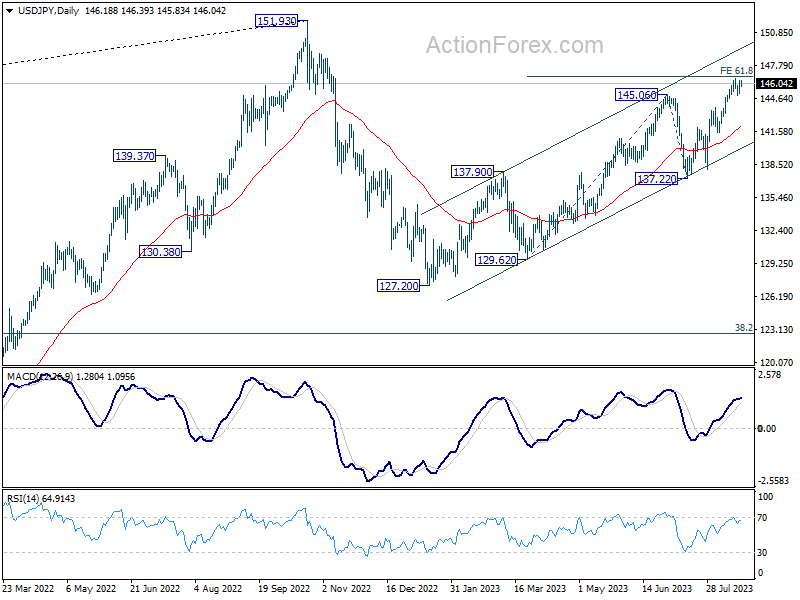
USD/JPY is still bounded in range below 146.55 and intraday bias remains neutral at this point. On the upside, sustained break of 61.8% projection of 129.62 to 145.06 from 137.22 at 146.76 will pave the way to retest 151.93 high. However, considering bearish divergence condition in 4H MACD, firm break of 44.92 support will be a sign of reversal, and turn bias back to the downside for 55 D EMA (now at 141.95).
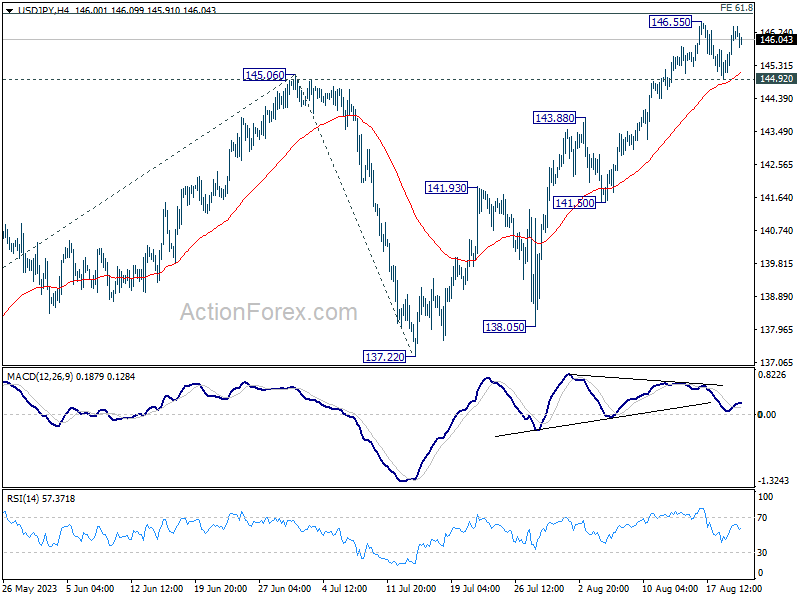
In the bigger picture, overall price actions from 151.93 (2022 high) are views as a corrective pattern. Rise from 127.20 is seen as the second leg of the pattern and could still be in progress. But even in case of extended rise, strong resistance should be seen from 151.93 to limit upside. Meanwhile, break of 137.22 support should confirm the start of the third leg to 127.20 (2023 low) and below.
Yen Selloff Slows, But Remains Vulnerable
Yen's selloff experienced a mild respite during the Asian session, bolstered by a spike in 10-year JGB yield that touched its apex since 2014. However, given the widening yield disparities with both US and European counterparts, the outlook for Yen remains bearish, at least in the foreseeable future. Interestingly, despite US benchmark yields soaring to their highest point in over fifteen years, Dollar hasn't capitalized on this momentum. A semblance of stabilization in the risk sentiment landscape further keeps both Dollar and Yen on the softer side.
In contrast, Euro and Swiss Franc currently enjoy an edge, showcasing modest gains against the Sterling. Meanwhile, the picture surrounding commodity currencies are ambiguous at best, teetering on the brink of vulnerability. Speculators are keeping a watchful eye on potential bearish news emanating from China, anticipating that any negative headlines could exacerbate the selloff in Aussie and Kiwi.
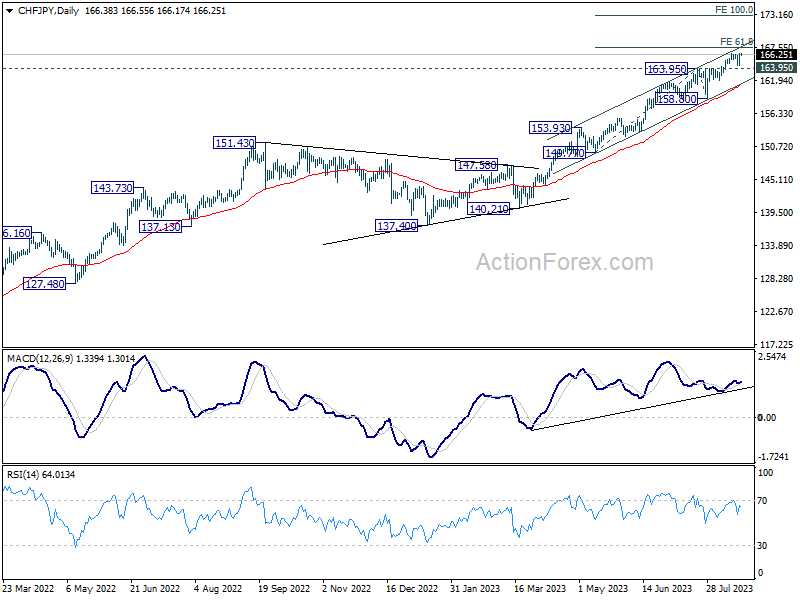
Technically, CHF/JPY's up trend resumed overnight and edged higher to 166.55. Immediate focus is now on 61.8% projection of 149.77 to 163.95 from 158.80 at 167.56. Rejection by this level, followed by break of 163.95 resistance turned support will likely turn the cross into medium term correction. However, decisive break there could prompt upside acceleration, as accompanied by an upturn in D MACD, and target 100% projection at 172.98. The developments would be a barometers in gauging the Yen's performance across other market spectrums.
In Asia, at the time of writing, Nikkei is up 0.80%. Hong Kong HSI is down -0.08%. China Shanghai SSE is down -0.39%. Singapore Strait Times is down -0.22%. Japan 10-year JGB yield is up 0.0161 at 0.671. Overnight, DOW dropped -0.11%. S&P 500 rose 0.69%. NASDAQ rose 1.56%. 10-year yield rose 0.091 to 4.342.
US 10-yr yield soars to 15-yr high, real yield breaks 2%
US 10-year Treasury yield ascended to an impressive 4.354%, marking its loftiest level since November 2007, before stabilizing at 4.342%. Notably, 10-year inflation-protected Treasury yield surpassed 2% threshold, the first such occurrence since 2009. This move highlights a significant journey from its year-to-date nadir, which hovered around 1%.
Adding to the mix, the ever-relevant two-year yield grazed 5% mark during the later hours of US session. This ascent falls just short of the highs registered earlier this year in both the previous month and March.
This rise can be attributed to indications of a more robust than anticipated growth across segments of the global economy. Such growth metrics are spurring speculations on central banks' potential inclination to maintain interest rates on current high levels for an extended duration than previously assumed.
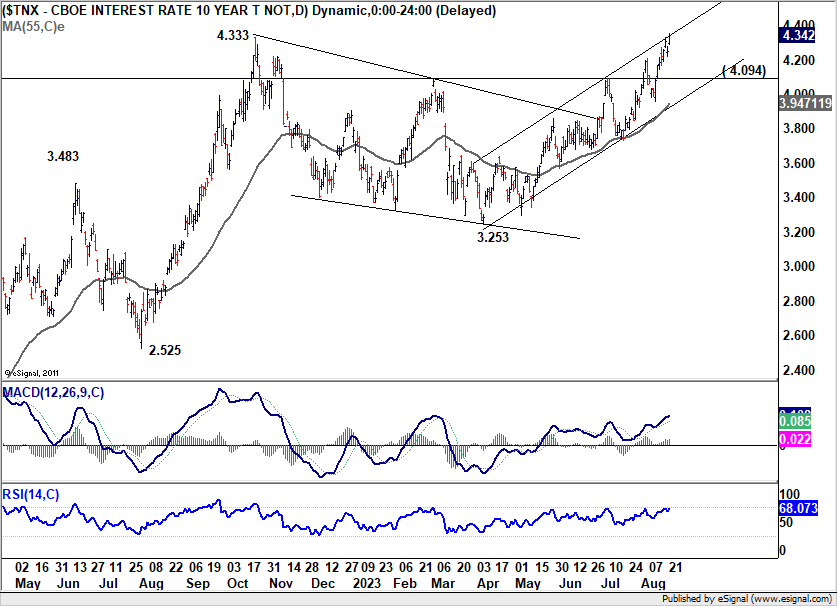
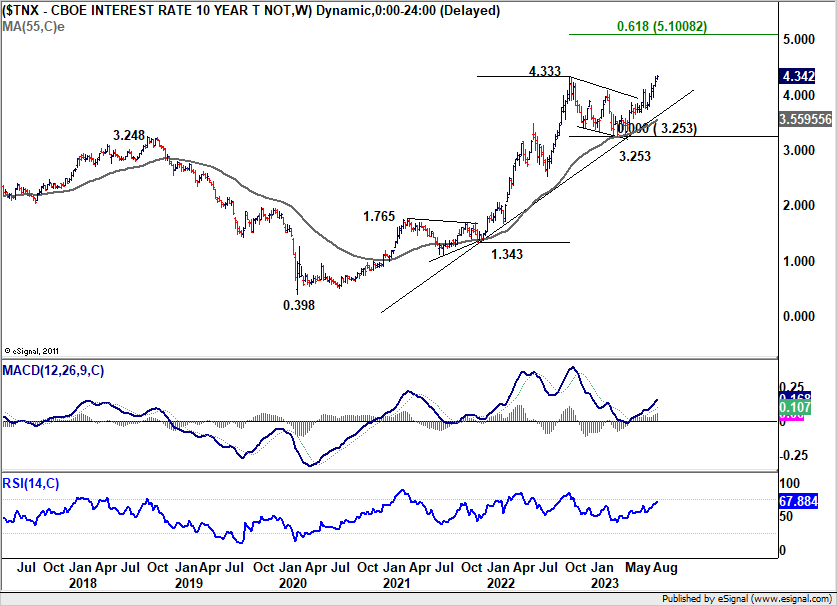
As 10-year yield broke through 4.333 resistance, there are two questions now. Firstly, it's whether TNX could sustain above this resistance level. Secondly, it's whether there will be upside acceleration after clearing this resistance decisively. In any case, outlook will stay bullish as long as 4.094 resistance turned support holds. Next medium term target is
61.8% projection of 1.343 to 4.333 from 3.253 at 5.100.
Silver extending rebound, can it take Gold higher?
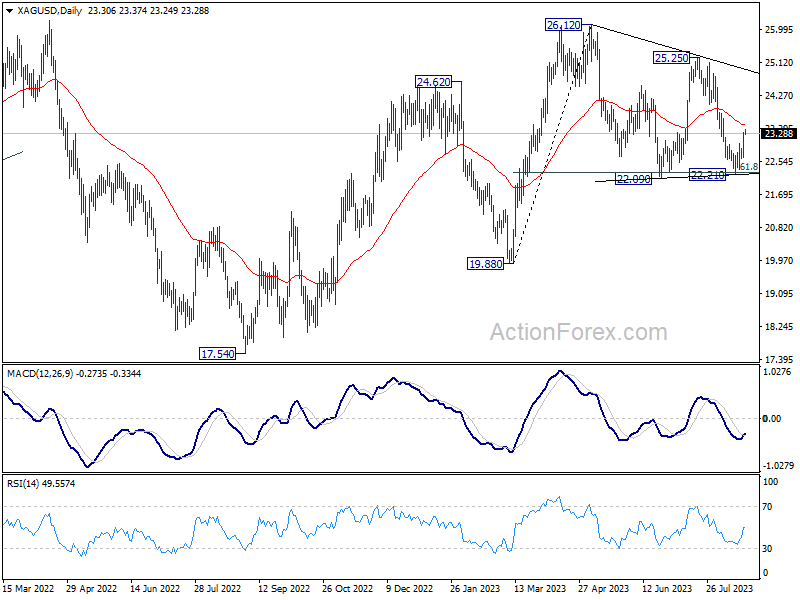
Silver's rebound from 22.21 extended higher overnight and the development should confirm short term bottoming there. A bullish scenario for Silver is that consolidation from 26.12 has completed with three waves to 22.21, after defending 61.8% retracement of 19.88 to 26.12 at 22.26 twice.
Sustained trading above 55 D EMA (now at 23.50) will bolster the bullish case for silver and bring stronger rise back to trend line resistance (now at 24.92). However, rejection by 55 D EMA will argue that current recovery is merely some short-covering profit taking, and send Silver through 22.09 support at a later stage to extend the fall from 26.12.
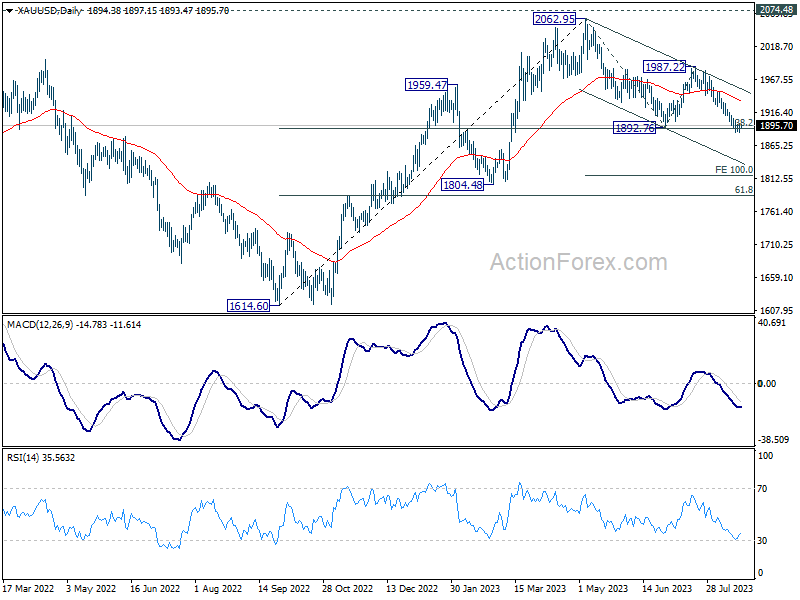
At the same time, Gold is still trying to defend 38.2% retracement of 1614.60 to 2062.95 at 1891.68. A stronger bounce in Silver could be accompanied by similar rebound in Gold back towards 55 D EMA (now at 1933.55). However, if the bearish case in Silver plays out, Gold would likely clear 1891.68 fibonacci support accelerate down to 100% projection of 2062.95 to 1892.76 from 1987.22 at 1817.03.
Looking ahead
Swiss trade balance, UK public sector net borrowing will be released in Euroepan session. Later in the day, US will release existing home sales.
USD/JPY Daily Outlook
Daily Pivots: (S1) 144.92; (P) 145.40; (R1) 145.87; More...
USD/JPY is still bounded in range below 146.55 and intraday bias remains neutral at this point. On the upside, sustained break of 61.8% projection of 129.62 to 145.06 from 137.22 at 146.76 will pave the way to retest 151.93 high. However, considering bearish divergence condition in 4H MACD, firm break of 44.92 support will be a sign of reversal, and turn bias back to the downside for 55 D EMA (now at 141.95).
In the bigger picture, overall price actions from 151.93 (2022 high) are views as a corrective pattern. Rise from 127.20 is seen as the second leg of the pattern and could still be in progress. But even in case of extended rise, strong resistance should be seen from 151.93 to limit upside. Meanwhile, break of 137.22 support should confirm the start of the third leg to 127.20 (2023 low) and below.
Economic Indicators Update
| GMT | Ccy | Events | Actual | Forecast | Previous | Revised |
|---|---|---|---|---|---|---|
| 06:00 | CHF | Trade Balance (CHF) Jul | 4.50B | 4.82B | ||
| 06:00 | GBP | Public Sector Net Borrowing (GBP) Jul | 3.4B | 17.7B | ||
| 08:00 | EUR | Eurozone Current Account (EUR) Jun | 10.2B | 9.1B | ||
| 14:00 | USD | Existing Home Sales Jul | 4.15M | 4.16M |
Bundesbank Inflation Worries Despite Declining Producer Prices
Market movers today
On the data side, we get July existing home sales data for the US today. The housing market has largely defied rising interest rates, so data will be interesting to follow.
Focus is on the August flash PMIs due on Wednesday; note that the Japanese PMI will be out overnight European time. The Japanese economy has held up relatively well in recent months with record-high service PMI prints and manufacturing PMI only just below the 50 threshold, supported by a weak yen.
In the Nordics, focus will be on Norwegian GDP, see more below.
The 60 second overview
German inflation: German producer prices (PPI) declined 1.1% mom in July inducing a 6% annual decline, driven largely by energy. This is the first annual decline since end November 2020. Excluding energy, annual PPI stands at 2%. This indicates further deflationary forces on goods. That said, consumer inflation remains largely service-driven. The Bundesbank also expressed concern yesterday that inflation will remain above 2% for a long time to come due to high wage growth. They expect GDP growth around zero in Q3 and the labour market to remain robust in the coming months, with unemployment climbing slowly higher. For more, see Bundesbank.
New China forecast: Yesterday we revised down our China GDP forecast to 4.8% in 2023 (previous 5.2%) and 4.2% for 2024 (previous 4.8%), see Research China: Downside risks on the rise - scenarios for Chinese growth, 21 August. Rising financial stress and weaker economic performance over the summer has lowered growth expectations. We see a rising risk (25% probability) of a deeper financial and economic crisis but still believe that China has the tools to avert such an outcome and will use them to the extent needed. We have revised higher our USD/CNH forecast to 7.70 in 12M from 7.40 in response to the weaker outlook and rising risks. Today we host a webinar elaborating further on the China outlook, see invitation with link to the webinar here.
Equities: Global equities higher yesterday, driven by a renewed appetite for US tech stocks. It was a relative narrow window with appetite and the majority of S&P500 members were lower despite the index rising 0.65%. Large cap outperforming small cap, cyclicals outperforming defensives and VIX ticking lower. The sudden tech optimism came without major news, though it would not be surprising if some gold diggers are hoping another blowout result from Nvidia as they are set to report after the close on Wednesday. In US yesterday, Dow -0.1%, S&P 500 +0.7%, Nasdaq +1.7%, Russell 2000 -0.2%. The tech optimism is continuing in Asia this morning coupled with less bad news and a strong FX fixing out of China. For the first time in a while, we see a broad lift to indices across Asia. Please note, the MSCI Asia excl. Japan has lost almost 10% in August and one day of relief does not change a trend. Futures in Europe are positive this morning while US futures are flat.
FI: Global bond yields rebounded after the decline on Friday. 10Y US treasuries continued the upward trend that has been dominating since May when the 10Y yield bottomed at 3.4%. It now stands at 4.35%.
FX: Despite US yields continuing higher, EUR/USD traded mostly sideways around 1.09 during yesterday's session. However, the greenback strengthened further against the Yen on the back of the rising US yields. Scandies were offered a breather yesterday as risk sentiment recovered somewhat, and both EUR/SEK and EUR/NOK closed the day more or less unchanged.
Credit: Despite the improvement in risk sentiment, the EUR credit market remained somewhat soft yesterday where iTraxx Xover widened 1.6bp (closing at its widest level since late May) and Main 0.4bp. Financial issuers were the main drivers of primary market activity, but Volvo re-opened the corporate EUR market with a EUR700m 3y bond priced at MS+40 and attracting a solid order book.
Nordic macro
Based on the monthly output figures, we expect that the Norwegian mainland GDP was unchanged in Q2. If proven right, growth (including revisions) will be very close to the projections presented by Norges Bank in its June monetary policy report.
Technical Outlook and Review
DXY:
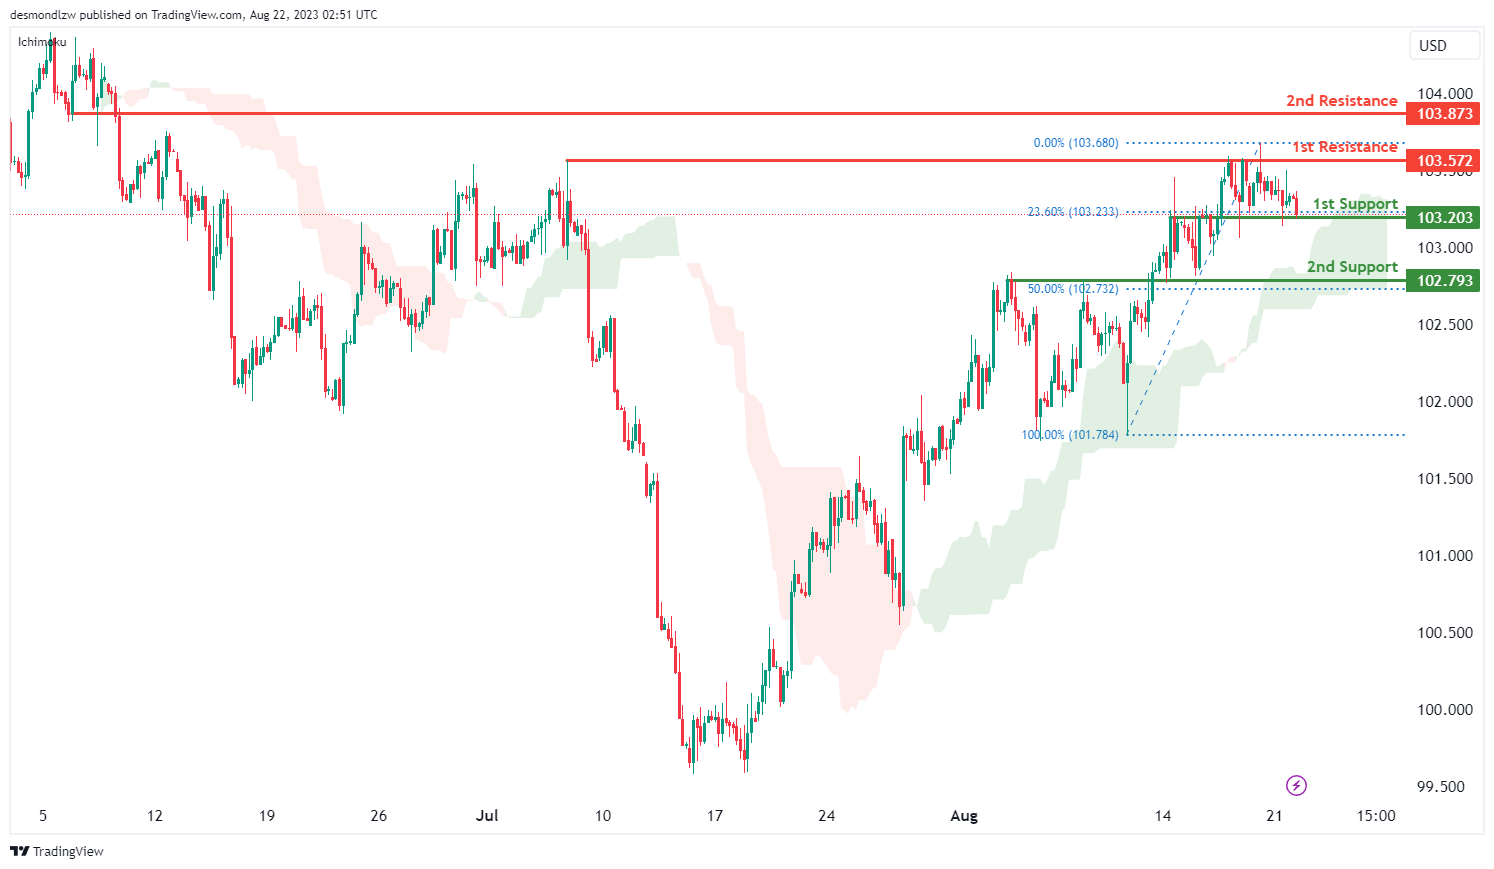
The DXY chart currently displays a bearish momentum, suggesting a prevailing downward trend. Given this momentum, there is a potential scenario where the price could undergo a bearish breakout from the 1st support level at 103.20, potentially leading to a decline towards the 2nd support at 102.79.
The 1st support at 103.20 is identified as an overlap support that aligns with the 23.60% Fibonacci retracement level. Similarly, the 2nd support at 102.79 is also identified as an overlap support that aligns with the 50.00% Fibonacci retracement level.
To the upside, the 1st resistance level at 103.57 is identified as an overlap resistance. Additionally, the 2nd resistance at 103.87 is also identified as another overlap resistance.
EUR/USD:
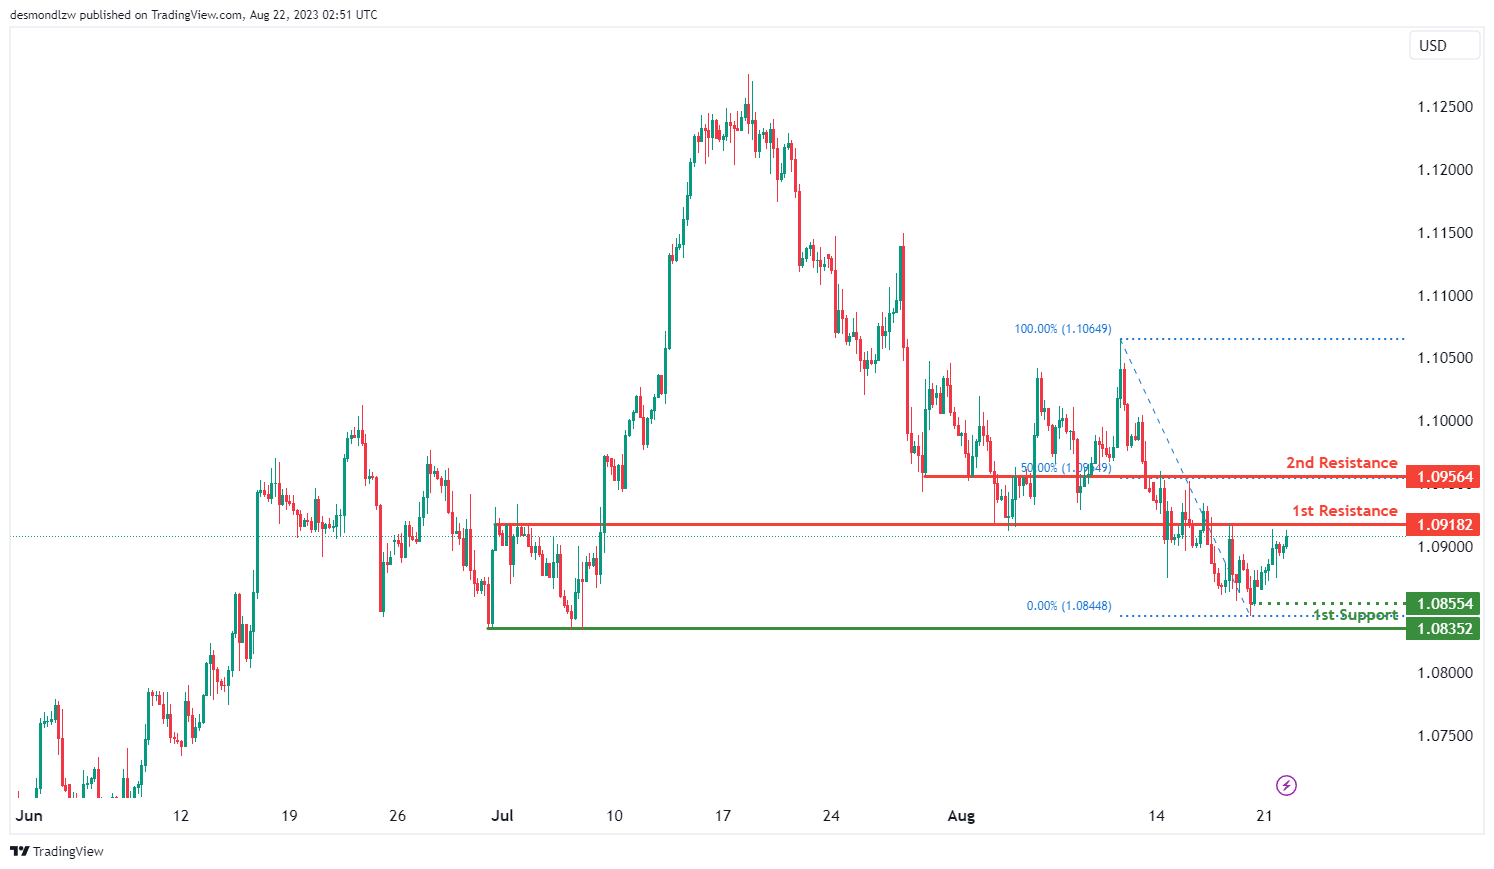
The EUR/USD chart is currently exhibiting a bullish momentum, there is a potential scenario where the price might experience a bullish continuation towards the 1st resistance at 1.0918.
This 1st resistance at 1.0918 is identified as an overlap resistance. Furthermore, the 2nd resistance at 1.0956 is also identified as an overlap resistance that aligns with the 50.00% Fibonacci retracement level.
To the downside, the intermediate support at 1.0855 is identified as a swing-low support while the 1st support at 1.0835 gains importance due to its identification as a multiple swing-low support.
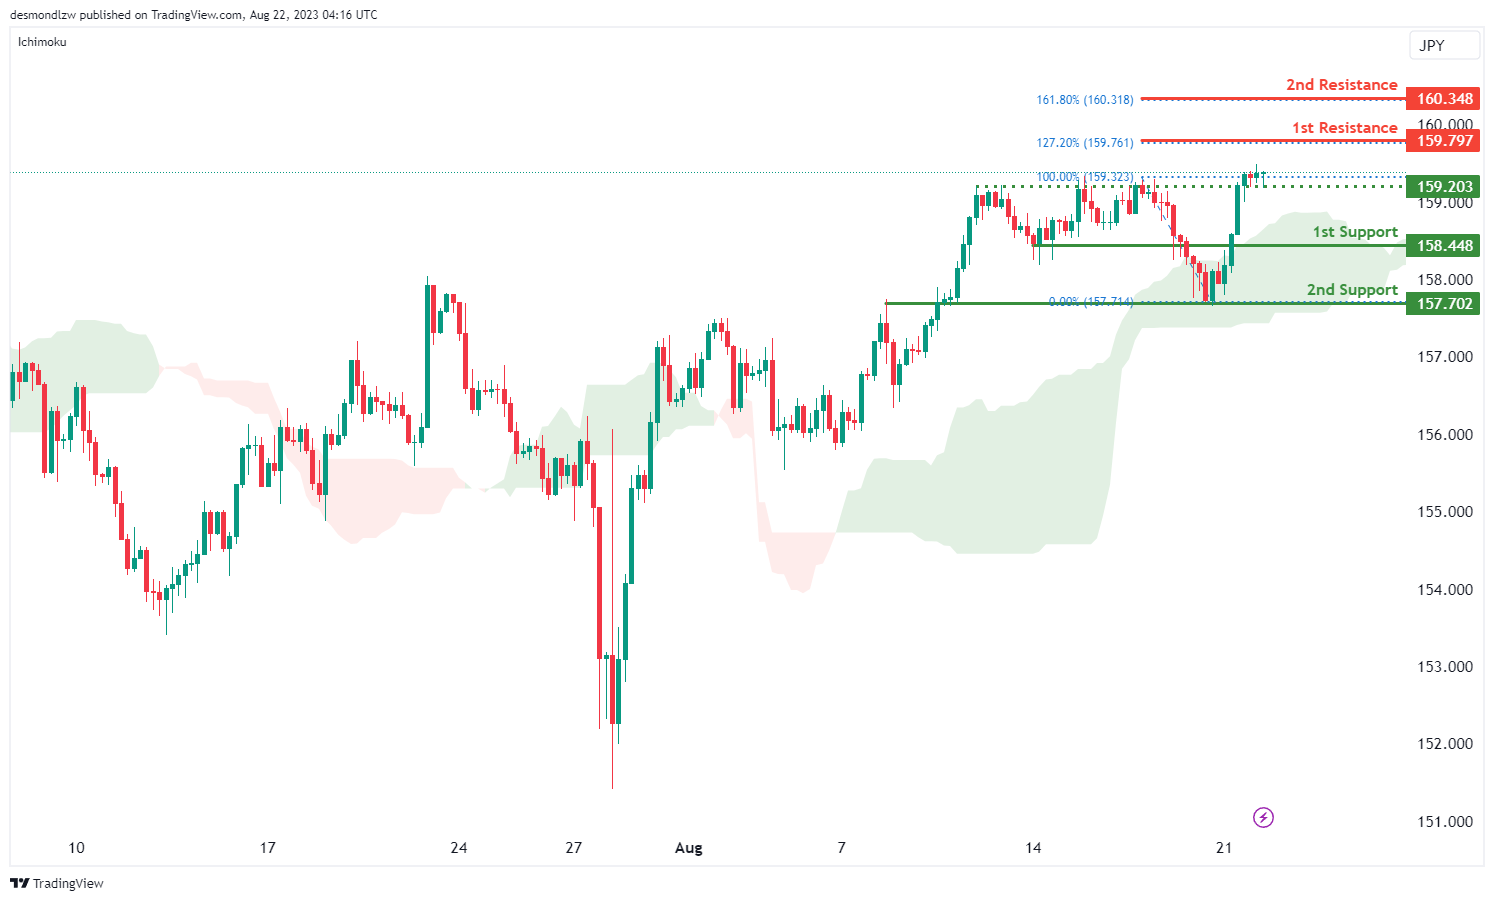
EUR/JPY:
The EUR/JPY chart indicates a bullish overall momentum, and this momentum is further supported by the fact that the price is currently above the bullish Ichimoku cloud.
There is a potential scenario where the price might continue in a bullish direction towards the 1st resistance level.
The 1st support is positioned at 158.44 and is considered advantageous due to its overlap support characteristics. Additionally, the 2nd support at 157.70 is valuable as it represents a pullback support.
On the resistance side, the 1st resistance level at 159.79 is noteworthy and is associated with a 127.20% Fibonacci Extension. Furthermore, the 2nd resistance at 160.34 is significant due to its 161.80% Fibonacci Extension attribute. Additionally, there is an intermediate support at 159.20, which further adds to the potential bullish scenario.
EUR/GBP:
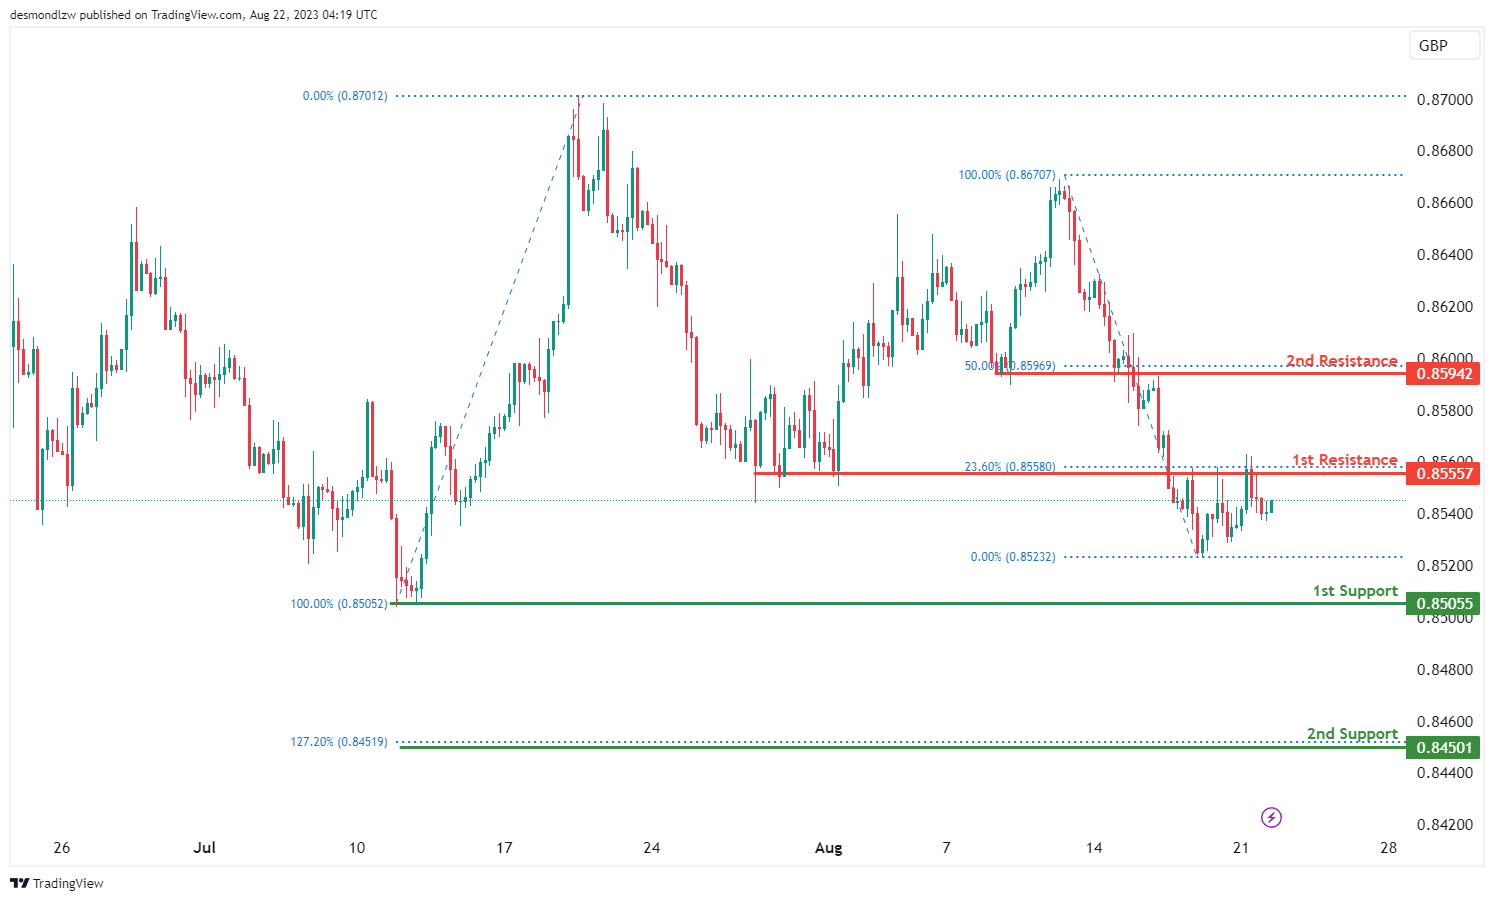
The EUR/GBP chart indicates a bearish overall momentum. There is a potential scenario where the price might rise towards the 1st resistance level in the short term, but then reverse off it and drop towards the 1st support.
The 1st support is located at 0.8505 and is considered advantageous due to its swing low support characteristics. Additionally, the 2nd support at 0.8450 is valuable as it is associated with a 127.20% Fibonacci Extension.
On the resistance side, the 1st resistance level at 0.8555 is noteworthy as it represents a pullback resistance, along with a 23.60% Fibonacci Retracement. Furthermore, the 2nd resistance at 0.8594 is significant due to its pullback resistance attributes and its association with the 50% Fibonacci Retracement.
GBP/USD:
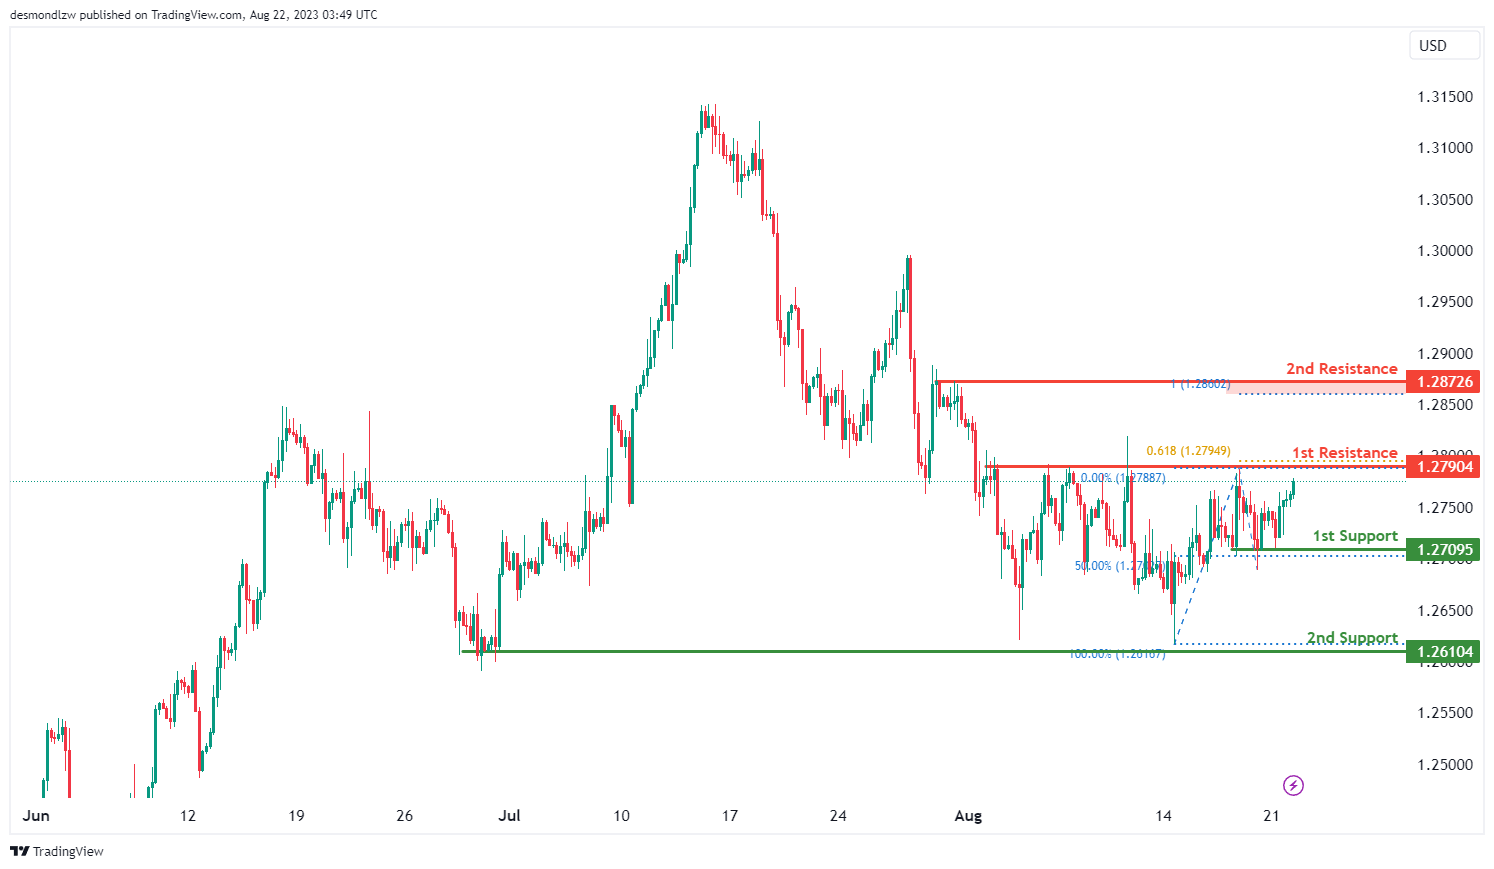
The GBP/USD chart currently displays a bullish momentum, indicating a prevalent upward trend. There is a potential scenario where price could experience a bullish continuation towards the 1st resistance at 1.2790.
This 1st resistance at 1.2790 is identified as an overlap resistance that aligns with the 61.80% Fibonacci projection level. In addition, the 2nd resistance at 1.2873 is identified as a pullback resistance that aligns with the 100.00% Fibonacci projection level.
To the downside, the 1st support at 1.2709 is identified as a multiple swing-low support that aligns with the 50.00% Fibonacci retracement level. Additionally, the 2nd support at 1.2610 is identified as an overlap support.
GBP/JPY:
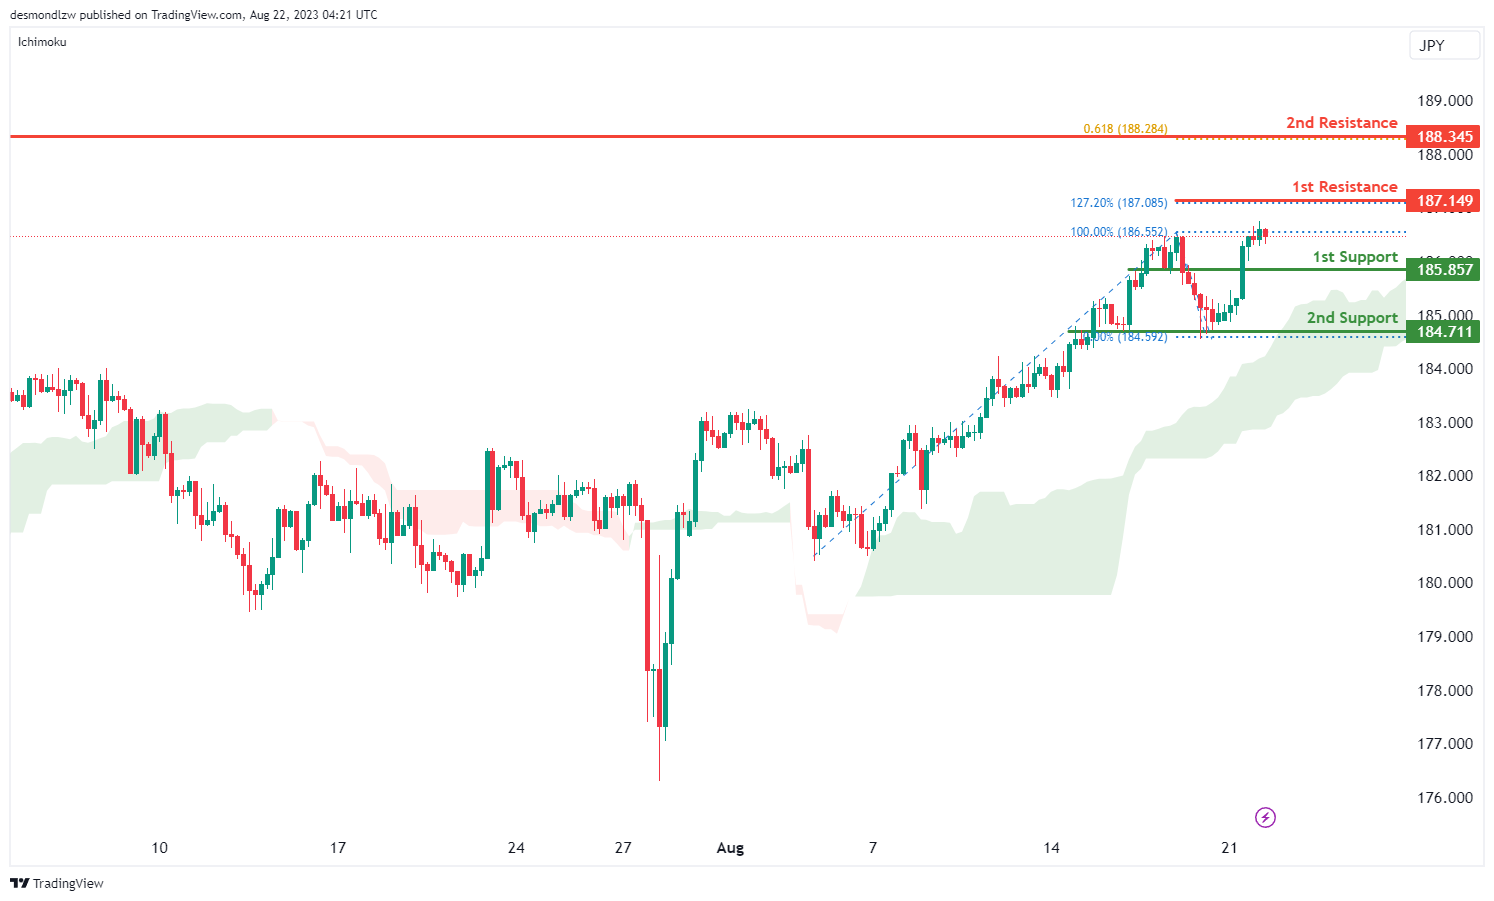
The GBP/JPY chart indicates a bullish overall momentum. There is a potential scenario where the price might continue in a bullish direction towards the 1st resistance level.
The 1st support is positioned at 185.85 and is considered advantageous due to its overlap support characteristics. Additionally, the 2nd support at 184.71 is valuable as it represents a pullback support.
On the resistance side, the 1st resistance level at 187.14 is noteworthy and is associated with a 127.20% Fibonacci Extension. Furthermore, the 2nd resistance at 188.34 is significant due to its swing high resistance attributes and its association with the 61.80% Fibonacci Projection.
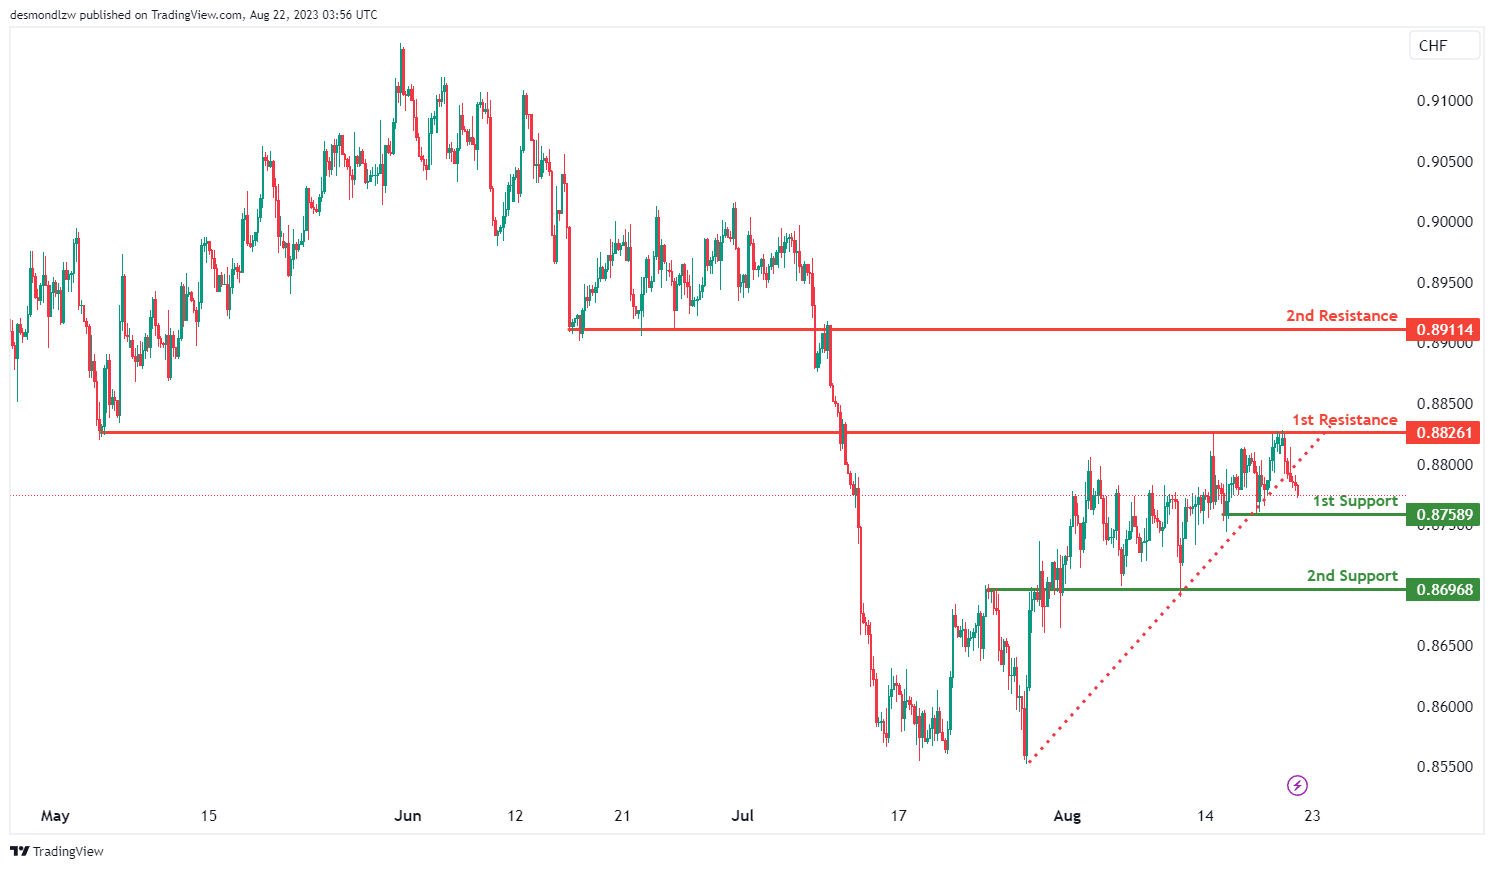
USD/CHF:
The USD/CHF chart’s overall momentum reflects a bearish trend, which is supported by the fact that price has broken below an ascending support line, signaling a potential for further downward movement. There is a possibility that price could continue its bearish movement towards the 1st support at 0.8759.
This 1st support at 0.8759 is identified as a multiple swing-low support. Additionally, the 2nd support at 0.8697 is identified as an overlap support.
To the upside, the 1st resistance at 0.8826 and the 2nd resistance at 0.8911 are both identified as overlap resistances, which could potentially act as barriers to upward price movement.
USD/JPY:
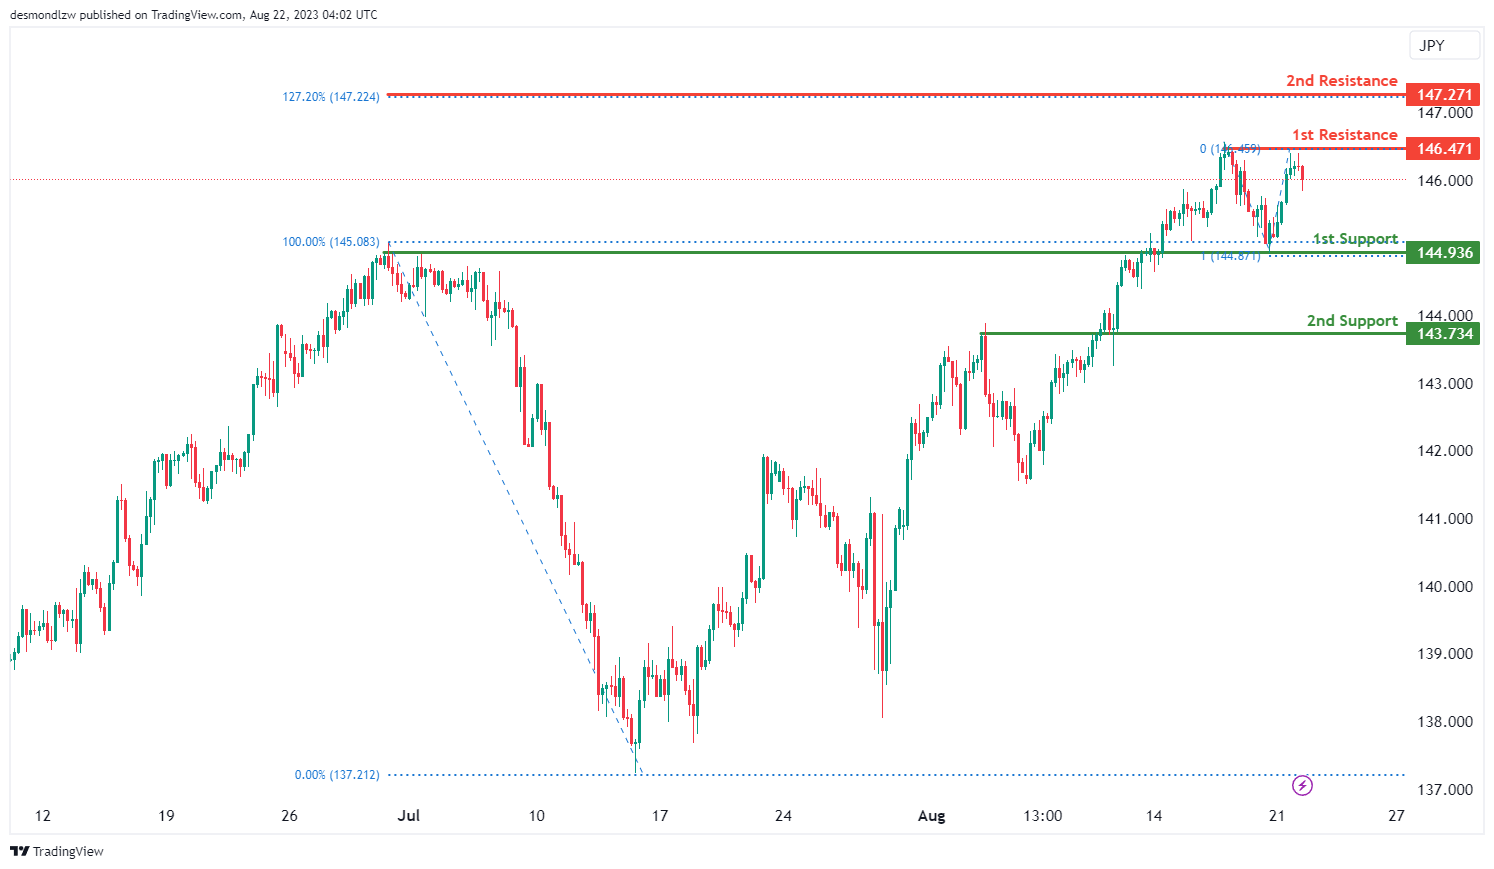
The current chart momentum indicates a neutral trend in the market, with neither strong bullish nor bearish indications. There is a potential scenario for price to fluctuate between the 1st resistance and the 1st support levels.
The 1st support at 144.94 is identified as an overlap support that aligns with the 100.00% Fibonacci projection level. Similarly, the 2nd support at 143.73 is also identified as an overlap support.
To the upside, the 1st resistance at 146.47 is identified as a multiple swing-high resistance while the 2nd resistance at 147.27 is identified as a resistance level that aligns with the 127.20% Fibonacci extension level.
USD/CAD:
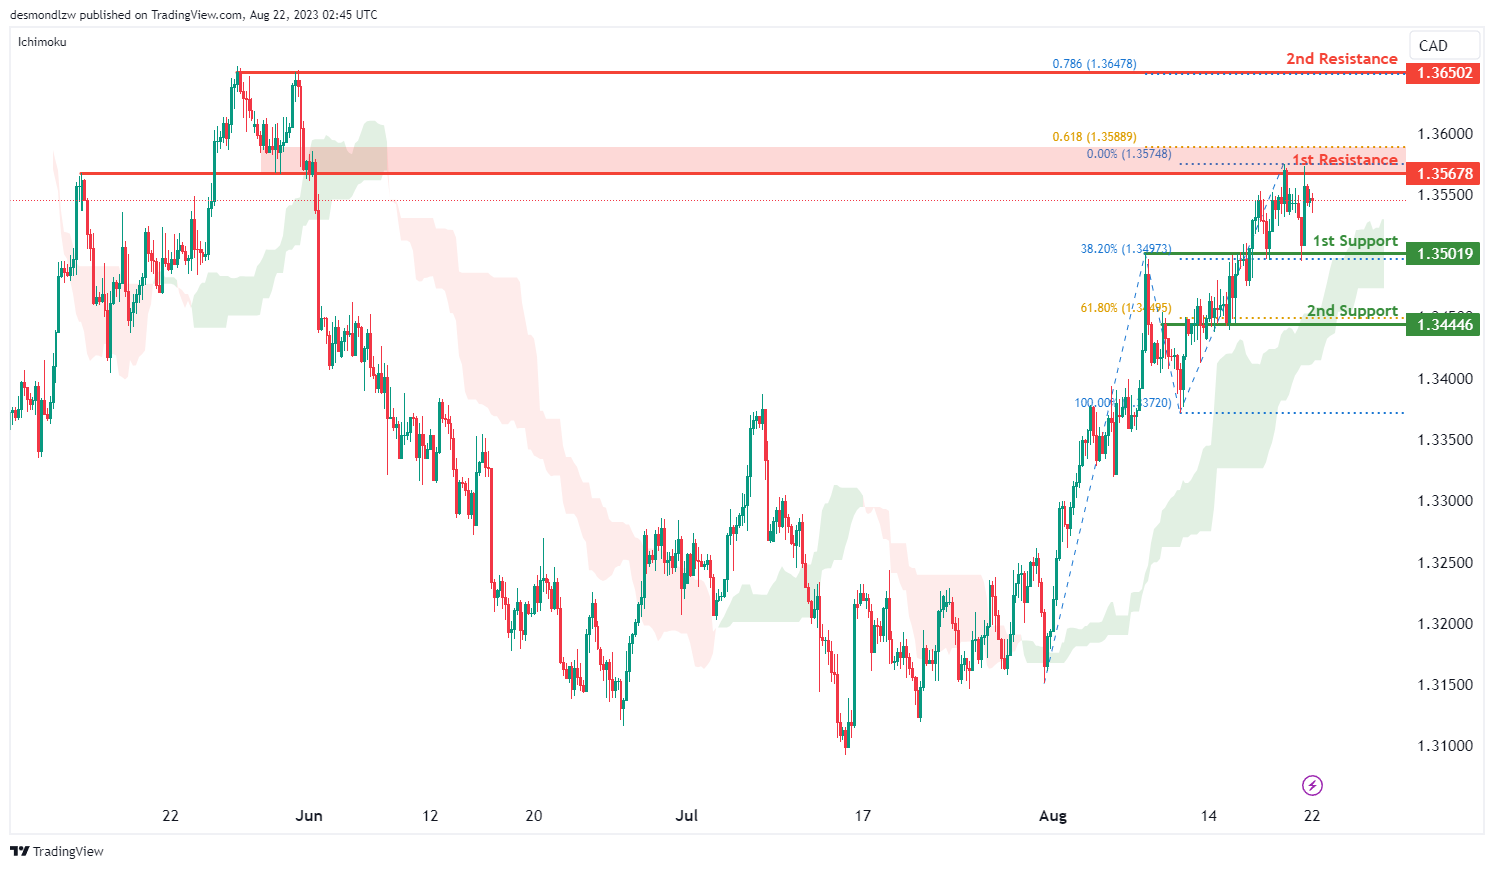
The USD/CAD chart currently shows a weak bullish momentum with low confidence, indicating a potential upward trend. The momentum is based on the factor that the price is positioned above the bullish Ichimoku cloud, suggesting a potential for upward movement.
There is a possibility that the price could continue its bullish trajectory towards the 1st resistance level at 1.3568. This level is recognized as an overlap resistance that aligns close to the 61.80% Fibonacci projection level. Furthermore, the 2nd resistance at 1.3650 is a multiple swing-high that aligns with the 78.60% Fibonacci projection level
The 1st support at 1.3502 is identified as an overlap support that aligns with the 38.20% Fibonacci retracement level. Additionally, the 2nd support at 1.3445 is also identified as an overlap support that aligns with the 61.80% Fibonacci retracement level.
AUD/USD:
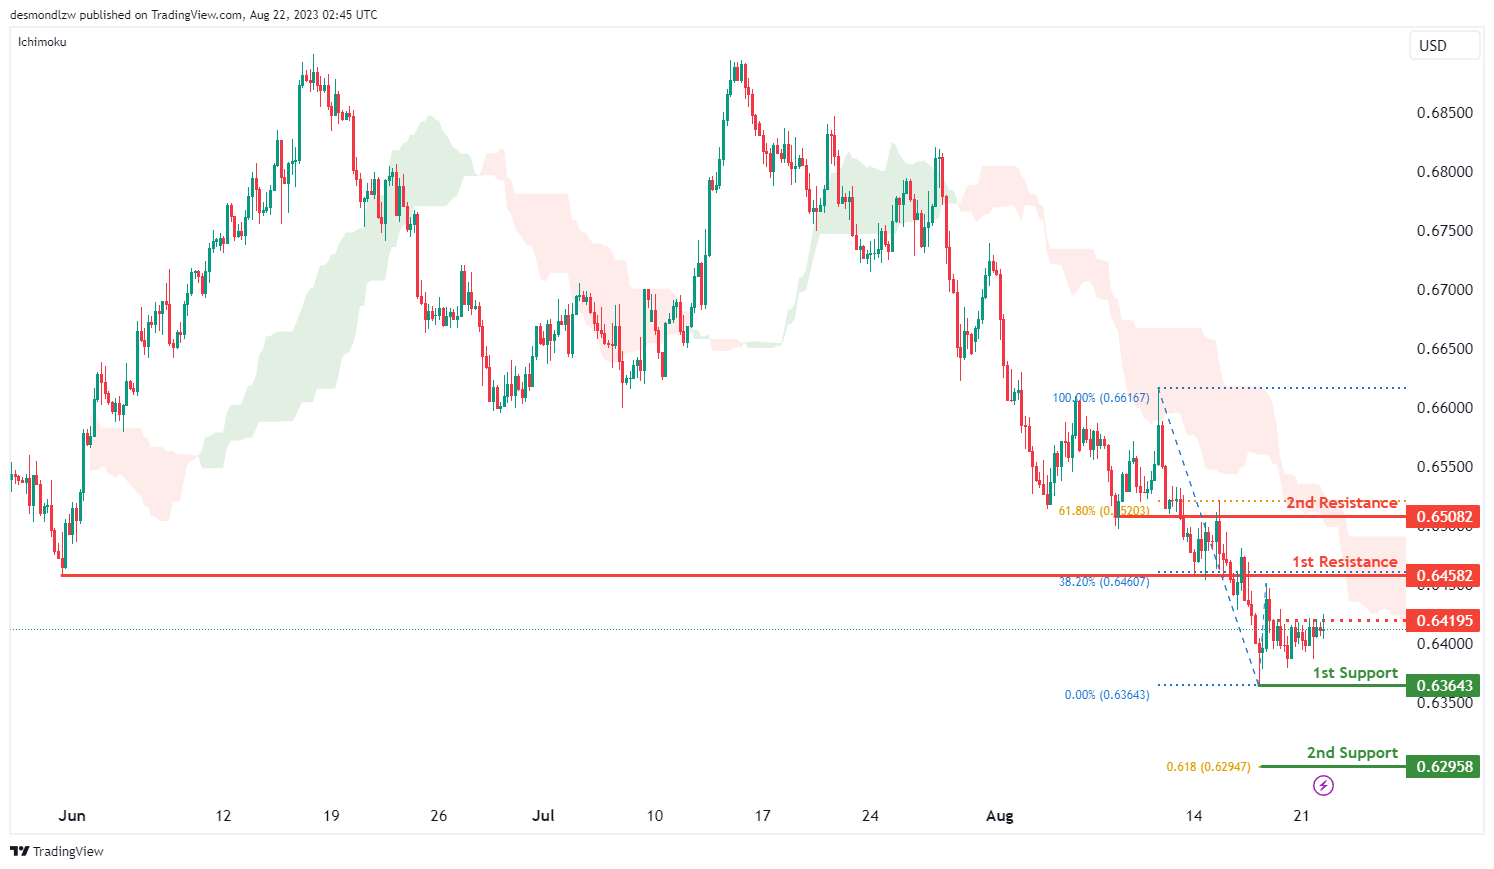
The AUD/USD chart is currently displaying a bearish momentum, indicating a potential downward trend as price is positioned below the bearish Ichimoku cloud, indicating a likelihood of continued downward movement. However, there is a potential for a bearish reaction off the 1st resistance level.
The 1st resistance level at 0.6458 is identified as a pullback resistance that aligns with the 38.20% Fibonacci retracement level. There is also an intermediate resistance at 0.6419 that is identified as a pullback resistance. Furthermore, the 2nd resistance at 0.6508 is identified as an overlap resistance that aligns with the 61.80% Fibonacci retracement level.
To the downside, the 1st support level at 0.6364 is identified as a swing-low support. Furthermore, the 2nd support at 0.6296 is identified as a support level that aligns with the 61.80% Fibonacci projection level.
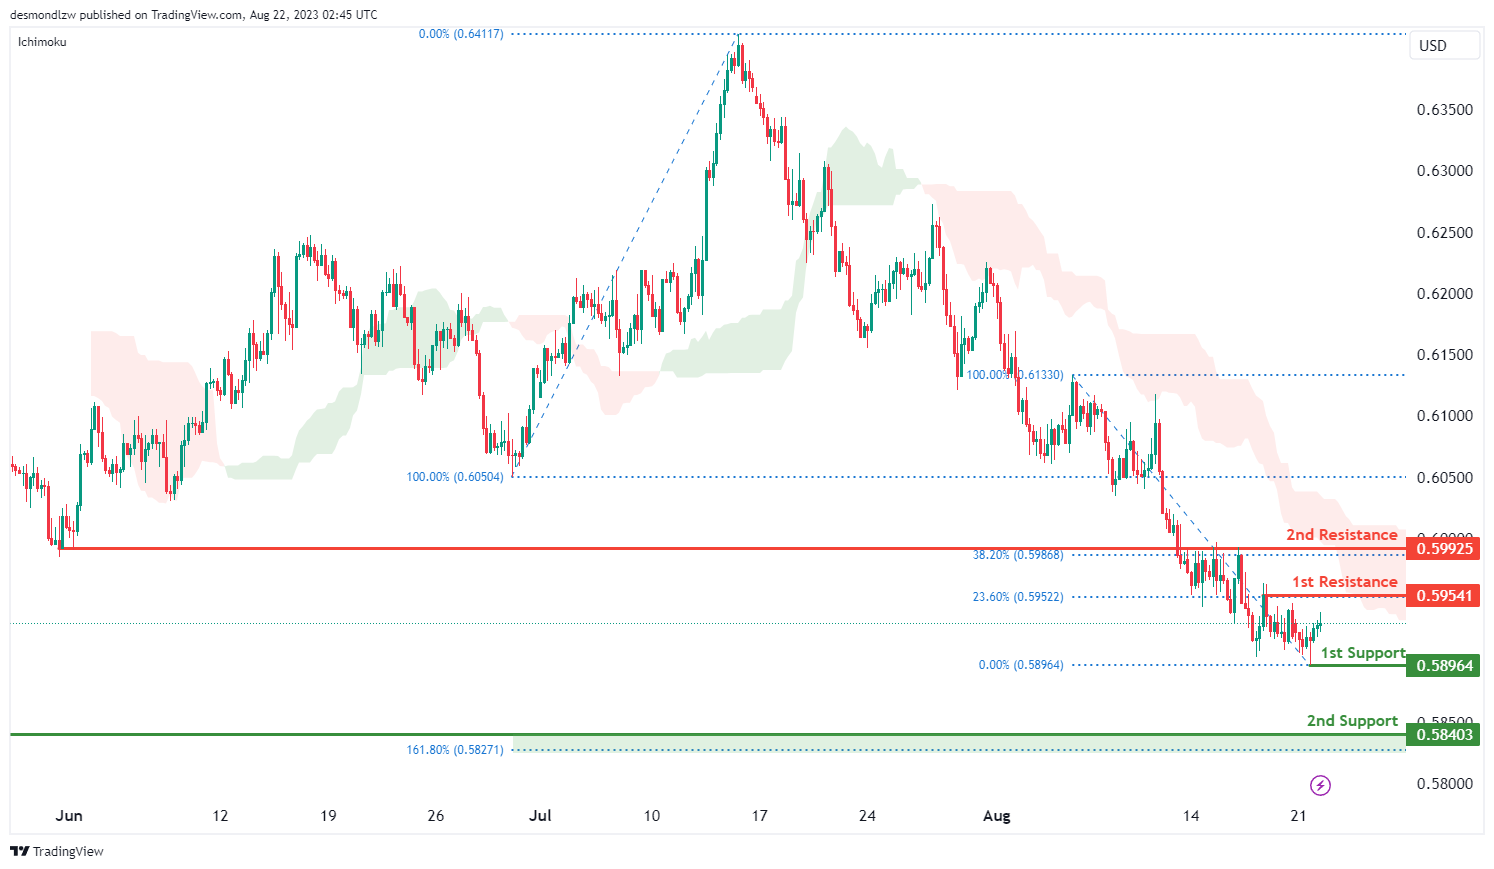
NZD/USD
The NZD/USD chart currently displays a bearish momentum, indicating a prevailing downward trend as price is positioned below the bearish Ichimoku cloud, indicating a likelihood of continued downward movement. However, there is a potential for a bearish reaction off the 1st resistance level.
The 1st resistance level at 0.5954 is identified as a pullback resistance that aligns with the 23.60% Fibonacci retracement level. Furthermore, the 2nd resistance at 0.5993 is identified as an overlap resistance that aligns with the 38.20% Fibonacci retracement level.
The 1st support at 0.5896 is identified as a swing-low support. Additionally, the 2nd support at 0.5840 is identified as a pullback support that aligns close to the 161.80% Fibonacci extension level.
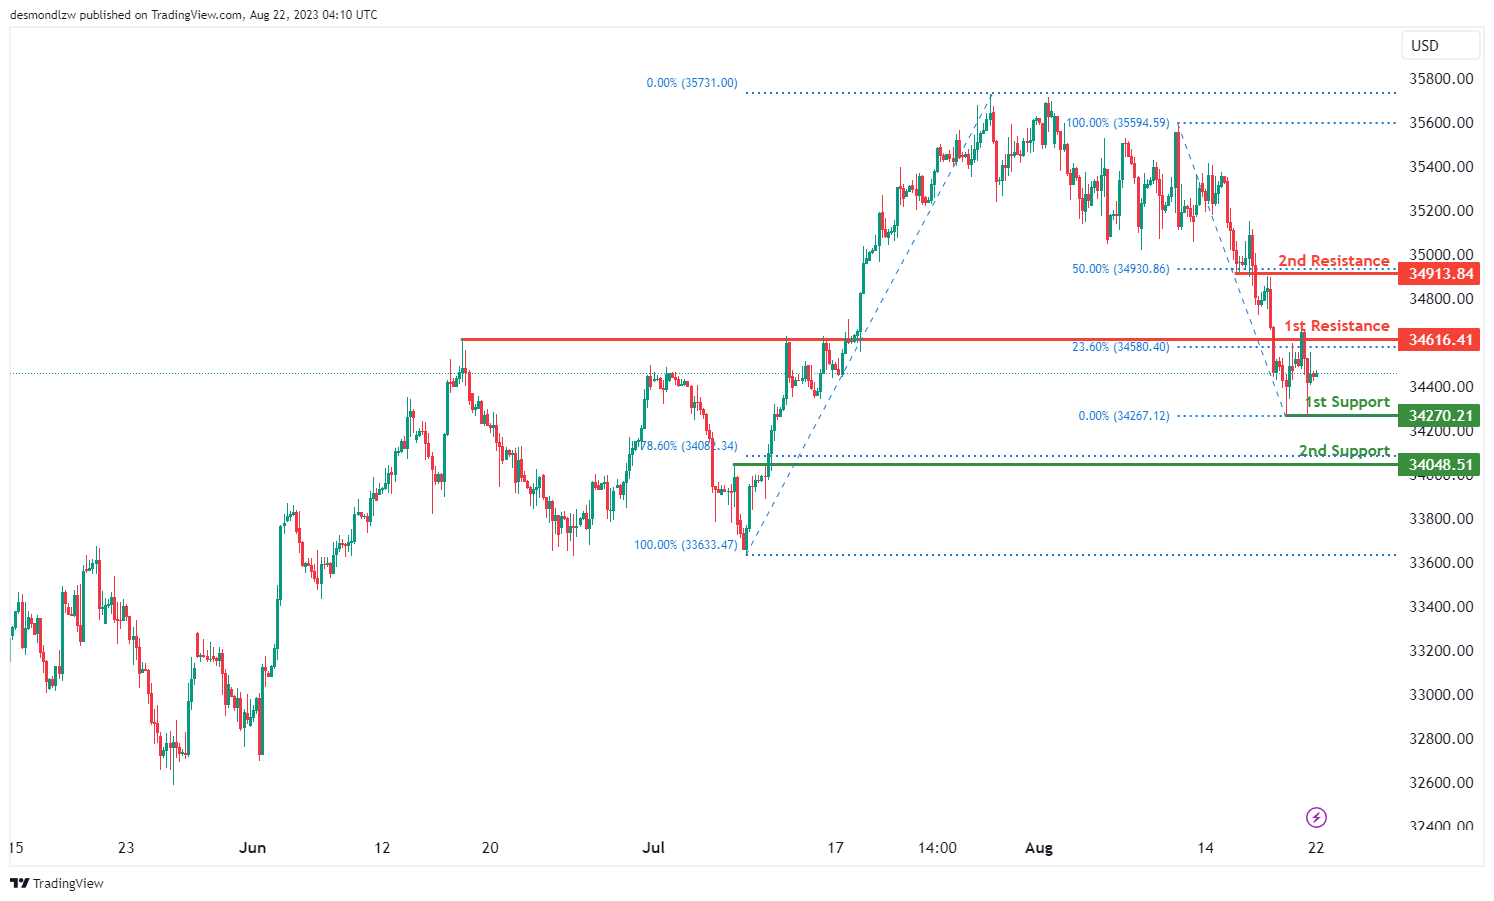
DJ30:
The DJ30 chart indicates a bullish overall momentum. There is a potential for a bullish continuation towards the 1st resistance level.
The 1st support is positioned at 34270.21 and is considered advantageous due to its multi-swing low support characteristics. Additionally, the 2nd support at 34048.51 is valuable as it represents a pullback support, along with a 78.60% Fibonacci Retracement.
On the resistance side, the 1st resistance level at 34616.41 is noteworthy as it represents an overlap resistance, along with a 23.60% Fibonacci Retracement. Furthermore, the 2nd resistance at 34913.84 is significant as it represents a pullback resistance and has a 50% Fibonacci Retracement association.
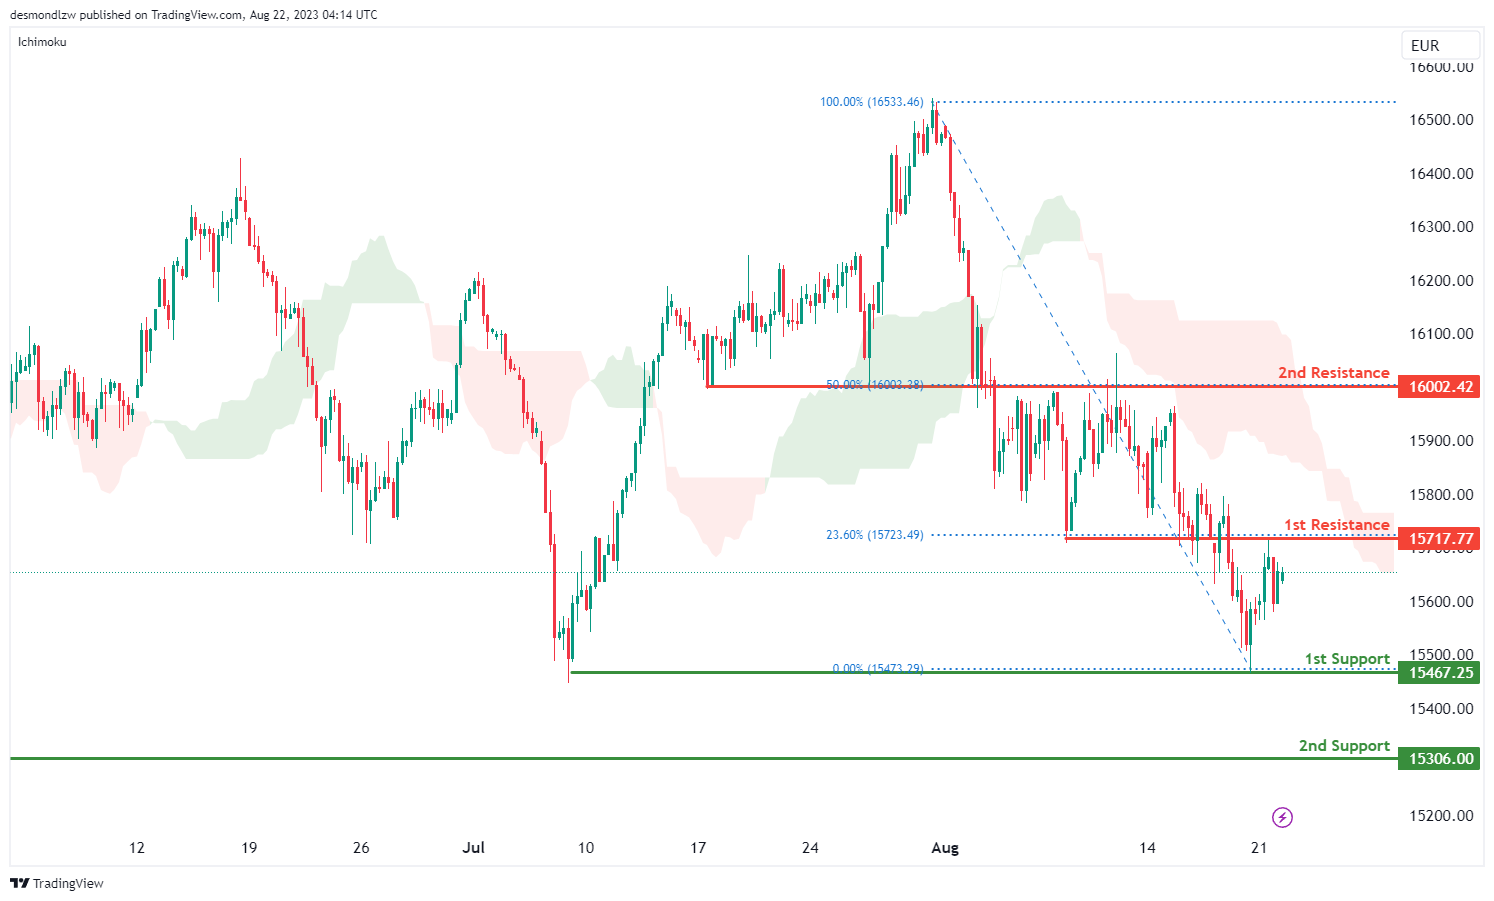
GER30:
The GER30 chart indicates a bearish overall momentum. The contributing factor to this momentum is that the price is currently below the bearish Ichimoku cloud, which suggests a bearish market trend.
There is a potential scenario where the price might rise towards the 1st resistance level in the short term, but then reverse off it and drop towards the 1st support.
The 1st support is located at 15467.25 and is considered advantageous due to its multi-swing low support characteristics. Additionally, the 2nd support at 15306.00 is valuable as it represents a pullback support.
On the resistance side, the 1st resistance level at 15717.77 is noteworthy as it represents an overlap resistance. Furthermore, the 2nd resistance at 16002.42 is significant due to its pullback resistance attributes, as well as its association with the 50% Fibonacci Retracement.
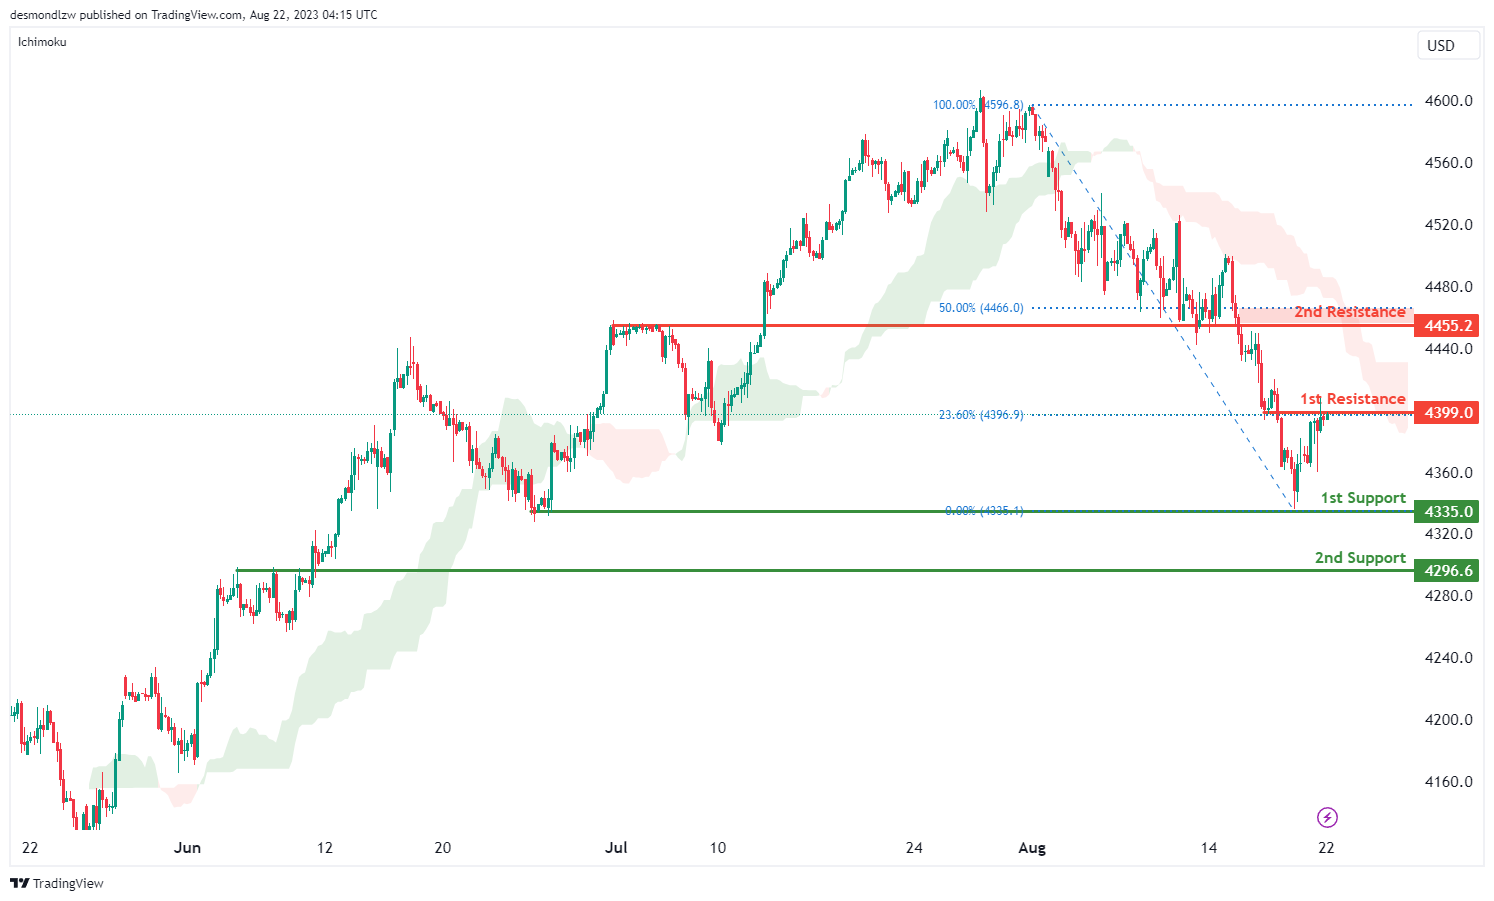
US500
The US500 chart indicates a bearish overall momentum, and this is reinforced by the fact that the price is currently below the bearish Ichimoku cloud.
There is a potential for a bearish reaction off the 1st resistance level, leading the price to drop towards the 1st support.
The 1st support is located at 4335.0 and is considered advantageous due to its multi-swing low support characteristics. Additionally, the 2nd support at 4296.6 is valuable as it represents a pullback support.
On the resistance side, the 1st resistance level at 4399.0 is noteworthy as it represents a pullback resistance, along with a 23.60% Fibonacci Retracement. Furthermore, the 2nd resistance at 4455.2 is significant due to its overlap resistance attributes, as well as its association with the 50% Fibonacci Retracement.
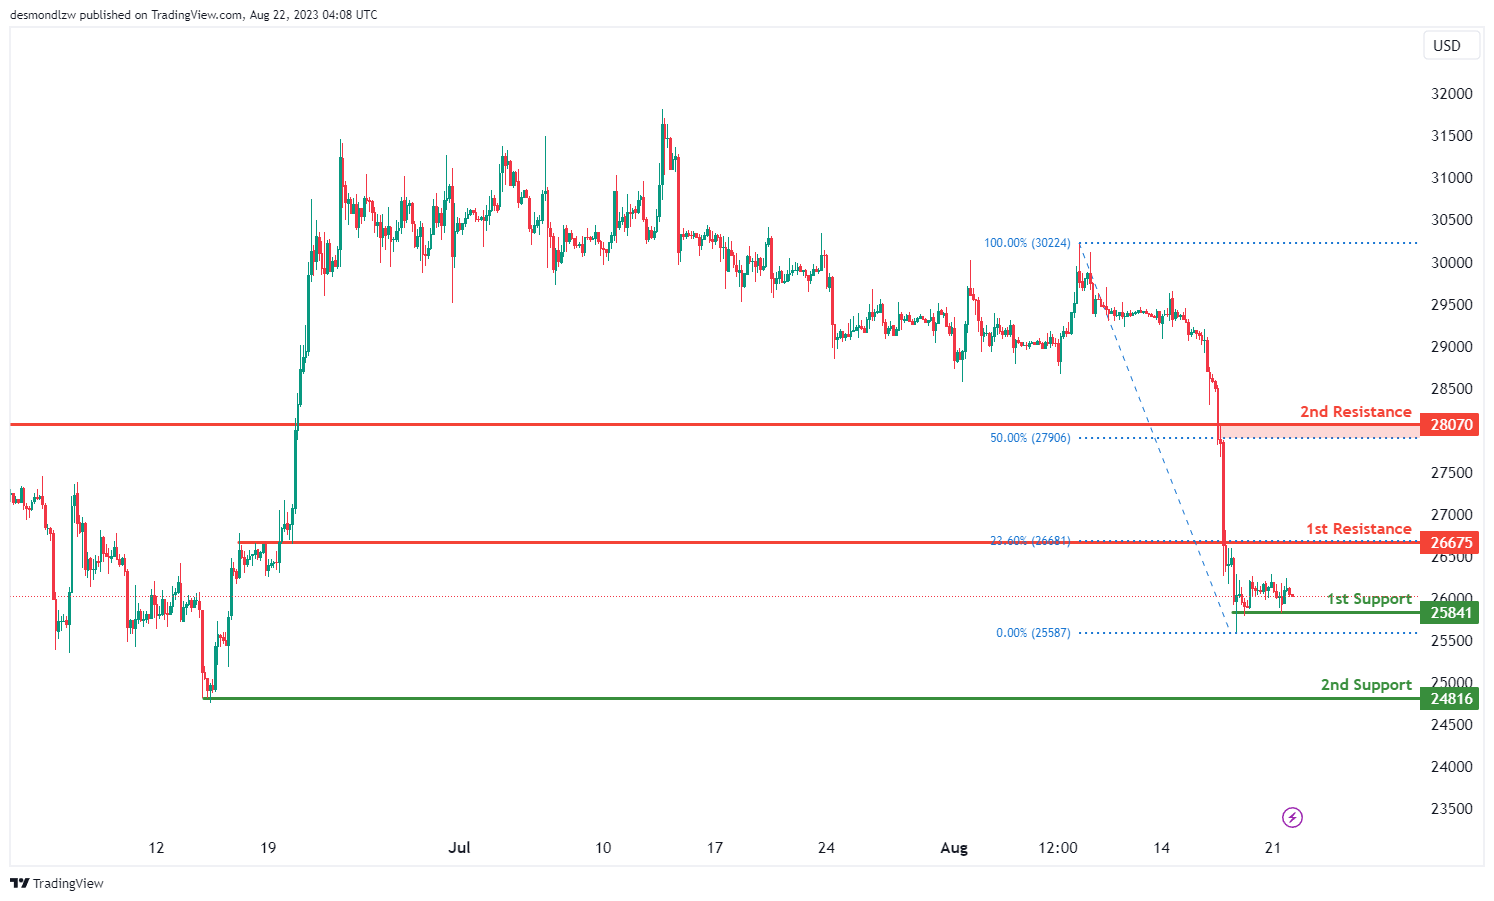
BTC/USD:
The BTC/USD chart indicates a bearish overall momentum. There is a potential for a bearish continuation towards the 1st support level.
The 1st support is positioned at 25841 and is considered advantageous due to its multi-swing low support characteristics. Additionally, the 2nd support at 24816 is valuable as it represents a swing low support.
On the resistance side, the 1st resistance level at 26675 is noteworthy as it represents an overlap resistance, along with a 23.60% Fibonacci Retracement. Furthermore, the 2nd resistance at 28070 is significant due to its overlap resistance attributes, as well as its association with the 50% Fibonacci Retracement.
ETH/USD:
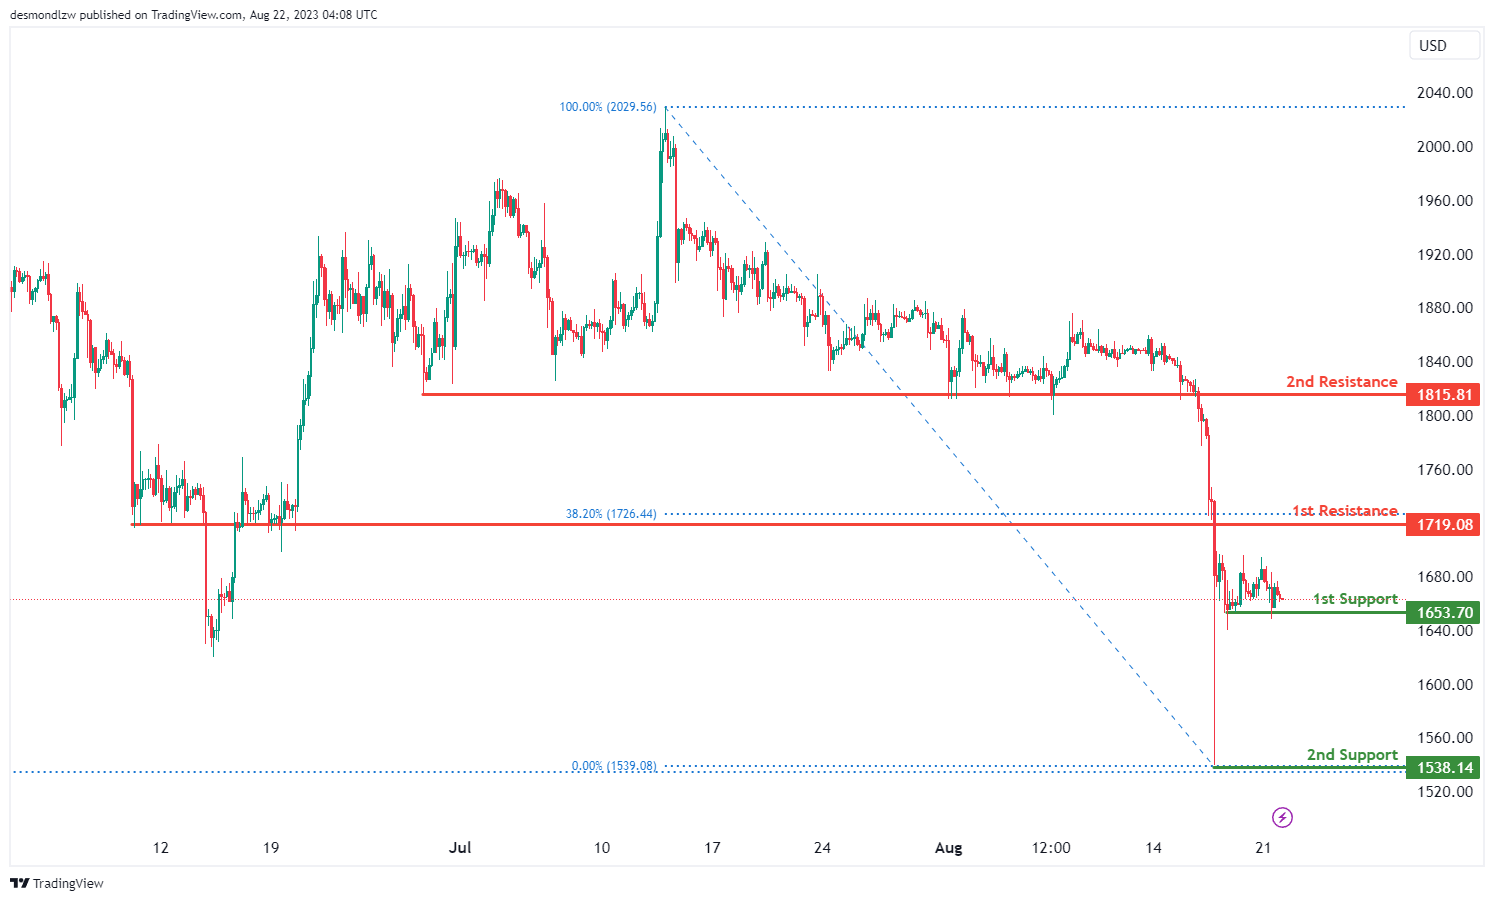
The ETH/USD chart indicates a bearish overall momentum. There is a potential for a bearish continuation towards the 1st support level.
The 1st support is located at 1653.70 and is considered advantageous due to its multi-swing low support characteristics. Additionally, the 2nd support at 1538.14 is valuable as it represents a swing low support.
On the resistance side, the 1st resistance level at 1719.08 is noteworthy as it represents an overlap resistance, along with a 38.20% Fibonacci Retracement. Furthermore, the 2nd resistance at 1815.81 is significant as it represents a pullback resistance.
WTI/USD:
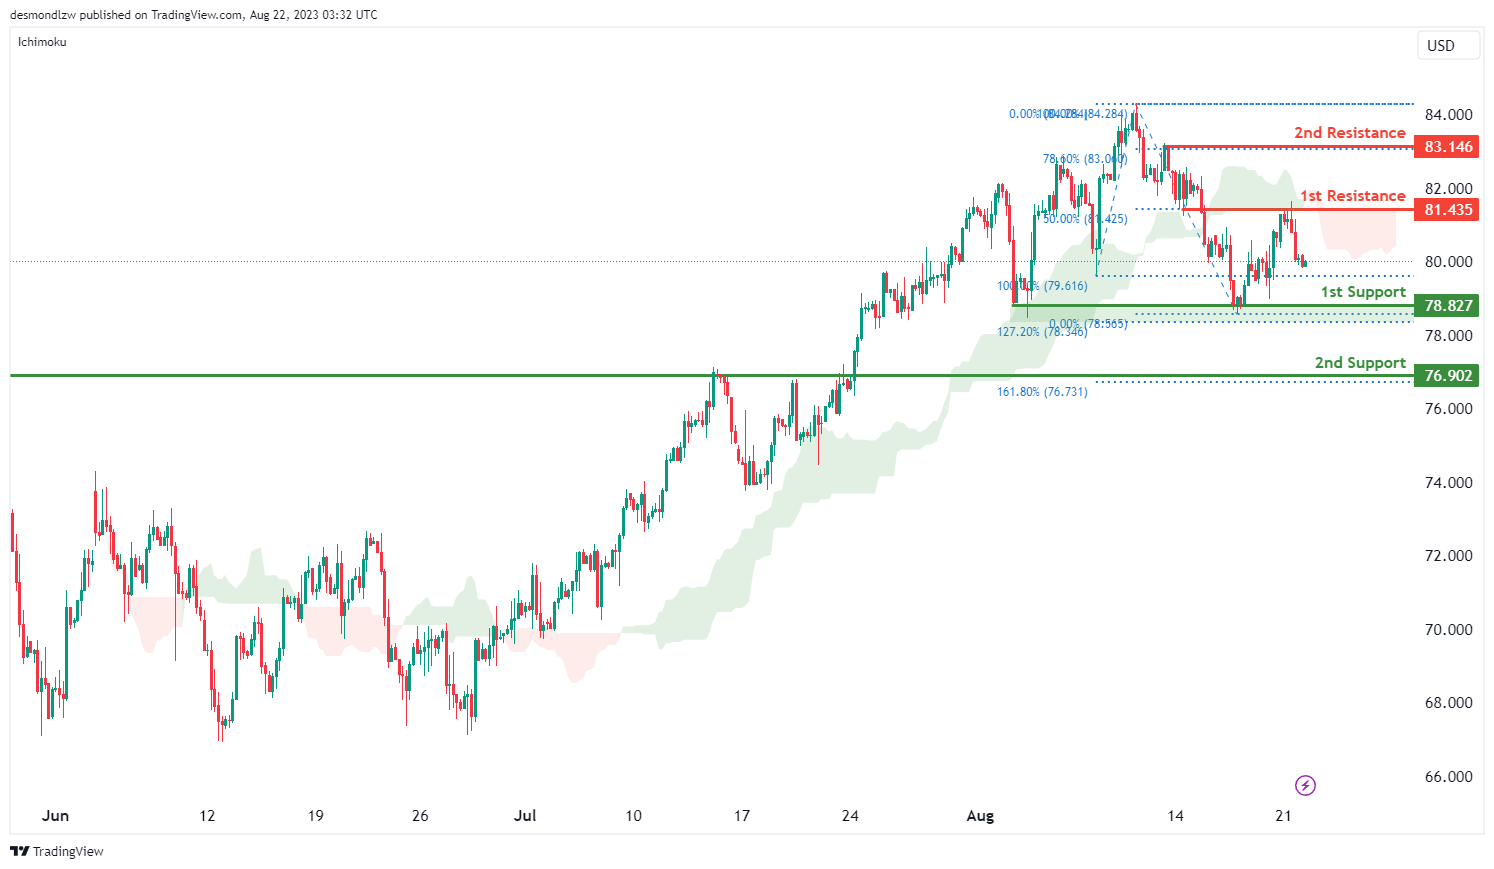
The WTI/USD chart currently exhibits a bearish momentum, indicating a prevailing downward trend that is attributed to price being positioned below the bearish Ichimoku cloud.
The 1st support level at 78.83 is identified as an overlap support that aligns with the 127.20% Fibonacci extension level. Similarly, the 2nd support at 76.90 is also identified as an overlap support that aligns with the 161.80% Fibonacci extension level.
To the upside, the 1st resistance level at 81.44 is identified as an overlap resistance that aligns with the 50.00% Fibonacci retracement level. Furthermore, the 2nd resistance at 83.15 is identified as a pullback resistance that coincides with the 78.60% Fibonacci retracement level.
XAU/USD (GOLD):
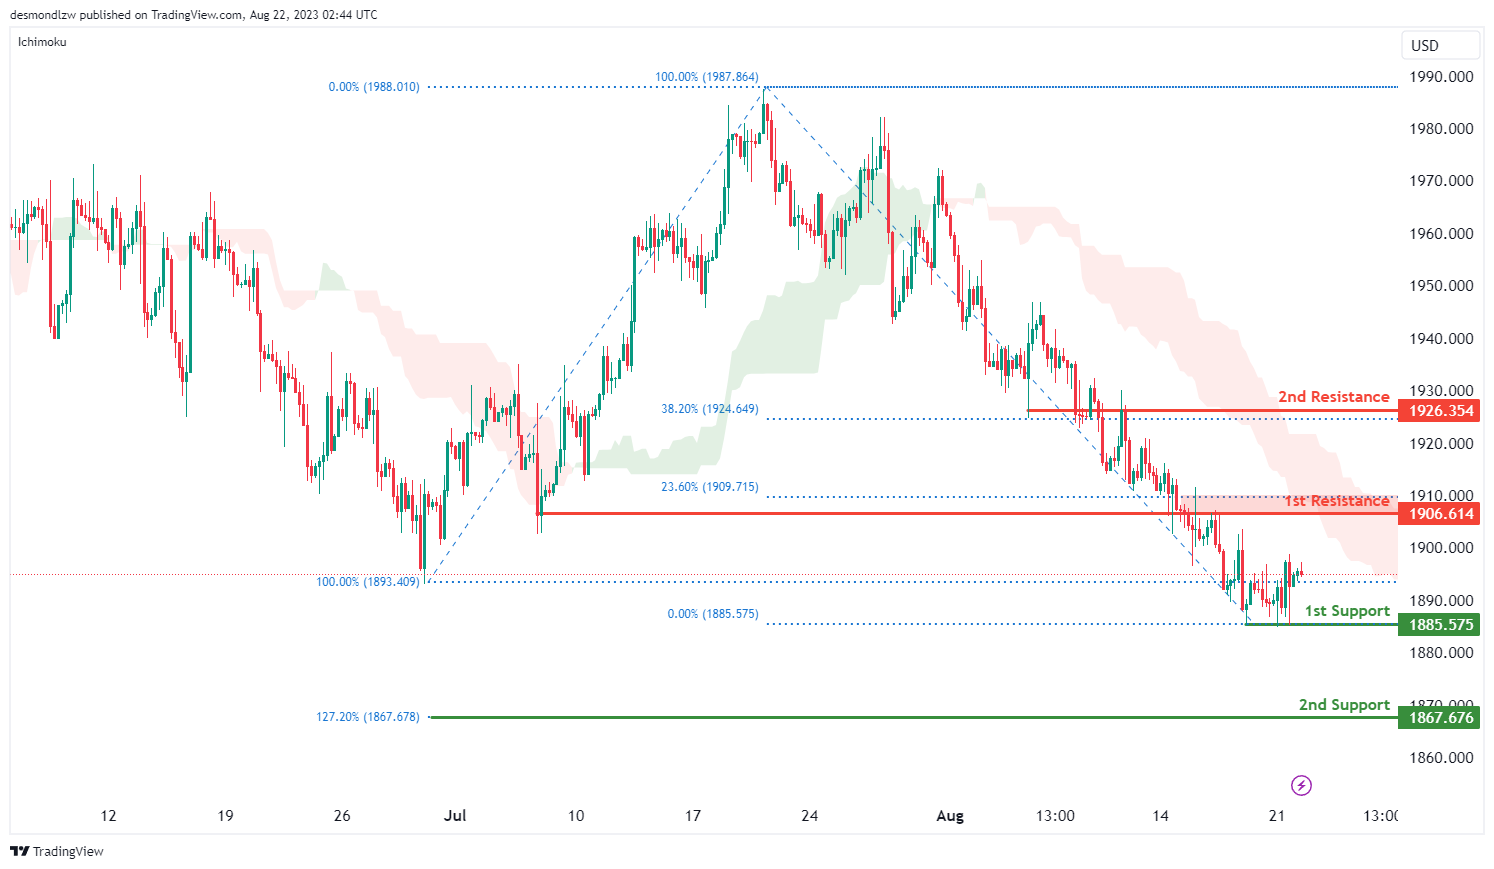
The current chart momentum suggests a neutral trend in the market, with no clear indications of strong bullish or bearish movements. There is a possibility that price could fluctuate between the 1st resistance and the 1st support levels.
The 1st support at 1885.58 is identified as a multiple swing-low support. Additionally, the 2nd support at 1867.68 is identified as a support level that aligns with the 127.20% Fibonacci extension level.
To the upside, the 1st resistance at 1906.61 is identified as an overlap resistance that aligns with the 23.60% Fibonacci retracement level. Similarly, the 2nd resistance at 1926.35 is also identified as an overlap resistance that aligns with a 38.20% Fibonacci retracement level.
Silver extending rebound, can it take Gold higher?
Silver's rebound from 22.21 extended higher overnight and the development should confirm short term bottoming there. A bullish scenario for Silver is that consolidation from 26.12 has completed with three waves to 22.21, after defending 61.8% retracement of 19.88 to 26.12 at 22.26 twice.
Sustained trading above 55 D EMA (now at 23.50) will bolster the bullish case for silver and bring stronger rise back to trend line resistance (now at 24.92). However, rejection by 55 D EMA will argue that current recovery is merely some short-covering profit taking, and send Silver through 22.09 support at a later stage to extend the fall from 26.12.
At the same time, Gold is still trying to defend 38.2% retracement of 1614.60 to 2062.95 at 1891.68. A stronger bounce in Silver could be accompanied by similar rebound in Gold back towards 55 D EMA (now at 1933.55). However, if the bearish case in Silver plays out, Gold would likely clear 1891.68 fibonacci support accelerate down to 100% projection of 2062.95 to 1892.76 from 1987.22 at 1817.03.
US 10-yr yield soars to 15-yr high, real yield breaks 2%
US 10-year Treasury yield ascended to an impressive 4.354%, marking its loftiest level since November 2007, before stabilizing at 4.342%. Notably, 10-year inflation-protected Treasury yield surpassed 2% threshold, the first such occurrence since 2009. This move highlights a significant journey from its year-to-date nadir, which hovered around 1%.
Adding to the mix, the ever-relevant two-year yield grazed 5% mark during the later hours of US session. This ascent falls just short of the highs registered earlier this year in both the previous month and March.
This rise can be attributed to indications of a more robust than anticipated growth across segments of the global economy. Such growth metrics are spurring speculations on central banks' potential inclination to maintain interest rates on current high levels for an extended duration than previously assumed.
As 10-year yield broke through 4.333 resistance, there are two questions now. Firstly, it's whether TNX could sustain above this resistance level. Secondly, it's whether there will be upside acceleration after clearing this resistance decisively. In any case, outlook will stay bullish as long as 4.094 resistance turned support holds. Next medium term target is 61.8% projection of 1.343 to 4.333 from 3.253 at 5.100.
GBP/USD Eyes Recovery To 1.2800 or Higher
Key Highlights
- GBP/USD is correcting losses from the 1.2620 zone.
- A major bearish trend line is forming with resistance near 1.2750 on the 4-hour chart.
- EUR/USD could struggle to recover above 1.0930.
- Gold prices are at risk of more downsides below $1,880.
GBP/USD Technical Analysis
The British Pound started a major decline from well above 1.3000 against the US Dollar. GBP/USD traded below the 1.2800 support to move into a bearish zone.
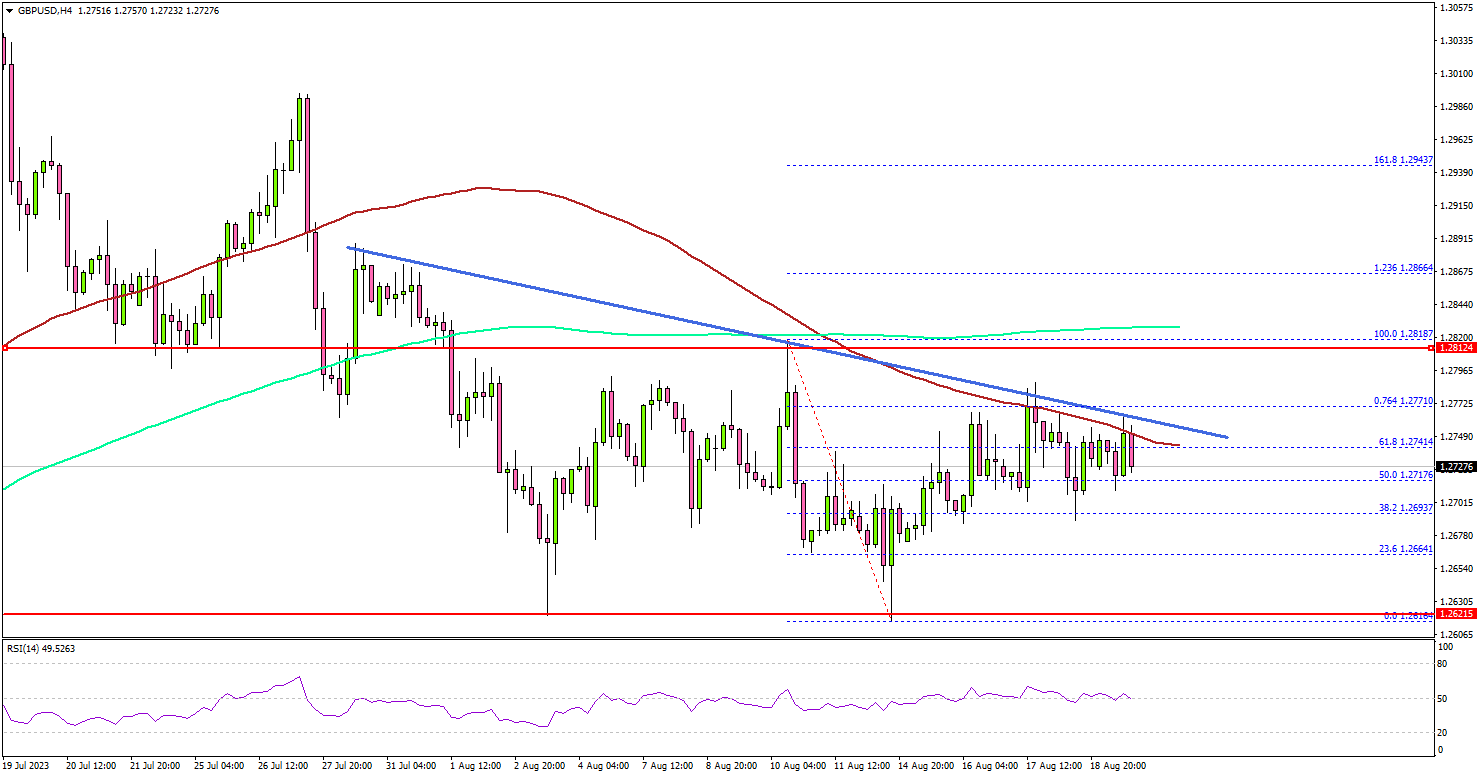
Looking at the 4-hour chart, the pair settled below the 1.2765 level, the 100 simple moving average (red, 4 hours), and the 200 simple moving average (green, 4 hours).
Finally, the bulls took a stand near 1.2620 and recently the pair started an upside correction. There was a move above the 1.2680 and 1.2700 levels. The pair climbed above the 50% Fib retracement level of the downward move from the 1.2818 swing high to the 1.2616 low.
On the upside, an initial resistance is near the 1.2750 level. There is also a major bearish trend line forming with resistance near 1.2750 on the same chart.
A close above the 1.2750 resistance could start a decent increase. In the stated case, the pair could rise toward the 1.2800 level. Any more gains could start a fresh increase toward the 1.2840 level.
If not, the pair might continue lower below the 1.2685 level. The first key support is seen near the 1.2650 level. If there is a move below 1.2650, the pair could dive toward 1.2620. Any more gains might open the doors for a test of 1.2500.
Looking at Gold, the price is showing bearish signs and there could be more losses below the $1,880 level in the near term.
Economic Releases
- US Existing Home Sales for July 2023 (MoM) - Forecast -0.2%, versus -3.3% previous.