Sample Category Title
Market turbulence: Bitcoin crash and NASDAQ selloff
Markets witnessed Bitcoin's dramatic plunge over the last 12 hours, fueled by a succession of negative headlines: the escalating Ripple-SEC legal drama, reports of SpaceX's substantial Bitcoin write-down, and the bankruptcy filing of China's Evergrande. But a more important question is whether the cryptocurrency's slide mirrors is part of a larger shift in risk sentiment, underscored by this week's drop in US stocks.
The tremors in the crypto market seemed to intensify post US Federal Judge Analisa Torres' nod to the SEC's interlocutory appeal, which came shortly after a preliminary ruling favoring Ripple. The narrative was further dented the Wall Street Journal's disclosure about SpaceX's USD 373m Bitcoin value markdown in recent years, combined with the "unexpected" news of Evergrande's Chapter 15 bankruptcy protection in New York.
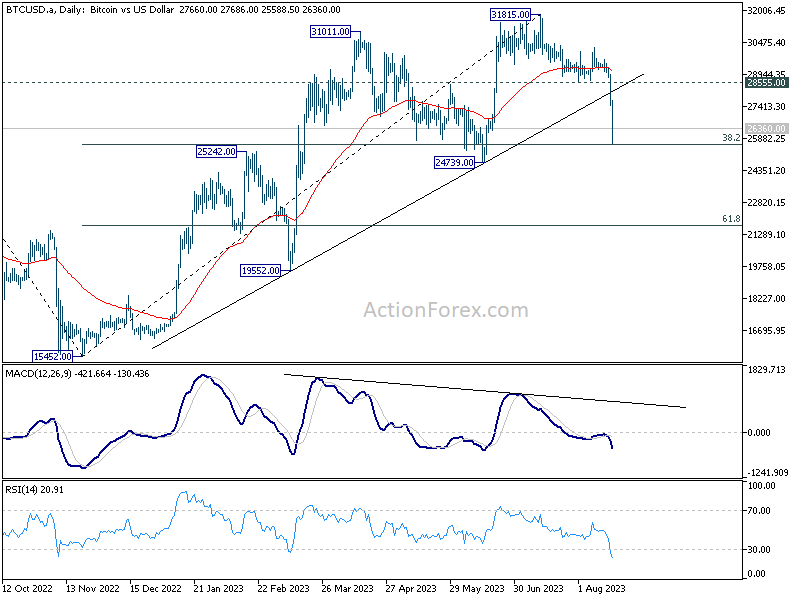
Bitcoin fell to as low as 25588 in Asian session, and recovered just ahead of 38.2% retracement of 15452 to 31815 at 25564. Risk will stay heavily on the downside as long as 28555 support turned resistance holds. Attention will be on the reaction to support zone between 24739 and 25564.
Strong rebound from this level will keep price actions from 31815 as a medium term correction only, i.e. the up trend from 15452 is not over yet. However, decisive break of this support zone will significantly raise the chance of trend reversal, and could trigger deeper acceleration to 61.8% retracement at 21702 at least.
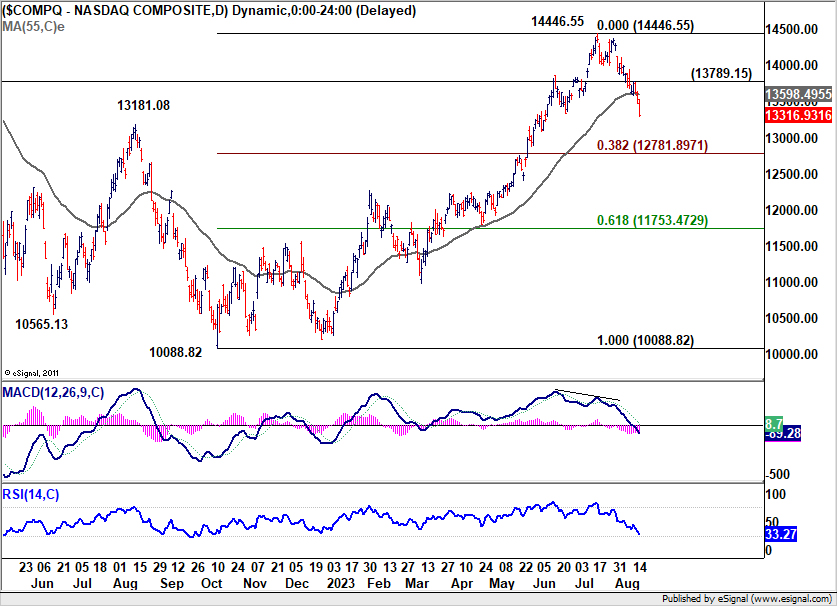
 At the same time, NASDAQ also closed sharply lower by -1.17%. Deeper fall is expected as long as 13789.15 resistance holds, to 38.2% retracement of 10088.82 to 14446.55 at 12781.89. Reaction from there will unveil whether the decline is just a correction to the rise from 10088.82, or reversing the whole trend.
Japan CPI core eased to 3.1% in Jul, but core-core back at four decade high
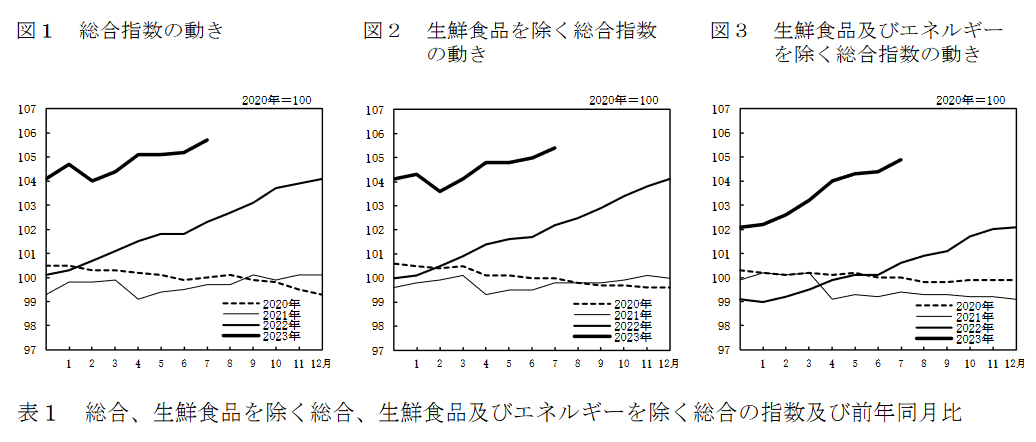
Japan's core CPI, which excludes fresh food, eased slightly from 3.3% yoy in June to 3.1% yoy in July, aligning with market expectations. Notably, this metric continued its streak above BoJ's 2% inflation target for a commendable 16 consecutive months.
Diving deeper, core-core CPI, which subtracts both fresh food and energy, inched higher to 4.3% yoy, equalling the peak seen in May. This current rate hasn't been witnessed since 1981, underscoring the latent inflationary pressures within the Japanese economy.
Processed food costs are a particular hotspot, skyrocketing by 9.2% yoy – a surge not seen in nearly half a century. Adding to this, durable goods saw a robust rise of 6.0% yoy. Furthermore, possibly driven by travel and vacationing demand, accommodation fees witnessed a significant 15.1% yoy hike during the prime summer holiday period.
Conversely, energy prices painted a contrasting picture, plummeting by -8.7% yoy. This decline can largely be attributed to government interventions, with subsidies introduced to mitigate household utility expenses. These subsidies, in turn, have played a pivotal role, dragging the core CPI lower by approximately one percentage point.
Service prices also shifted gears, moving up to 2% yoy from 1.6% yoy – the most substantial leap since 1993 if we set aside the aftermath of the 1997 sales tax hike.
Despite these intricate dynamics, headline CPI remained steadfast at 3.3% yoy.
Cliff Notes: Shifting Risks and Rhetoric
Key insights from the week that was.
Beginning in Australia, the August RBA meeting minutes underscored the Board’s growing confidence in charting a ‘narrow path’ to the inflation target, in step with their decision to leave the cash rate unchanged for a second consecutive month. This was highlighted by a more constructive tone around recent data developments, the Q2 CPI outcome considered “reassuring” and discussions of an emerging “turning point” in labour market conditions being had. While the lingering risks around the inflation and labour market outlooks were acknowledged, it is clear the Board view policy as “working as intended”, with “a credible path back to the inflation target with the cash rate staying at its present level.” Data must now arguably surpass a much higher hurdle to warrant further rate hikes.
Against that backdrop, the wage price index once again printed on the soft side, rising 0.8% (3.6%yr) over the three months to June, a rate broadly consistent with monetary policy’s objectives. Adding further support to the view is the broad-base underlying the moderation in wage inflation, both by sector and bargaining arrangement. A large increase in aggregate wages growth is anticipated in September given the 5.9% increase in the minimum wage; but the Q2 update makes it difficult to argue for a sustained lift in wage inflation beyond Q3.
The July labour force survey subsequently provided an even larger surprise as employment declined 14.6k and the unemployment rate rose from 3.5% to 3.7%. However, the signal from this update is not clear cut, with the ABS providing a partial explanation for the surprise: “July includes the school holidays, and we continue to see some changes around when people take their leave and start or leave their job.” At the outset, this context is very similar to April and May, when the survey also exhibited significant volatility. Whether July is a turning point or merely monthly volatility is yet to be determined; but, based on recent experience with the survey, the latter serves as a more consistent explanation, at least at this stage.
Regardless of the minutiae, these updates will likely ease the Board’s concerns and give credence to their on-hold policy position. With the cash rate at a sufficiently restrictive level and GDP growth likely to remain well below-trend through 2023 and 2024, inflation’s return to target looks more assured, providing scope to begin easing policy in the second half of 2024.
Offshore, it was a fairly busy week.
Across the Tasman, the Reserve Bank of New Zealand kept the OCR steady at 5.50%. This stance is considered sufficiently restrictive to bring inflation back to target. The projections, however, show that rate cuts are now expected to occur further out, from end-2024/early-2025. This change is supported by stronger near-term growth, a better-than-expected rebound in house prices and higher June quarter non-tradeable inflation which has led the RBNZ to upgrade their inflation forecast. The statement also revealed a 25bp rise in the RBNZ’s estimate of NZ’s 'neutral' rate to 2.25%, suggesting current policy settings are less restrictive than previously believed. We maintain our view for an additional rate hike at the November meeting to 5.75%. The RBNZ put a 40% probability on this additional hike, but view the most likely timing as the first half of 2024.
Moving to the US, the FOMC released its minutes for the July policy meeting. “Almost all” participants were in favour of the 25bp rise. And “most” continued to see “significant upside risks to inflation” while “Some” saw downside risks to activity and employment and a “number” believed that the risks to achieving their aims had become “more two sided”. Each subsequent decision on rates will be data dependent, with “further evidence… required… to be confident that inflation… [is] clearly on a path toward the Committee's 2 percent objective”.
Clearly on the minds of the Committee is the tension between the economy’s resilience to date, highlighted in these minutes by the staff revising away their recession forecast and a stated belief that the housing sector’s response to rate rises has peaked, and the long and variable lags with which policy and credit conditions impact -- the latter tight and getting tighter. Occurring after the July meeting, the material rise in term interest rates on both a nominal and real basis should give the FOMC greater comfort over the outlook for inflation, financial conditions becoming more contractionary as a result. We continue to believe that the next move in fed funds is down, but this requires recent trends in inflation, wages and employment to be sustained.
In the UK meanwhile, the ILO unemployment rate ticked up to 4.2% in June from 4.0% in May, above the BoE's projection of 4% for Q2 2023. However, wages ex. bonus rose 7.8%yr, a new high for the cycle. And, including bonuses, wages were up 8.2%yr, well above the Bank of England's estimate of 7.6%yr. The July CPI print was more constructive. Headline CPI printed at 6.8%yr versus June's 7.9%yr, in line with the BoE's projections. Services inflation remained robust rising 7.5%yr, but this was expected by the BoE. The proportion of the CPI basket that grew faster than the 2% target also declined to 86%, the lowest share since March 2022.
While the BoE will be pleased that inflation has not upstaged their forecasts, as has been common in the past, wages pressures remain a worry. Ahead, the BoE will need to determine whether their estimate of the unemployment rate required to bring inflation back to target needs to be upgraded. If unemployment needs to rise further than previously expected, rates will likely need to be higher for longer. This contrasts with current expectations that, once inflation is contained, rate cuts will be swift.
Back in Asia, China's July partial activity data continued recent trends. Fixed asset investment ex. rural was up 3.4%ytd, the resilience as a result of tech manufacturing, utilities, and other infrastructure. Much of the strength, however, came from investments by state-owned enterprises and local government authorities, with private investment –0.5%ytd. Weak private sector investment is a symptom of the poor confidence plaguing China's businesses/consumers and the structural change underway in China’s economy – i.e. old large industry shrinking as up-and-coming higher-tech production expands.
Poor consumer confidence also clearly resulted in the lower than expected 7.3%ytd growth in retail sales. This concern won't abate until the labour market strengthens and the property market turns decisively – authorities deciding to suspend the youth unemployment rate to improve its statistical foundations definitely won’t help the situation. A dwindling pipeline of uncompleted projects and weak housing sales and starts meanwhile led to an 8.5%ytd fall in property investment. While recent RRR cuts and authorities encouraging banks to lend is helpful in building a base for activity, a rebound requires deposit requirements for home purchases to be eased further and confidence in the broader outlook. The latter can, in time, be fostered by local governments and associated entities sustaining their investment drive.
Japan's Q2 GDP surprised to the upside, rising 1.5%qtr, driven by an increase in net exports which contributed 1.8ppts. This likely came as a result of an uptick in exports of cars as manufacturers clear backlogged orders. Also note the Yen saw a significant depreciation through Q2, making Japanese exports cheaper. Domestic demand remains weak however -- household consumption contributing –0.3ppts to GDP and imports declining. Non-residential investment was also tepid. The Q2 result is a strong start for fiscal 2024 (Japan’s fiscal year begins in April), with the Bank of Japan forecasting GDP growth to sit between 1.0% and 1.3% for the year as a whole. That said, the retreat in domestic demand is in line with the Bank's view of simmering growth and the enduring need for accommodative policy. As such, we can expect the BoJ to persist with current policy settings as long as domestic demand lacks capacity to sustain robust momentum in consumer inflation.
Gold (XAUUSD) Has Scope for Further Downside
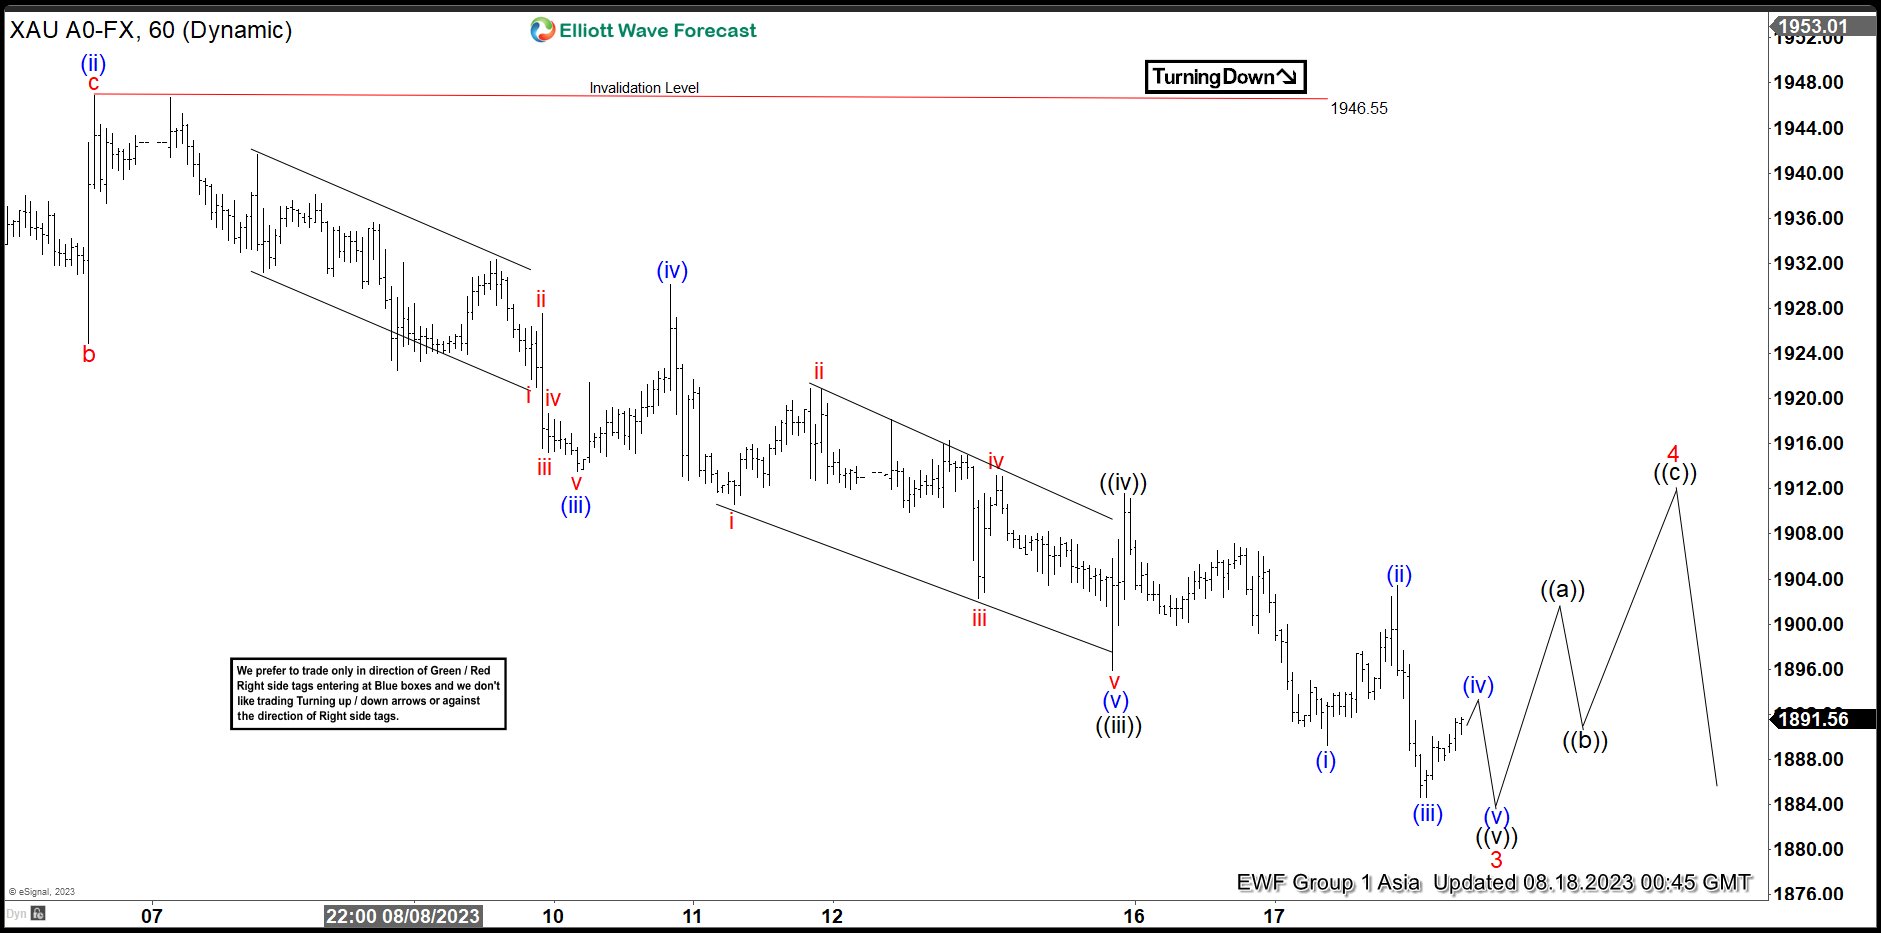
Short Term Elliott Wave structure in Gold (XAUUSD) suggests the rally in Gold on 7.27.2023 high ended wave 2. The metal now extends lower in wave 3 a 5 waves impulse. Down from 7.27.2023 high, wave ((i)) ended at 1942.1 and wave ((ii)) rally ended at 1972.35. Down from wave ((ii)), wave (i) ended at 1929.2 and wave (ii) ended at 1946.55. The 1 hour chart below shows the starting point of wave (ii) of ((iii)). From there, the metal extended lower in wave (iii) towards 1913.51 and wave (iv) ended at 1930.15. Final leg wave (v) ended at 1895.90 which completed wave ((iii)). Rally in wave ((iv))) ended at 1911.59.
Expect the metal to end wave ((v)) of 3 soon with another leg lower, then it should rally in wave 4 to correct cycle from 7.27.2023 high before it resumes lower. Near term, as far as pivot at 1946.55 high stays intact, expect rally to fail in 3 or 7 swing for further downside. Potential target lower is 100% – 161.8% Fibonacci extension from 5.4.2023 high which comes at 1685 – 1800. From this area, buyers can appear for at least 3 waves rally.
Gold 60 Minutes Elliott Wave Chart
Gold Elliott Wave Video
https://www.youtube.com/watch?v=N_nVDnC5068
Gold Wave Analysis
- Gold under bearish pressure
- Likely to fall to support level 1860.00
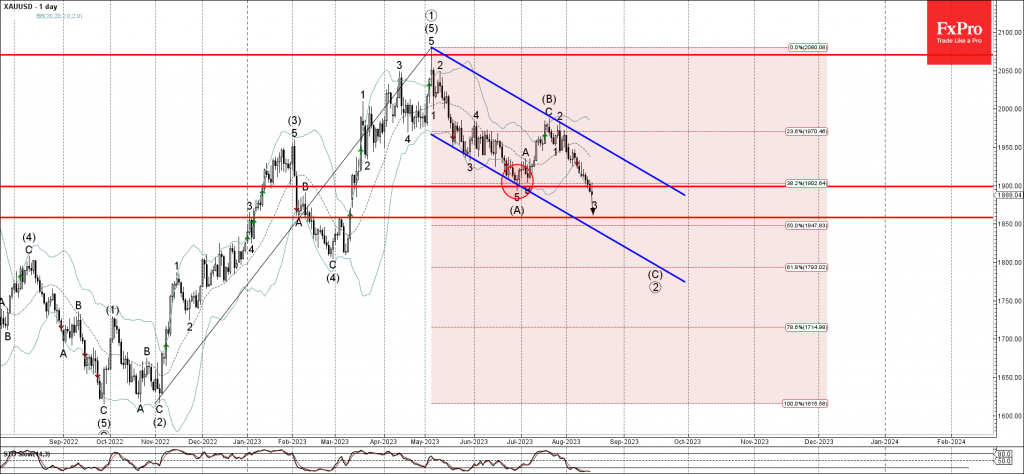
Gold under the bearish pressure after the price broke the key support level 1900.00 (which stopped the previous intermediate impulse wave (A) at the end of June).
The breakout of the support level 1900.00 accelerated both of the active impulse waves 3 and (C).
Gold can be expected to fall further toward the next support level 1860.00 (target for the completion of the active impulse wave 3).
EURGBP Wave Analysis
- EURGBP broke key support level 0.8550
- Likely to fall to support level 0.8500
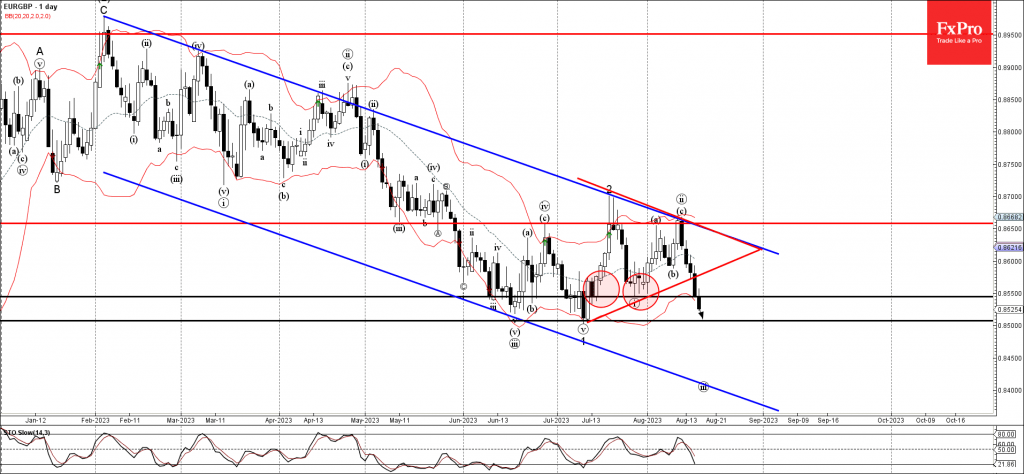
EURGBP currency pair recently broke the key support level 0.8550 (which stopped the previous minor impulse wave (i) at the end of July).
The breakout of the support level 0.8550 accelerated the active impulse wave iii which started earlier from the key resistance level 0.8660.
Given the prevailing daily downtrend and strong sterling gains, EURGBP can be expected to fall further toward the next support level 0.8500 (low of the previous impulse wave 1 from the start of July).
US Manufacturing Accelerates
The US manufacturing sector is showing impressive expansion. The latest data from the Philadelphia Fed Manufacturing Business Outlook Index jumped from -13.5 to +12.0 in August, against forecasts of -9.8. This is the first time since August last year that the index has been in positive territory, and even with such a significant jump, it reinforces the positive signals from the Fed’s publications the day before.
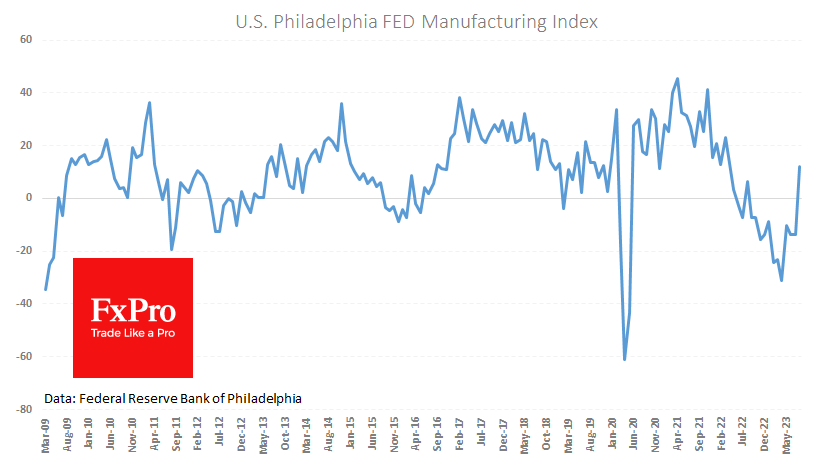
On Wednesday, the Fed reported that industrial production grew by 1% versus expectations of 0.3%. Today’s Philly Fed estimates point to even more robust growth in August.
The night before, markets were unarmed by the FOMC minutes, which highlighted inflationary risks, while the media prepared us for a softer stance on interest rates.
Upbeat macro reports recently have boosted expectations of a Fed Funds rate hike on 1 November. The probability of this outcome is now estimated at 41%, up from 31% a week ago.
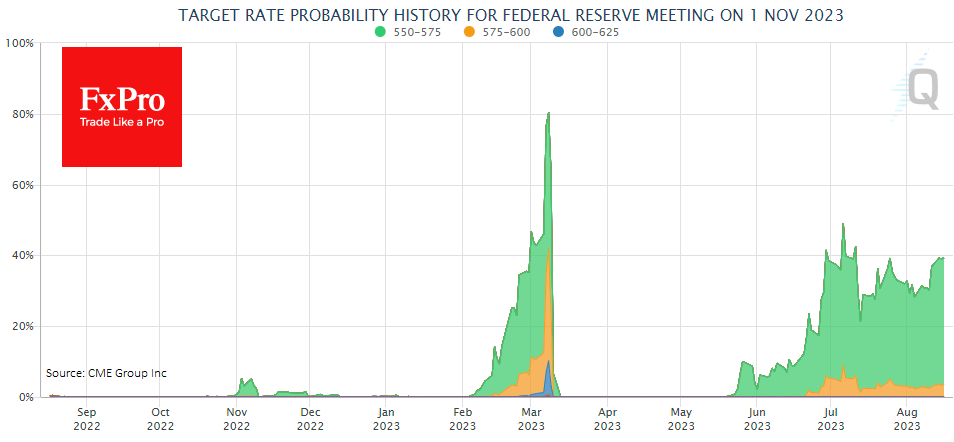
Theoretically, this is good news for the dollar and bad news for the stock market and other risky assets. In practice, the market is in no hurry to panic, with the S&P500 down over 4% since the start of the month and the Dollar Index down 0.3% since the beginning of the day after seven sessions of gains.
Sunset Market Commentary
Markets:
The long end of the US yield curve remains in sell-off mode. The US 30-yr yield is the first to arrive at the 2022 cycle top (4.42%), setting a minor new intraday high; the highest level since 2011. The US 10-yr yield tried to do the same at 4.34%, but the attempt was blocked by the technical bump at the very long end. Decent US eco data nevertheless suggest that another push is possible. Weekly jobless claims as expected fell from around 250k to 239k. The August Philly Fed business outlook posted a huge upward surprise, rising from -13.5 to 12 (vs -10.4 expected). It’s the best level since April 2022. Details showed improvements in new orders (first positive reading in the diffusion index in over 6 months) and shipments. The number of employees deteriorated marginally, but the average workweek increased (also first positive in over half a year). The majority of firms continues to see increases in both prices paid and received. The 6-month forward looking gauge fell back after last month’s extreme surge, but the reading is still the most rosy since April 2022. Daily US yield changes range between -2.7 bps (2-yr) and +5.5 bps (30-yr) at the time of writing. The outperformance at the front end is technically inspired after failing to take out the psychological 5% mark. German Bunds and UK Gilts face selling pressure as well today with German yields adding 1.5 bps (2-yr) to 4.2 bps (30-yr) and UK yields up 2.1 bps (2-yr) to 5.7 bps (10-yr). Central bankers remain in holiday modus ahead of next week’s Jackson Hole gathering with ECB Kazaks being exception to the rule. He said that future increases in interest rates, if any, will be really very small especially compared with the big rise behind us. European money markets are currently split 50/50 over whether or not the ECB will lift its policy rate to 4% at the September meeting – our preferred scenario. Just like the Fed, the Lagarde and co are officially in data dependence modus. August CPI data are due August 31 and could be pivotal.
The dollar failed to eke out more gains with EUR/USD returning above 1.09 without actually testing the July low at 1.0834. The Japanese yen gets some marginal breathing space (USD/JPY < 146), but the markets seems prepared that FX interventions might follow later on in case of renewed weakness towards the 150-area (where the MoF intervened back in October). On Tuesday, Finance Minister Suzuki already said that he had been watching market trends with a sense of urgency. EUR/GBP is going nowhere today, changing hands around 0.8540.
News & Views:
The Norwegian central bank raised its policy rate as expected by 25 bps to 4%, the highest level since end 2008. Governor Ida Wolden Bache said that the policy rate will be raised further in September is the economy evolves as currently expected. Activity in the Norwegian economy remains high, and the labour market is tight. At the same time, the policy rate is having a tightening effect, and pressures in the economy are easing. Consumer price inflation has edged down but remains high and markedly above the target. Underlying inflation has remained elevated. If the krone proves to be weaker than previously projected or pressures in the economy persist, a higher policy rate than signalled in June (4.25%) may be needed to bring down inflation. Norwegian swap rates rose by 6-7 bps across the curve today. The Norwegian krone fails to profit and remains weak at around EUR/NOK 11.50.
The top US official for the Indo-Pacific region, Kurt Campbell, said that US President will tomorrow announce a trilateral agreement with Japan and South Korea to boost deterrence against North Korea and China. The deal includes a leader-level hotline, annual military exercises an annual summit and the creation of a mechanism to share intelligence. The “Camp David princimples” will be presented together with Japanese PM Kishida and South Korean President Yoon Suk Yeol.
Japanese Yen Rebounds, Key Inflation Data Next
- Japanese yen rebounds, but intervention worries remain
- Japan releases July inflation on Friday
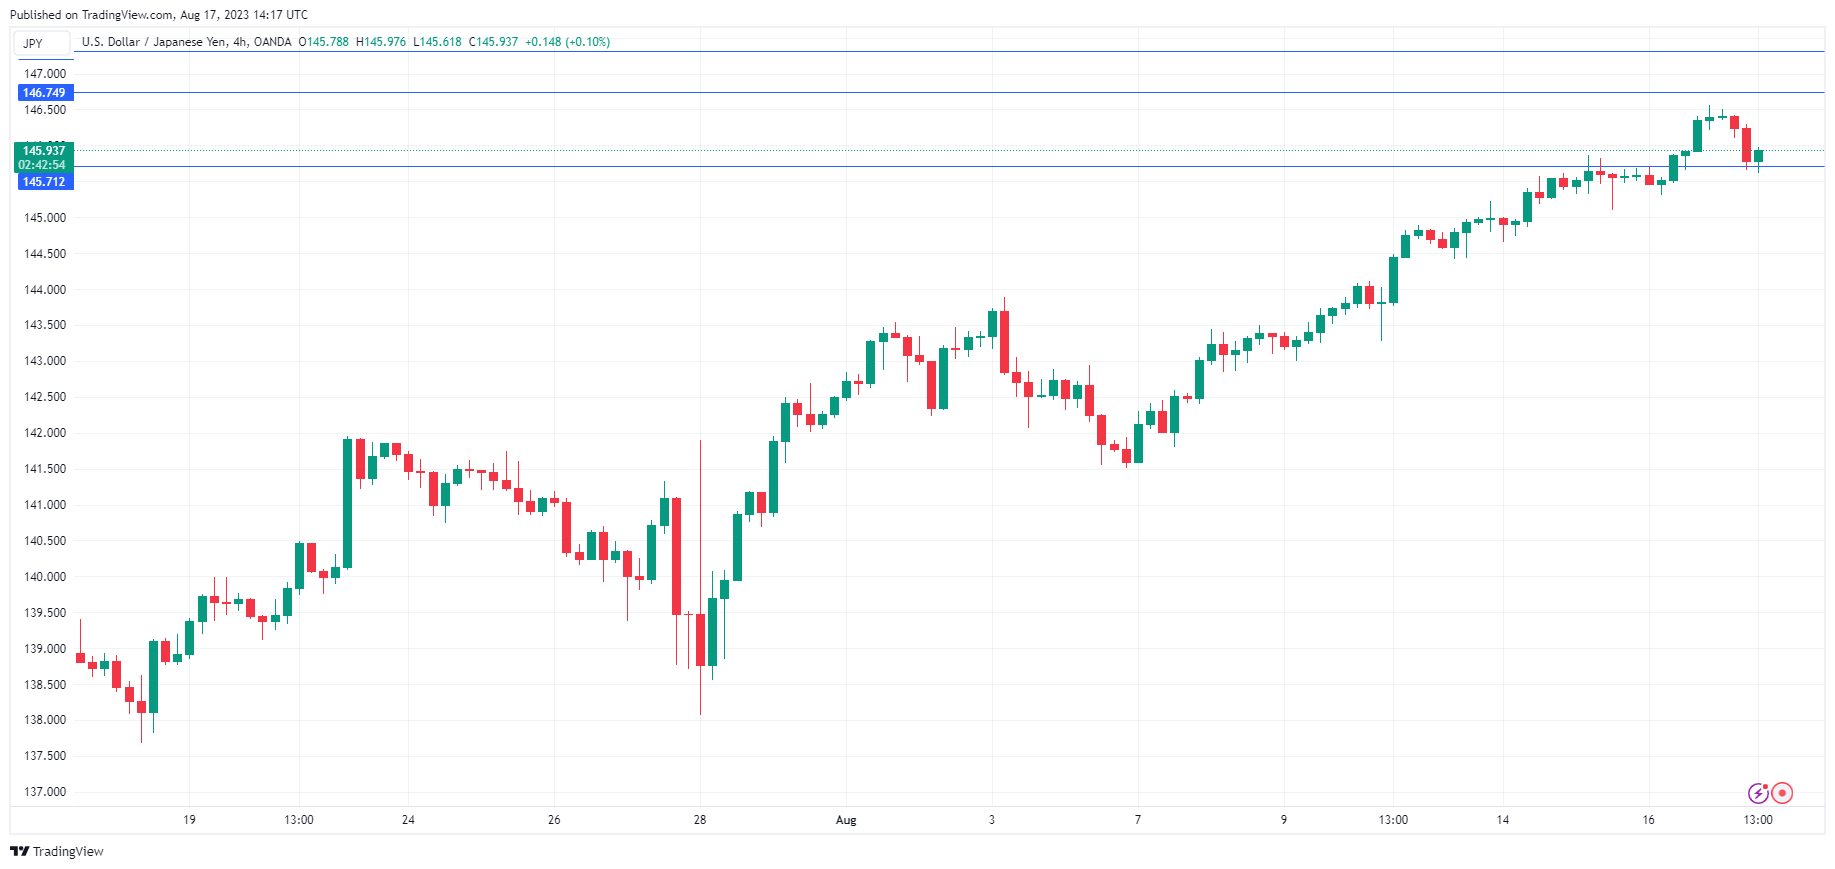
The Japanese yen has bounced back on Thursday after failing to post a winning day since August 4th. In the North American session, USD/JPY is trading at 145.92, down 0.30%.
USD/JPY has been the worst performer among the major currencies over the past month, declining about 7%. The yen dropped below the 146 line on Wednesday which marked a new nine-month low. The Japanese currency lost ground in the aftermath of the Federal Reserve minutes, in which members expressed concern about high inflation.
The sharp depreciation of the Japanese currency is raising concerns that Japan’s Ministry of Finance (MOF) could respond by intervening in the currency markets in order to prop up the yen. The yen is now trading at levels at which the MOF shocked the markets last September and instructed the Bank of Japan to sell billions of dollars in support of the yen.
The MOF and the BoJ have stated in the past that they are more concerned with sharp swings in the exchange rate and not so much with a particular value for the yen. The yen has plunged about 800 points since late July which means that another intervention cannot be ruled out. The US/Japan rate differential has been widening, with the yen depreciating as a result. The economic troubles in China have led to a sharp drop in the Chinese yuan, which is another factor weighing on the ailing yen.
Japan releases the July CPI inflation report on Friday. Headline CPI is expected to fall from 3.3% to 2.5%, while the core rate is projected to dip from 3.3% to 3.1%. The ‘core-core’ rate, which excludes food and energy items, is projected to rise to 4.3%, up from 4.2%. Any surprises from the inflation report could mean volatility for the Japanese yen.
USD/JPY Technical
- There is resistance at 146.74 and 147.31
- USD/JPY tested support at 145.71 earlier. Below, there is support at 144.92