

Sample Category Title
GBP/USD: Cable Taking a Breather Under New Multi-month High after Weekly Advance of Over 2%
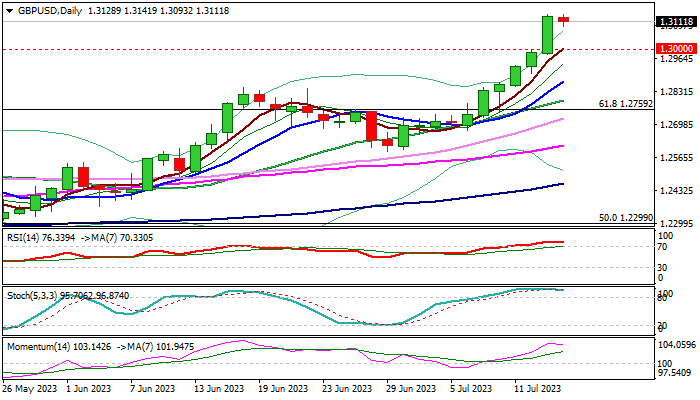
Cable is consolidating under new 15-month high (1.3141) on Friday, as bulls started to lose traction after advancing 2.1% this week.
A pause after six straight days of uninterrupted rally looks like logical scenario, as traders look for a partial profit-taking and studies are overstretched on daily chart.
However, correction is unlikely to be deep, as the dollar remains under increased pressure by receding US inflation and growing signs that the Fed will soon end rate hikes, with expectations that easing would start early next year.
Broken psychological 1.30 barrier reverted to support which should ideally keep the downside protected and offer better levels for dip-buying ahead of fresh push higher and challenge of next target at 1.3328 (Fibo 76.4% of larger 1.4249/1.0348 downtrend).
Only return below 200WMA (1.2885), former pivotal resistance, now strong support, would put bulls on hold.
Res: 1.3141; 1.3200; 1.3298; 1.3328.
Sup: 1.3076; 1.3000; 1.2885; 1.2795.
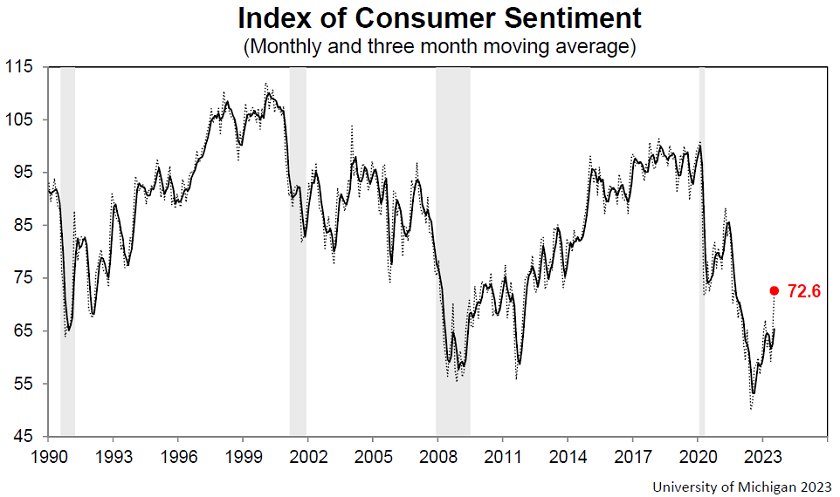
US U of Michigan consumer sentiment surged to 72.6, inflation expectation ticked up
US U of Michigan Consumer Sentiment index jumped from 64.4 to 72.6 in July, well above expectation of 65.5, that's also the highest level since September 2021. Current Economic Conditions rose from 69.0 to 77.5. Consumer Expectations Index also surged from 61.5 to 69.4.
"As seen in the chart, sentiment is now about halfway between the all-time historic low of 50 from June 2022 and the February 2020 pre-pandemic reading of 101."
Year-ahead inflation expected inched up from 3.3% to 3.4%. Long-run inflation expectation was virtually unchanged at 3.1%.
DAX Buying The Dips At The Blue Box Area
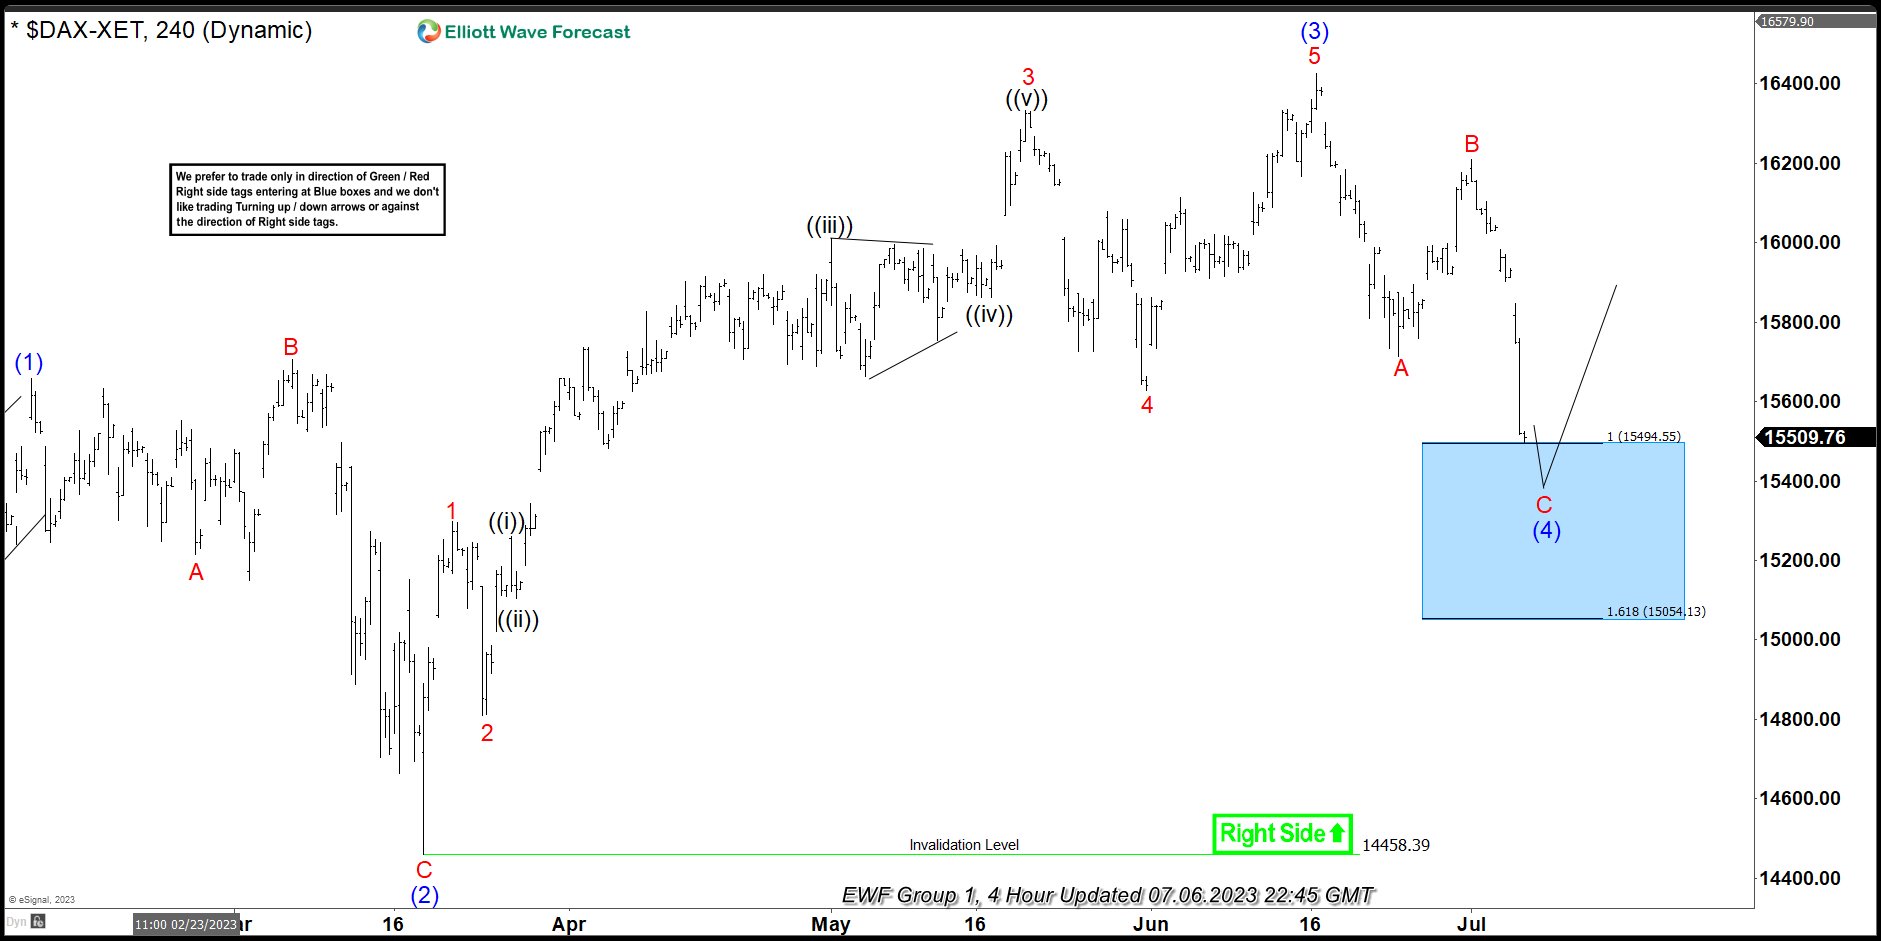
Hello fellow traders. In this article we’re going to take a quick look at the Elliott Wave charts of DAX published in members area of the website. DAX is showing impulsive bullish sequences in the cycle from the September 2022 low. Recently we got a 3 waves pull back that has ended right at the Blue Box zone (our buying area) . In the further text we are going to explain the Elliott Wave Forecast and trading setup.
DAX Elliott Wave 4 Hour Chart 07.06.2022
DAX remains bullish against the 14458.39 pivot. The Index is currently giving us pull back in 3 waves that are reaching extreme area at 15494.5-15054.1 blue box ( buying zone) . We don’t recommend selling it and prefer the long side. DAX index should ideally make a rally toward new highs or 3 waves bounce alternatively .As our members know Blue boxes are based on 100% – 161.8% Fibonacci extension area , that we trade in 3, 7, or 11 swing corrective sequence. Once bounce reaches 50 Fibs against the B red high , we will make long position risk free ( put SL at BE) and take partial profits. Invalidation for the long trades is break of 1.618 fib ext : 15054.1
Quick reminder on how to trade our charts :
Red bearish stamp+ blue box = Selling Setup
Green bullish stamp+ blue box = Buying Setup
Charts with Black stamps are not tradable. 🚫
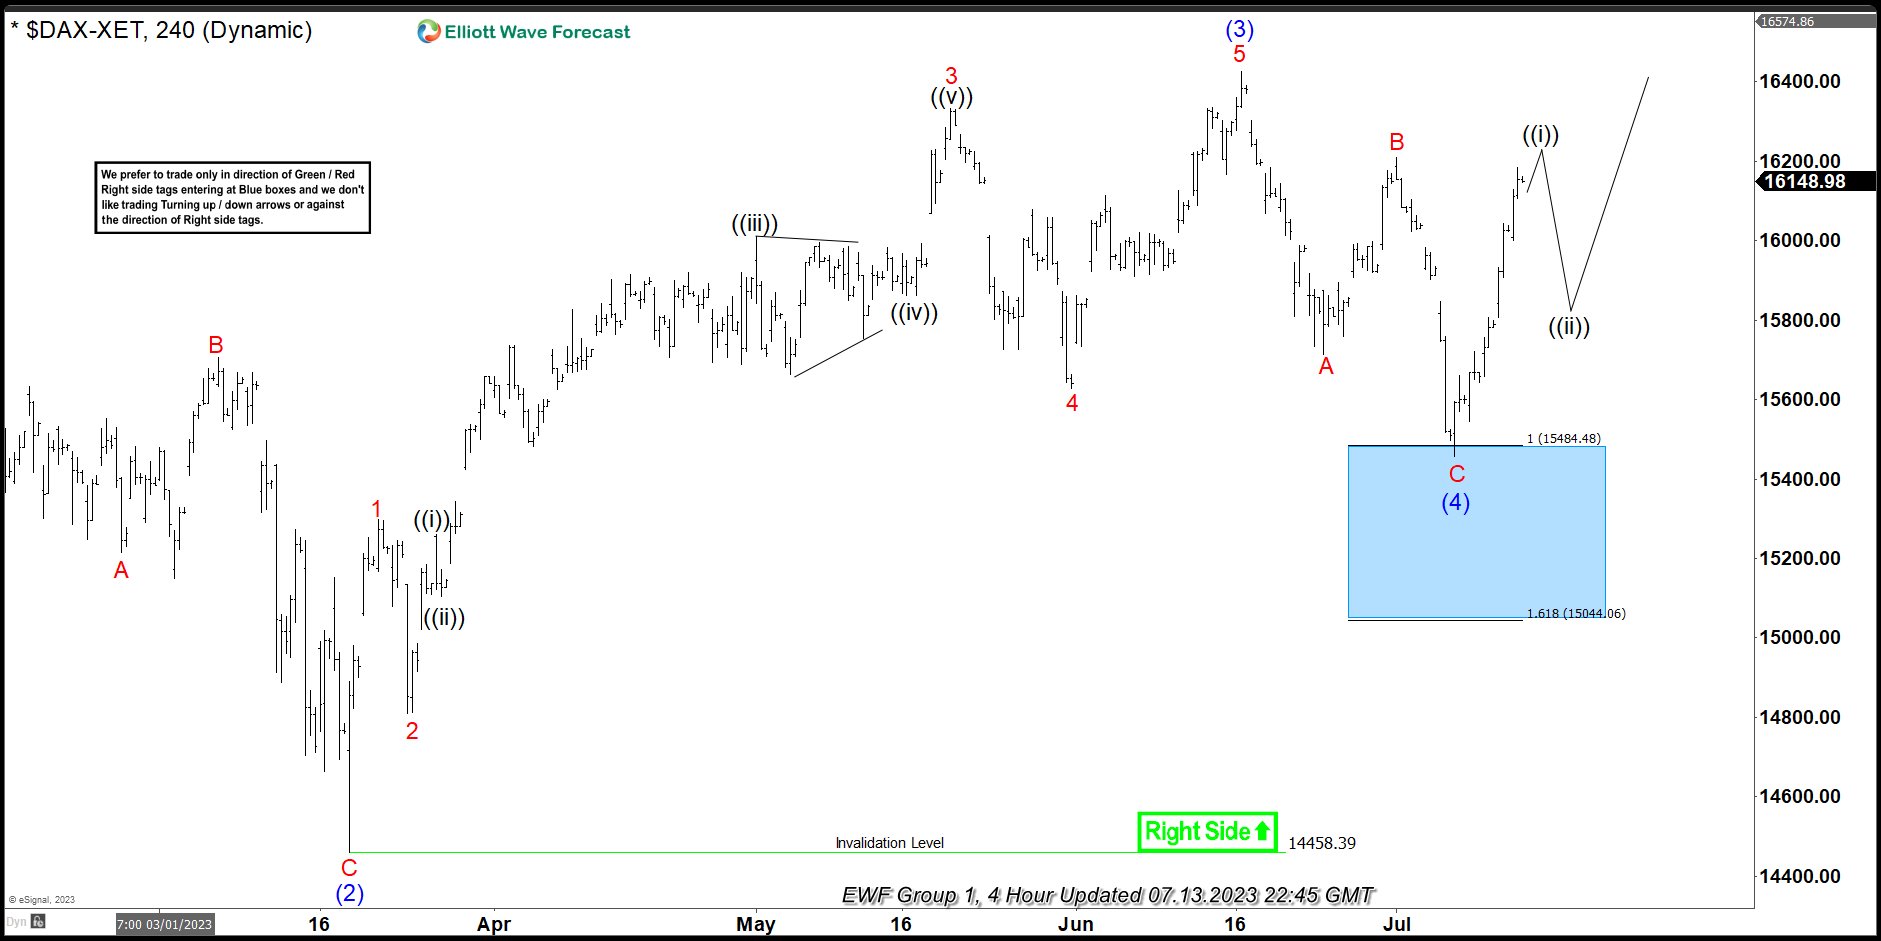
DAX Elliott Wave 4 Hour Chart 07.13.2022
DAX made very good reaction from our buying zone. The index has reached and exceeded 50 fibs against the B red high. So members who took the long trade are enjoying profits now in a risk free positions. We would like to see break of (3) blue high, to confirm next leg up is in progress.
US import prices down -0.2% mom in Jun, export prices down -0.9% mom
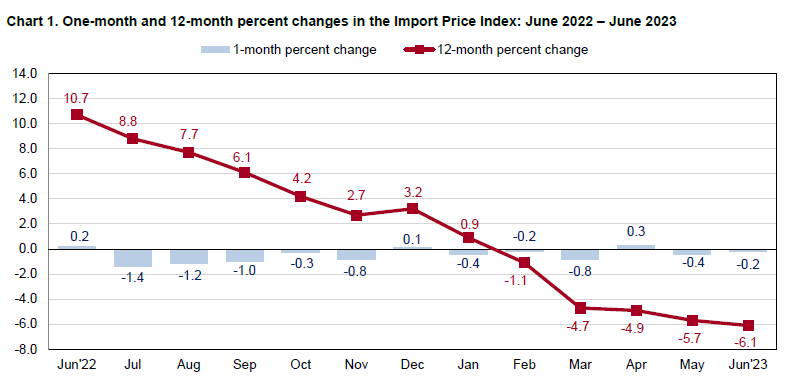
US import prices fell -0.2% mom in June, below expectation of -0.1% mom. Import prices have fallen in 5 of the first 6 months of this year. For the year, import prices fell -6.1% yoy, largest annual decline since May 2020. Lower nonfuel prices (-0.4% mom) more than offset higher fuel prices (0.8% mom).
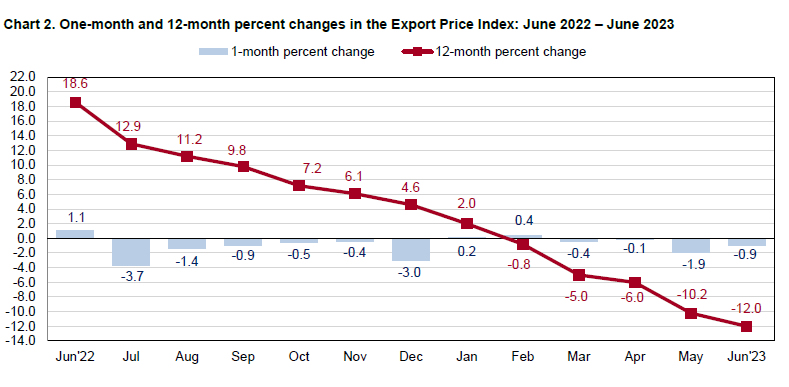
Export prices fell -0.9% mom. Agricultural exports prices fell -1.6% mom while non-agriculture prices fell-0.9% mom. For the year, export prices were down -12.0% yoy, largest on record since 1984.
Canada manufacturing sales rose 1.2% mom in May
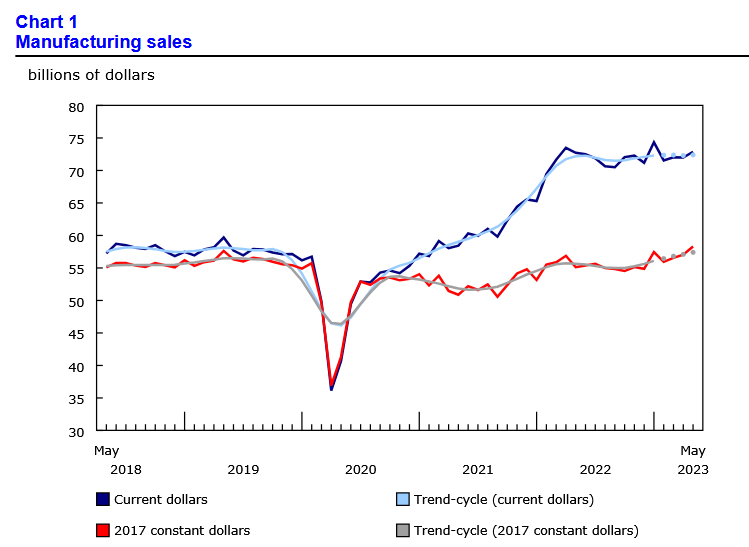
Canada manufacturing sales rose 1.2% mom to CAD 72.9B in May, above expectation of 0.8%mom. The rise was mainly driven by higher sales of chemical products (+4.8%), motor vehicles (+4.8%) and machinery (+4.2%). Sales in primary metal manufacturing decreased the most (-6.9%).
USD/JPY: Bears Lost Traction on Approach to 200DMA
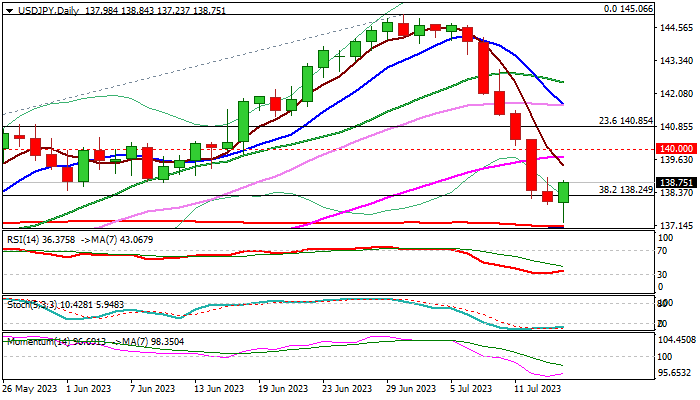
The USDJPY bounces on Friday, registering significant gains for the first time in seven days and generating initial signal of correction.
Pullback from new 2023 high (145.06), which accelerated after dollar came under increased pressure on signals of nearing end of Fed’s tightening cycle and retraced slightly over 50% of 129.64/145.06 bull-leg, faced strong headwinds on approach to converged 200/100DMA’s (137.08/00 respectively).
Deeply oversold conditions on daily chart and profit-taking at the end of the week after steep fall (down nearly 3.5% for the week) contributed to fresh strength.
Friday’s action is shaping into a hammer candlestick, which would generate initial reversal signal, though with close above the top of daily cloud (138.44) required to validate the signal and open way for stronger recovery.
Fresh bulls eye initial Fibo resistance at 139.08 (23.6% of 145.06/137.23) but will need to extend above psychological 140 barrier to confirm reversal signal on daily chart.
On the other hand, the pair is on track for big weekly loss, which is going to weigh on fresh recovery attempts.
Res: 138.24; 138.95; 139.71; 140.00.
Sup: 137.08; 136.14; 135.78; 135.00.
A Stellar Week in Response to Very Promising US Inflation Data
It's shaping up to be quite a relaxed end to the week, one in which we've seen stellar gains on the back of some very encouraging inflation data from the US.
While there have been occasions when stock markets have performed well this year despite not appearing to reflect the fundamental reality of rapid economy-threatening rate hikes, the inability to really turn a corner on inflation has held them back. But perhaps that corner is now being turned.
Inflation was already well off its highs but there was something about this report that was different. Not only did it beat on the headline and core level but both of the monthly readings were also incredibly positive. Now it's just a question of whether that can be sustained.
The light at the end of the tightening tunnel is getting brighter and investors are increasingly confident of emerging after one more hike in two weeks. At which point the focus will turn to the economy and whether a soft landing can still be achieved before the discussion pivots to rate cuts.
The next risk comes from earnings season which gets underway today, with JP Morgan, Wells Fargo, and Citigroup all reporting on the second quarter.
Oil has made incredible gains and overcome a major resistance level
Oil is trading relatively flat today but has made tremendous gains over the last couple of weeks and could still add to that over the coming sessions. The price has risen more than 13% from the lows on 28 June and, despite appearing to struggle at times yesterday, still has plenty of momentum.
The break above $80 was very significant after multiple efforts by Saudi Arabia and its allies to manipulate the price to more sustainable levels, from their perspective. It could face an interesting test around $83-$84 if it keeps rallying, while a move lower will draw attention back to $80 and whether we'll get that confirmation of the initial breakout.
Gold stalls after post-inflation boost
Gold has stalled around $1,960 after surging in the aftermath of the US inflation data earlier this week. The yellow metal had already pulled off its lows at this point in anticipation of a friendly report but what it got was so much more.
Now it's a question of whether what we're seeing is a corrective move as part of the downturn since May or if that downturn was in fact the correction. The first test is $1,960, with $1,980 and $2,000 above the next levels to overcome. These represent the 38.2%, 50%, and 61.8% Fibonacci retracement levels of the May highs to June lows, respectively. And of course, $2,000 could be a major psychological barrier.
If we do see gold pare gains, the obvious test below comes around $1,940 having been a significant resistance level in recent weeks. A rebound off here could be seen to be confirmation of this week's breakout.
Has Bitcoin finally broken higher?
Bitcoin has finally broken higher, days after risk assets throughout financial markets were boosted by the US inflation data. I can't imagine this is a lag effect or anything like that, it was extremely volatile around the release it just didn't commit in either direction. It has now broken above $31,000 after weeks of consolidation although it isn't particularly convincing at this stage. Broadly speaking, it's still trading like an instrument in consolidation.
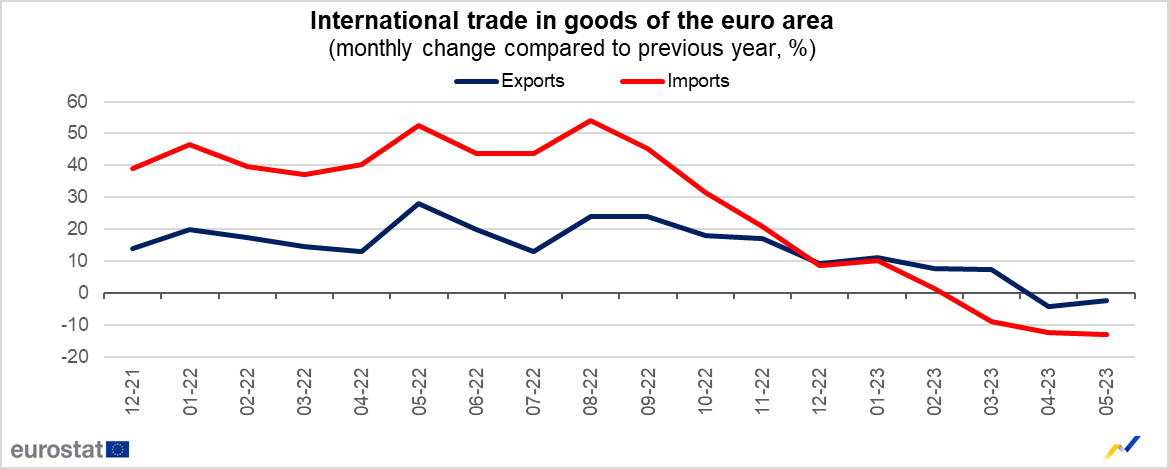
Eurozone exports down -2.3% yoy in may, imports down -12.8% yoy
Eurozone exports of goods to the rest of the world fell -2.3% yoy to EUR 241.9B in May. Imports fell -12.8% yoy to EUR 242.2B. Trade balance reported EUR -0.3B deficit. Intra-Eurozone trade fell -5.7% yoy to EUR 226.3B.
In seasonally adjusted term, exports rose 2.9% mom to EUR 239.1B. Imports fell -0.1% mom to EUR 240.0B. Trade deficit narrowed to EUR -0.9B, much smaller than expectation of EUR -10.3B. Intra-Eurozone trade fell from April's 221.6B to EUR 221.1B.
USD/JPY Technical: Torpedoed Down But Holding at 200-Day Moving Average
- USD/JPY has shed -5.4% from its 30 June 2023 high of 145.07, on sight to record its worst weekly loss since 7 November 2022.
- Today’s intraday sell-off has managed to hold at the 200-day moving average acting as support at 137.65.
- Short-term momentum has turned positive which increases the odds of a corrective rebound.
This is a follow-up on our prior analysis “USD/JPY Technical: “At risk of a minor bounce before bearish tone resumes” published earlier this week on 11 July 2023. The USD/JPY has tumbled in an almost straight-line fashion on broke below the 138.70 short-term support as highlighted.
The USD/JPY has torpedoed downwards by -5.40% from its recent high of 145.07 printed on 30 June 2023 to today, 14 July Asian session intraday low of 137.24 at this time of the writing. It has challenged the key 200-day moving average and recorded its worse weekly loss since the week of 7 November 2022.
Talks of an imminent ultra-dovish monetary policy shift from the Bank of Japan (BoJ) in the upcoming monetary policy decision meeting on 28 July have started to make their rounds again.
In today, 13 July Asian session, there are two news flows that advocate a tilt away from negative interest rates in Japan. Firstly, local Japanese media, Yomiuri reported that BoJ is likely to raise its FY 2023 annual inflation forecast to above 2% for its latest quarterly outlook report which is released on the same day as the upcoming 28 July monetary policy decision outcome.
Secondly, former BoJ official, Hideo Hayakawa commented that he is expecting another tweak to the yield curve control programme on 28 July with a more aggressive bias of 50 basis points (bps) widening on the band of around 0% on the 10-year Japanese Government Bonds (JGB) yield to 1% from the current level of 0.5%. Previously, BoJ caught markets by surprise by widening the 10-year JGB yield band by 25 bps on 20 December 2022.
Holding at key 200-day moving average
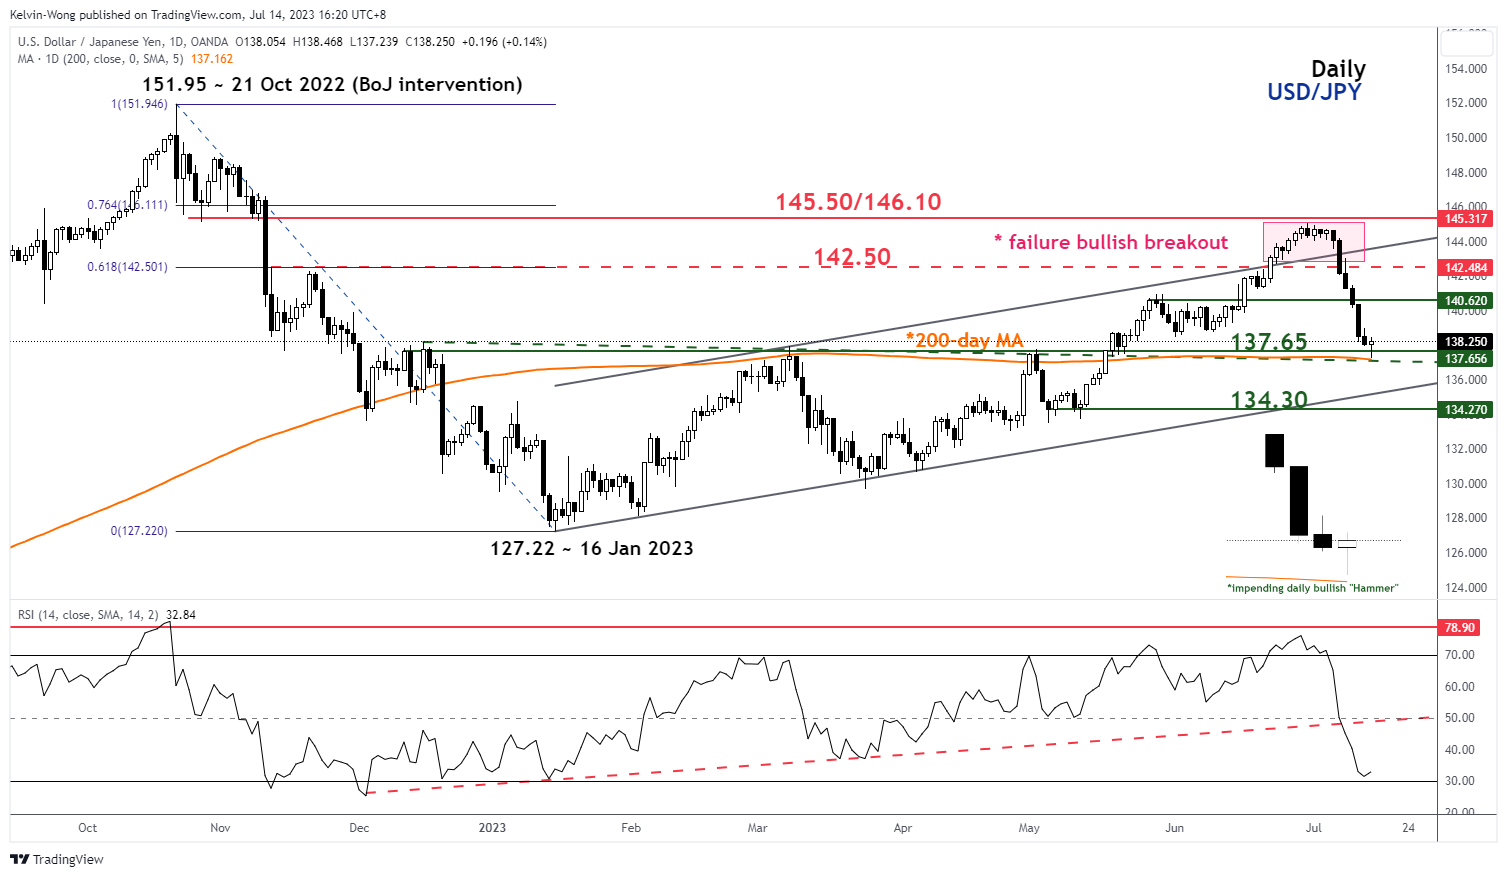
Fig 1: US/JPY medium-term trend as of 14 Jul 2023 (Source: TradingView, click to enlarge chart)
The current decline in place since 30 June 2023 has reached its 200-day moving average which confluences with a graphical support of 137.65 (former swing high areas of 15 December 2022, 8 March 2023, and 2 May 2023).
In addition, today’s price action at this time of the writing has formed an impending bullish daily “Hammer” candlestick pattern which indicates that odds have risen for a potential minor rebound in price actions to retrace the prior five days of steep descent.
Positive short-term momentum has emerged
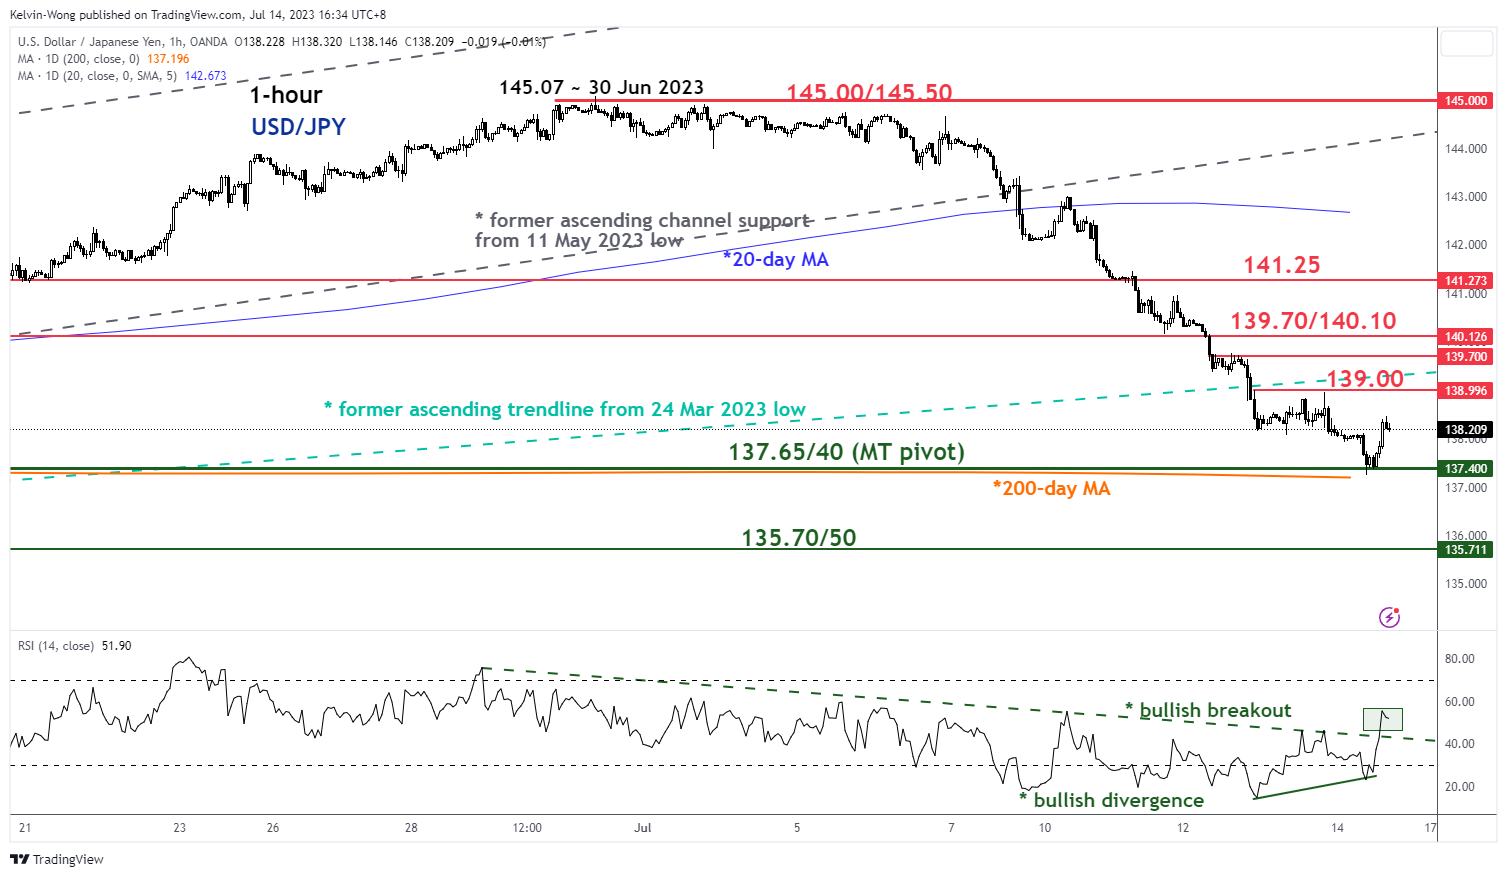
Fig 2: US/JPY minor short-term trend as of 14 Jul 2023 (Source: TradingView, click to enlarge chart)
The hourly RSI oscillator has flashed out another bullish divergence signal at its oversold region and just staged a bullish breakout above a key parallel descending resistance at the 43 level. These observations suggest the recent downside momentum has abated.
Watch the 137.65/40 key medium-term pivotal support for a potential corrective rebound scenario with the next intermediate resistances coming in at 139.00 and 139.70/140.10 (also the 38.2% Fibonacci retracement of the current decline from the 30 June 2023 high to today’s 14 July intraday low of 137.24).
On the flip side, a break below 137.40 invalidates the corrective rebound to expose the next support at 135.70/50 (the 61.8% Fibonacci retracement of the prior up move from 24 March 2023 low to 30 June 2023 high).
Too Early to Celebrate Disinflation
- Current up moves in long-duration equities and fixed income came at the expense of a weaker US dollar.
- A persistent weak US dollar may lead to an upside revival in commodities prices.
- Inflationary expectations may creep up again due to higher oil/commodities prices.
- Disinflationary narrative seems premature and may be mispriced.
Market participants have taken a “disinflation ecstasy pill”, bidding up long-duration equities and fixed income in the past two sessions after the latest June US CPI data came in below expectations with the headline print dipped to 3% year-on-year, its slowest rate of growth seen in two years. The core consumer inflation rate (excluding food & energy) also slowed to 4.8% year-on-year from 5.3% recorded in May and dipped below the current Fed Funds rate of 5% to 5.25%.
In terms of week-to-date performances as of 13 July, higher beta and long-duration equities outperformed, and the Nasdaq 100 rallied by +3.56%, just 7.7% away from its November 2022 all-time high. Over in the fixed income space, last week’s losses were almost recouped; iShares 20+ Year Treasury Bond exchange-traded fund (ETF) recorded a week-to-date gain of 2.84%, iShares Investment Grade Corporate Bond ETF (+2.61%), and iShares High Yield Corporate Bond ETF (+2.44%).
This latest bout of “disinflationary optimism” has revived the “Fed Pivot” narrative where participants are now anticipating that the upcoming July FOMC meeting will likely see the last interest rate hike of 25 basis points (bps) to end this current cycle of monetary policy tightening in the US and negate the current “higher interest rates for a longer period” guidance advocated by Fed officials.
US Dollar Index’s major downtrend was reinforced via a break below 100.95 key support
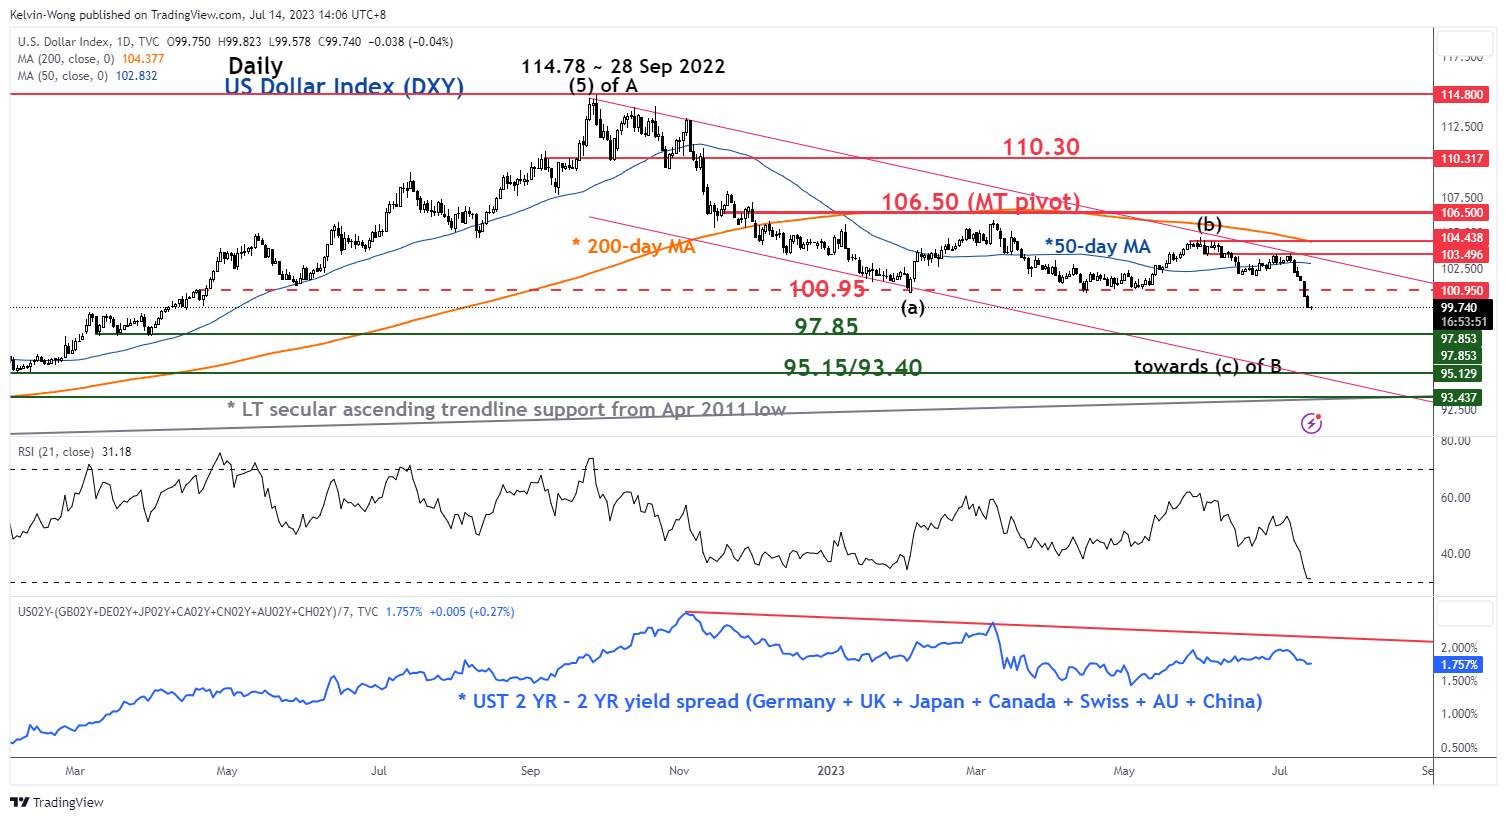
Fig 1: US Dollar Index medium-term and major trend as of 14 Jul 2023 (Source: TradingView, click to enlarge chart)
The current disinflationary theme play has come at the expense of a weaker US dollar that sank to a 15-month low, the US Dollar Index has tumbled by -2.52% for this week, set for its worst weekly performance since the week of 7 November 2022 as it broke below the key medium-term support of 100.95.
Right now, there are second-order effects at play where significant global financial market movements are likely to spiral into the real economy in the months ahead. A weaker US dollar may translate to higher commodities prices as most commodities; physical and paper (futures contracts) are priced in US dollars.
This above-mentioned linkage of a weaker US dollar to higher commodities prices seems to be emerging in the financial markets; the week-to-date performance of WTI crude oil futures is up by +4.1% and a broader basket of commodities as measured by the Invesco DB Commodity Index Tracking Fund has rallied by 3.6% for this week.
Inflationary expectations may start to creep up
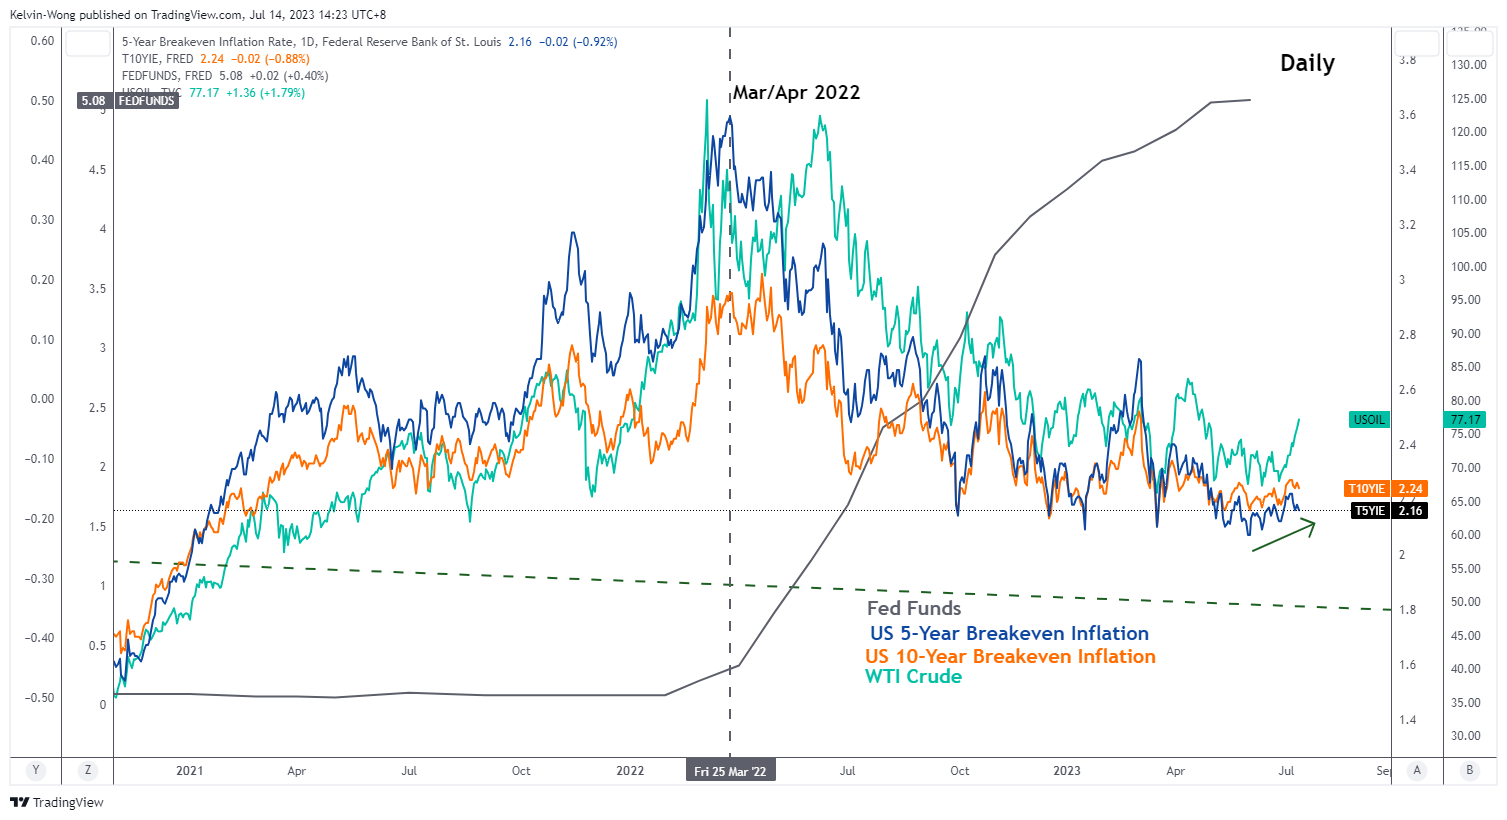
Fig 2: WTI crude oil correlation with US 5-YR & 10-YR breakeven inflation rates as of 13 Jul 2023 (Source: TradingView, click to enlarge chart)
Commodity prices such as oil have a high degree of direct correlation with forward-looking inflationary expectations.
In the past three years, the price actions of WTI crude oil have moved in lock-step with the US Treasury’s 5-year and 10-year breakeven inflation rates (a measurement of inflationary expectations). If WTI crude oil can maintain its current upward trajectory, inflationary expectations may creep higher from this juncture.
Potential upside momentum in commodities may spark another ascend in US CPI
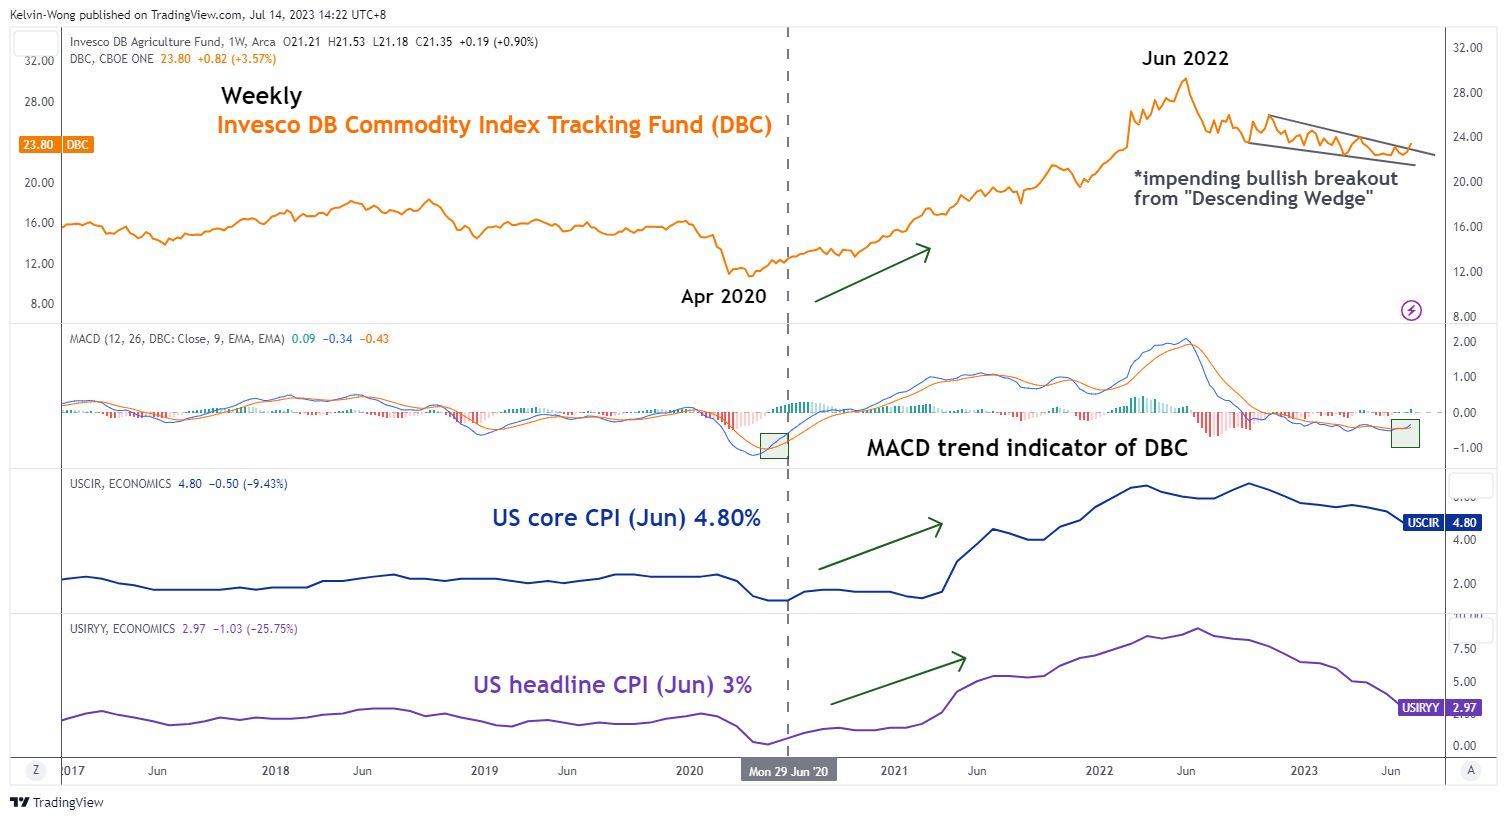
Fig 3: Invesco DB Commodity Index Tracking Fund major trend with US CPI as of 13 Jul 2023 (Source: TradingView, click to enlarge chart)
In addition, from a momentum perspective, an imminent trend change may start to take shape for commodities prices after close to one year of downtrend since June 2022 using Invesco DB Commodity Index Tracking Fund (DBC) as a commodities benchmark.
The current weekly MACD trend indicator of the DBC has just flashed a bullish crossover signal below its centreline that suggested that the major downtrend of DBC in place since the June 2022 high may have ended which in turn increases the odds of a bullish reversal for commodities prices.
A similar MACD bullish crossover observation on the DBC occurred in early June 2020 that spiralled into the real economy where inflationary pressures; headline and core US CPI started their ascend.
Therefore, a potential uptick in inflationary expectations coupled with the current positive momentum in commodities prices may put a halt to the current inflationary slowdown trajectory seen in the latest US CPI prints. The ongoing disinflationary narrative may be premature and mispriced at this juncture.