Sample Category Title
Further Internal Demand Deterioration in China But PBoC Refrains from Cutting Key Interest Rate
Further internal demand deterioration in China but PBoC refrains from cutting key interest rate
- Retail sales in China decelerated to 3.1% y/y in June from May’s 12.7% y/y, weakest growth rate since December 2022.
- Q2 GDP growth in China came in below expectations at 6.3% y/y vs. consensus estimates of 7.3% y/y.
- China’s central bank, PBoC left its one-year medium-term lending facility rate unchanged at 2.65% likely due to the risk of a “liquidity trap” scenario.
- China’s proxies stock benchmarks Hang Seng Index, Hang Seng TECH Index & Hang Seng China Enterprises Index outperformed intraday against the mainland “A” shares benchmark CSI 300.
China’s Q2 GDP growth came in below expectations at 6.3% year-on-year versus consensus estimates of 7.3% but above Q1 of 4.5%; 0.8% growth for Q2 on a quarter-on-quarter basis, below Q1’s 2.2% (q/q). Retail sales for June tumbled to single-digit growth of 3.1% year-on-year from 12.7% recorded in May, its steepest growth deceleration since December 2022, almost on par with expectations of 3.2%. On the other hand, industrial production rose to 4.4% year-on-year in June, above expectations of 2.7%, and May’s reading of 3.5%, its highest growth rate since October 2022.
The labour market for youth has remained worrisome, the youth unemployment rate for 16 to 24 years old accelerated to 21.3% in June, a new high from 20.8% in May, that’s around four times the nationwide unemployment rate that remained steady at 5.2% in June.
The growth deceleration in retail sales and continued uptick in youth unemployment have further reinforced the ongoing weak internal demand environment in China since March this year that dented consumer confidence and increased the risk of a deflationary spiral.
A liquidity trap scenario is likely to see less marginal benefits from interest rate cuts
To negate weak internal demand and eroding consumer confidence, expansionary fiscal stimulus measures are likely to be more effective than more interest rate cuts, and accommodating monetary policy in a deflationary environment reduces the “marginal benefit” from an extra added effort of monetary policy stimulus; a “liquidity trap scenario”.
Hence, it is not surprising for China’s central bank, PBoC to refrain from cutting its key one-year medium-term lending facility today and left it unchanged at 2.65% after a 10-basis point reduction in June, which in turn implies a likely similar no-cut scenario for its decision on the one-year (3.55%) and five-year loan prime rates (4.2%) out later this Thursday.
China “A” shares benchmark CSI 300 dragged down by financial stocks
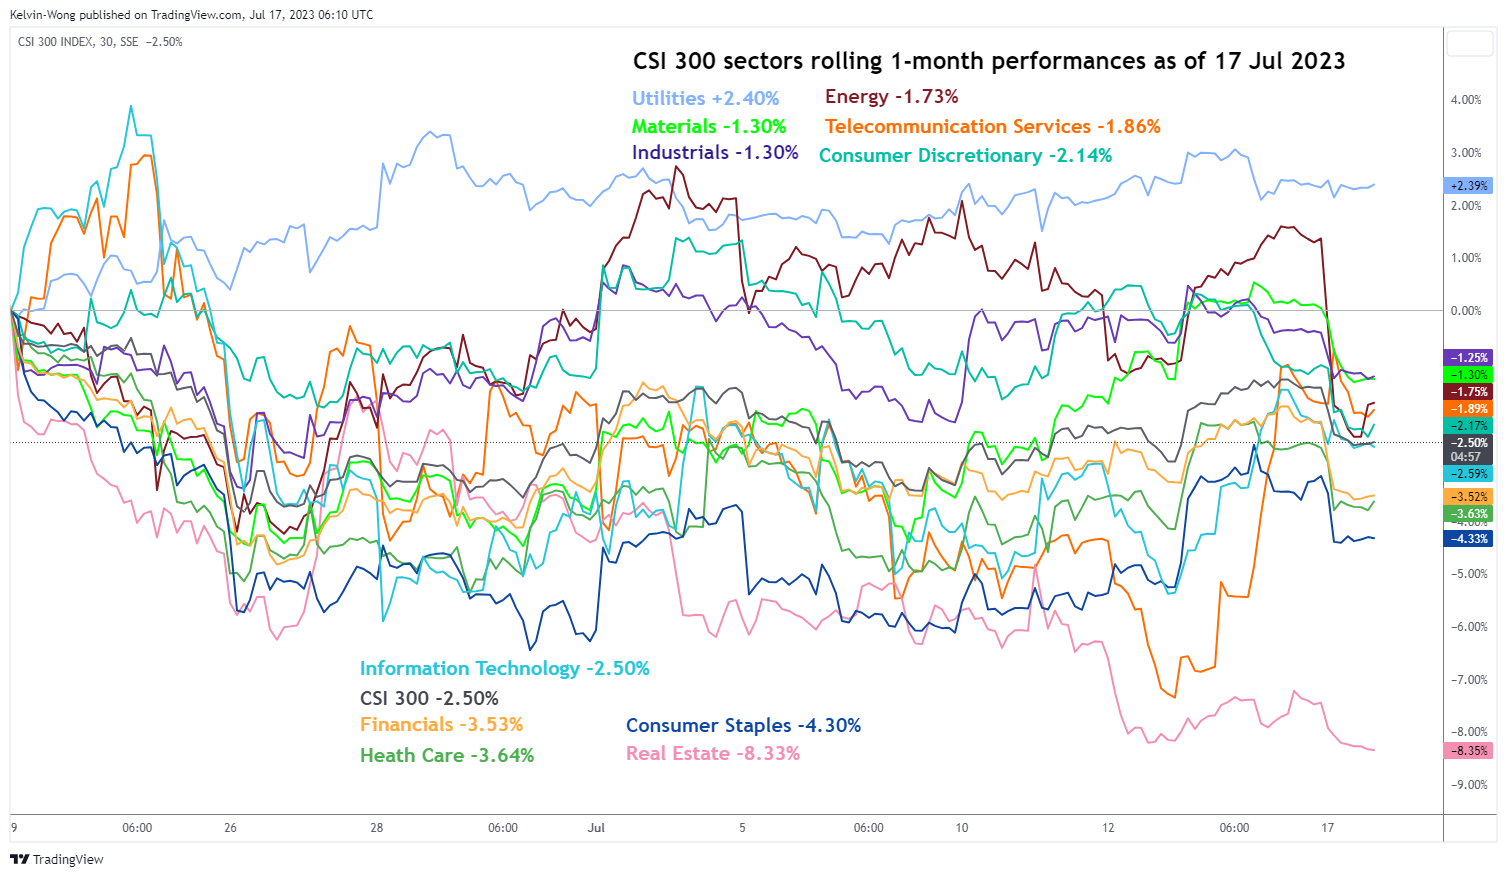
Fig 1: CSI 300 sectors rolling 1-month performance as of 17 Jul 2023 (Source: TradingView, click to enlarge chart)
Interestingly, the China proxies benchmark stock indices listed in Hong Kong do not suffer a steep sell-off; https://www.oanda.com/sg-en/trading/instruments/hk33-hkd/Hang Seng Index (+0.33%), Hang Seng TECH Index (-0.20%), and Hang Seng China Enterprises Index (+0.23%) at this time of the writing.
In contrast, the China mainland “A” shares benchmark stock index, CSI 300 shed -1.1% dragged down by the banks that underperformed intraday likely due to the fear of a “liquidity trap” scenario that led to slower loan growth, the CSI 300 Financials Index shed -1.44% intraday.
China Growth Disappoints – US Earnings in Focus
The Chinese economy grew 6.3% in Q2 and that’s faster than a 4.5% growth in Q1 but lower than the market estimate of 7.3%. Now don’t be blindsided by the strong look of these numbers, because the latest figures were distorted by a low base effect last year when Shanghai and other big cities were in lockdown and life in China was running at a very low speed. If we look at a seasonally adjusted basis, the Chinese economy grew by only 0.8%, slowing sharply from a 2.2% rise in Q1.
Market sentiment regarding the weakening growth numbers is mixed. In one hand, weak growth means that the government and the People’s Bank of China (PBoC) will step up efforts to further ease the financial conditions and pave the way for a quicker recovery. On the other hand, supportive policies put in place so far have had little impact. The Chinese property downturn, risk of disinflation, and falling exports have been difficult to reverse. As a result, the kneejerk reaction in markets was unenthusiastic. American crude extended retreat below the $75pb, after hitting and bouncing lower from the 200-DMA, that stands near $77pb last week. The rejection was expected, and the selloff could deepen toward the 100-DMA, near $73.50 level. Copper futures are also down this morning and testing the 100-DMA following a 7% rebound since the start of the month. Iron ore futures remain under pressure, and the Aussie is down nearly 1.30% against the US dollar, after forming a double top near the 69 cents level last week, on the back of a broad-based dollar weakness.
Zooming out, the US dollar is not further sold across the board this Monday, but the dollar index consolidates near the lowest levels since April 2022, and is below the 100 mark and is expected to further cool down. The softer dollar is good for cooling inflation elsewhere than the US, it could be good for boosting the revenues of US companies, including the Big Tech, which suffered from a rapid appreciation of the greenback last year, and it’s good for boosting the US exports – which should support the US economic growth.
So, all eyes are now turning toward the US companies’ earnings this week. The first earnings from the bis US banks came in better-than-expected last Friday and added to the overall investor enthusiasm after the US inflation data confirmed an encouraging easing in the US inflation, which in return softened the hawkish Federal Reserve (Fed) expectations and fueled a rally in both stock and bond markets.
JPMorgan Chase, Citigroup, and Wells Fargo all reported stronger-than-expected earnings last quarter due to rising interest rates. Deposits in Citigroup were nearly flat, Welss Fargo for saw its deposits fall 1% compared to Q1, and 7% compared to a year ago, and the average interest rates that the banks had to pay on deposits to prevent them from evaporating and going toward higher-yielding investments, rose 1-3% and their interest expenses climbed significantly. But still, JP Morgan’s net interest income rose 44%, Citi’s 16% and Wells Fargo’s nearly 30%! Some smaller banks like Silicon Valley Bank, Signature Bank, and First Republic struggled with the effects of higher interest rates, as well. And deposit levels at major banks have been declining, with growth turning negative and reaching -6%, its lowest level in April. Blackrock amassed some good inflows and closed the quarter just shy of $10 trillion under management. The mix of the good and the bad led Citigroup shares 4% down. Wells Fargo first rallied before closing the day in the negative on Friday. The upcoming earnings reports from Bank of America, Morgan Stanley, and Goldman Sachs will be closely watched, among other big names.
On the list of companies that are due to release earnings this week, we find Netflix, Tesla, IBM, TSM, American Airlines and American Express. Overall, analysts project that S&P 500 companies will see the biggest contraction in earnings growth during the second quarter, where profits are expected to fall by 7-9% year-over-year. That doesn’t really match what we see in the S&P500 chart, as the index advanced to a fresh high since April 2022 and is up by around 24% since last October dip. But the reality is that, with just over 5% of companies in the index having reported, profit growth for the period is on track to have contracted by 9.3% thus far, according to Bloomberg. It’s too early to call of course because the tech is what carried the S&P500 this high over the past half-a-year and their earnings should be the ones to confirm the nice rally we saw on index level, but we could come down to earth with less shinier figures on that end. Yes, AI boosts revenue, and revenue expectations but Taiwan’s exports of chips fell for the 6th consecutive month in June due to weaker global demand. Exports decreased more than 20% from a year earlier to a four-month low and when you think that the island is home to some big and loved names like Apple and Nvidia’s go-to chipmaker, TSMC, you question whether the biggest annual decline in Taiwan’s chip exports since March 2009 isn’t a warning that equity investors may have gone ahead of themselves when rushing to these stocks.
EUR/AUD Daily Outlook
Daily Pivots: (S1) 1.6326; (P) 1.6382; (R1) 1.6477; More...
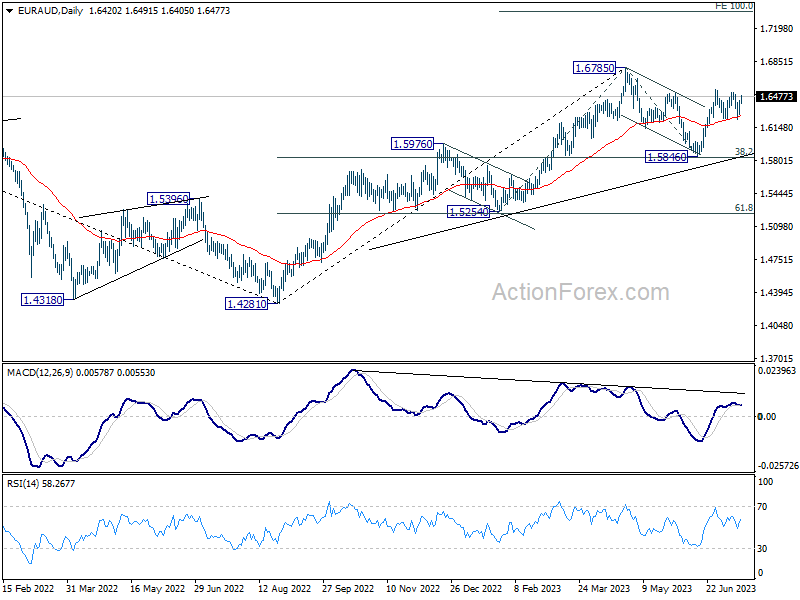
EUR/AUD rises notably today but stays below 1.6552 resistance. Intraday bias remains neutral at this point. Outlook is unchanged that correction from 1.6785 should have completed with three waves down to 1.5846. On the upside, break of 1.6552 will target a retest on 1.6785 high next. This will remain the favored case as long as 1.6231 support holds, even in case of another dip.
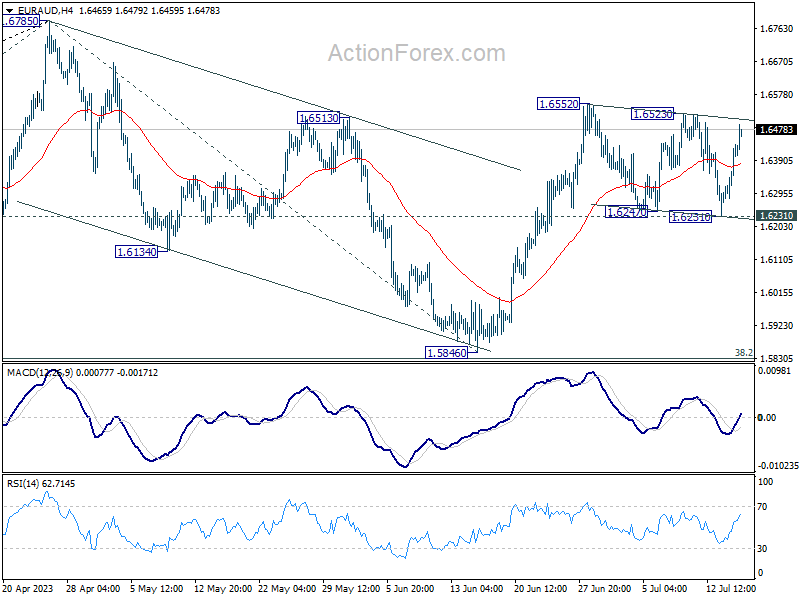
In the bigger picture, with 38.2% retracement of 1.4281 to 1.6785 at 1.5828 intact, rally from 1.4281 is still in progress. Firm break of 1.6785 will confirm rise resumption. Next target is 100% projection of 1.5254 to 1.6785 from 1.5846 at 1.7377. On the other hand, rejection by 1.6785 will extend the corrective pattern with another fall leg. But outlook will stay bullish as long as 1.5828 holds.
Market Mood Sours on Chinese Data; Focus Shifts to More Global CPI Readings
The financial markets kicked off the week on a sour note, grappling with disappointing Chinese GDP figures that undercut the overall sentiment. Despite a mixed bag of data for June, the weaker-than-expected economic expansion in China sent Australian Dollar – a bellwether for the commodities sector – on a slide, spearheading losses among commodity-linked currencies.
Simultaneously, Japanese Yen found fresh wind in its sails, shadowed closely by Swiss Franc and Dollar, a typical response in risk-off market environments. Euro and Sterling trod a mixed path, with the former eking out a slight edge in the early trade.
While steep selloff in the greenback last week is still fresh in market participants' mind, there's prospect of some stabilization in Dollar this week. Focus will be temporarily off the US, which only has retail sales data as a high-tier economic release. Meanwhile, cross-market volatility could pick up pace, fueled by release of CPI data from Canada, New Zealand, UK, and Japan.
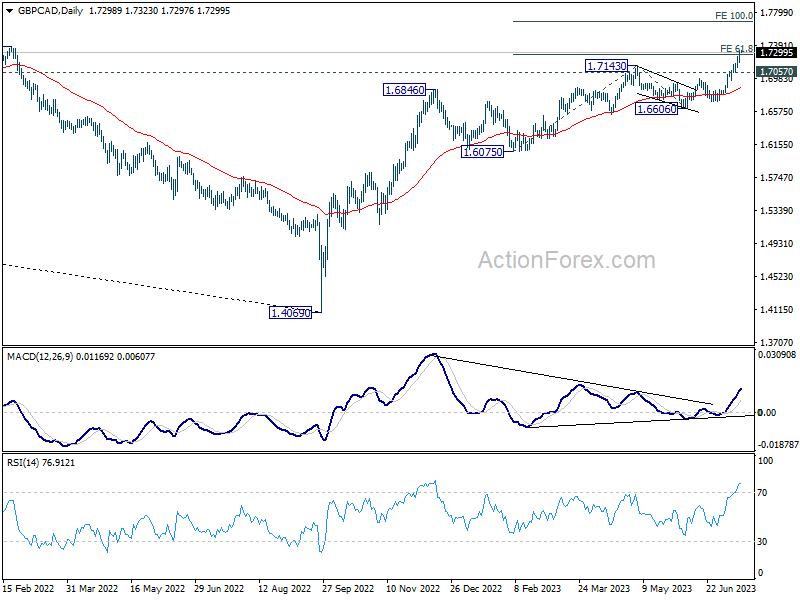
Technically, GBP/CAD's up trend from 1.4069 resumed last week by breaking through 1.7143 resistance. 61.8% projection of 1.6075 to 1.7143 from 1.6606 at 1.7266 was also met. For now near term outlook will stay bullish as long as 1.7057 support holds. Sustained trading above 1.7266 will pave the way to 100% projection at 1.7674.
In Asia, Japan is on holiday. Hong Kong is off on typhoon. China Shanghai SSE is down -1.26%. Singapore Strait Times is down -0.28%.
China's annual GDP growth missed expectations, youth unemployment hit new record
China's Q2 GDP growth rose by 6.3% yoy, an improvement from Q1's 4.5% but fell short of expectation 7.1% yoy. On a quarter-to-quarter basis, GDP grew by 0.8%, deceleration from the previous quarter's 2.2% but still outpacing projected 0.5%.
Despite being the fastest annual pace since Q2 2021, this performance appears skewed due to low base effect from last year's lockdown. For H1 as a whole, GDP expanded by 5.5% when compared to the same period last. This growth outperformed the government's modest target of approximately 5% for the year.
Other figures published by the National Bureau of Statistics on Monday painted a mixed picture. In June, retail sales increased by 3.1% yoy, falling short of the expected 3.5% and down significantly from May's 12.7% growth. On a brighter note, industrial production, reflecting activity in manufacturing, mining, and utilities sectors, surged by 4.4% yoy last month, a jump from May's 3.5% and surpassing expectations of 2.6%.
Fixed-asset investment, traditionally used to bolster growth, rose by 3.8% yoy in the first half of 2023, a slowdown from the 4% increase witnessed in the first five months. However, this growth exceeded the expected 3.4%.
In terms of employment, the picture appears bleak for the younger generation. Unemployment rate for those aged 16-24 reached a record 21.3% in June, up from 20.8% in May. Conversely, overall urban surveyed jobless rate remained static at 5.2% last month.
In a separate announcement, PBoC maintained the rate on CNY 103B worth of one-year medium-term lending facility loans to some financial institutions at 2.65%.
Spotlight on Canada, New Zealand, UK, and Japan CPI
The upcoming week is marked with anticipation as consumer inflation data from Canada, New Zealand, UK, and Japan is slated for release. This data will undeniably have significant implications on the currency markets.
Canada's CPI is predicted to further decelerate from May's 3.4% yoy, potentially falling back to BoC's target range of 1-3%, presumably close to the upper limit. Nonetheless, BoC's prime concern will likely be the monthly increase in core CPI, serving as a barometer for persistence of underlying inflation pressure. Additionally, to validate the speculation that last week's BoC rate hike marked the end of the current cycle, substantial progress needs to be observed in trimmed and median CPI, from the preceding month's yoy figures of 3.8% and 3.9%, respectively.
Across the Pacific, New Zealand's CPI is projected to decelerate from 1.2% qoq to 0.9% in Q2, with annual rate declining from 6.7% yoy to 5.9%. If these predictions hold true, it will be the third consecutive quarter where inflation has underperformed against RBNZ's forecasts (1.1% qoq and 6.1% yoy for Q2 as stated in May's Monetary Policy Statement). This scenario would augment the case for RBNZ to maintain interest rate at 5.50%, in line with its own projected peak.
In the UK, June's CPI is forecasted to slow from 8.7% yoy to 8.2%, with the core CPI holding steady at 7.1% yoy. This performance keeps UK as the bottom of the class in major economics in combating inflation. While market anticipations on BoE peak rate vary, a consensus seems to be forming that rates will need to increase from the present level of 5% to above 6% eventually.
Turning to Japan, core CPI and core-core CPI are expected to hover around May's level of 3.2% yoy and 4.3% yoy respectively. After release of robust wages growth data earlier this month, anticipations for a possible tweak in BoJ's yield curve control parameters have been mounting. 10-year JGB yield has jumped from around 0.38% in early July to the current 0.48%. Any upside surprises in the CPI report would likely trigger further speculation and may transpire into a subsequent rally in 10-year JGB, surpassing BoJ's cap of 0.50%.
In additional, focuses will also be on retail sales data from US, UK and Canada, as well as Australia job data and RBA minutes.
Here are some highlights for the week:
- Monday: China GDP, industrial production, retail sales, fixed asset investment; Canada wholesale sales; Empire State Manufacturing index.
- Tuesday: RBA minutes; Japan tertiary industry index; Canada CPI, IPPI and RMPI, housing starts; US retail sales, industrial production, business inventories, NAHB housing index.
- Wednesday: New Zealand CPI; UK CPI, PPI; Eurozone CPI final; US housing starts and building permits.
- Thursday: Japan trade balance; Australia employment, NAB quarterly business confidence; Swiss trade balance; Germany PPI; Eurozone current account; US jobless claims, Philly Fed survey, existing home sales, leading index.
- Friday: Japan CPI; UK Gfk consumer sentiment, retail sales; Canada retail sales, new housing price index.
EUR/AUD Daily Outlook
Daily Pivots: (S1) 1.6326; (P) 1.6382; (R1) 1.6477; More...
EUR/AUD rises notably today but stays below 1.6552 resistance. Intraday bias remains neutral at this point. Outlook is unchanged that correction from 1.6785 should have completed with three waves down to 1.5846. On the upside, break of 1.6552 will target a retest on 1.6785 high next. This will remain the favored case as long as 1.6231 support holds, even in case of another dip.
In the bigger picture, with 38.2% retracement of 1.4281 to 1.6785 at 1.5828 intact, rally from 1.4281 is still in progress. Firm break of 1.6785 will confirm rise resumption. Next target is 100% projection of 1.5254 to 1.6785 from 1.5846 at 1.7377. On the other hand, rejection by 1.6785 will extend the corrective pattern with another fall leg. But outlook will stay bullish as long as 1.5828 holds.
Economic Indicators Update
| GMT | Ccy | Events | Actual | Forecast | Previous | Revised |
|---|---|---|---|---|---|---|
| 02:00 | CNY | GDP Y/Y Q2 | 6.30% | 7.10% | 4.50% | |
| 02:00 | CNY | Industrial Production Y/Y Jun | 4.40% | 2.60% | 3.50% | |
| 02:00 | CNY | Retail Sales Y/Y Jun | 3.10% | 3.40% | 12.70% | |
| 02:00 | CNY | Fixed Asset Investment YTD Y/Y Jun | 3.80% | 3.40% | 4.00% | |
| 12:30 | USD | Empire State Manufacturing Index Jul | 0.0 | 6.6 | ||
| 12:30 | CAD | Wholesale Sales M/M May | 2.20% | -1.40% |
Technical Outlook and Review
DXY:
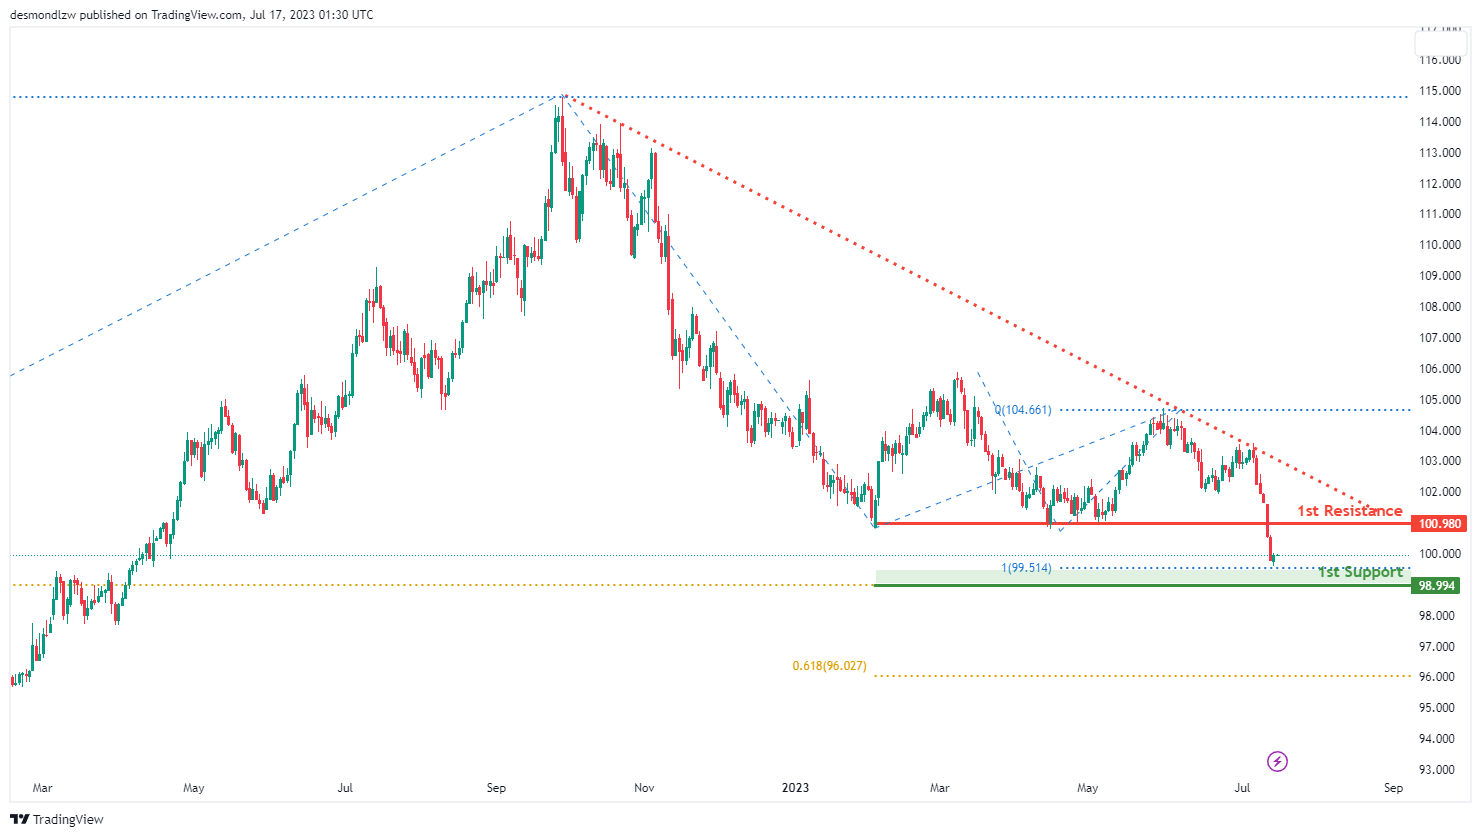
The DXY (US Dollar Index) chart is currently showing a bearish momentum. However, the market could potentially make a bullish bounce off the 1st support and move towards the 1st resistance.
The 1st support level is at 99.42. This is an overlap support and also a 100% Fibonacci Projection level. This suggests that the market has found buying interest at this price in the past, which could potentially cause a bounce upwards.
The 2nd support level is at 97.72. This is another overlap support, indicating a price level where historically buying interest has been strong. If the price drops further, this could be an area where buyers step in.
The 1st resistance level is at 100.84. This is known as a pullback resistance, meaning the price could face selling pressure and potentially reverse its direction when it reaches this level.
The 2nd resistance level is at 101.94. This is an overlap resistance level, signaling a price point where the market has previously encountered significant selling pressure. If the price rises to this level, it could attract sellers who may push prices down.
EUR/USD:
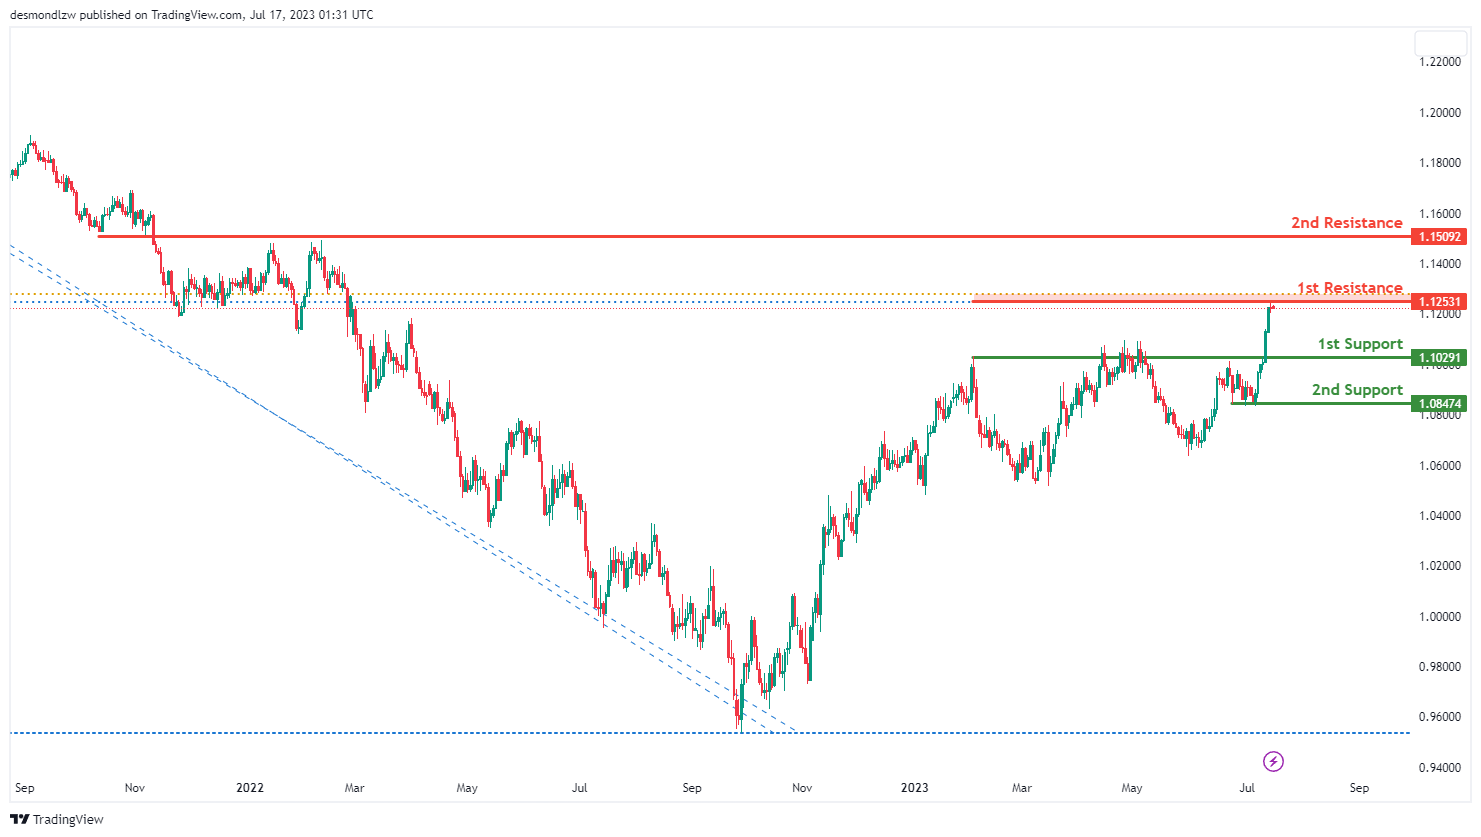
The EUR/USD pair is currently exhibiting a bearish momentum. The potential course for the price could be a bearish reaction off the 1st resistance level, leading to a drop towards the 1st support level.
The 1st support level is at 1.1029, characterized as a pullback support, offering a degree of stability for the price. Furthermore, the 2nd support level is found at 1.0847, serving as a multi-swing low support, which can provide a substantial barrier against further price decline.
In terms of resistance, the 1st resistance level is located at 1.1253. It’s recognized as a pullback resistance and coincides with a 61.80% Fibonacci retracement and a 100% Fibonacci projection level, which can present a considerable challenge to any potential bullish movement. If the price manages to overcome this, the 2nd resistance level at 1.1509, acting as an overlap resistance, could be the next significant obstacle.
EUR/JPY:
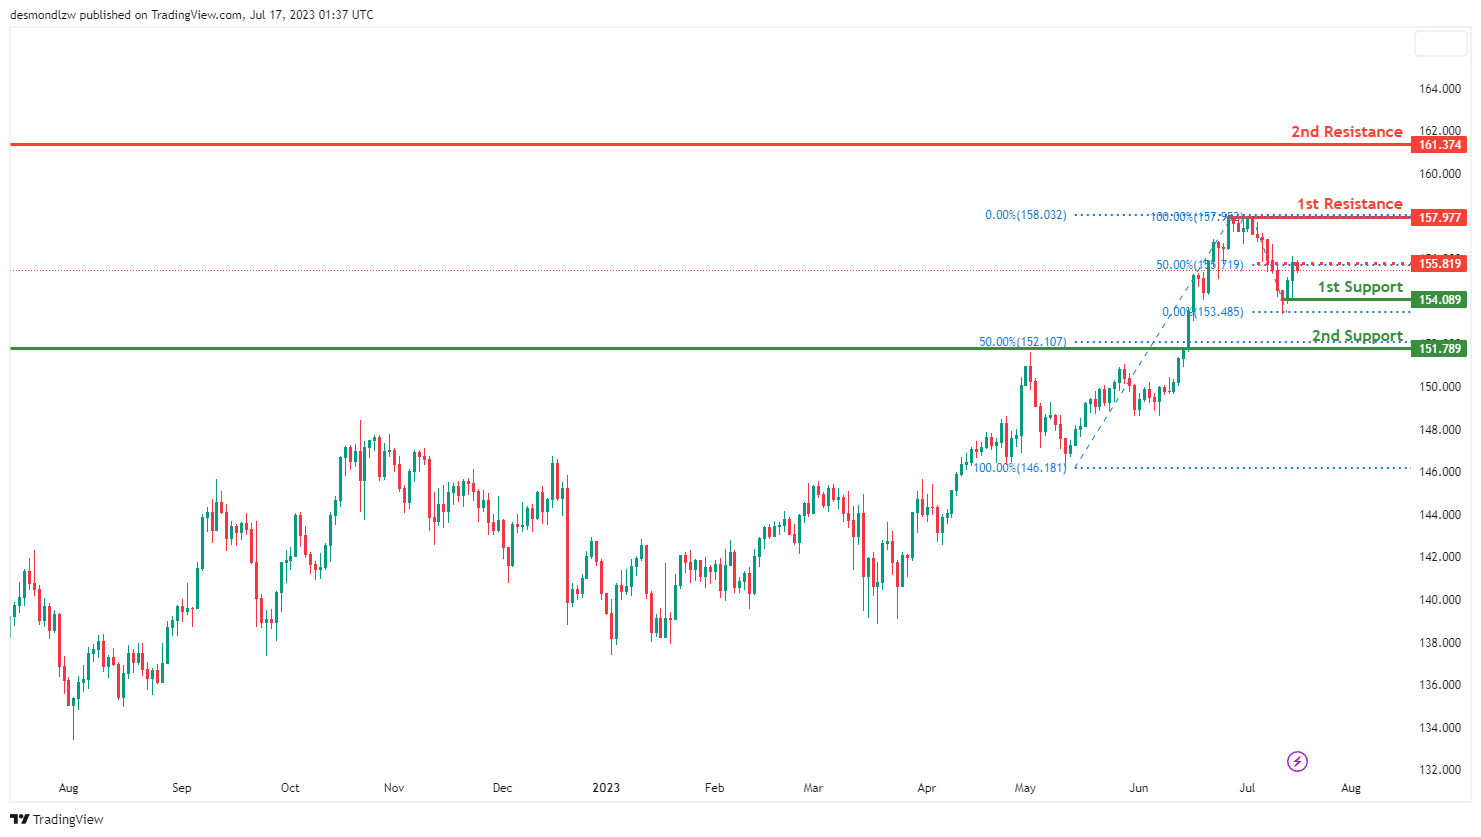
The EUR/JPY pair is presently showing a bearish trend, suggesting a potential continuation of this trend towards the 1st support level.
The 1st support level is at 154.08, serving as a swing low support, which can provide some stability for the price. Further down, the 2nd support level is at 151.78, acting as a pullback support. This level also coincides with a 50% Fibonacci retracement, reinforcing its significance.
On the flip side, the 1st resistance level is at 157.97, characterized as a multi-swing high resistance, which could pose a considerable challenge for any bullish momentum. If the price manages to break this level, the 2nd resistance at 161.37, recognized as a swing high resistance, could be the next significant obstacle.
Additionally, an intermediate resistance level is situated at 155.81. This overlap resistance coincides with a 50% Fibonacci retracement, suggesting that it might provide a meaningful hurdle for further price ascents.
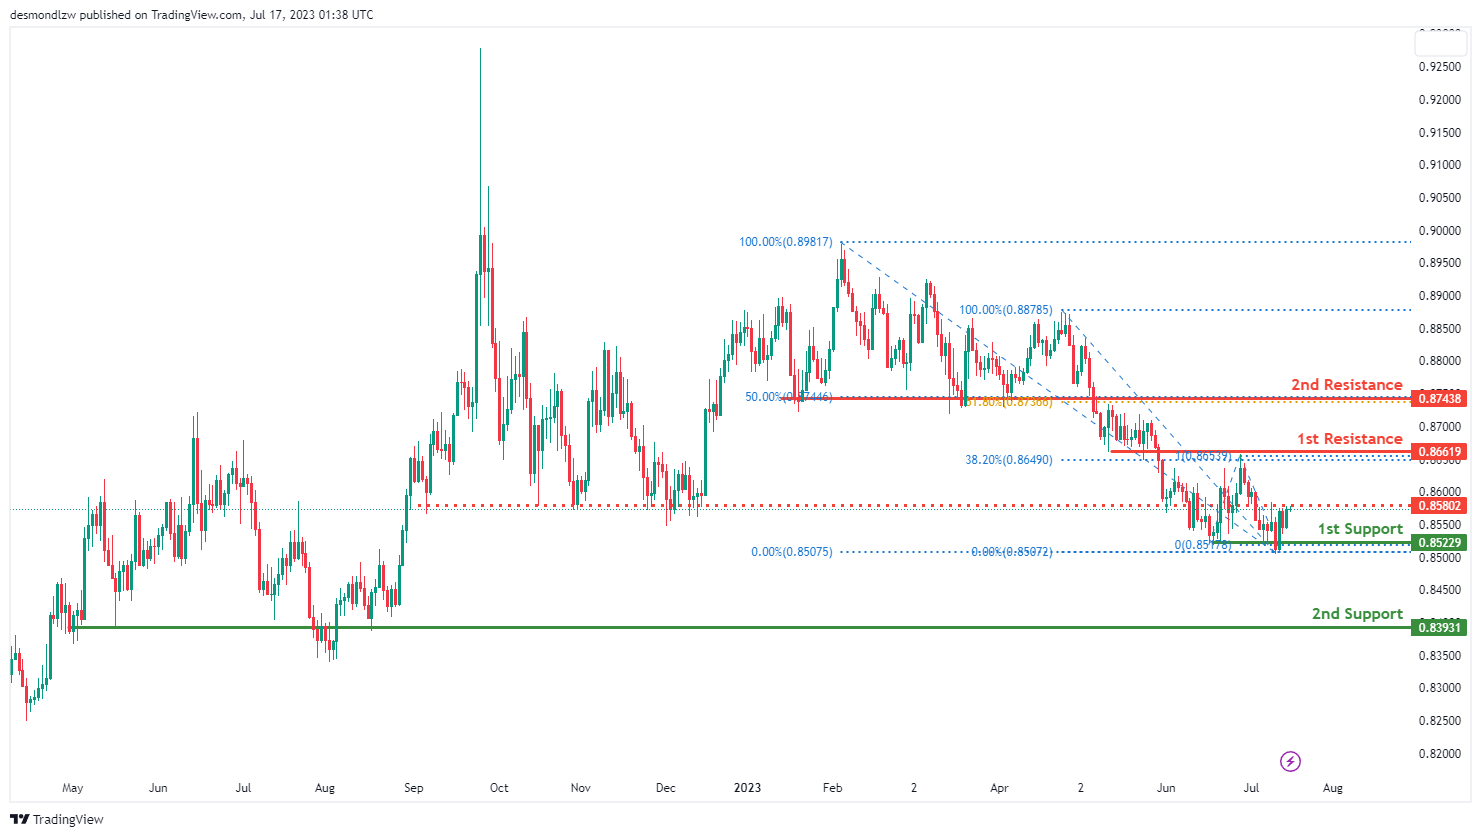
EUR/GBP:
The EUR/GBP pair is currently showing weak bullish momentum with low confidence, suggesting a potential continuation of this trend towards the 1st resistance level.
The 1st support level is at 0.8522, acting as a multi-swing low support, providing a potential cushion for the price. The 2nd support level is at 0.8393, identified as an overlap support, offering additional stability in the event of a price dip.
On the upside, the 1st resistance level is at 0.8661. This overlap resistance also aligns with a 38.20% Fibonacci retracement, strengthening its role as a potential barrier for price increases. If the price breaks through this level, the 2nd resistance at 0.8743, another overlap resistance, could pose the next challenge. This level coincides with both 50% and 61.80% Fibonacci retracement levels, suggesting a significant Fibonacci confluence.
In addition, an intermediate resistance level is identified at 0.8580, which is another overlap resistance that could provide a noteworthy hurdle for further price ascents.
GBP/USD:
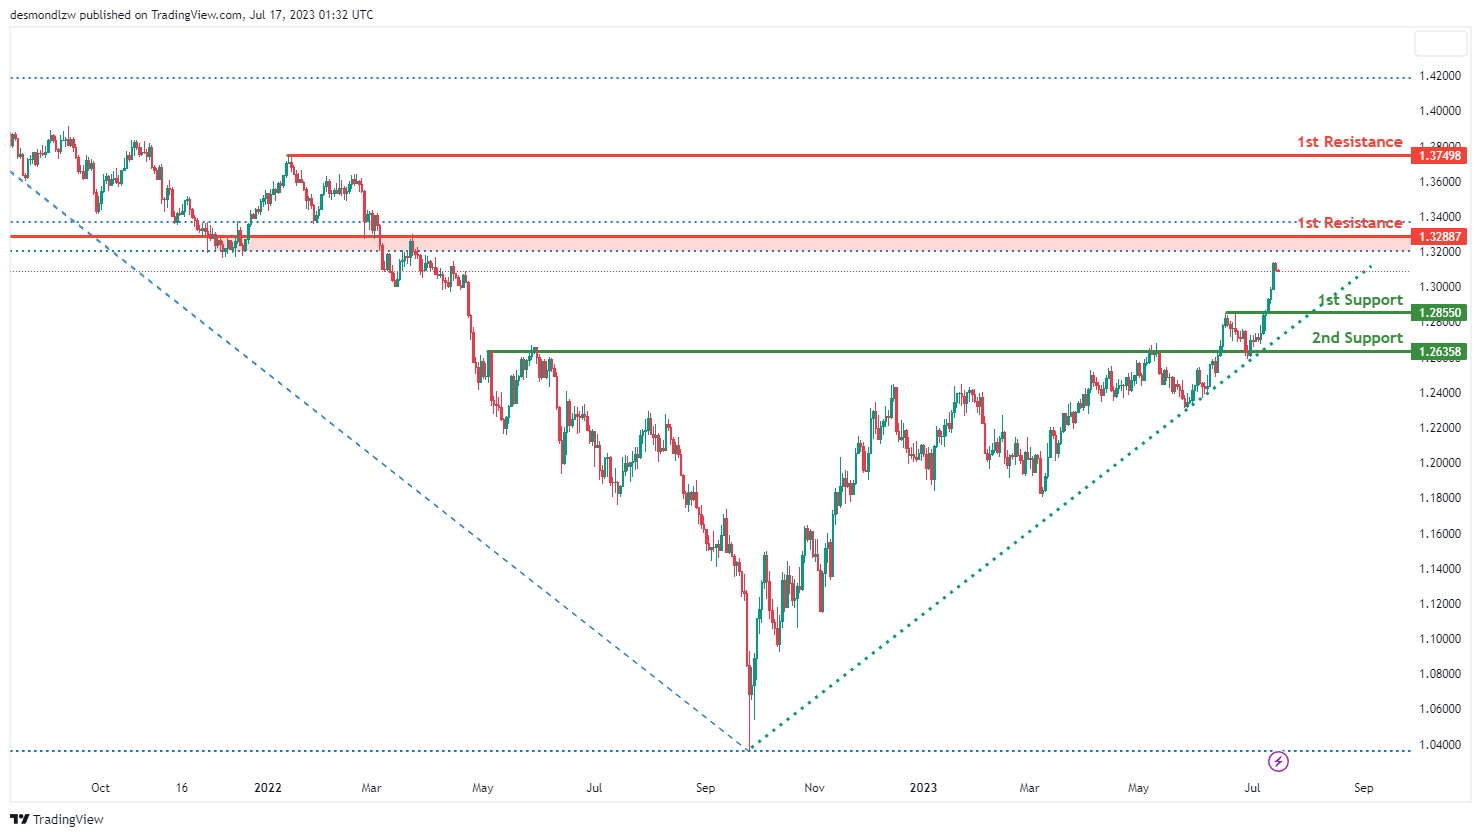
The GBP/USD pair currently demonstrates a bullish momentum, supported by the fact that the price is above a major ascending trend line, which implies potential further bullish activity.
However, a bearish reaction off the 1st resistance could lead to a drop towards the 1st support level. The 1st support is located at 1.2855, acting as a pullback support that could help stabilize price levels. If the price breaches this level, the 2nd support is at 1.2635, which serves as an overlap support, providing further assurance in case of a downward price move.
On the flip side, the 1st resistance is found at 1.3288. This overlap resistance also aligns with a 100% Fibonacci projection, adding to its significance as a potential obstacle to price ascension. If the price can surpass this level, the 2nd resistance at 1.3749 could present the next hurdle. This level acts as a swing high resistance, potentially challenging further upward price movements.
GBP/JPY:
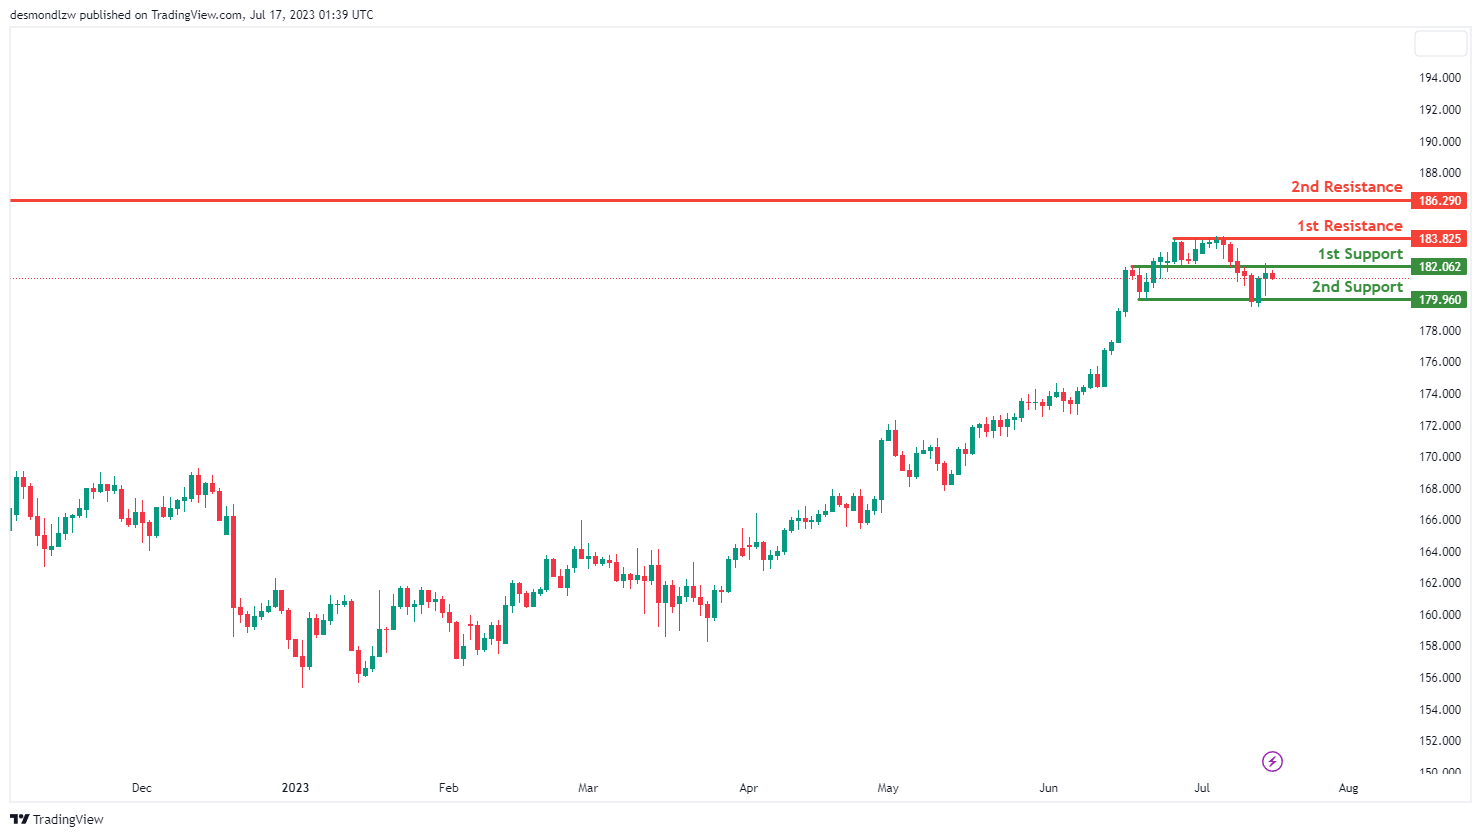
The GBP/JPY pair is currently showing a bearish momentum, and the price could potentially continue to decline towards the 1st support level.
The 1st support level at 182.06 serves as an overlap support, which could provide a significant buffer to downward price movements. If the price breaks through this level, it could fall to the 2nd support level at 179.96, which is a multi-swing low support, providing further assurance against a bearish trajectory.
In the event of a price reversal, the 1st resistance level to challenge the price would be at 183.82, a multi-swing high resistance that might provide a significant challenge to upward price movements. If the price successfully breaks through this level, it could encounter the 2nd resistance level at 186.29, a swing high resistance, potentially posing an obstacle for further price ascension.
USD/CHF:
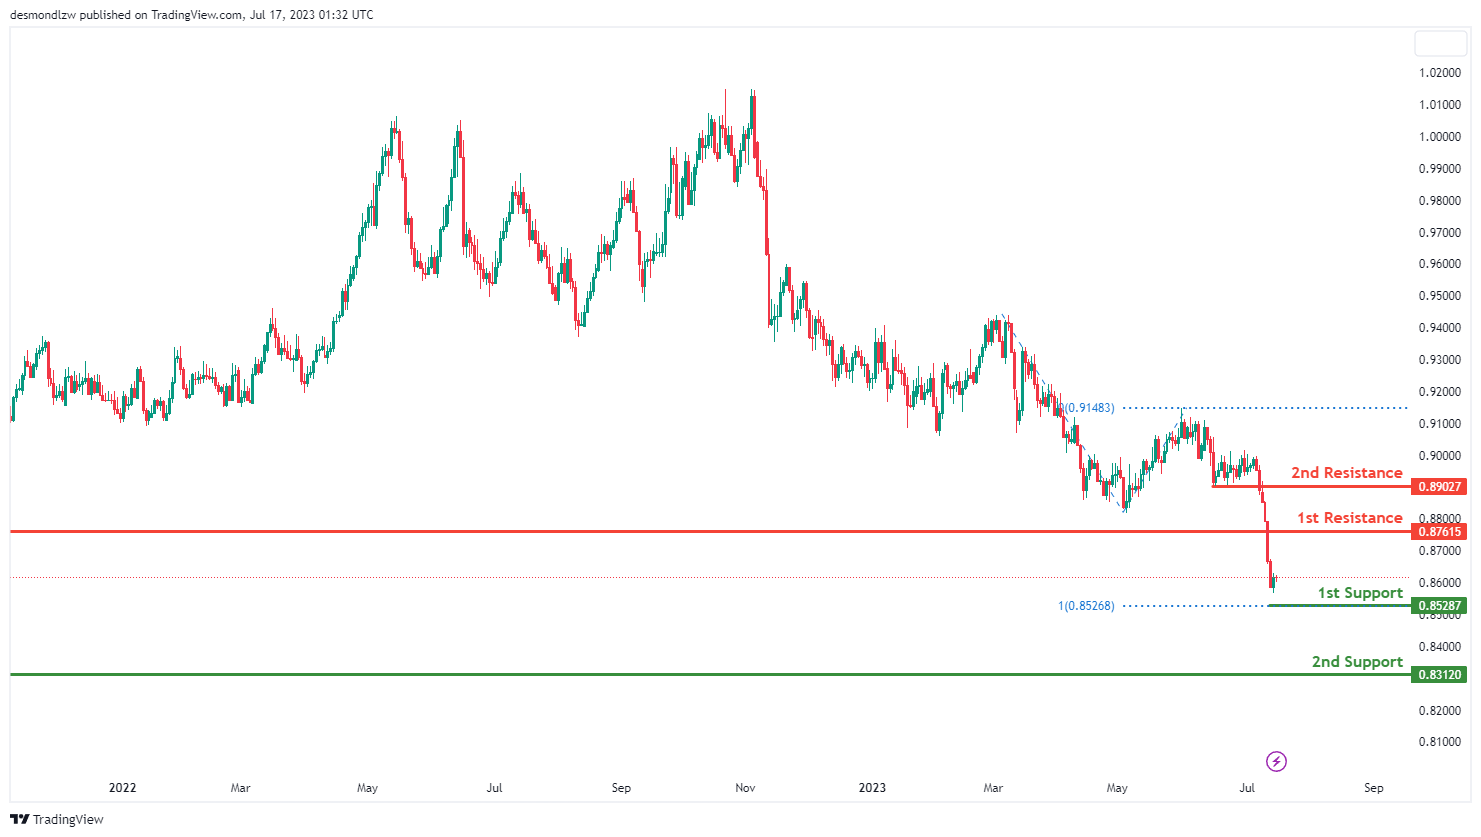
The USD/CHF pair is presently showing a bearish momentum, with the expectation of a continuation towards the 1st support level.
The 1st support level, situated at 0.8528, is reinforced by a 100% Fibonacci Projection, making it a significant level for the downward movement of the price. If the price breaches this level, it could fall to the 2nd support level at 0.8312, which is a swing low support and could provide additional support to prevent further price drops.
On the contrary, if the price begins to climb, the 1st resistance at 0.8761, which acts as a pullback resistance, could present a substantial challenge to the price’s upward movement. If the price surpasses this level, the 2nd resistance level at 0.8902, another pullback resistance, could further resist upward price movements.
USD/JPY:
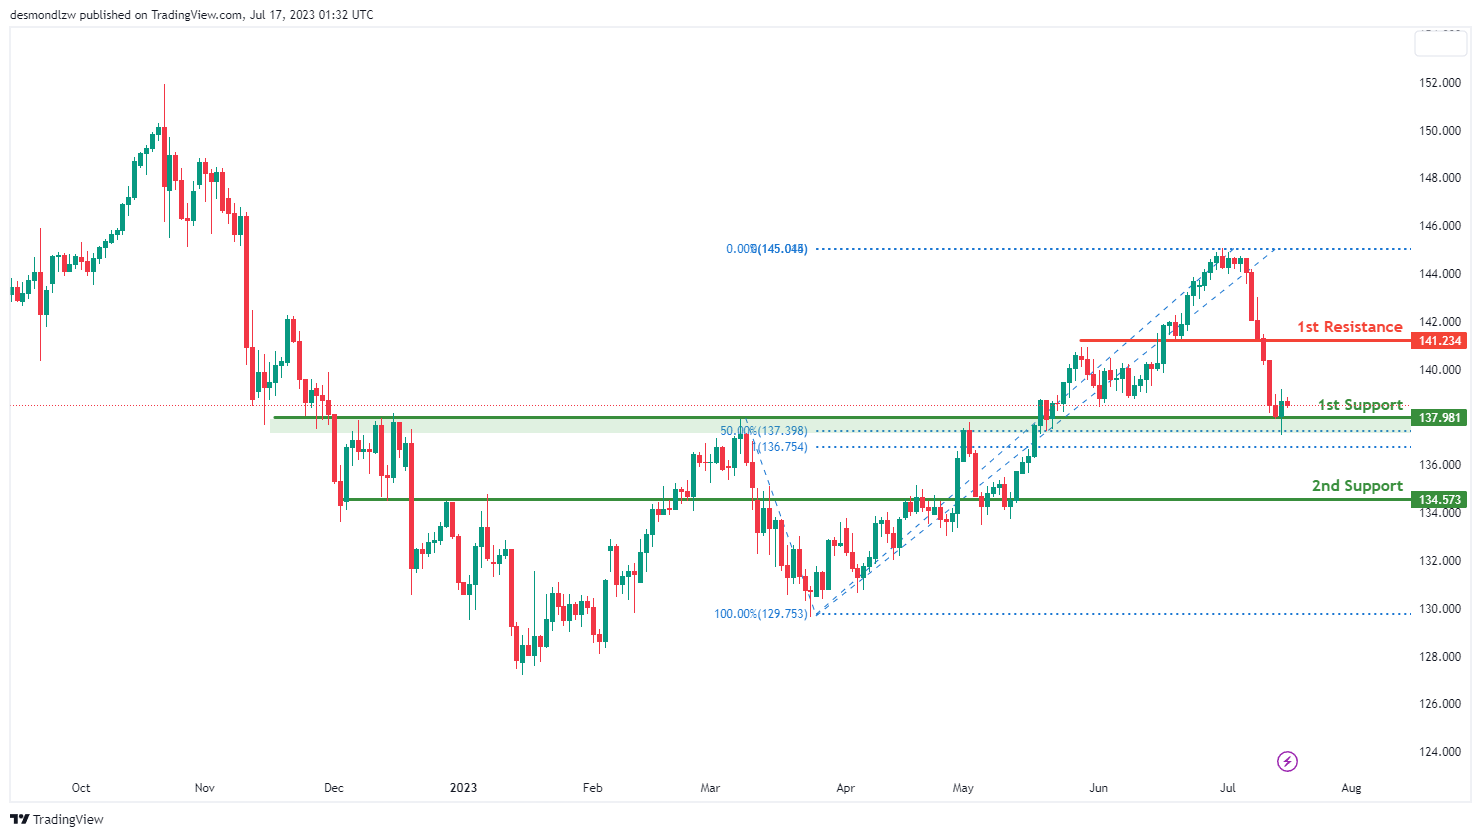
The USD/JPY pair is currently showing a bullish momentum, suggesting the possibility of a bounce off the 1st support level and moving towards the 1st resistance.
The 1st support level at 137.98 is underpinned by an overlap support and a 50% Fibonacci Retracement level, offering a strong base for the price’s upward movement. If the price drops below this level, it could find additional support at the 2nd support level of 134.57, which also serves as an overlap support.
On the upward side, the 1st resistance level at 141.23, acting as a pullback resistance, could challenge the price’s upward movement. Should the price successfully breach this level, it would reinforce the existing bullish trend and could pave the way for further gains.
USD/CAD:
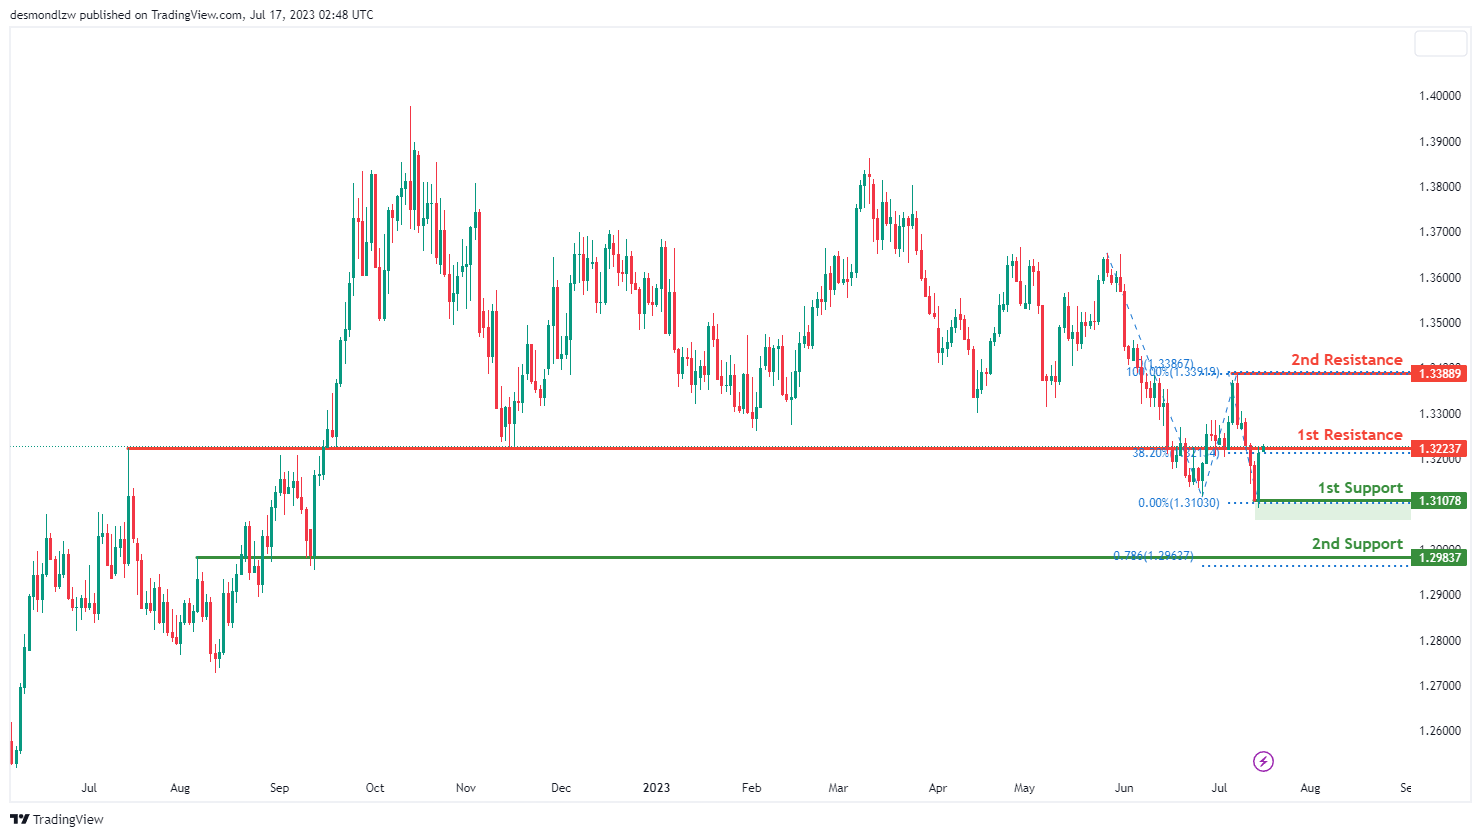
The USD/CAD pair is demonstrating a bearish momentum, suggesting the potential for a bearish reaction off the 1st resistance level and a subsequent drop to the 1st support.
The 1st support level at 1.3107, backed by a swing low support, is likely to provide a solid base for the price. Should the price break this level, the 2nd support at 1.2983, strengthened by an overlap support and a 78.60% Fibonacci projection, is likely to provide further support.
In terms of resistance, the 1st level at 1.3223, justified by overlap resistance and a 38.20% Fibonacci retracement, may pose a challenge to the upward movement of the price. If the price surpasses this resistance, it might meet the 2nd resistance level at 1.3388, which is a swing high resistance. This resistance level might be significant in defining the future trend of the pair.
AUD/USD:
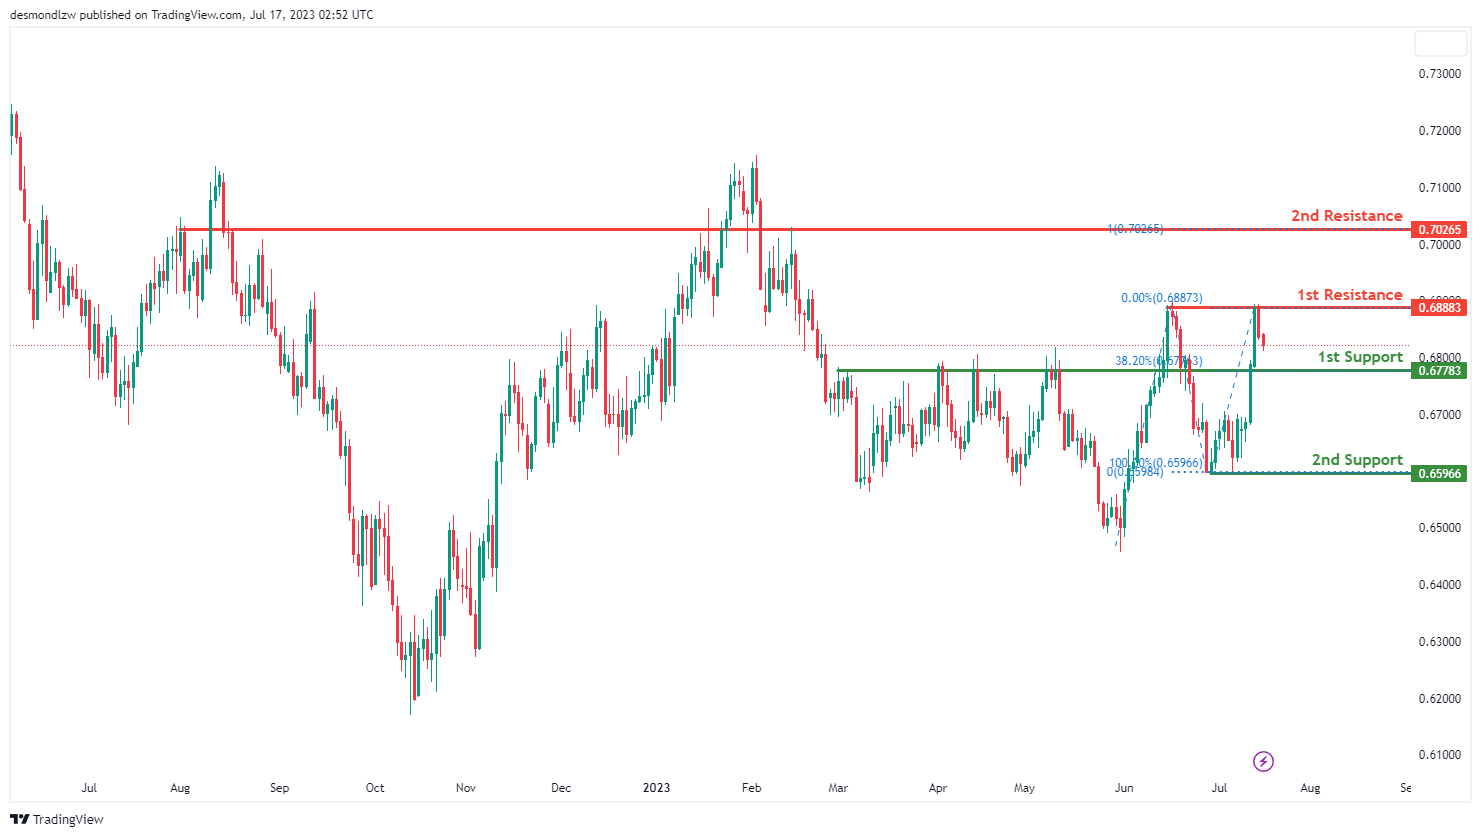
The AUD/USD pair is currently demonstrating bearish momentum, which indicates a potential bearish continuation towards the 1st support level.
The 1st support level is at 0.6778, backed by a pullback support and a 38.20% Fibonacci retracement level, which could provide a considerable hold for the price. In case the price breaks below this level, the 2nd support is at 0.6596, which is a multi-swing low support, and may provide further protection against a downward trend.
In terms of resistance, the 1st level at 0.6888 could be a hurdle for any upward price movement. This level is identified by a swing high resistance. Should the price surpass this resistance level, it will encounter the 2nd resistance at 0.7026, defined by an overlap resistance and a 100% Fibonacci projection. This level could significantly affect the future direction of the pair.
NZD/USD
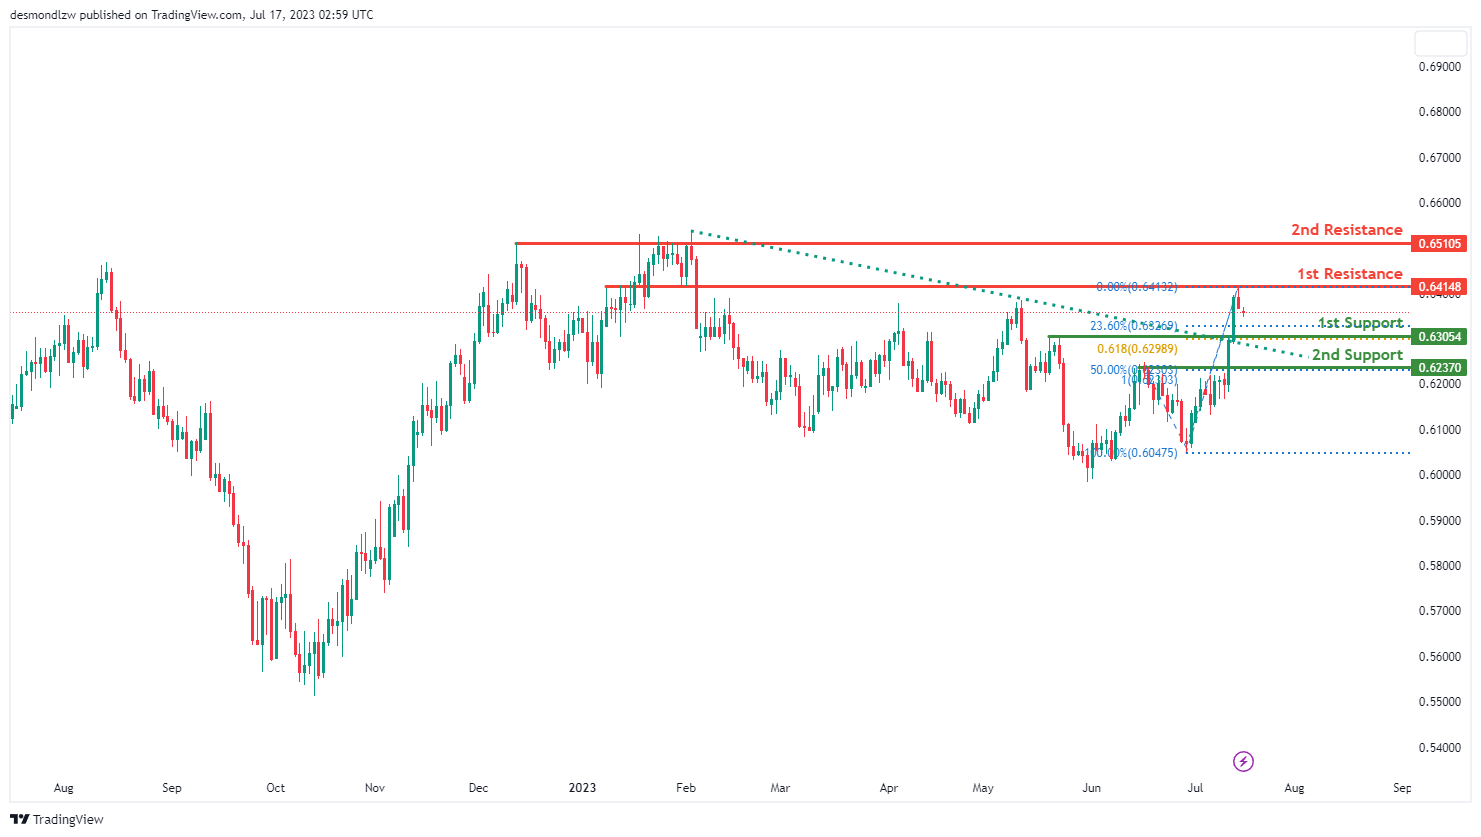
The NZD/USD pair is currently showing bullish momentum, which might be due to the price breaking above a descending resistance line, indicating a potential bullish move.
Even though the overall trend is bullish, the price could drop to the 1st support level in the short term before bouncing back up and moving towards the 1st resistance. The 1st support at 0.6305 is backed by a pullback support, 23.60% Fibonacci retracement, and a 61.80% Fibonacci projection, indicating a significant Fibonacci confluence. If the price drops below this level, the 2nd support at 0.6237 could provide further protection. This level is also a pullback support and shows a Fibonacci confluence with a 50% Fibonacci retracement and a 100% Fibonacci extension.
If the price bounces back from these support levels, it could encounter resistance at 0.6414, characterized by overlap resistance. Should the price surpass this level, the next resistance at 0.6510 could pose a challenge. This level represents a multi-swing high resistance and could significantly influence the future direction of the pair.
DJ30:
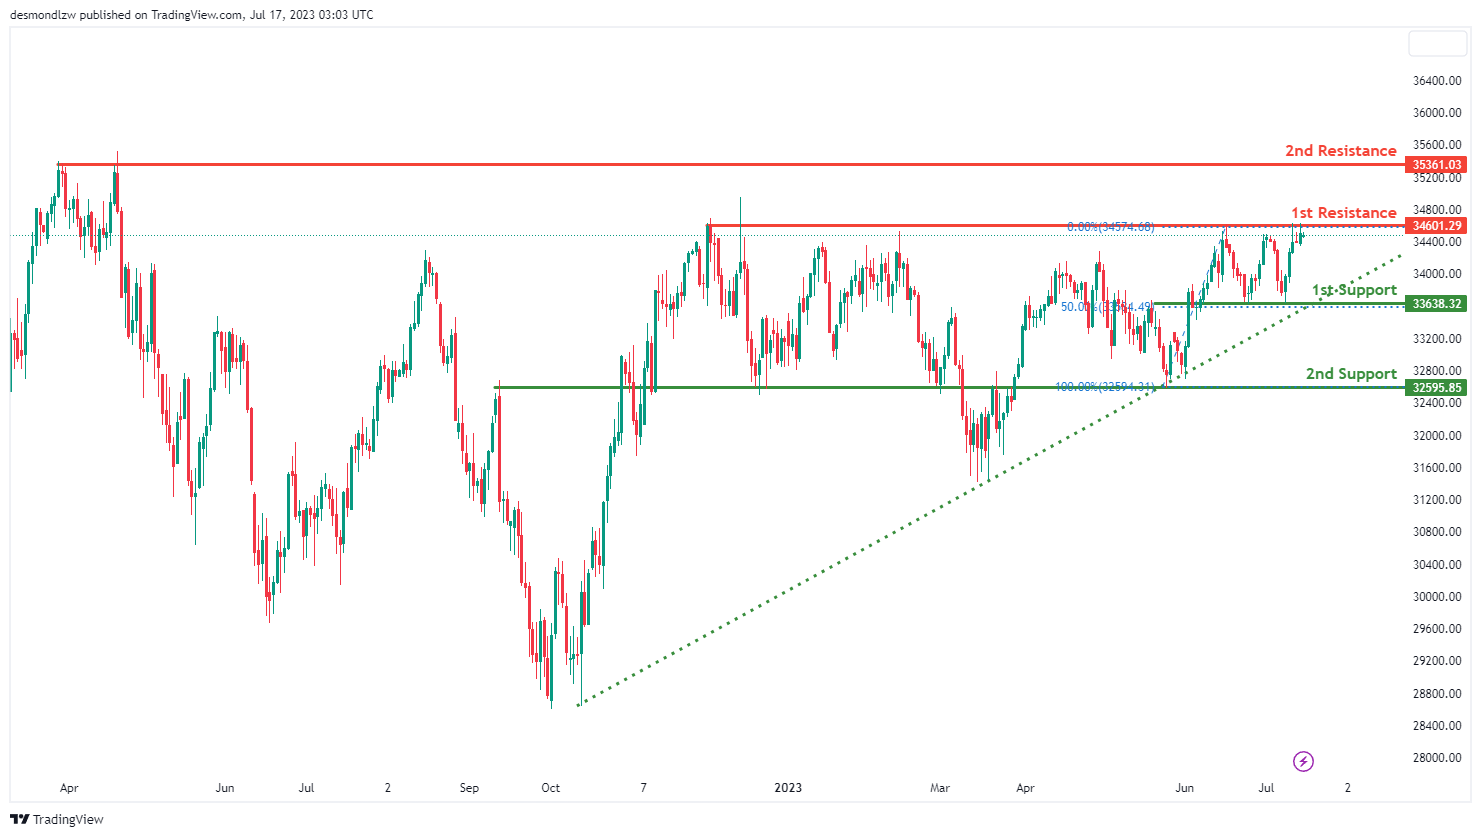
The DJ30, or Dow Jones Industrial Average, is currently showing bullish momentum. The price is above a significant ascending trend line, suggesting that further bullish momentum could be in the cards.
However, the price could potentially make a bearish reaction off the 1st resistance and drop to the 1st support. The 1st support level at 33638.32 is solidified by an overlap support and a 50% Fibonacci retracement. Should the price dip below this level, the 2nd support at 32595.85, backed by overlap support, could offer additional safeguard.
On the upside, the 1st resistance is at 34601.29, characterized by a multi-swing high resistance. If the price manages to break this level, it could encounter resistance at 35361.03, another multi-swing high resistance. These resistance levels could play a crucial role in determining the future trajectory of the DJ30.
GER30:
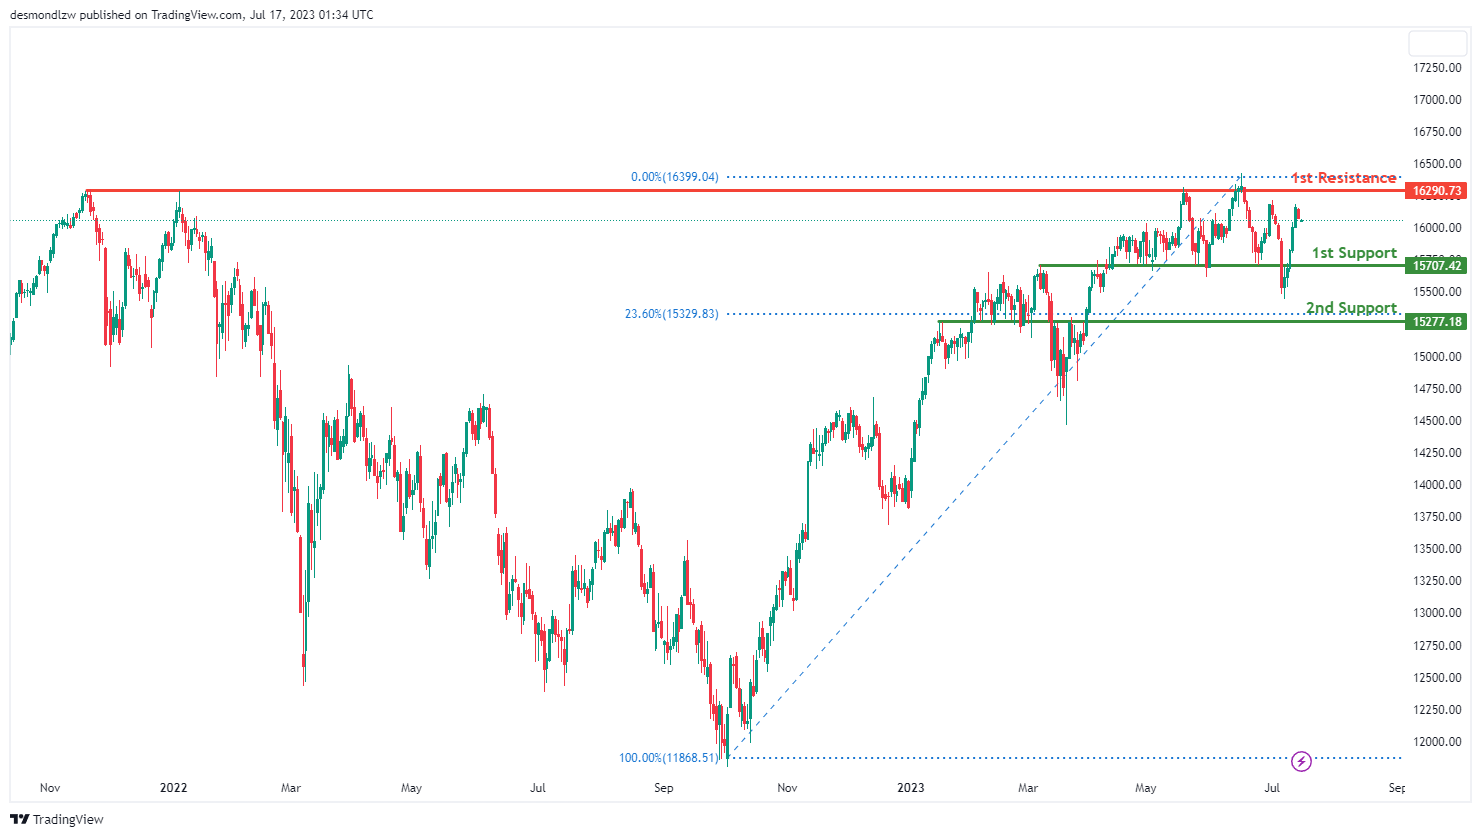
The GER30, or DAX 30, currently displays a bearish momentum. The price could potentially continue its bearish trend towards the 1st support level.
The 1st support level is at 15707.42, which has been established as a pullback support. If this level fails to hold, the price could fall towards the 2nd support level at 15277.18, backed by pullback support and a 23.60% Fibonacci retracement. These two support levels could provide key areas of interest for potential rebounds.
On the other hand, if the price reverses its bearish course, it could face resistance at the 16290.73 level, defined by multi-swing high resistance. This level may act as a critical point for the future trajectory of GER30. Should the price break above this resistance, it could suggest a potential change in the current bearish trend.
US500
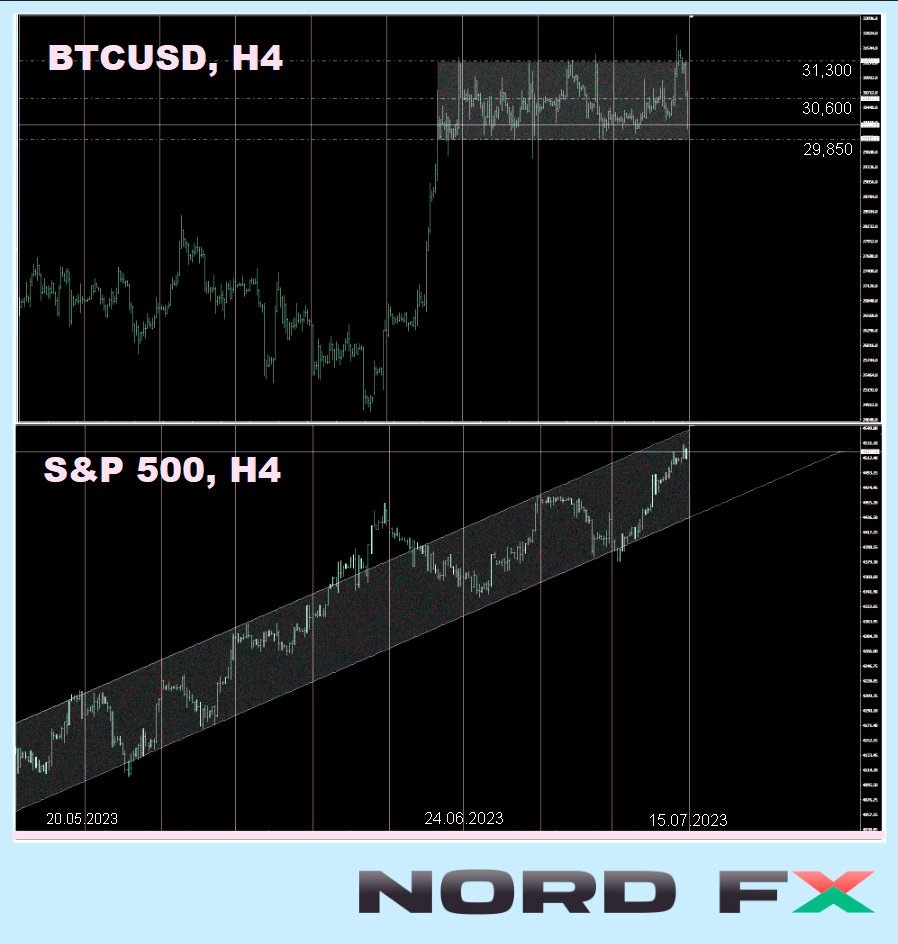
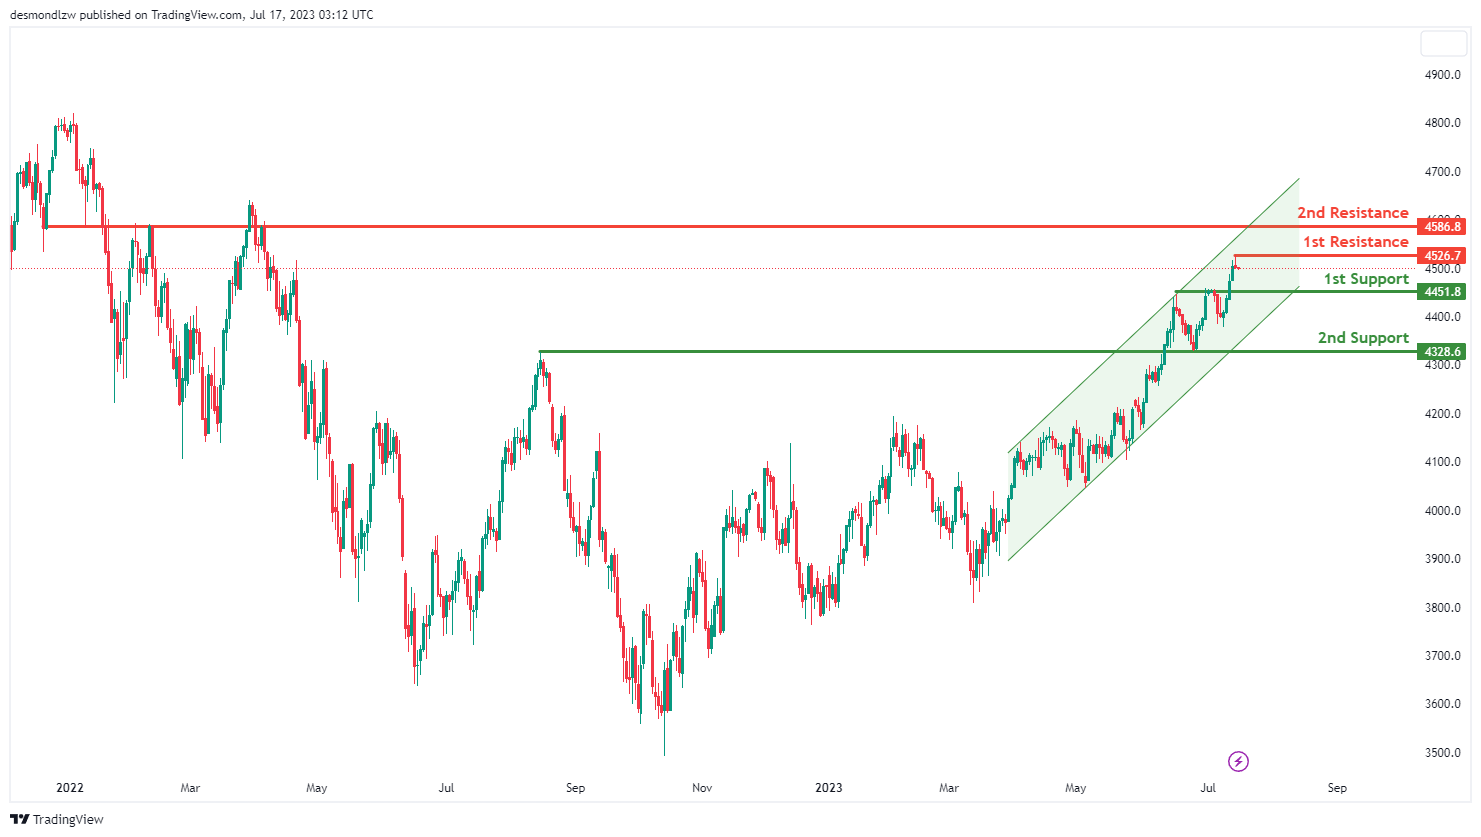
The US500, also known as the S&P 500, is currently showing bearish momentum despite being in a bullish ascending channel. This suggests that the price could experience a bearish reaction at the 1st resistance level and drop to the 1st support level, before bouncing off this support level to continue the bullish trend.
The 1st support level is at 4451.80 and is recognized as a pullback support. If the price fails to hold at this level, it could fall towards the 2nd support level at 4328.60, which is backed by overlap support. These support levels represent critical zones where buying interest could potentially outweigh selling interest, leading to a possible rebound in the price.
Conversely, if the price reverses its bearish course, it could face resistance at 4526.70, a level identified as a swing high resistance. If it continues to rise, it could face further resistance at 4586.80, which is also considered an overlap resistance. These resistance levels may act as barriers to price progress and could trigger a selling response.
BTC/USD:
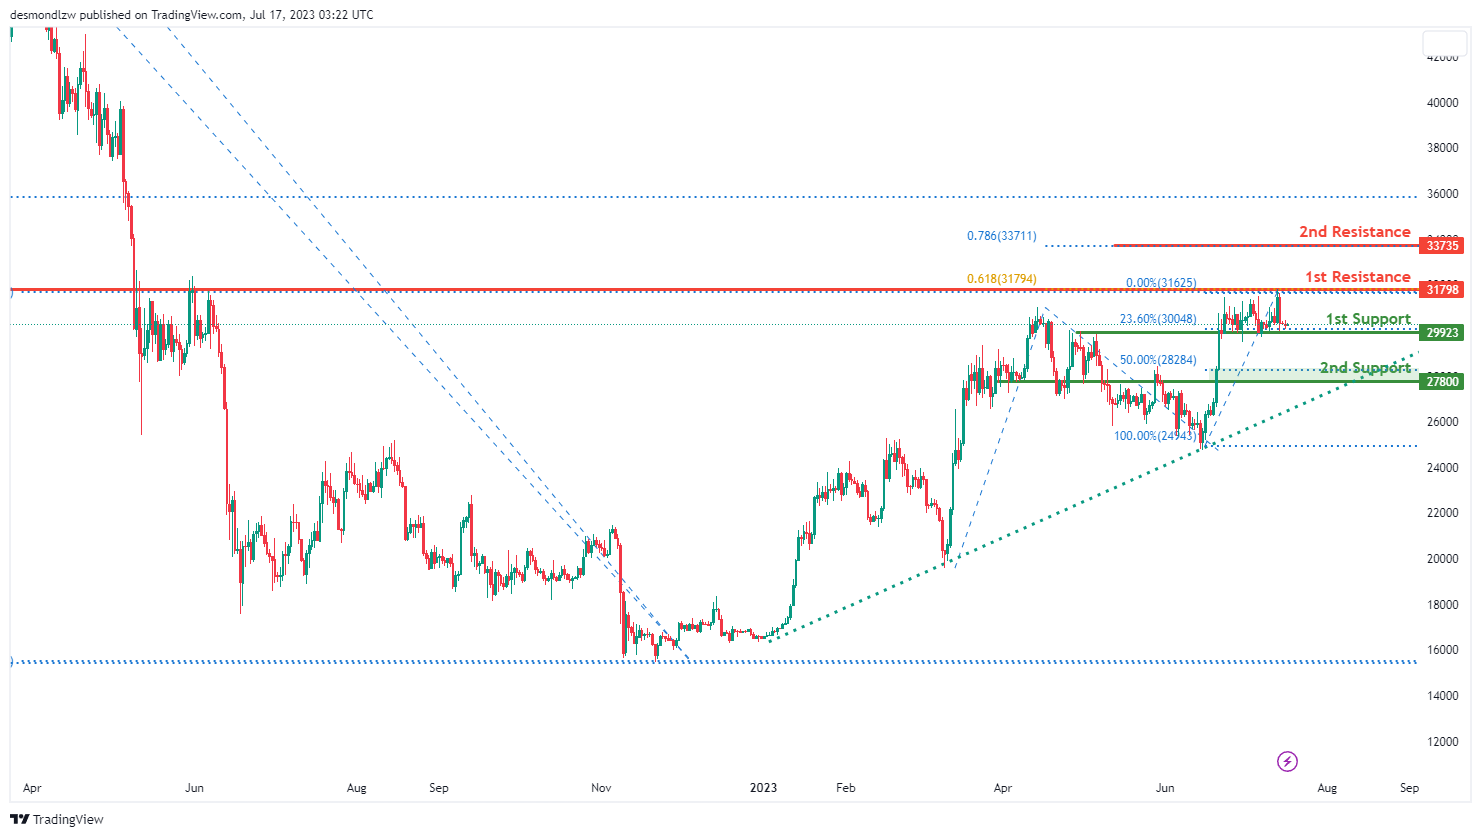
For the BTC/USD instrument, the overall momentum of the chart is currently neutral, which suggests that the price could potentially fluctuate between the 1st resistance and 1st support level.
The 1st support level is at 29923, identified by overlap support and a 23.60% Fibonacci retracement. If this support level fails to hold, the price could potentially drop to the 2nd support level at 27800, which is recognized as a pullback support and is also at the 50% Fibonacci retracement level. These support levels are critical areas where buying interest could outweigh selling pressure and lead to a price rebound.
On the other hand, if the price starts to rise, it could face resistance at 31798. This level is identified as an overlap resistance and a 61.80% Fibonacci projection. Further above, the 2nd resistance level is at 33735, which could also act as a strong barrier for upward price movement and potentially trigger a selling response.
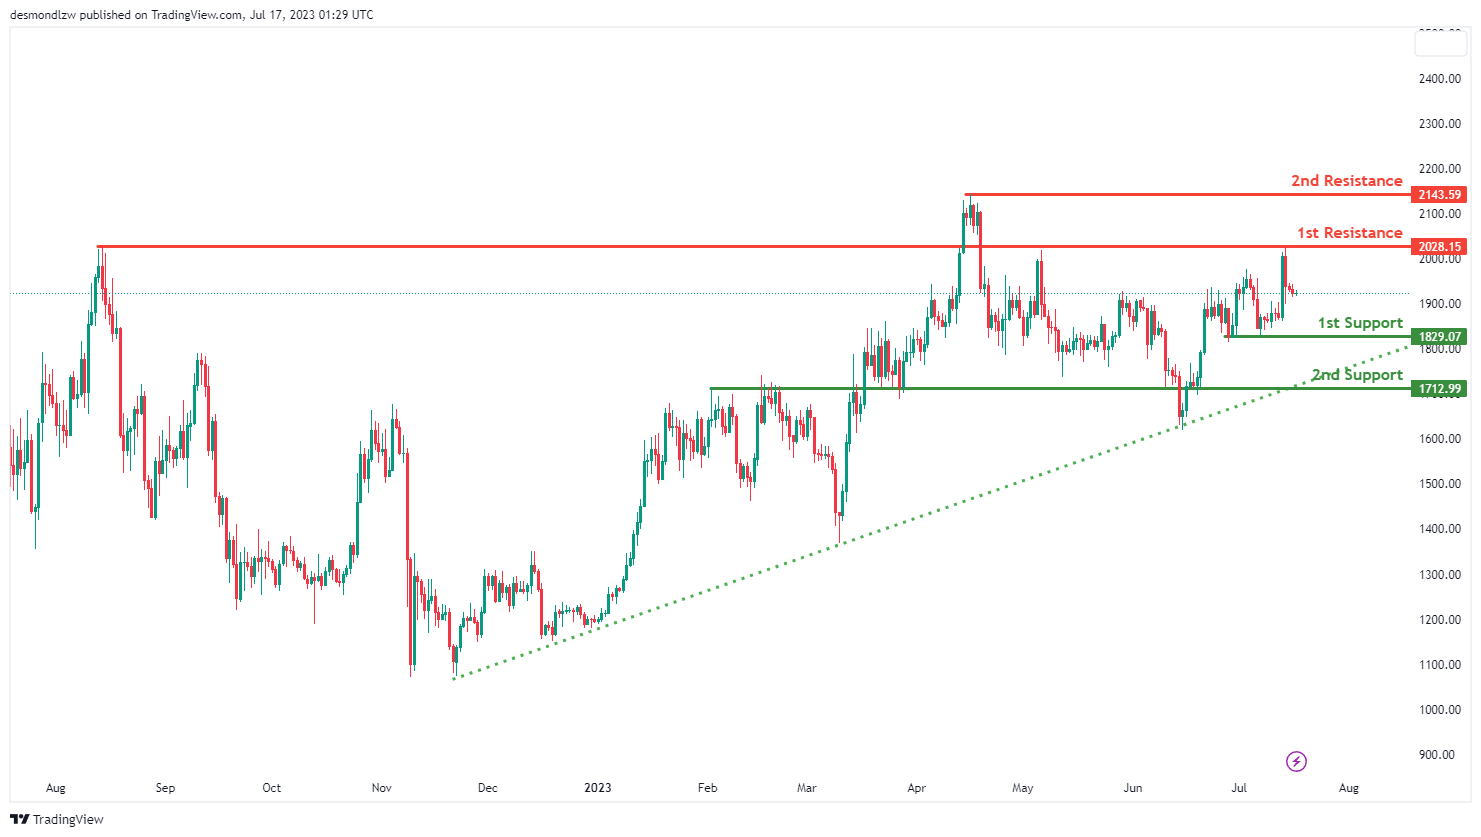
ETH/USD:
For the ETH/USD instrument, the overall momentum of the chart is currently neutral, which suggests that the price could potentially fluctuate between the 1st resistance and the 1st support level.
The 1st support level is at 1829.07, identified by a multi-swing low support. If this support level fails to hold, the price could potentially drop to the 2nd support level at 1712.99, which is recognized as an overlap support. These support levels are critical areas where buying interest could outweigh selling pressure and lead to a price rebound.
On the other hand, if the price starts to rise, it could face resistance at 2028.15. This level is identified as an overlap resistance. Further above, the 2nd resistance level is at 2143.59, which could also act as a strong barrier for upward price movement and potentially trigger a selling response.
WTI/USD:
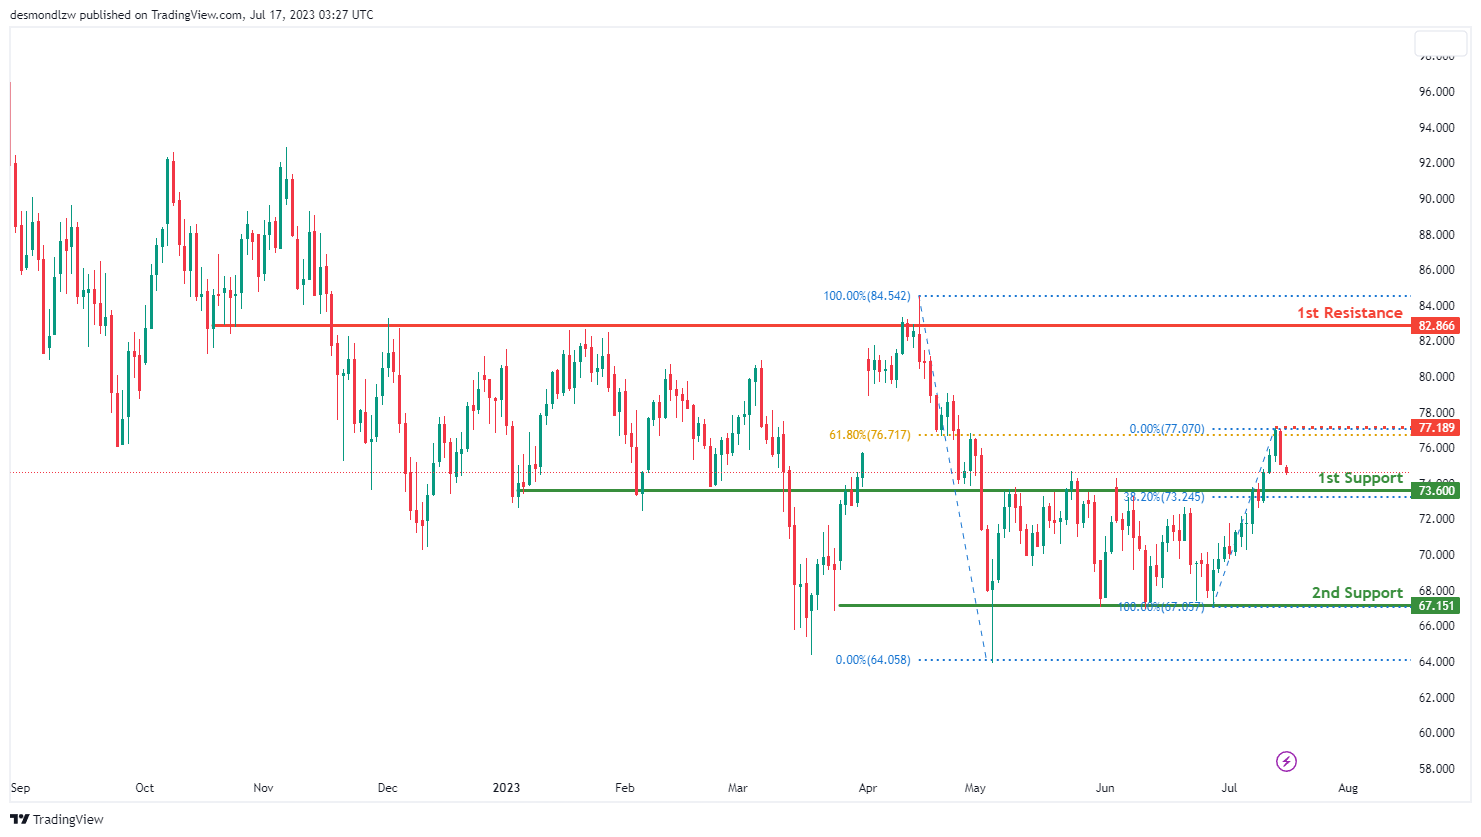
For the WTI instrument, the overall momentum of the chart is bearish. This suggests that the price could potentially continue its downward trend towards the 1st support level.
The 1st support level is located at 73.60, which is identified as a pullback support and aligns with the 38.20% Fibonacci retracement level. If the price fails to maintain this level, it could further descend to the 2nd support level at 67.15, characterized by a multi-swing low support. These support levels mark crucial zones where the buying interest might potentially overcome the selling pressure, leading to a possible price reversal.
On the contrary, if the price starts to climb, it could face resistance at 82.86, an overlap resistance. Furthermore, there’s an intermediate resistance level at 77.18, identified as a swing high resistance and corresponding to the 61.80% Fibonacci retracement level. These resistance levels could act as significant barriers for upward price movement and might instigate a selling response.
XAU/USD (GOLD):
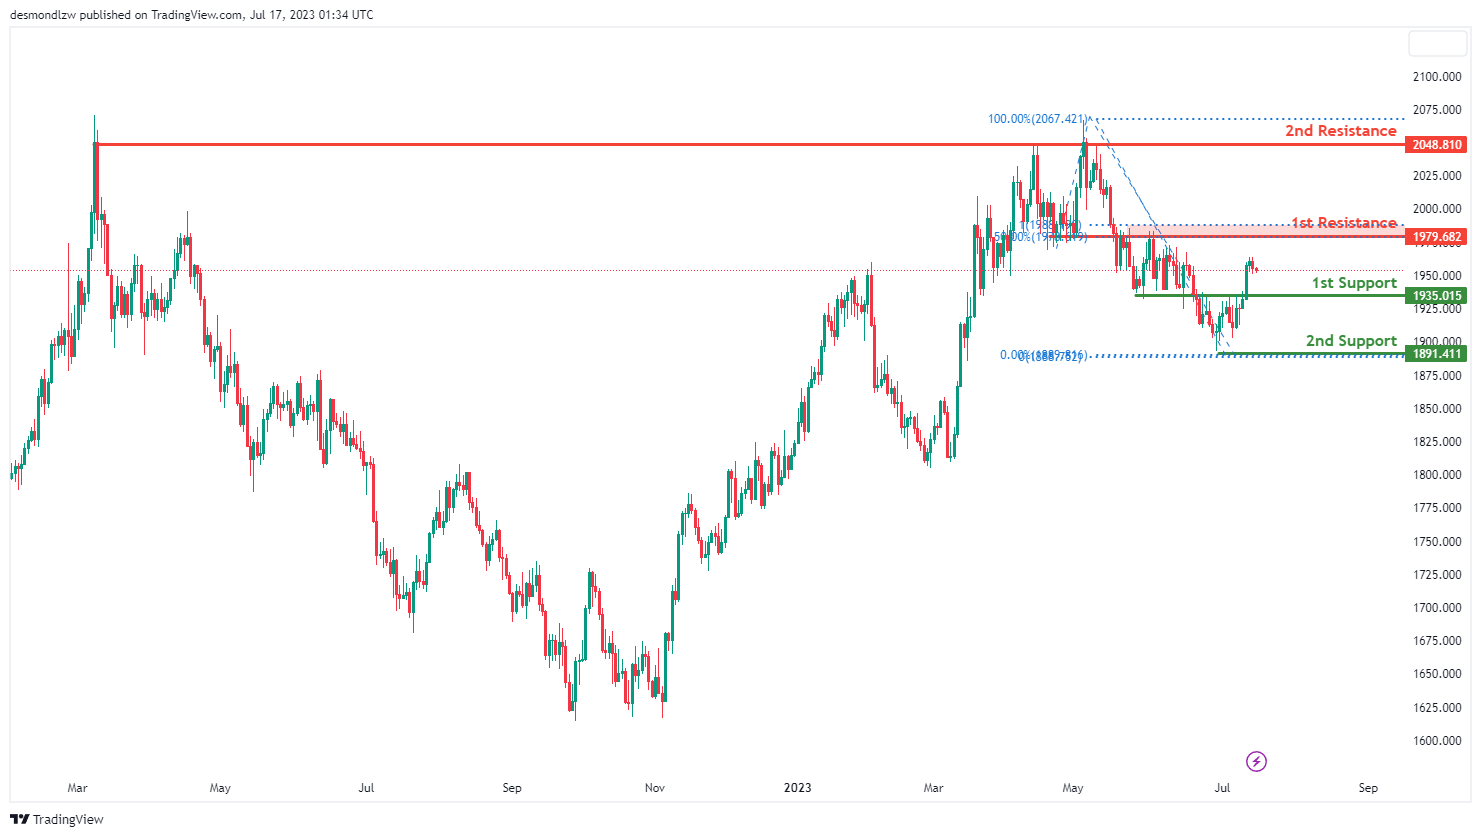
For the XAUUSD instrument, the overall momentum of the chart is bearish. This suggests that the price could potentially continue its downward trend towards the 1st support level.
The 1st support level is situated at 1935.01, defined as a pullback support. If the price breaks this level, it could further descend to the 2nd support level at 1891.41, which is characterized by a swing low support. These support levels mark significant zones where buying interest might potentially outweigh the selling pressure, leading to a potential price rebound.
On the other hand, if the price begins to ascend, it could face resistance at 1979.68, identified as an overlap resistance. This resistance level corresponds to the 50% Fibonacci retracement level and 100% Fibonacci projection, indicating Fibonacci confluence. Further above, the 2nd resistance level is at 2048.81, defined by a multi-swing high resistance. These resistance levels might act as significant barriers for upward price movement and could trigger a selling response.
China’s annual GDP growth missed expectations, youth unemployment hit new record
China's Q2 GDP growth rose by 6.3% yoy, an improvement from Q1's 4.5% but fell short of expectation 7.1% yoy. On a quarter-to-quarter basis, GDP grew by 0.8%, deceleration from the previous quarter's 2.2% but still outpacing projected 0.5%.
Despite being the fastest annual pace since Q2 2021, this performance appears skewed due to low base effect from last year's lockdown. For H1 as a whole, GDP expanded by 5.5% when compared to the same period last. This growth outperformed the government's modest target of approximately 5% for the year.
Other figures published by the National Bureau of Statistics on Monday painted a mixed picture. In June, retail sales increased by 3.1% yoy, falling short of the expected 3.5% and down significantly from May's 12.7% growth. On a brighter note, industrial production, reflecting activity in manufacturing, mining, and utilities sectors, surged by 4.4% yoy last month, a jump from May's 3.5% and surpassing expectations of 2.6%.
Fixed-asset investment, traditionally used to bolster growth, rose by 3.8% yoy in the first half of 2023, a slowdown from the 4% increase witnessed in the first five months. However, this growth exceeded the expected 3.4%.
In terms of employment, the picture appears bleak for the younger generation. Unemployment rate for those aged 16-24 reached a record 21.3% in June, up from 20.8% in May. Conversely, overall urban surveyed jobless rate remained static at 5.2% last month.
In a separate announcement, PBoC maintained the rate on CNY 103B worth of one-year medium-term lending facility loans to some financial institutions at 2.65%.
DJIA Technical: Bulls Retreated Again at Key Range Resistance
- Dow Jones Industrial Average (DJIA) has underperformed the S&P 500 and Nasdaq 100 in the past two weeks.
- Last Friday’s initial bullish price actions of DJIA retreated at 34,630 key range resistance.
- Minor uptrend from the 10 July 2023 low of 33,595 has shown signs of exhaustion.
Last week’s advance halted at 7-month range resistance
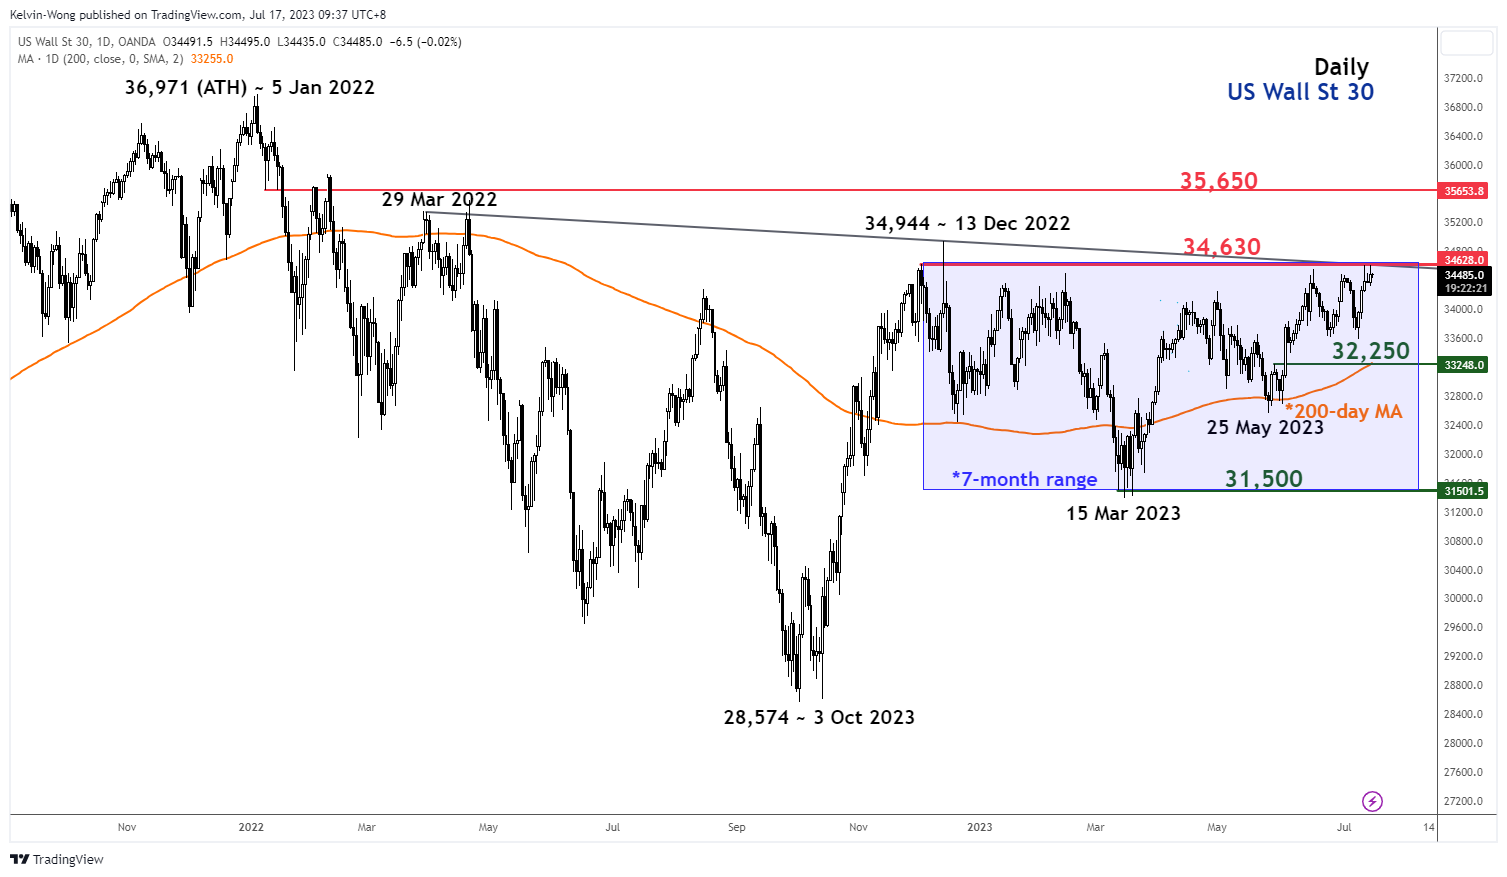
Fig 1: US Wall St 30 medium-term trend as of 17 Jul 2023 (Source: TradingView, click to enlarge chart)
Since the 13 December 2022 high of 34,944, the US Wall St 30 Index (proxy of the Dow Jones Industrial Average futures) has continued to oscillate within a 7-month sideways range configuration.
The 3% rally from the 10 July 2023 minor low of 33,595 has been rejected at the 34,640 range resistance for the third time last Friday, 14 July, and confluences with a major descending trendline that capped previous up moves since the 29 March 2022 high.
Short-term momentum has flashed a bullish exhaustion signal
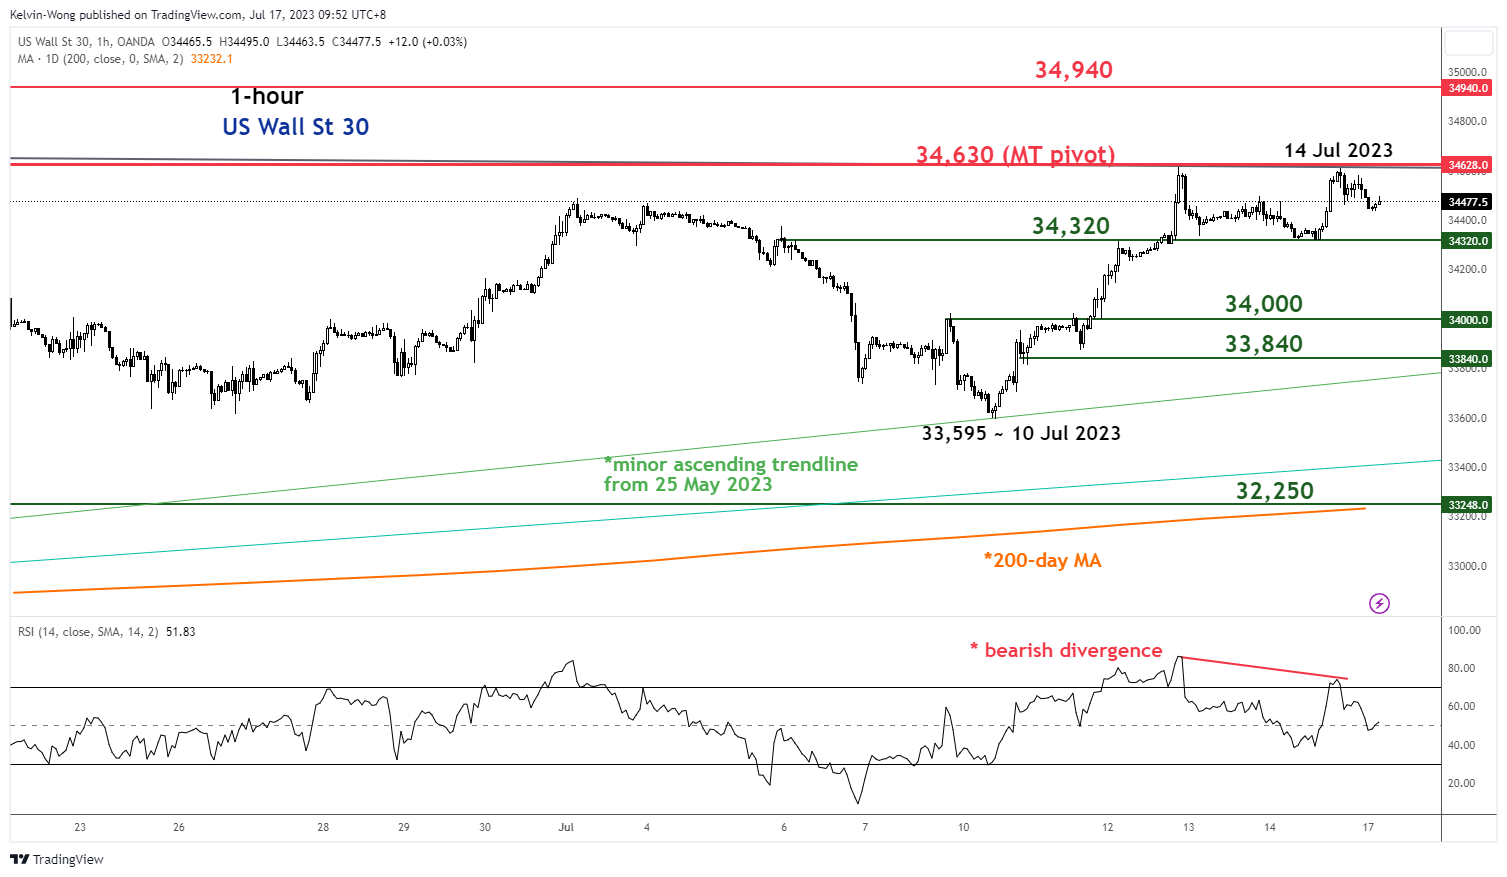
Fig 2: US Wall St 30 minor short-term trend as of 17 Jul 2023 (Source: TradingView, click to enlarge chart)
The hourly RSI oscillator has flashed a bearish divergence signal at its overbought region which suggests that it is likely the upside momentum of the minor short-term uptrend from the 10 July 2023 low of 33,595 has been exhausted which in turn increases the odds of a minor decline.
Watch the 34,630 key medium-term pivotal resistance to maintain the short-term bearish bias with near-term support coming in at 34,320. A break below it exposes the next supports at 34,000 and 33,840.
However, a clearance above 34,630 sees a potential bullish breakout from the 7-month range with the intermediate resistance coming in at 34,940 in the first step.
EUR/USD Smashes Resistance and Aims More Upsides
Key Highlights
- EUR/USD gained bullish momentum and cleared the 1.1150 resistance.
- A major bullish trend line is forming with support near 1.1165 on the 4-hour chart.
- GBP/USD also cleared the 1.3000 resistance and extended gains.
- Crude oil price started a downside correction from the $77.25 zone.
EUR/USD Technical Analysis
The Euro started a major increase above the 1.1150 resistance against the US Dollar. EUR/USD even broke 1.1200 to move further into a bullish zone.
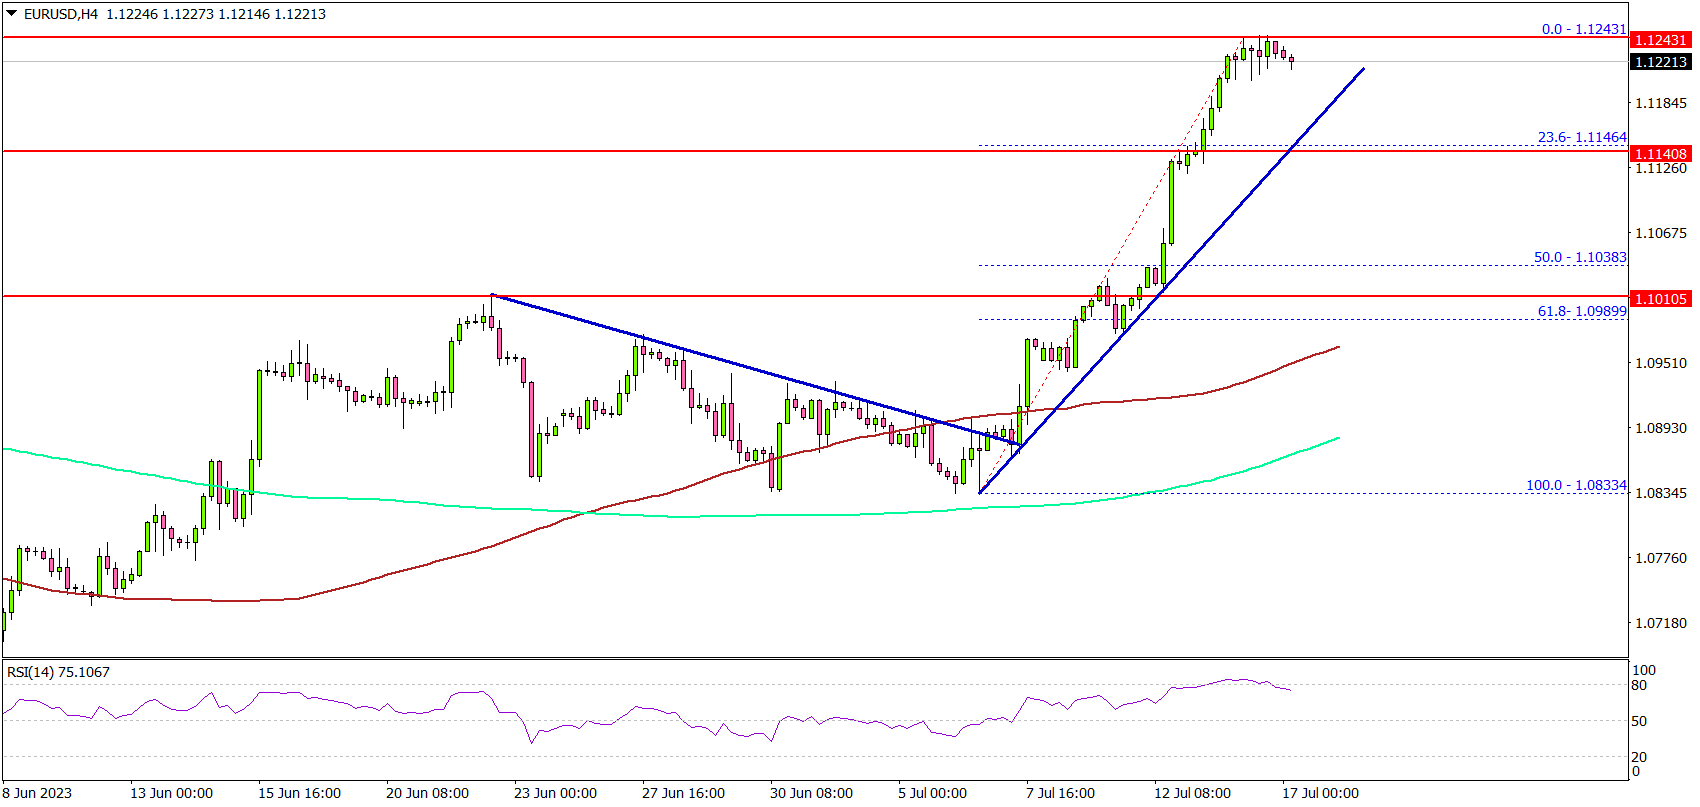
Looking at the 4-hour chart, the pair settled above the 1.1200 level, the 200 simple moving average (green, 4 hours), and the 100 simple moving average (red, 4 hours).
It tested the 1.1250 zone and started a consolidation phase. Immediate support is near the 1.1180 level. There is also a major bullish trend line forming with support near 1.1165 on the same chart.
The next major support is at 1.1080, below which there could be a drop to 1.1040. Any more losses might send the pair toward the 1.0980 support zone. On the upside, immediate resistance is near the 1.1250 level.
The next major resistance is near 1.1320. If there is a move above the 1.1320 resistance, the pair could rise toward 1.1350. Any more gains might send the pair toward the 1.1450 resistance zone in the near term.
Looking at GBP/USD, the pair gained strength above the 1.3000 resistance zone and it is currently consolidating gains.
Economic Releases
- NY Empire State Manufacturing Index for July 2023 – Forecast 0, versus 6.6 previous.
Forex and Cryptocurrencies Forecast
EUR/USD: Falling Inflation Has Crushed the Dollar
So, we can either congratulate (or, conversely, upset) everyone with the onset of a global process of dedollarization. As Bloomberg reports, after the inflation rate in the US approached 3.0%, which is not far off the Federal Reserve's target of 2.0%, it seems like a turning point is approaching for the US economy.
Last week, the dollar faced the most significant pressure from national macroeconomic statistics in over a year. The Consumer Price Index (CPI) published on Wednesday, July 12, showed a 0.2% increase in June, falling short of the forecasted 0.3%. The annual indicator dropped from 4.0% to 3.0%, reaching the lowest level since March 2021. Core inflation also fell from 5.3% in May to 4.8% in June, against a forecast of 5.0%.
Against the backdrop of such steady deceleration in inflation, market participants began to factor into the quotations both a refusal of the second Federal Reserve rate hike, as well as an imminent turnaround in monetary policy. According to CME Group FedWatch data, the likelihood that the regulator will raise the rate again after a 25-basis point hike in July has fallen from 33% to 20%. As a result, most financial instruments have made a successful onslaught on the dollar. Meanwhile, the market completely ignored statements by Neel Kashkari, President of the Federal Reserve Bank of Minneapolis, his Federal Reserve Bank of Richmond colleague Thomas Barkin, and Federal Reserve Board member Christopher Waller that inflation is still above the target level and hence the Federal Reserve is ready to continue tightening its policy (QT).
The story of the dollar's decline did not end there. EUR/USD continued its rally after the US Bureau of Labor Statistics reported on Thursday, July 13, that the Producer Price Index (PPI) had grown by just 0.1% in annual terms in June (forecast was 0.4%, May value was 0.9%). As a result, the DXY Dollar Index broke the 100.00 support level and fell to the values of April 2022, and EUR/USD reached its highest level since February 2022, marking a high at 1.1244.
Many market participants decided that the best times for the US currency are over. The US economy will slow down, inflation will reach target values, and the Federal Reserve will begin a campaign to soften its monetary policy. As a result, the second half of 2023 and 2024 will become a period of strengthening for other currencies against the dollar. The result of such expectations was the fall of the Spot USD Index to a 15-month low, and hedge funds exclusively engaged in selling the US currency for the first time since March.
After a crushing week for the dollar, EUR/USD finished at 1.1228. As for near-term prospects, at the time of writing this overview, on the evening of July 14, 30% of analysts voted for the pair's further growth, 55% for its decline, and the remaining 15% took a neutral stance. Among trend indicators and oscillators on D1, 100% are on the side of the greens, although a third of oscillators signal the pair is overbought.
The nearest support for the pair is located around 1.1200, then at 1.1170, 1.1090-1.1110, 1.1045, 1.0995-1.1010, and 1.0895-1.0925. Bulls will meet resistance around 1.1245, 1.1290-1.1310, 1.1355, 1.1475, and 1.1715.
The blackout period leading up to the next Federal Open Market Committee (FOMC) meeting, which is set for July 26, will begin on July 15. Therefore, it's not worth expecting any statements from Federal Reserve officials in the coming week. The quotations will only be influenced by the macroeconomic data hitting the market. On Tuesday, July 18, data on US retail sales will be released. On Wednesday, July 19, we will find out what is happening with inflation (CPI) in the Eurozone. Then on Thursday, July 20, data on unemployment, manufacturing activity, and the housing market in the United States will come in.
GBP/USD: The Potential for Growth Remains
Back at the end of June, we speculated that GBP/USD might cover the remaining distance to 1.3000 in just a few weeks or even days. And we were right. In the current situation, the British pound did not miss an opportunity for growth: the peak of the week was recorded at the height of 1.3141, which corresponds to the levels of the end of March - beginning of April 2022. The final note of the five-day period sounded at the mark of 1.3092.
In addition to a weakening dollar, another driver of the pound's growth was the semi-annual report on the assessment of the UK's financial system. It demonstrated the resilience of the national economy against the backdrop of a prolonged cycle of raising the key interest rate. Unlike several US banks, major UK banks maintain high capitalization, and their profits are growing. This suggests that they can withstand several more rate hikes this year. It is expected that at its next meeting on August 3, the Bank of England (BoE) will raise the rate by another 50 basis points (bps) to 5.50%. And it will do so regardless of potential economic problems, as the fight against rising prices is more important. Consumer inflation (CPI) in the country in May was 8.7% (for comparison, over the same period in Germany it was 6.1%, in France 4.5%, in Japan 3.2%, and in the USA 4.0% in May and 3.0% in June).
The UK's labour market is also pushing inflation upwards. Even despite the increase in the interest rate, the latest report noted an acceleration in wage growth to 6.9% YoY. Excluding the turbulence during the Covid-19 pandemic, this is the fastest pace since 2001. And although unemployment is rising alongside wages, its current level of 4.0% is still historically low. Yes, in August of last year it was lower - 3.5%, but what is a growth of only 0.5% almost over a year? It's nothing! (Or almost nothing).
In general, in the foreseeable future, there are no major obstacles that would prevent the Bank of England from continuing to tighten monetary policy. Thus, the prospect of further rate hikes will continue to fill the sails of the British currency with a tailwind. And, according to a number of analysts, GBP/USD, having broken through the 1.3000 resistance, may now aim for an assault on the 1.3500 level.
However, this does not mean that such growth will happen right now. "In a sense, the pound has already experienced overvaluation against the backdrop of a hawkish Bank of England and is unlikely to show strong results against the current bearish phase of the dollar. However, traders will now be targeting 1.3300 on GBP/USD assuming we can close the week above 1.3000," believe strategists from the largest banking group in the Netherlands, ING.
The possibility of the pound's consolidation in the coming week is also suggested by Canada's Scotiabank, not ruling out pullbacks to 1.2900-1.3000 and further growth to the area of 1.3300. The bullish sentiment is also supported by Singapore's United Overseas Bank. Its economists believe that "the strong growth momentum suggests that GBP/USD is unlikely to pull back. On the contrary, it is more likely to continue moving towards the upper boundary of the weekly exponential moving average. This key resistance level is currently at 1.3335."
When it comes to the median forecast for the near future, at the moment only 25% of experts have spoken out for further growth of the pair. The opposite position was taken by 50%, the remaining 25% maintained neutrality. As for technical analysis, all 100% of trend indicators and oscillators are pointing upwards, although a quarter of the latter are in the overbought zone. If the pair moves south, it will encounter support levels and zones – 1.3050-1.3060, then 1.2980-1.3000, 1.2940, 1.2850-1.2875, 1.2740-1.2755, 1.2675-1.2695, 1.2570, 1.2435-1.2450, 1.2300-1.2330. In the case of the pair's rise, it will meet resistance at levels 1.3125-1.3140, 1.3185-1.3210, 1.3300-1.3335, 1.3425, 1.3605.
The events of the upcoming week worth noting in the calendar are Wednesday, July 19, when the value of such an important inflation indicator as the United Kingdom's Consumer Price Index (CPI) will become known. Towards the end of the working week, on Friday, July 21, data on retail sales in the country will also be published. These figures can have a significant impact on the exchange rate, as they provide insights into consumer spending and overall economic activity, which are key factors in the Bank of England's decisions on interest rates.
USD/JPY: The Yen Pleased Investors Once Again
For the second week in a row, yen investors have been rewarded for their patience. USD/JPY continued its descent from the Moon to Earth, marking a local minimum at 137.23. Thus, since June 30th, in just two weeks, the Japanese currency has gained more than 780 points against the US dollar.
Compared to other currencies included in the DXY basket, the yen appears to be the primary beneficiary. The main ace up this safe-haven currency's sleeve is investor fears about a recession in the US and narrowing yield differentials on US government bonds. The correlation between Treasuries and USD/JPY is no secret to anyone. If the yield on US Treasury bills falls, the yen shows growth against the dollar. Last week, following the publication of CPI data, the yield on 10-year US papers slipped from 3.95% to 3.85%, and on 2-year papers – from 4.85% to 4.70%.
Speculation that the Bank of Japan (BoJ) may finally adjust its ultra-loose monetary policy towards tightening in the coming months also continues to favor the yen. We are talking about speculation here, as no clear signals have been given by the country's Government or the BoJ leadership on this matter.
Let's recall that at the French Societe Generale, it's expected that the yield on 5-year US bonds will fall to 2.66% in a year's time, which will allow USD/JPY to break below 130.00. If, at the same time, the yield on Japanese government bonds (JGBs) remains at its current level, the pair could even drop to 125.00. Economists at Danske Bank are forecasting a USD/JPY rate below 130.00 within a 6–12-month horizon. Similar forecasts are made by strategists at BNP Paribas: they are aiming for a level of 130.00 by the end of this year and 123.00 by the end of 2024. Against this backdrop, many hedge funds have begun active selling of dollars and buying of yen.
Last week, USD/JPY ended at 138.75 after a correction to the north. As of this review, 45% of analysts believe the pair will resume growth in the coming days. Only 15% support further fall, and 40% maintain a wait-and-see stance. The D1 indicators are as follows: 100% of oscillators are coloured red, but 10% signal oversold. The balance between green and red among trend indicators is 35% to 60%. The nearest support level is in the 138.05-138.30 zone, followed by 137.25-137.50, 135.95, 133.75-134.15, 132.80-133.00, 131.25, 130.60, 129.70, 128.10, and 127.20. The closest resistance is 1.3895-1.3905, then 139.85, 140.45-140.60, 141.40-141.60, 142.20, 143.75-144.00, 145.15-145.30, 146.85-147.15, 148.85, and finally the October 2022 high of 151.95.
No significant economic information related to the Japanese economy is expected in the upcoming week. However, traders may want to note that Monday, July 17th is a holiday in Japan: the country is observing Marine Day.
CRYPTOCURRENCIES: Karl Marx and $120,000 for BTC
After the release of impressive consumer inflation data in the US last week, the markets became confident in the Fed's imminent abandonment of monetary restriction and a turn towards lowering the key rate. The dollar responded to this with a sharp fall, and risky financial instruments - with growth. The S&P500, Dow Jones, and Nasdaq Composite stock indices went up, but not bitcoin. The BTC/USD pair continued to move sideways along the Pivot Point $30,600, trapped in a narrow range. It seems as if it has completely forgotten about its direct correlation with stocks and its inverse correlation with the dollar. On Thursday, July 13, after the release of the American PPI, bitcoin still tried to break through to the north, but unsuccessfully: the very next day it returned within the limits of the sideways channel.
Why did this happen? What prevented digital gold from soaring along with the stock market? There don't seem to be any super serious reasons for this. Although analysts do point to three factors that are weighing on the crypto market.
The first of these is the low profitability of mining. Due to the increasing computational complexity, it remains close to a historical minimum. Moreover, it is accompanied by the fear of a possible new price drop. This is pushing miners to sell not only freshly mined coins (about 900 BTC per day), but also accumulated reserves. According to Bitcoinmagazine data, miners have transferred a record volume of coins to exchanges in the last six years.
In addition to miners, the US Government is contributing to the increase in supply. On just one day, July 12, it transferred $300 million worth of coins to crypto exchanges. And this is the second negative factor. Finally, the third is the bankrupt Mt.Gox exchange, which must pay customers everything that remains in its accounts by the end of October. This equates to approximately 135,900 BTC, totalling roughly $4.8 billion. Payments will be made in cryptocurrency, which will then be available on the market for sale and exchange for fiat.
Of course, all of this does not add positivity, increasing the supply but not the demand. However, considering that the average trading volume of bitcoin exceeds $12 billion daily, the figures mentioned do not seem that apocalyptic. In our view, the main reason for the current sideways trend is a balance between positives and negatives. The positives are the applications to launch spot btc-ETFs from such giants as BlackRock, Invesco, Fidelity, and others. The negatives are the increasing regulatory pressure on the crypto market by the US Securities and Exchange Commission (SEC).
It should be noted that the SEC has previously rejected all applications for spot BTC-ETFs and is not currently eager to give them the green light. Therefore, the struggle for these funds could be drawn out over many months. For instance, a final decision on BlackRock's application is not expected until mid-Q3 2023 at the earliest, and no later than mid-March 2024, just a month before the next BTC halving. The halving could be the trigger for not only the subsequent, but also the preceding growth of BTC.
According to economists at Standard Chartered Bank, the price of bitcoin may exceed $50,000 this year, and it could reach $120,000 by the end of the next year. In the view of bank analyst Geoff Kendrick, as the price rises, miners will return to a strategy of accumulation. As already mentioned, they are currently selling everything they mine. However, when bitcoin is trading at $50,000, their sales will decrease from the current 900 coins to 180-270 per day. Such a decrease in supply should lead to further growth in the value of the asset. In general, everything is in line with Karl Marx's economic theory of supply and demand.
In addition to miners, institutional investors are also expected to show interest in accumulating bitcoins, in anticipation not only of the launch of spot BTC-ETFs and the halving, but also of a shift in the Federal Reserve's monetary policy and a weakening of the dollar. As Grayscale Investments CEO Michael Sonnenshein recently stated, it has become clear that the first cryptocurrency is no longer a "passing fad". "Recent news [...] underscores the resilience of this asset class in a broader sense, and many investors view [digital gold] as a unique investment opportunity."
Analyst and trader Michael Pizzino also believes that the dollar is ready to significantly depreciate. However, he does not consider an apocalyptic scenario of a collapse of the world's main currency, as the dynamics of its exchange rate are slower than those of other classes of financial assets. However, Pizzino predicts a steady downward trend in USD in the foreseeable period and a redistribution of funds in favor of digital assets. The macrographic chart suggests their upward trend, and given the correlation between USD and BTC, a fall in the former could contribute to an increase in the value of the latter, followed by growth in other significant crypto assets.
Robert Kiyosaki, author of the famous book "Rich Dad, Poor Dad", claims that by 2024, bitcoin will reach the $120,000 mark. The economist bases his forecast on the fact that BRICS countries (Brazil, Russia, India, China, and South Africa) will soon move to the gold standard and issue their own cryptocurrency backed by gold. This could undermine the dominance of the U.S. dollar in the world economy and cause its devaluation. He also warns that many traditional financial institutions may go bankrupt in the near future due to their imprudent decisions and corruption. In this regard, Kiyosaki recommends protecting your money from inflation by buying physical gold and bitcoin.
A similar figure, only not at the beginning, but by the end of 2024, was named by the head of research at the crypto-financial service Matrixport, Markus Thielen. He stated in an interview with CoinDesk that the quotes of the first cryptocurrency could overcome the $125,000 mark by the end of next year. "On June 22, bitcoin reached a new annual high. This signal historically indicated the end of bearish and the beginning of bullish markets," he explained.
According to Thielen, the price of bitcoin can soar by 123% over 12 months and by 310% over a year and a half. With such growth, the asset will rise to $65,539 and $125,731, respectively. The expert's forecast is based on the average profitability of similar signals in the past: in August 2012, December 2015, May 2019, and August 2020. (Thielen intentionally ignores the first case with growth of 5,285% over 18 months, calling it "epic" and "disproportionate".).
As for a more short-term forecast, Michael Van De Poppe, founder of venture company Eight, believes that bitcoin is preparing for a leap to $41,000. The popular analyst bases his opinion on the recent growth of the first cryptocurrency rate and Fibonacci levels. According to him, "the previous annual high for BTC was overcome in April. And now we are seeing increasingly higher highs as traders build up bullish momentum and positions." "To continue the uptrend, which we call a bull cycle, bitcoin needs to reach a new and clearer high," explains Michael Van De Poppe. "There are several points that allow determining the possibilities of further growth using Fibonacci levels. And now I would say that there is a rally to $41,000 ahead."
"There are two scenarios: a rise above the current maximum, followed by some consolidation and a rollback before a new growth. Or consolidation at current levels, and then accelerated growth in the coming months. For bitcoin, this is pretty standard behaviour. And then we will go to $41,000 or even $42,500," the analyst predicts.
As of writing this review on the evening of Friday, July 14, BTC/USD is trading around $30,180. The total market capitalization of the crypto market has slightly increased and stands at $1.198 trillion ($1.176 trillion a week ago). The Crypto Fear & Greed Index is in the Greed zone and stands at 60 points (55 points a week ago).