

Sample Category Title
USD/CHF Daily Outlook
Daily Pivots: (S1) 0.8580; (P) 0.8606; (R1) 0.8646; More...
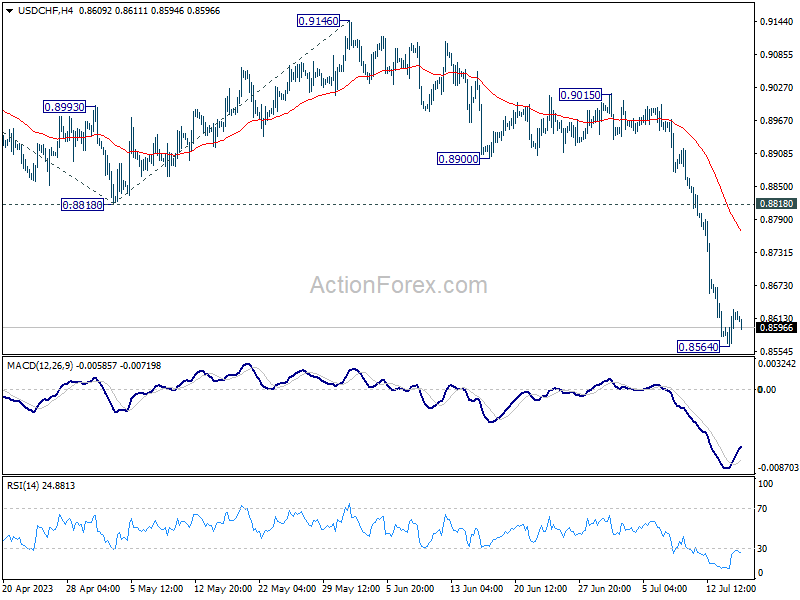
Intraday bias in USD/CHF stays neutral for consolidation above 0.8564 temporary low. Upside of recovery should be limited below 0.8818 support turned resistance to bring another fall. Break of 0.8564 will resume larger down trend and target 100% projection of 0.9439 to 0.8818 from 0.9146 at 0.8525 next.
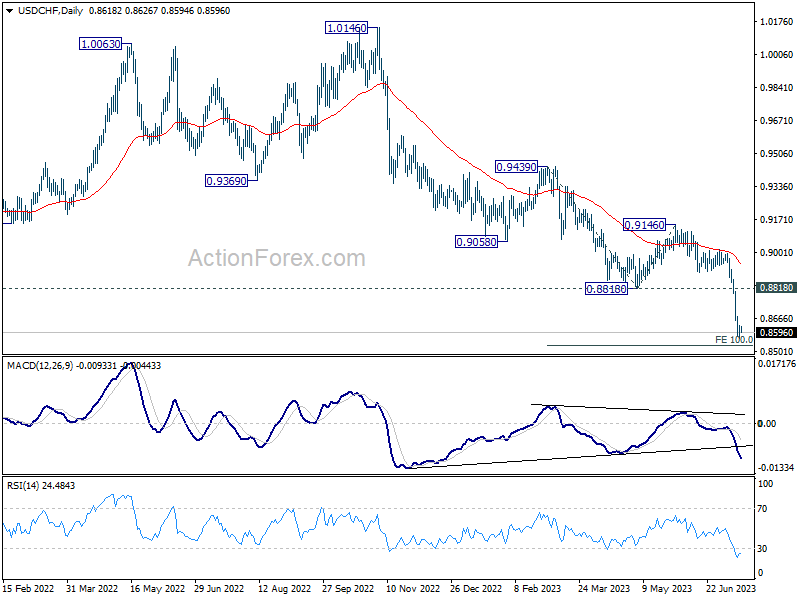
In the bigger picture, the break of 0.8756 (2021 low) indicates break out from the long term range pattern. For now, medium term outlook will stay bearish as long as 0.9146 resistance holds. Further fall would be seen to 61.8% retracement of 0.7065 (2011 low) to 1.0342 (2016 high) at 0.8317 next.
AUD/USD Daily Report
Daily Pivots: (S1) 0.6814; (P) 0.6855; (R1) 0.6878; More...
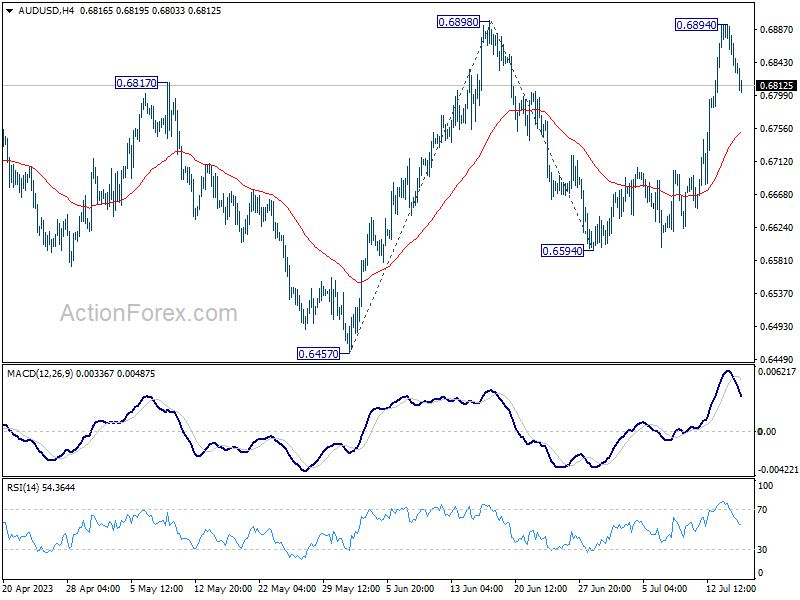
Intraday bias in AUD/USD remains neutral for the moment. On the upside, decisive break of 0.6898 resistance will firstly confirm resumption of rise from 0.6457. Secondly, that should also confirm completion of the fall from 0.7156 at 0.6457. Next target will be 100% projection of 0.6457 to 0.6898 from 0.6594 at 0.7035, and then 0.7156 resistance.
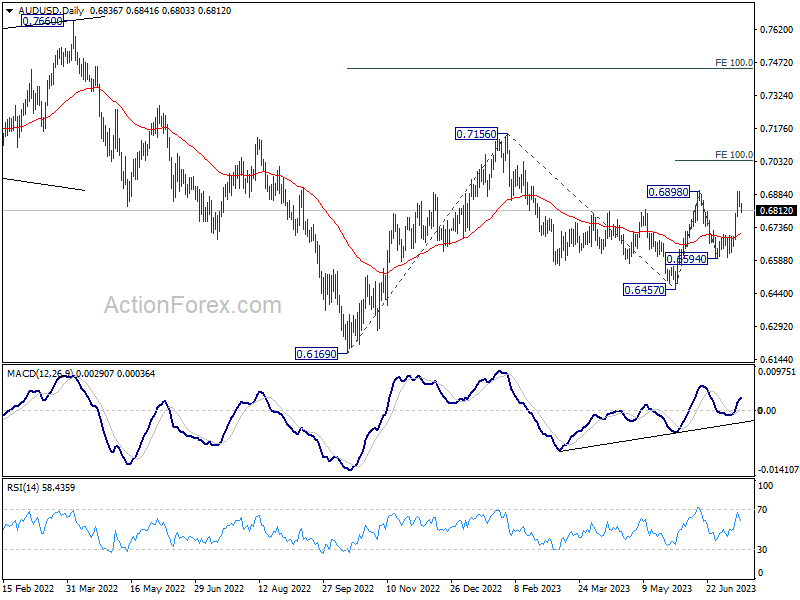
In the bigger picture, price actions from 0.7156 are seen as a correction to the rebound from 0.6169 (2022 low). Break of 0.6898 resistance will argue that rise from 0.6169 is ready to resume through 0.7156. Next target will be 100% projection of 0.6169 to 0.7156 from 0.6457 at 0.7444. For now, this will be the favored case as long as 55 D EMA (now at 0.6703) holds.
USD/CAD Daily Outlook
Daily Pivots: (S1) 1.3132; (P) 1.3179; (R1) 1.3266; More....
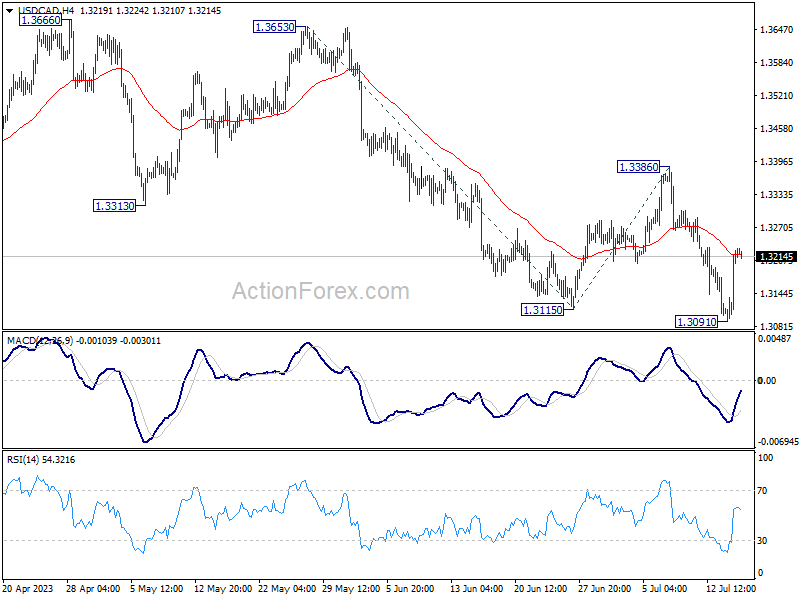
Intraday bias in USD/CAD remains neutral for consolidation above 1.3091. Outlook will remain bearish as long as 1.3386 resistance holds. Break of 1.3091 will resume larger decline to 61.8% projection of 1.3653 to 1.3115 from 1.3386 at 1.3054. However, firm break of 1.3386 will indicate near term reversal and turn outlook bullish.
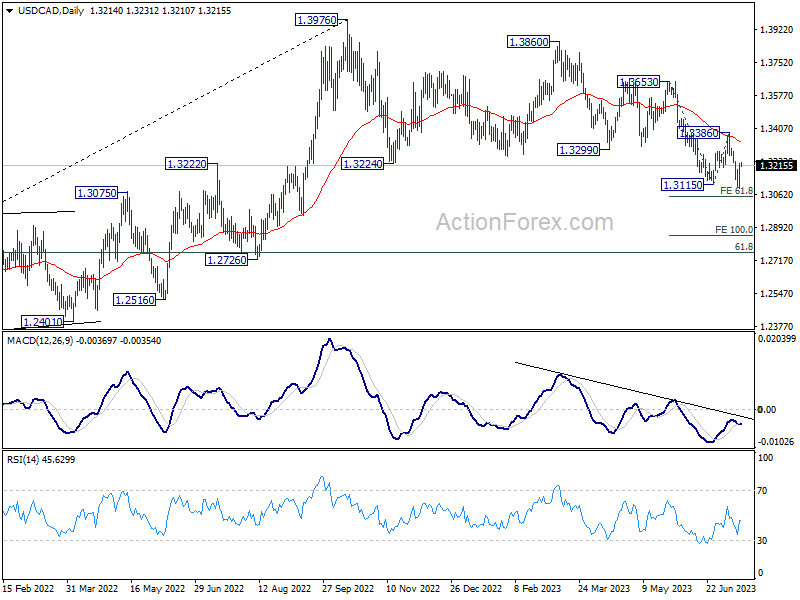
In the bigger picture, price actions from 1.3976 are viewed as a correction to up trend from 1.2005 (2021 low) only. But even so, deeper decline is expected as long as 1.3386 resistance holds. Further fall could be seen to 61.8% retracement of 1.2005 to 1.3976 at 1.2758. Meanwhile, break of 1.3386 will be a sign that the correction has completed and bring stronger rally back to retest 1.3976.
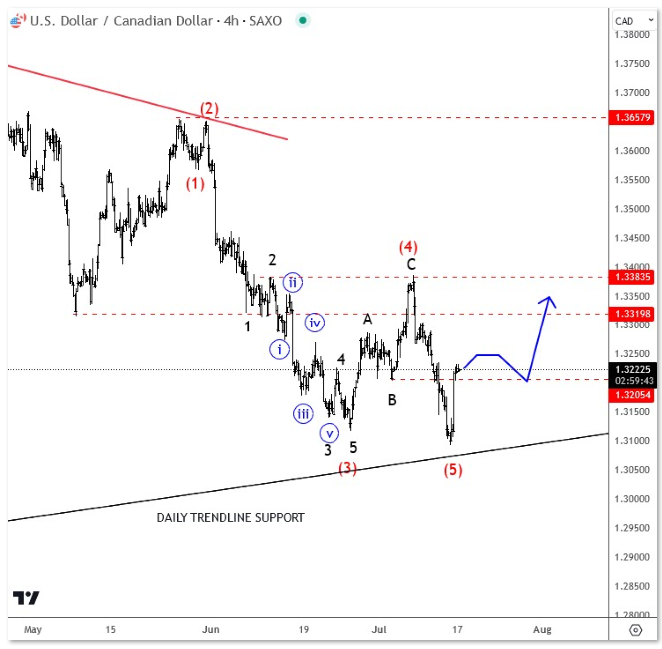
USD/CAD Completed Five Wave Bearish Cycle, Now Three Wave Rally in View
USDCAD has been bearish for the last few weeks and unfolded five waves down from 1.3657, which is an impulse and we know that every impulse will be retraced by a three-wave recovery, minimum. As such, we think this three-wave recovery can be now underway after a sharp bounce in the last few sessions, from a new low, which suggests that wave (5) is bottoming. As such, be aware of more upside in the near-term, possibly back to 1.332-1.3380 key resistance area.
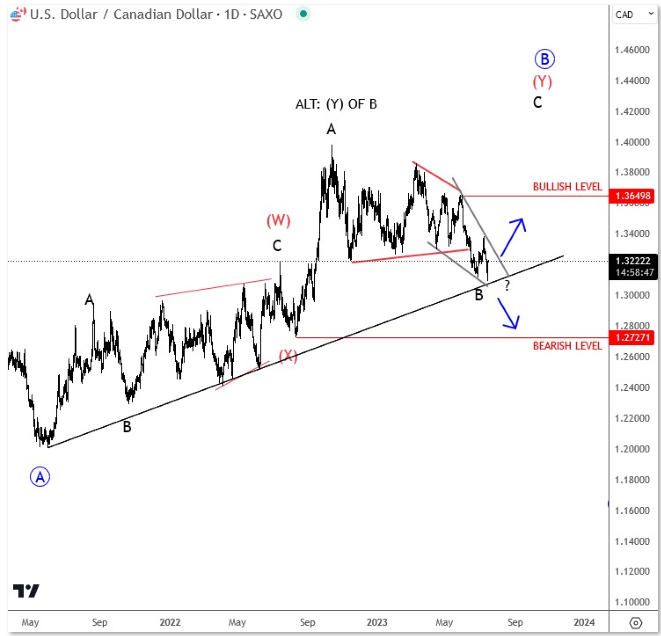
Traders should also keep an eye on that daily trendline support; we have to see this one broken before major change in trend is coming into play. IN fact, while this trendline holds a drop from 2022 highs can even be wave B.
Chinese Quarterly Growth Slowed from 2.2% to 0.8%
Markets
Strong Q1 earnings by several Wall Street giants seemed to run away with all the attention on Friday, but eventually it was the University of Michigan’s July consumer survey which dictated the market pulse. The headline number rose unexpectedly from 64.4 to 72.6 – strongest since September 2021 and vs 65.5 consensus – with details suggesting that the Fed’s job is far from done. 1yr forward inflation expectations increased from 3.3% to 3.4% (vs 3.1% expected) with long term expectations up from 3% to 3.1%. Consumers furthermore expect their pay checks to rise at least in lockstep with inflation and aren’t afraid they lose their jobs over the next year. The Michigan Survey triggered a sell-off in US Treasuries with the front end of the curve underperforming. US yields added 2.7 bps (30-yr) to 13.5 bps (2-yr) but still ended the week significantly lower following the earlier CPI-rally. Weekly changes ranged between -11.8 bps and -31.4 bps with the belly of the curve outperforming. German yields followed the US move on Friday to a lesser extent, adding up to 5.6 bps at the front end of the curve. The front end US Treasury sell-off helped stop the week-long rot in the dollar. No more than that though. The trade weighted greenback (DXY) ended virtually unchanged just below 100 and from a technical point of view below the support zone of 100.84 (previous YTD lows). EUR/USD in the same vein closed unchanged at 1.1228 with the weekly close above 1.1095 resistance. Stock markets ended the week narrowly mixed. The EuroStoxx50 again bumped into strong resistance at 4400 (YTD high tested already in May, June and earlier this month).
Asian trading volumes are low with Japan (Marine Day) and Hong Kong (typhoon) closed. Efforts to blow up this morning’s Chinese eco figures (see below) are overdone. The July Empire Manufacturing Survey and speeches by ECB members at the central bank’s 9th conference on central, eastern and south-eastern European countries are scheduled today. We don’t expect them to have a big market impact and start with a neutral bias for FI and FX. The agenda remains light the following days with ECB members joining the Fed’s blackout period and mostly second tier US/EMU eco data. US retail sales are exception to the rule tomorrow. Key things to watch are UK inflation numbers on Wednesday (cementing back-to-back 50 bps rate hikes by the BoE) and Japanese price figures on Friday (rising speculation of changes to the YCC policy). Q2 corporate earnings are the wildcard via risk sentiment.
News and views
Chinese quarterly growth slowed from 2.2% to 0.8% in the previous quarter this year, matching expectations. The economy is now 6.3% bigger compared to the same period last year (7.1% expected). Accompanying monthly activity data for June showed industrial production picking up from May: at 3.8% YtD y/y it also topped a 3.5% estimate, suggesting the sector is stabilizing after a long slide. Investments rose 3.8%. Retail sales this year through June slowed to 8.2% while the property sector remains in dire straits, slumping 7.9% y/y in the period January-June. It’s this combination of slowing consumer spending and the ongoing real estate tremors that dominate this morning’s market reaction. China’s yuan holds on to losses against the USD, incurred even before the GDP data release. USD/CNY trades around 7.168. Chinese stock exchanges underperform regional peers. The Politburo’s meeting later this month will probably get more attention than usual as markets increasingly anticipate fiscal and monetary support in one way or another.
Turkey has significantly raised taxes on petrol, diesel and a series of other petroleum products. In some cases the levies tripled. The move comes as the country tries to fill an estimated 4.4% gap in public finances, created by amongst other’s president Erdogan’s pre-election pledge of one month of free natural gas and reconstruction works after February’s earthquake. It’s also part of the new finance minister Simsek’s plan to cool domestic demand, which is said to be still too high after years of loose fiscal and monetary policy. That has fanned inflation. Even though price pressures have come down from a peak of 85.5% in October last year, (official) inflation was still a whopping 38.2% in June. It may well pick up again due to the steep decline in the Turkish lira over the past months. USD/TRY is trading at a record low around 26. This compares to 18.7 at the start of the year.
EUR/CHF Daily Outlook
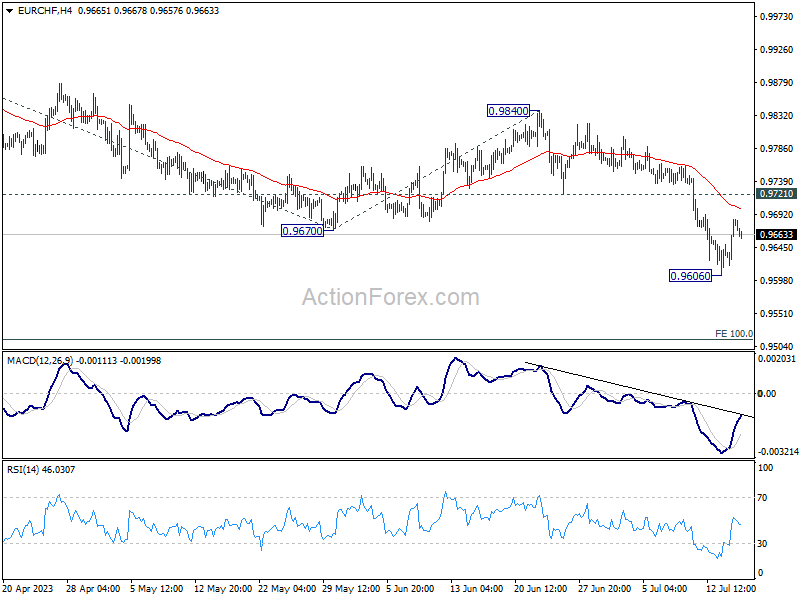
Daily Pivots: (S1) 0.9614; (P) 0.9636; (R1) 0.9663; More...
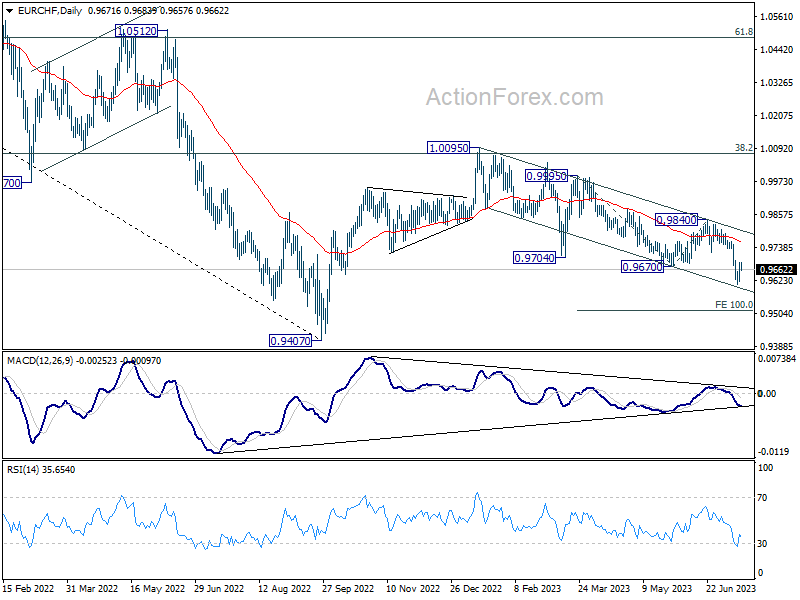
Intraday bias in EUR/CHF stays neutral first and outlook remains bearish with 0.9721 support turned resistance intact. On the downside, break of 0.9606 will resume larger decline from 1.0095 to 100% projection of 0.9995 to 0.9670 from 0.9840 at 0.9515.
In the bigger picture, medium term outlook is staying bearish as the pair is capped below falling 55 W EMA (now at 0.9913). Down trend form 1.2004 (2018 high) is in favor to extend through 0.9407 at a later stage. Nevertheless, decisive break of 38.2% retracement of 1.1149 to 0.9407 will raise the chance of bullish trend reversal.
GBP/JPY Daily Outlook
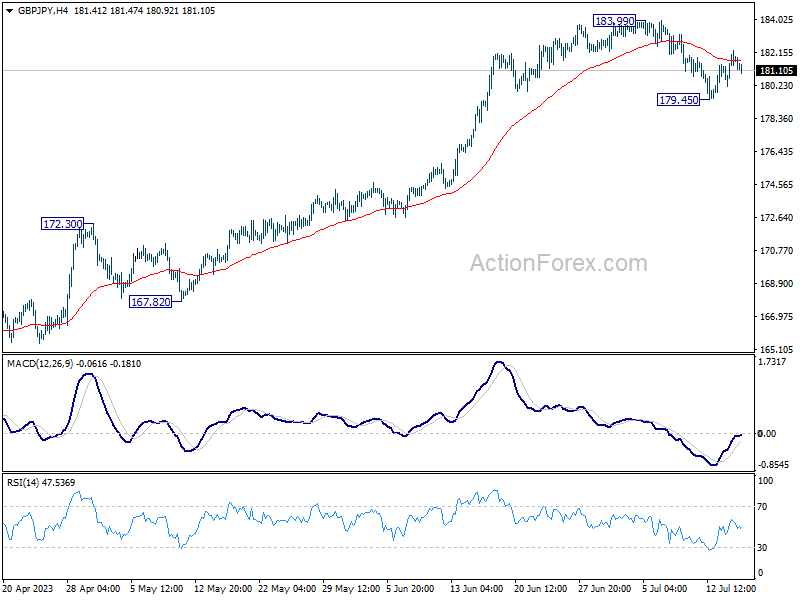
Daily Pivots: (S1) 180.53; (P) 181.41; (R1) 182.62; More...
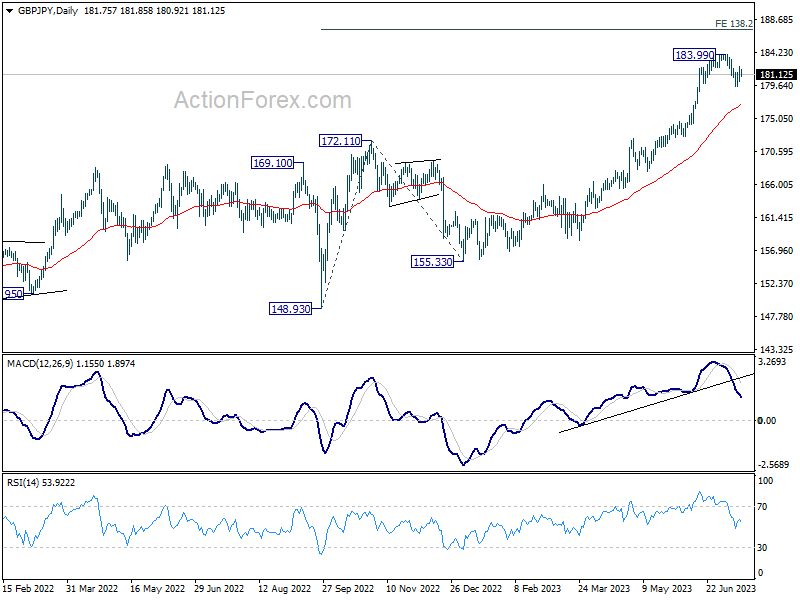
Intraday bias in GBP/JPY stays mildly on the upside for retesting 183.99 high first. Firm break there will resume larger up trend to 187.36 projection level. On the downside, however, break of 179.45 will extend the pull back to 55 D EMA (now at 177.01).
In the bigger picture, as long as 172.11 resistance turned support holds, up trend from 123.94 (2020 low) is expected to continue. On resumption, next target is 138.2% projection of 148.93 to 172.11 from 155.33 at 187.36, and then 195.86 (2015 high). Nevertheless, firm break of 172.11 will argue that larger correction is already underway.
EUR/JPY Daily Outlook
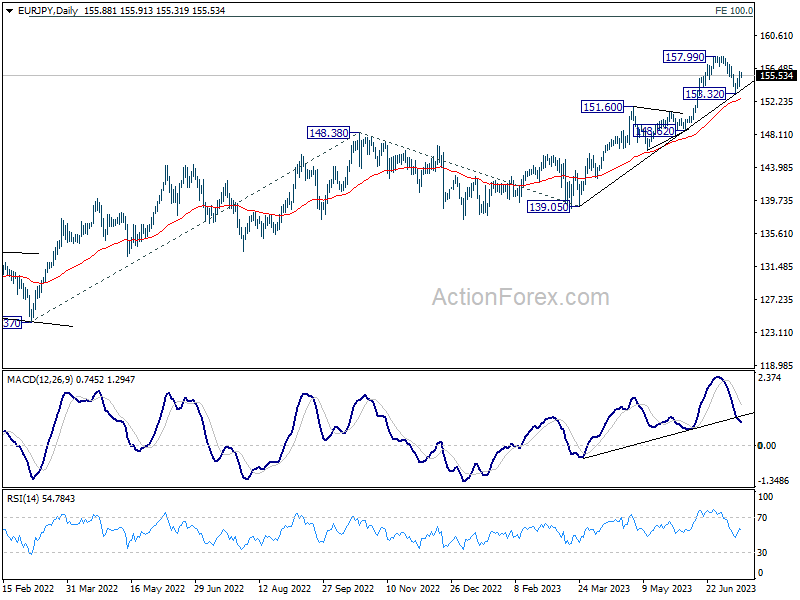
Daily Pivots: (S1) 154.61; (P) 155.38; (R1) 156.58; More....
Intraday bias in EUR/JPY remains mildly on the upside for retesting 157.99 high. Firm break there will resume larger up trend. On the downside, break of 153.32 will extend the pull back from 157.99 to 55 D EMA (now at 152.62) and possibly below.
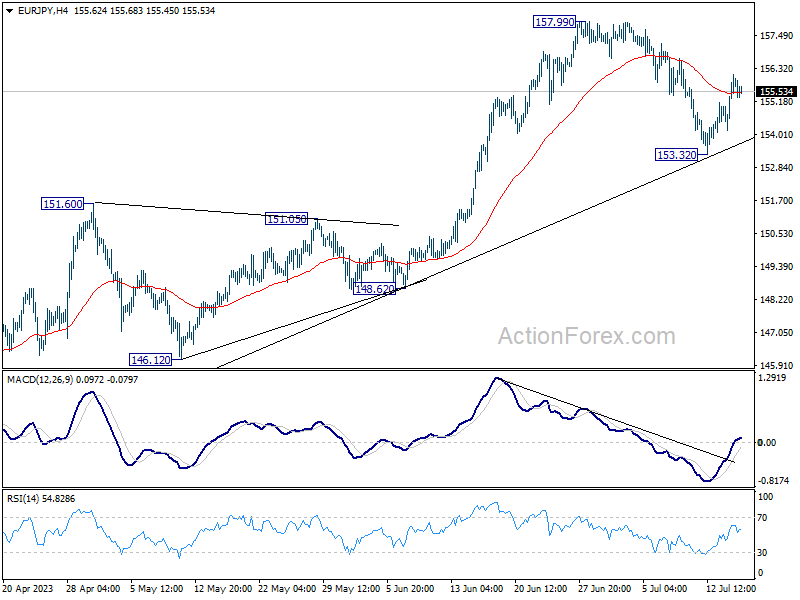
In the bigger picture, as long as 151.60 resistance turned support holds, rise from 114.42 (2020 low) is in progress. On resumption, next target is 100% projection of 124.37 to 148.38 from 138.81 at 162.82. Nevertheless, sustained break of 151.60 will argue that larger correction is already underway.
EUR/GBP Daily Outlook
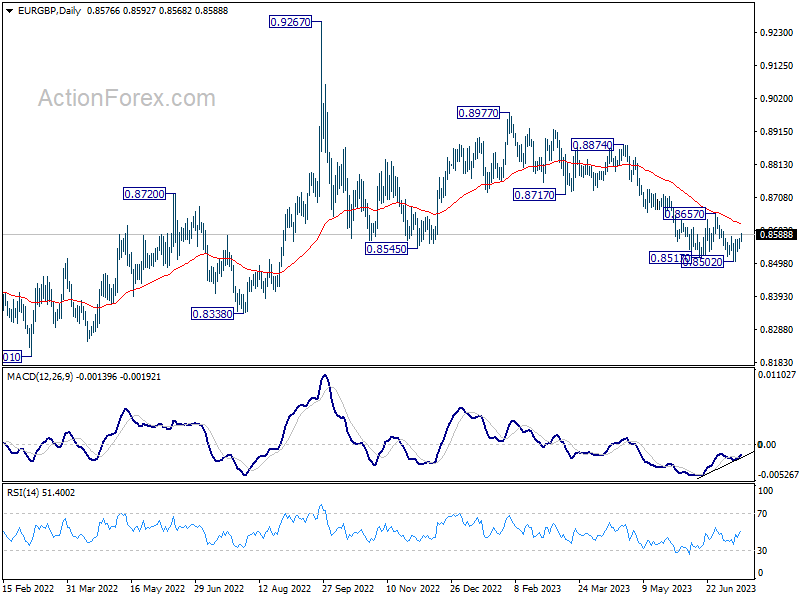
Daily Pivots: (S1) 0.8553; (P) 0.8566; (R1) 0.8587; More...
EUR/GBP's rebound from 0.8502 extends higher today and break of 0.8583 resistance indicates short term bottoming. Intraday bias is back on the upside for 0.8657 resistance next. Considering bullish convergence condition in 4H and D MACD, firm break of 0.8657 will be a sign of bullish trend reversal. On the downside, break of 0.8502 will resume the whole decline from 0.8977 instead.
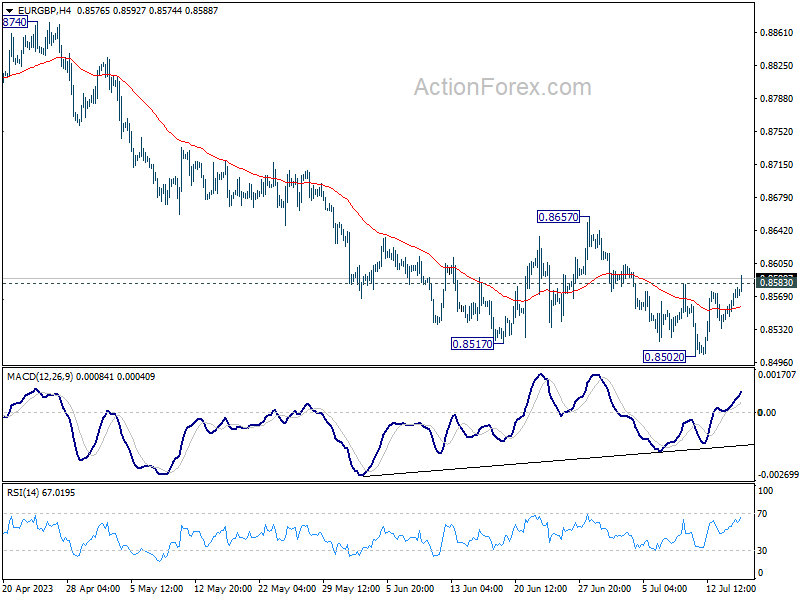
In the bigger picture, the down trend from 0.9267 (2022 high) is still in progress. It's seen as part of the long term range pattern from 0.9499 (2020 high). Deeper fall could be seen towards 0.8201 (2022 low). But strong support should be seen from there to bring reversal. This will now remain the favored case as long as 0.8657 resistance holds.
Which One is a Real Safe Haven Now?
Gold prices dipped as investors took profits following a near one-month high, but still recorded their biggest weekly gain since April on expectations of a pause in U.S. interest rate hikes. Spot gold was down 0.3% at $1,954.69 per ounce, while U.S. gold futures eased 0.2% to $1,959.30. The dollar index edged up 0.2% but remained close to its lowest level since April 2022. Analysts suggest that gold has room to expand further, with potential key levels at $1,985 to $2,000. While the outlook for gold remains positive, there may be some profit-taking at current levels. Federal Reserve Governor Christopher Waller expressed a preference for more rate hikes this year, but markets have mostly priced in one rate hike at the Fed's upcoming meeting. Higher interest rates increase the opportunity cost of holding gold. In terms of technical levels, support is seen at around $1,940, while resistance is expected in the $1,970-75 region. Stay tuned for further market developments!
US Dollar - W1 Timeframe
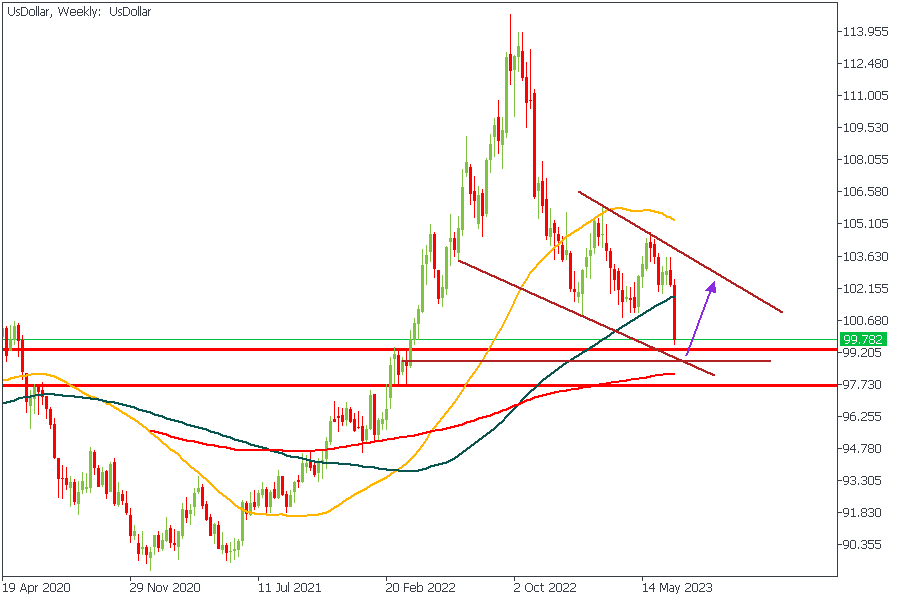
The reason we are looking at the chart for the US Dollar is that the two major commodities we will consider as alternative stores of value are both correlated to the US Dollar. Bitcoin and Gold are two commodities that reflect the sentiments of two separate generations as pertains to investing and wealth management. From the charts, we see the likelihood of bullish price action from the demand zone owing to the fact that the zone is also supported by a trendline.
Analyst’s Expectations:
- Direction: Bullish
- Target: 104.510
- Invalidation: 97.597
BTCUSD - W1 Timeframe
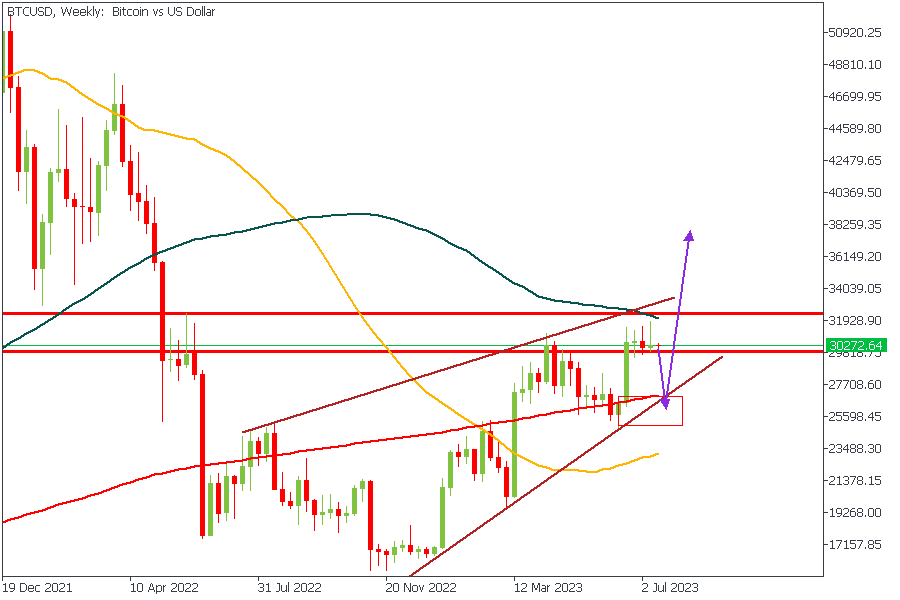
BTCUSD on the weekly timeframe is at a key decision zone. As I said earlier, Bitcoin and other cryptocurrencies represent the investment sentiments of the majority of young, tech-savvy investors who may not necessarily be inclined to invest in Bitcoin as an immediate store of value, but rather as a means of exchange. However, there are a few commercial investors that are very big on cryptocurrencies at the moment, which may spell greater adoption and stronger prices for the chief of cryptos.
Analyst’s Expectations:
- Direction: Bearish
- Target: 28341.74
- Invalidation: 32500.69
XAUUSD - D1 Timeframe
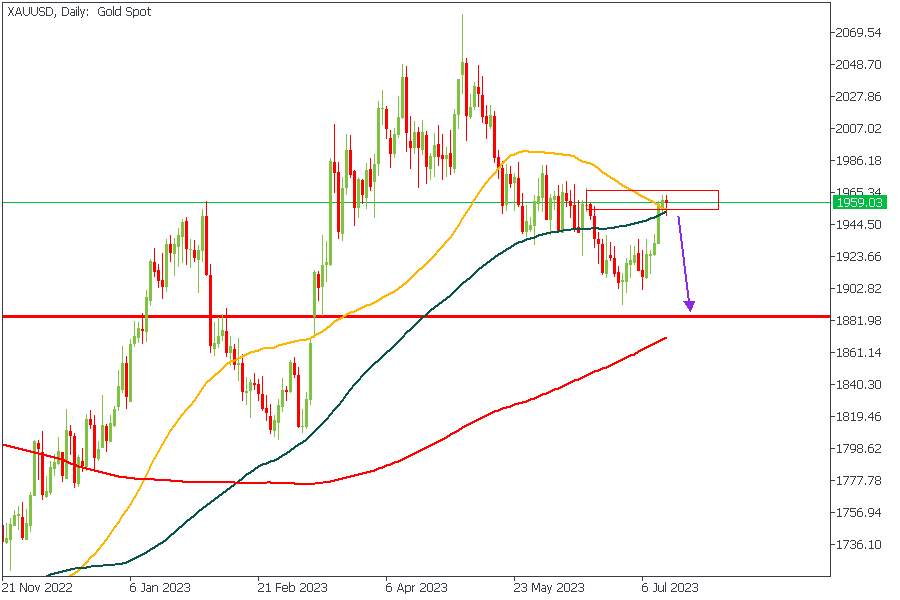
Gold on the daily timeframe presents us with a price action that is quite indicative of bearish intent. We can clearly see the supply zone and the fact that it intertwines perfectly with the 50 and 100 moving averages as likely areas of resistance. Comparing the price action on the US Dollar with this, I can conclude that bullish strength on the Dollar is certainly going to hasten the bearish price action on XAUUSD (Gold).
Analyst’s Expectations:
- Direction: Bearish
- Target: 1886.78
- Invalidation: 1975.20
CONCLUSION
The trading of CFDs comes at a risk. Thus, to succeed, you have to manage risks properly. To avoid costly mistakes while you look to trade these opportunities, be sure to do your due diligence and manage your risk appropriately.