Sample Category Title
GBPJPY Correction Underway But Will It Last?
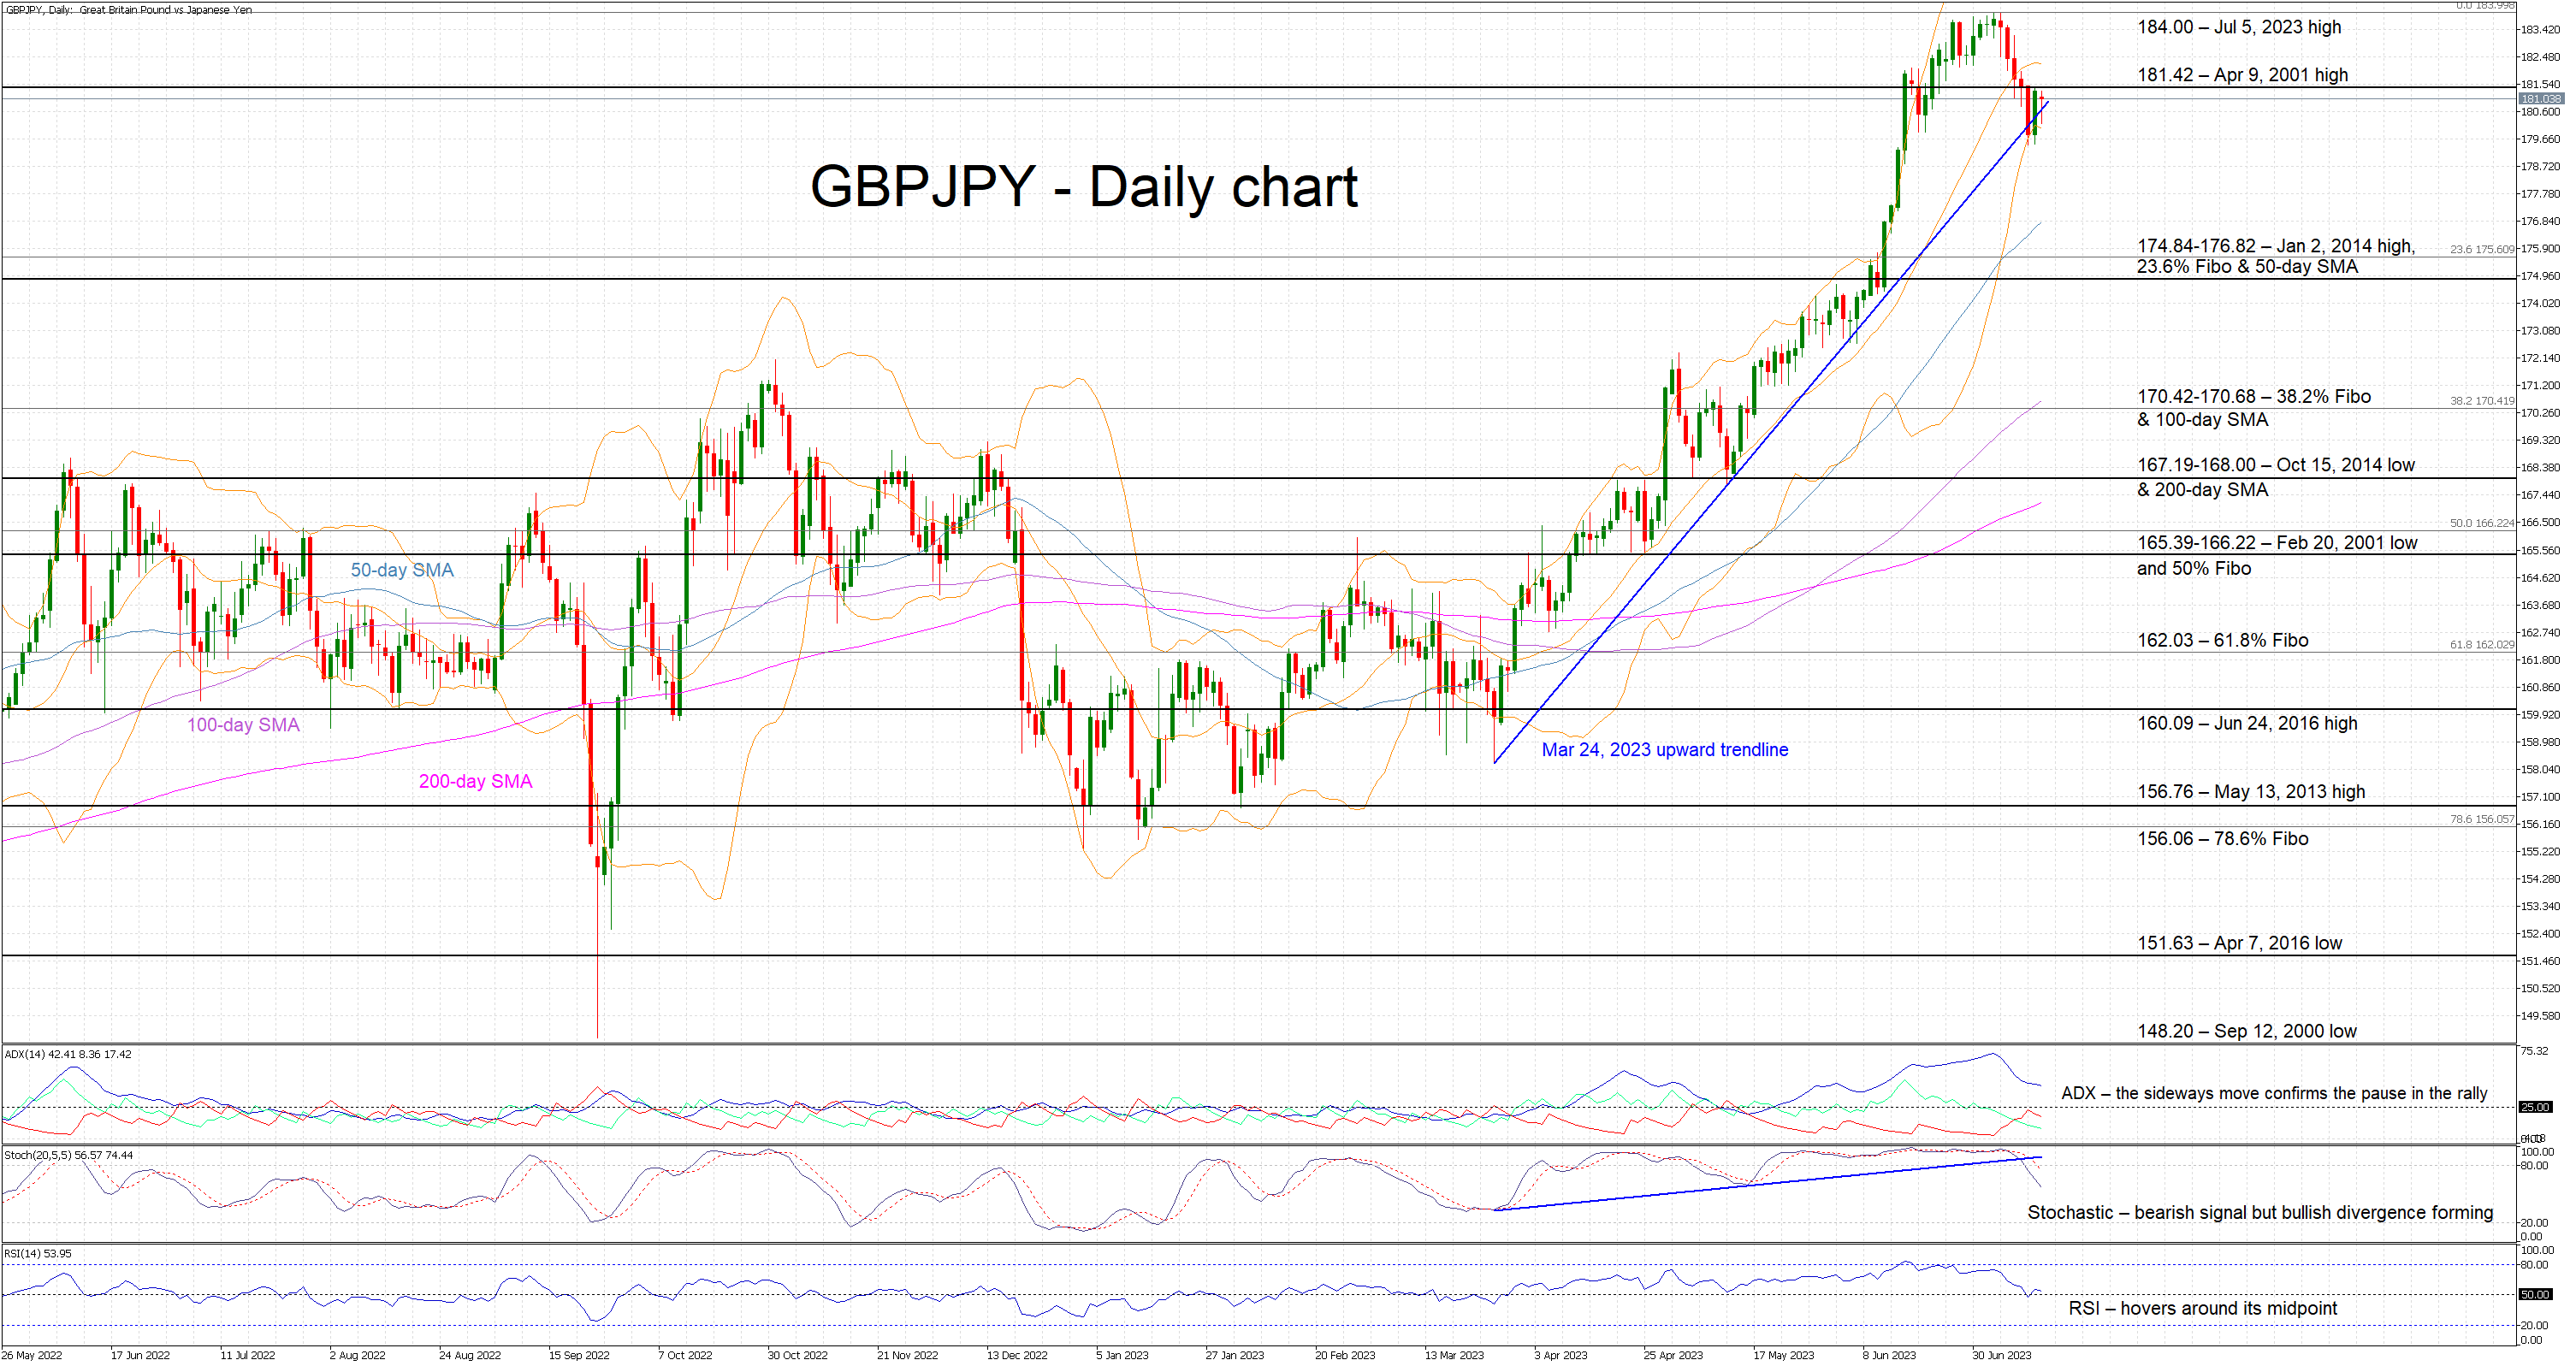
GBPJPY is trading sideways today as the first correction since the March 2023 lows is underway. The current drop has halted at the important March 23, 2023 upward sloping trendline with the pair now hovering a tad below the April 9, 2001 high of 181.42.
The overall technical picture is more mixed at this juncture as most indicators seem to have reset after significant advances. The Average Directional Movement Index (ADX) is moving sideways, following an aggressive drop from its recent highs, and thus confirming the current GBPJPY correction. Similarly, the RSI is again trading around its 50-midpoint.
More importantly, the stochastic oscillator is dropping lower in a vertical fashion, after spending two months in its overbought area. While this move confirms the bearish pressure in the market, it also points to a developing bullish divergence as the lower low in this indicator has been met by higher low in GBPJPY.
Should the bulls decide that the recent correction has run its course, they would first try to clear the 181.42 level. They would then have the chance to record another 2023 high, above the July 5, 2023 high of 184.00, and to push GBPJPY towards the 190 area, which is key from a long-term perspective.
On the other hand, the bears are probably feeling a bit optimistic on the back of the current correction. They are clearly keen for another pullback towards the busier 174.84-176.82 range that is populated by the January 2, 2014 high, the 23.6% Fibonacci retracement of the July 20, 2021 – July 5, 2023 uptrend and the 50-day simple moving average (SMA) respectively. Breaking this area could be extremely important from a short-term sentiment perspective and it will open the door for a move towards the 170.42-170.68 region.
To sum up, GBPJPY bears might finally have a reason to smile but the mixed messages from the momentum indicators could mean that the recent upleg might have not ended.
USD/CAD Daily Outlook
Daily Pivots: (S1) 1.3078; (P) 1.3136; (R1) 1.3169; More....
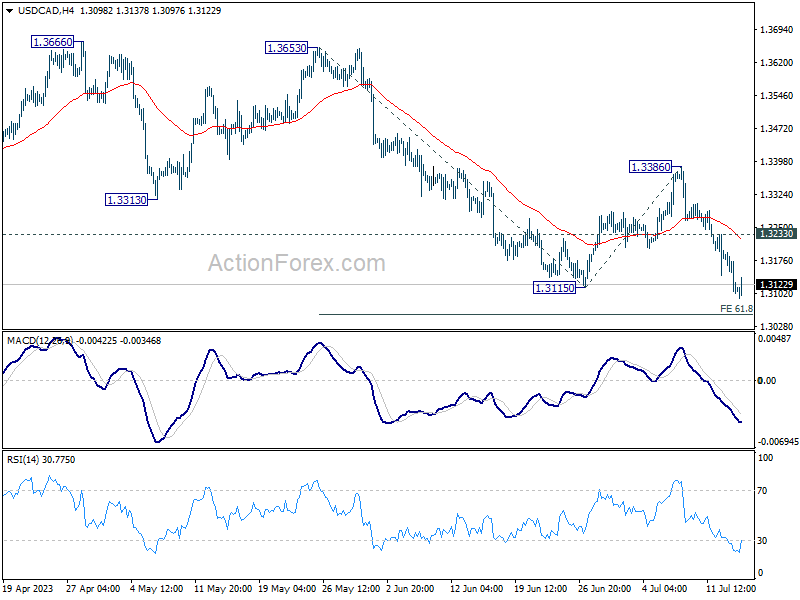
USD/CAD's fall is still in progress and intraday bias stays on the downside. Break of 1.3115 indicates resumption of larger down trend. Next targets are 61.8% projection of 1.3653 to 1.3115 from 1.3386 at 1.3054, and then 100% projection at 1.2848. On the upside, above 1.3233 minor resistance will turn intraday bias neutral first. But outlook will remain bearish as long as 1.3386 resistance holds, in case of recovery.
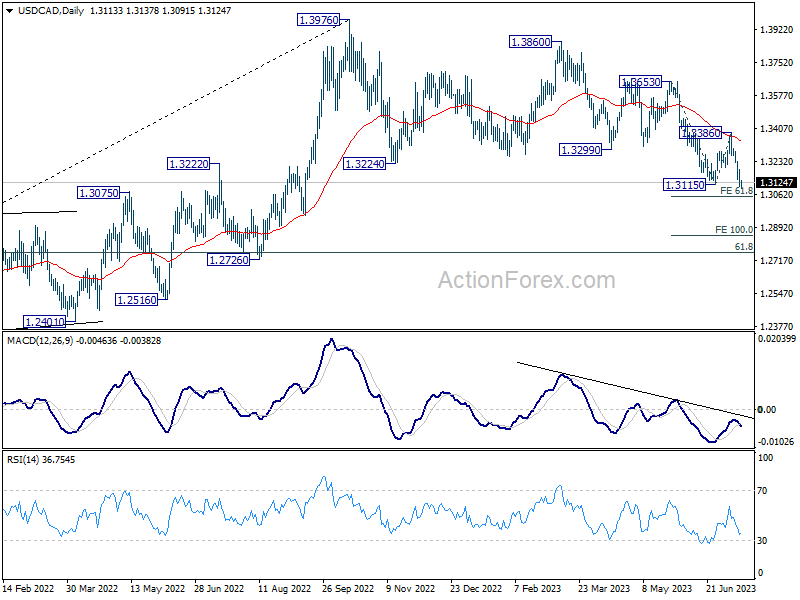
In the bigger picture, price actions from 1.3976 are viewed as a correction to up trend from 1.2005 (2021 low) only. Hence, the up trend is in favor to resume through 1.3976 at a later stage. Nevertheless, another fall below 1.3115 will extending the decline from 1.3976 to 61.8% retracement of 1.2005 to 1.3976 at 1.2758, and raise the chance of bearish trend reversal.
AUD/USD Daily Report
Daily Pivots: (S1) 0.6817; (P) 0.6856; (R1) 0.6928; More...
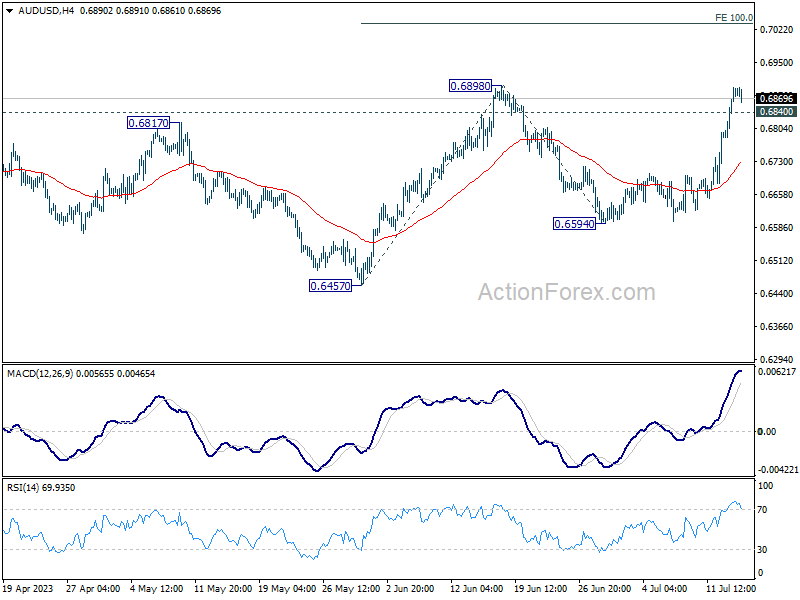
Intraday bias in AUD/USD remains on the upside with focus on 0.6898 resistance. Decisive break there will will firstly confirm resumption of rise from 0.6457. Secondly, that should also confirm completion of the fall from 0.7156 at 0.6457. Next target will be 100% projection of 0.6457 to 0.6898 from 0.6594 at 0.7035, and then 0.7156 resistance. On the downside, however, below 0.6840 minor support will turn intraday bias neutral first.
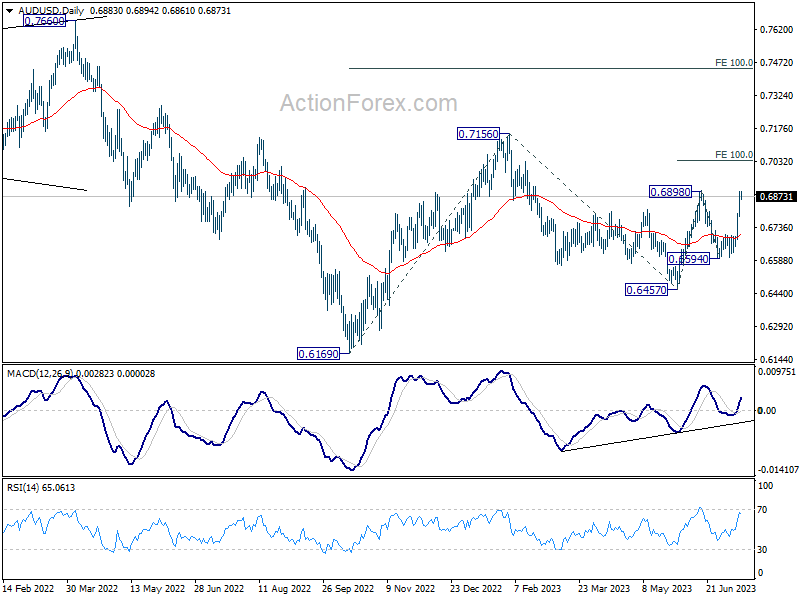
In the bigger picture, price actions from 0.7156 are seen as a correction to the rebound from 0.6169 (2022 low). Break of 0.6898 resistance will argue that rise from 0.6169 is ready to resume through 0.7156. Next target will be 100% projection of 0.6169 to 0.7156 from 0.6457 at 0.7444. For now, this will be the favored case as long as 55 D EMA (now at 0.6697) holds.
USD/JPY Daily Outlook
Daily Pivots: (S1) 139.86; (P) 140.66; (R1) 141.16; More...
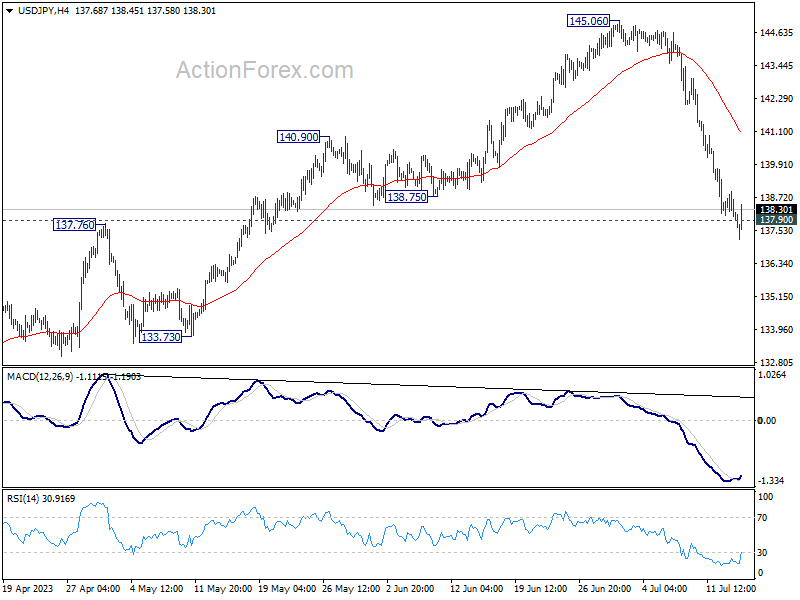
Intraday bias in is turned neutral for the moment, as USD/JPY lost momentum after briefly breaching 137.90 resistance turned support. Some consolidations could be seen, but recovery should be limited by 55 4H EMA (now at 141.03) and bring another decline. Sustained break of 137.90 will confirm the larger bearish case, and target 127.20 and below.
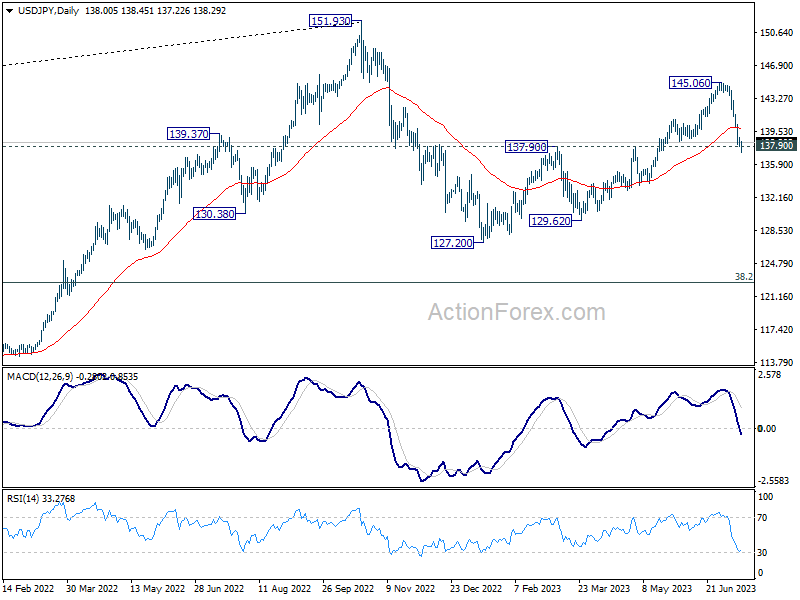
In the bigger picture, current downside acceleration, as seen in daily MACD, argues that fall from 145.06 is already the third leg of the corrective pattern from 151.93 (2022 high). Sustained break of 137.90 resistance turned support should confirm this case and target 127.20 (2023 low) and below. For now, this will remain the favored case as long as 145.06 resistance holds.
USD/CHF Daily Outlook
Daily Pivots: (S1) 0.8555; (P) 0.8616; (R1) 0.8650; More...
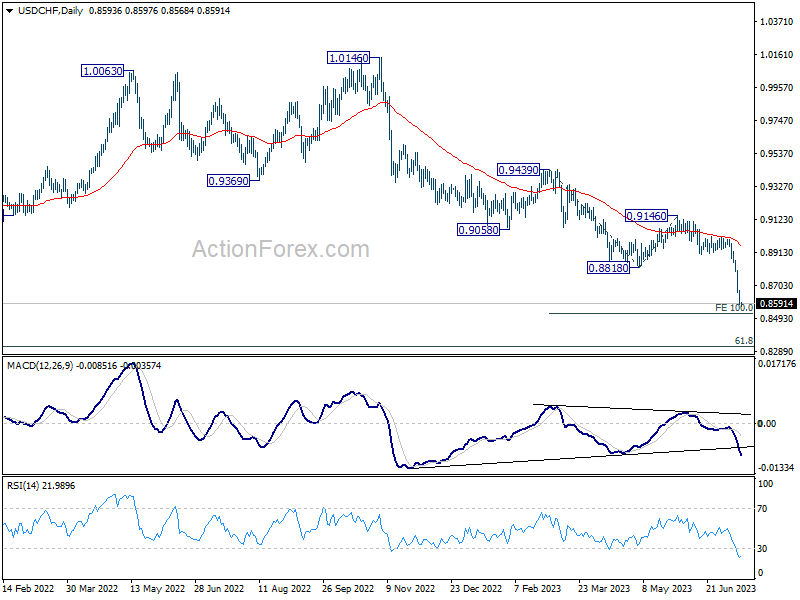
Intraday bias in USD/CHF remains on the downside for the moment. Current down trend should target 100% projection of 0.9439 to 0.8818 from 0.9146 at 0.8525 next. On the upside, above 0.8683 minor resistance will turn intraday bias neutral and bring consolidations first. But outlook will remain bearish as long as 0.8900 support turned resistance holds.
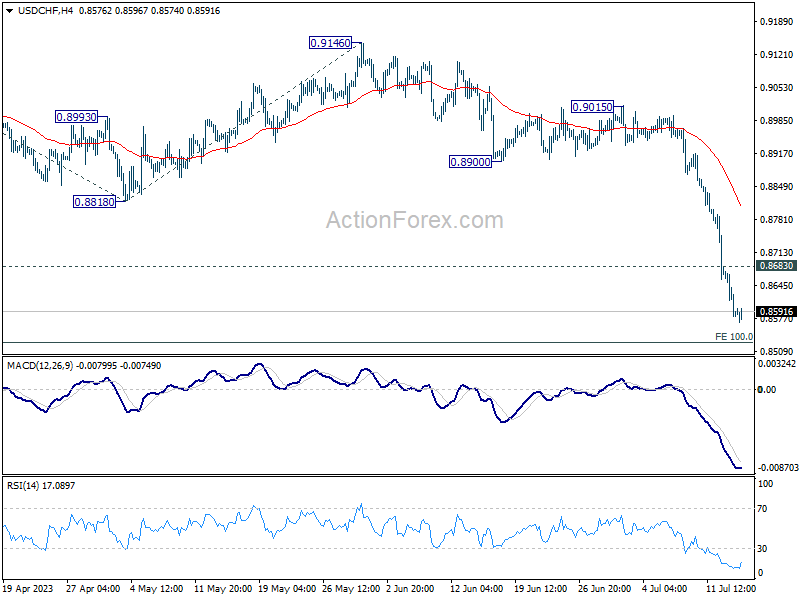
In the bigger picture, the break of 0.8756 (2021 low) indicates break out from the long term range pattern. For now, medium term outlook will stay bearish as long as 0.9146 resistance holds. Further fall would be seen to 61.8% retracement of 0.7065 (2011 low) to 1.0342 (2016 high) at 0.8317 next.
EUR/USD Daily Outlook
Daily Pivots: (S1) 1.1161; (P) 1.1194; (R1) 1.1260; More...
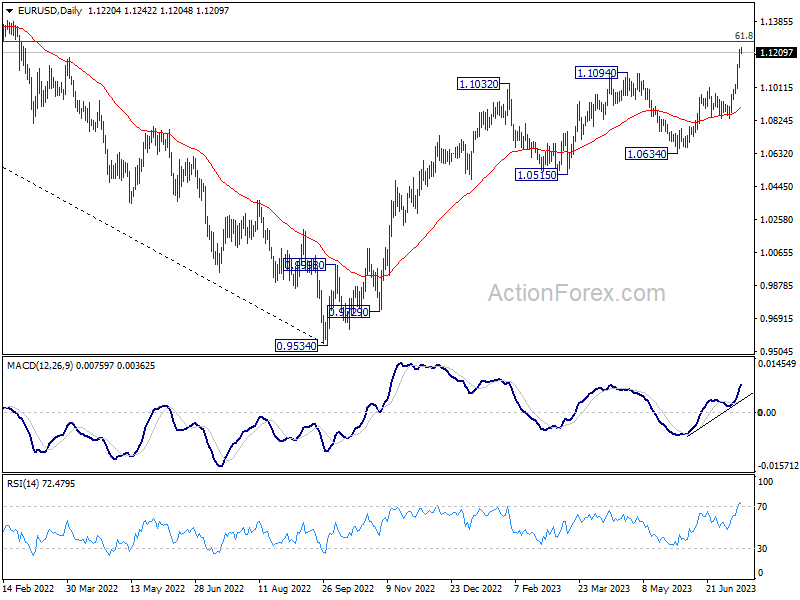
Intraday bias in EUR/USD remains on the upside and outlook is unchanged. Current up trend should target 1.1273 fibonacci level next. On the downside, below 1.1127 minor support will turn intraday bias neutral and bring consolidations first, before staging another rise.
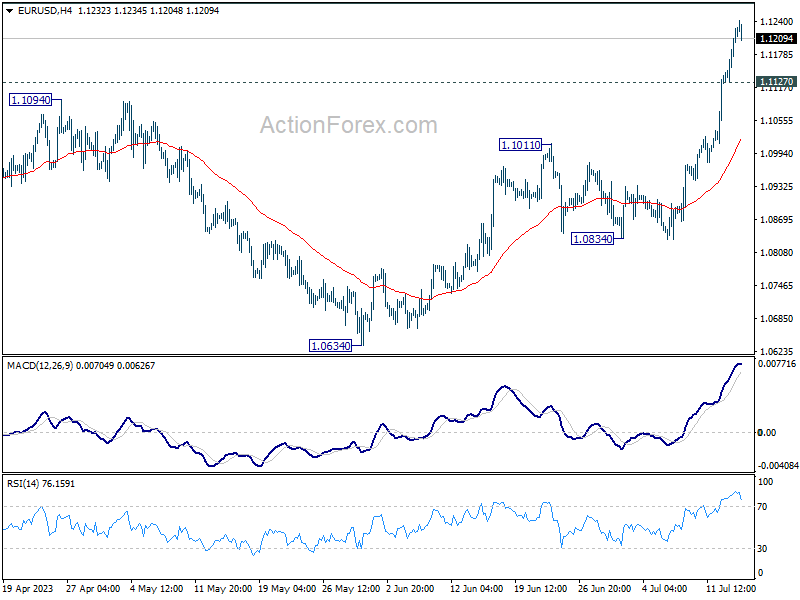
In the bigger picture, as long as 1.0515 support holds, rise from 0.9534 (2022 low) would still extend higher. Sustained break of 61.8% retracement of 1.2348 (2021 high) to 0.9534 at 1.1273 will solidify the case of bullish trend reversal and target 1.2348 resistance next (2021 high).
Dollar Still Struggles to Avoid Additional Losses
Markets
The post-payrolls/CPI bond market rally continued yesterday and reinforced existing trends in most other markets. The minutes of the June ECB meeting showed a strong commitment to continue the campaign to eradicate inflation. A 25 bps July rate hike is a certainty with probably more follow-up action to come as the MPC stays attentive to persistent high core inflation. Bunds added substantial gains early in the session, but then shifted to consolidation modus. In the end, German yields lost between 9.3 bps (10-y) and 6.2 bps (30-y). After the recent setback (in yields) maybe it’s time for some technical levels to come in play. For the 2-y German yield, the 3.03% end July low is a first reference. Further out on the curve, there’s little reason for the 10-y Bund yield to sustainably trade below the 2.5% barrier (close yesterday at 2.485%). US data were mixed with final demand PPI dropping more than expected to 0.1% Y/Y. US jobless claims declined to 237k, indicating that the early June uptick shouldn’t be considered as a pointer of a genuine easing of labour market conditions. The bond rally briefly slowed after the claims release, but US yields still lost between 12.6 bps (5-y) and 4.6 bps (30-y ) in a daily perspective. The 2-y yield (4.64%) now fully retraced the acceleration that started end June. The 10-y yield (3.77%) is somewhat above the 3.7% ST support area that put a floor end June. Overnight, Fed Waller indicated that he still expects the Fed to raise rates twice this year even as a September rate hike will depend on the two inflation reports that will be available by then. Fed Daly took a more neutral stance, but also said that it’s too early to declare victory on inflation. The bond rally further propelled risk assets. The EuroStoxx 50 added 0.72%. Intraday, it tested again the 4400 level. US indices gained between 0.14% (Dow) and 1.58% (Nasdaq). Even cyclical commodities like copper and oil extended recent gains. The dollar was the main victim of investor anticipation on the (potential) end of the Fed hiking cycle. DXY (close 99.77) further dropped below the key 100.86 key neckline unravelling the technical picture. EUR/USD (close 1.1226) vigorously extended its leap beyond the previous YTD top of 1.1095. The yen declined further against the dollar (close USD/JPY 138.5), but lost against the euro (close 154,99). Sterling gained mildly but at 0.8546, EUR/GBP stayed away from the 0.85 big figure/support area.
Asian equities this morning show limited gains as the risk rally slows. US yields don’t decline any further. The dollar still struggles to avoid additional losses (DXY 99.73, EUR/USD 1.122). The eco calendar is thin today. In the US, Consumer Confidence of the University of Michigan deserves some attention, both for the headline figure (expected at 65.5 from 64.4) as well as for the inflation expectations series. On bond markets we see room for some end of week consolidation/profit talking. The technical picture suggests an ongoing uphill battle for the dollar.
News and views
Hungary is thinking of issuing short-term euro- and USD-denominated debt, with a maturity less than one year, the AKK debt agency announced on its website. Short-dated dollar bond buybacks at the beginning of the year has reduced the annual amount of foreign currency bond maturities to a record low level in the following years. It has set up a Euro Commercial Paper plan under which it is able to issue as much as €1bn. The new programme allows for cost-efficient liquidity management and diversifies the investor base, AKK said.
Exit RBA governor Philip Lowe, enter Michele Bullock. Australia’s treasurer Palmers announced Bullock as the new head of the Reserve Bank of Australia. She’s the first woman to take over the helm on September 18 this year. Bullock is seen as the continuity candidate. Although the current deputy governor has a slightly more dovish signature compared to Lowe, there are no major implications expected for monetary policy going forward. Under Lowe, the RBA tightened policy rates by 400 bps to 4.1% since May 2022 to fight inflation. This aggressive campaign drew criticism as it followed a sharp U-turn on previous guidance that rates wouldn’t rise before 2024. The Aussie dollar shrugged at the decision to replace Lowe by Bullock. AUD/USD trades unchanged around 0.688. In other central bank position switch news, the Fed’s most outspoken hawk James Bullard (St. Louis) is resigning to pursue an academic career. Bullard was the first to call for an aggressive tightening campaign, recognizing the inflation threat. His views often turned reality, making him an influential voice. This year, however, he doesn’t vote on policy.
Soft Inflation, Strong Earnings Fuel Stock Rally
We are having a great week in terms of US inflation news. After Wednesday’s data showed that the US headline inflation slowed to 3%, and core inflation fell to 4.8% - both lower than what analysts had penciled in, yesterday’s producer price inflation data also came in lower than expected. The monthly PPI eased to 0.1%, perhaps the last positive figure we see before sinking into negative territory in the coming months, and core PPI fell to 2.6%. One more good news, some underlying details in the PPI report, including health care and hotel accommodations, are used to compute the Fed’s favourite PCE Price Index that will be released in the coming weeks – which could also benefit from softening inflation trend.
As a result, the US 2-year yield fell another 15bp yesterday and hit 4.60%, while the 10-year yield retreated below 3.80%. The US dollar index slipped below the 100 mark. This is the first time the US dollar index has traded below this level since April 2022, as the Federal Reserve (Fed) is not seen getting more aggressive than this when inflation is slowing. Plus, one of the most aggressively hawkish Fed members, James Bullard, resigned yesterday. The probability of another 25bp hike at the Fed’s July meeting didn’t change much. It’s still given more than 90% probability. But the chances of another rate hike following the June hike are getting blurrier, so equity markets cheer the softening Fed expectations. The S&P500 extended gains yesterday and closed the session above the 4500 mark for the first time since April 2022, while Nasdaq 100 rallied another 1.73%. Amazon jumped to a 10-month high yesterday after reporting record sales during its Prime Day. Happily, this week’s inflation numbers were sufficiently soothing, so that the record Prime Day sales didn’t boost inflation expectations. MAMAA stocks were up by 1.72%. Crude oil on the other hand rallied past the 200-DMA, near $77pb, and consolidates at around that level this morning. Supply shortages in Libya and Nigeria are pushing price higher but the IEA says that global oil demand won’t rise as much as they previously forecasted due to the weakened economies of developed nations. It will increase by around 2.2mbpd, +2%. This is 200’000 barrels less than previously forecasted. It could help bring the bears back to the market at around the 200-DMA. The $77/80 barrel resistance will be difficult to drill because the market is now approaching overbought conditions and a key technical level is generally a good moment to sell, and because otherwise it would be bad news for inflation expectations, and the Fed.
One good news is that, although the resilience of the US jobs market remains a major concern for the Fed, the stock market rally could be a much smaller concern because the Fed recently launched a financial conditions index, an index that takes into account bond yields, mortgage rates, the stock market, Zillow's house price index and the dollar's value on global currency markets to determine how the market conditions would impact growth. And the index showed that the financial conditions in the US became increasingly less favourable this year and hit an all-time peak in December when they were more of a drag on growth than at any time in recent decades, apart from the 2008 financial crisis. And at the current levels, the market conditions remain historically unfavourable to growth – and that despite the stock market rally.
Slow growth is bad for stock valuations, but investors remain focused on earnings, rather than the overall financial conditions, and we have good news on the earnings front so far. Delta Airlines for example jumped to the highest level since April 2021 yesterday after reporting after announcing record revenue and profit in Q2 and saying that they are ‘looking at a very, very strong Q3’, as indicated by their guidance, and that they could have a strong Q4 as well. While PepsiCo rallied almost 2.40% after revealing a strong quarter thanks to higher prices they could ask from customers, and after raising its sales and earnings estimates. Today, some big US banks will go to the earnings confessional. The big banks benefited from ample deposit inflows following the Silicon Valley Bank (SVB) collapse in March, but their net interest income is expected to have declined, credit costs are normalizing, and they have increased expenses due to inflation. So, the numbers could be soft, but what matters for investors is the comparison between the numbers and expectations. If expectations are better than the actual numbers, stock prices will not be hurt. And that’s why Goldman Sachs is out trying to dampen expectations, so that the results can more easily beat them!
Technical Outlook and Review
DXY:
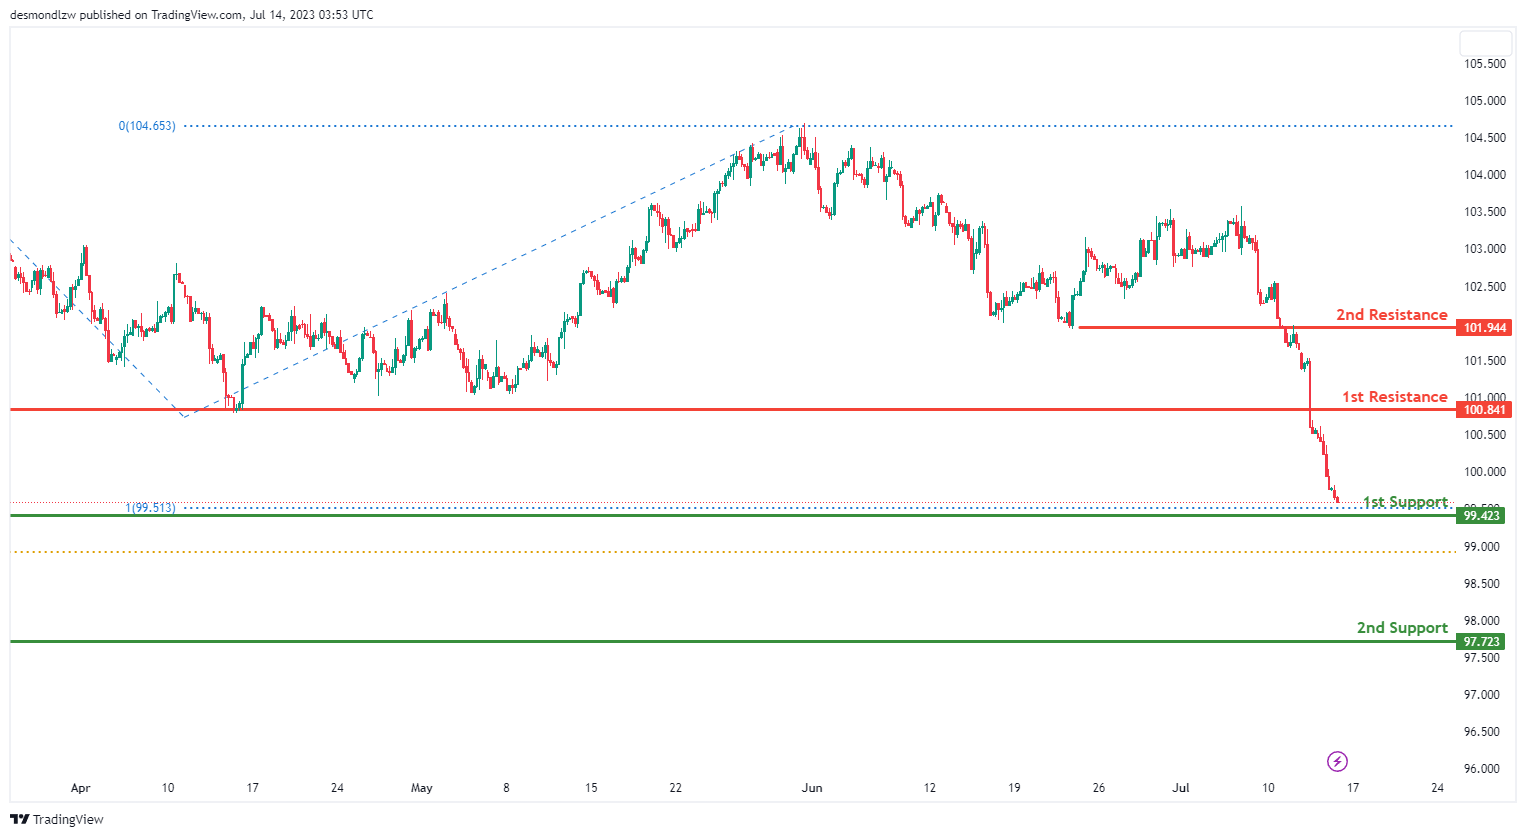
The DXY (US Dollar Index) chart is currently showing a bearish momentum. However, the market could potentially make a bullish bounce off the 1st support and move towards the 1st resistance.
The 1st support level is at 99.42. This is an overlap support and also a 100% Fibonacci Projection level. This suggests that the market has found buying interest at this price in the past, which could potentially cause a bounce upwards.
The 2nd support level is at 97.72. This is another overlap support, indicating a price level where historically buying interest has been strong. If the price drops further, this could be an area where buyers step in.
The 1st resistance level is at 100.84. This is known as a pullback resistance, meaning the price could face selling pressure and potentially reverse its direction when it reaches this level.
The 2nd resistance level is at 101.94. This is an overlap resistance level, signaling a price point where the market has previously encountered significant selling pressure. If the price rises to this level, it could attract sellers who may push prices down.
EUR/USD:
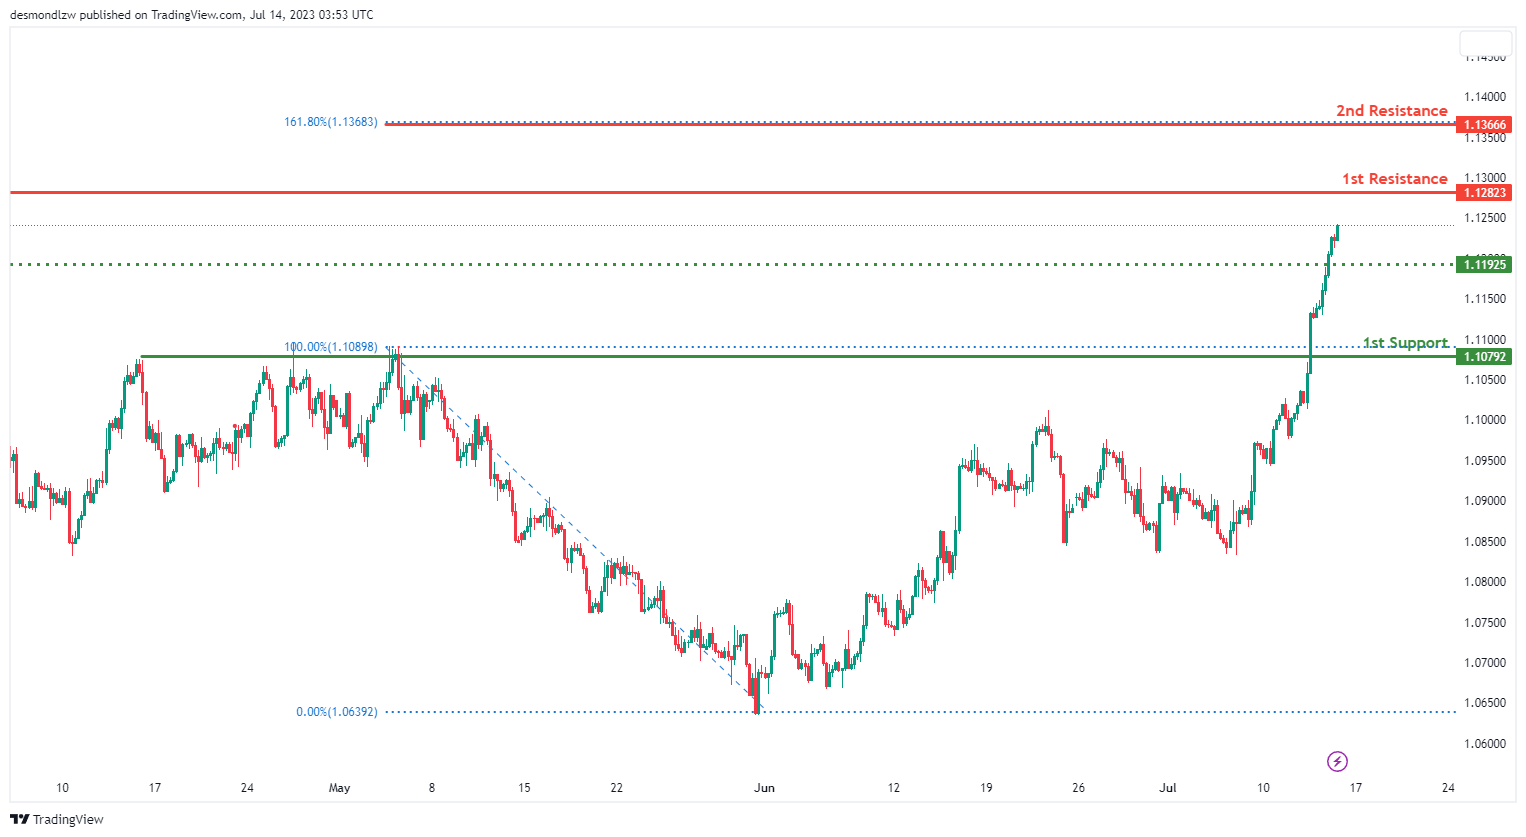
The EURUSD financial instrument currently presents a bullish overall trend on the chart, indicating the potential for a bullish continuation towards the primary resistance level. The 1st support level, positioned at 1.1079, represents a compelling pullback support, solidifying the lower bounds of the price. An intermediate support level is established at 1.1192, characterized by its role as an overlap support, further reinforcing the price floor. Regarding resistance, the 1st resistance level is set at 1.1367, defined by a 161.80% Fibonacci retracement, providing a significant upper boundary. Concurrently, the 2nd resistance level, at 1.1366, embodies a swing high resistance, underscoring its reliability as an upper limit.
EUR/JPY:
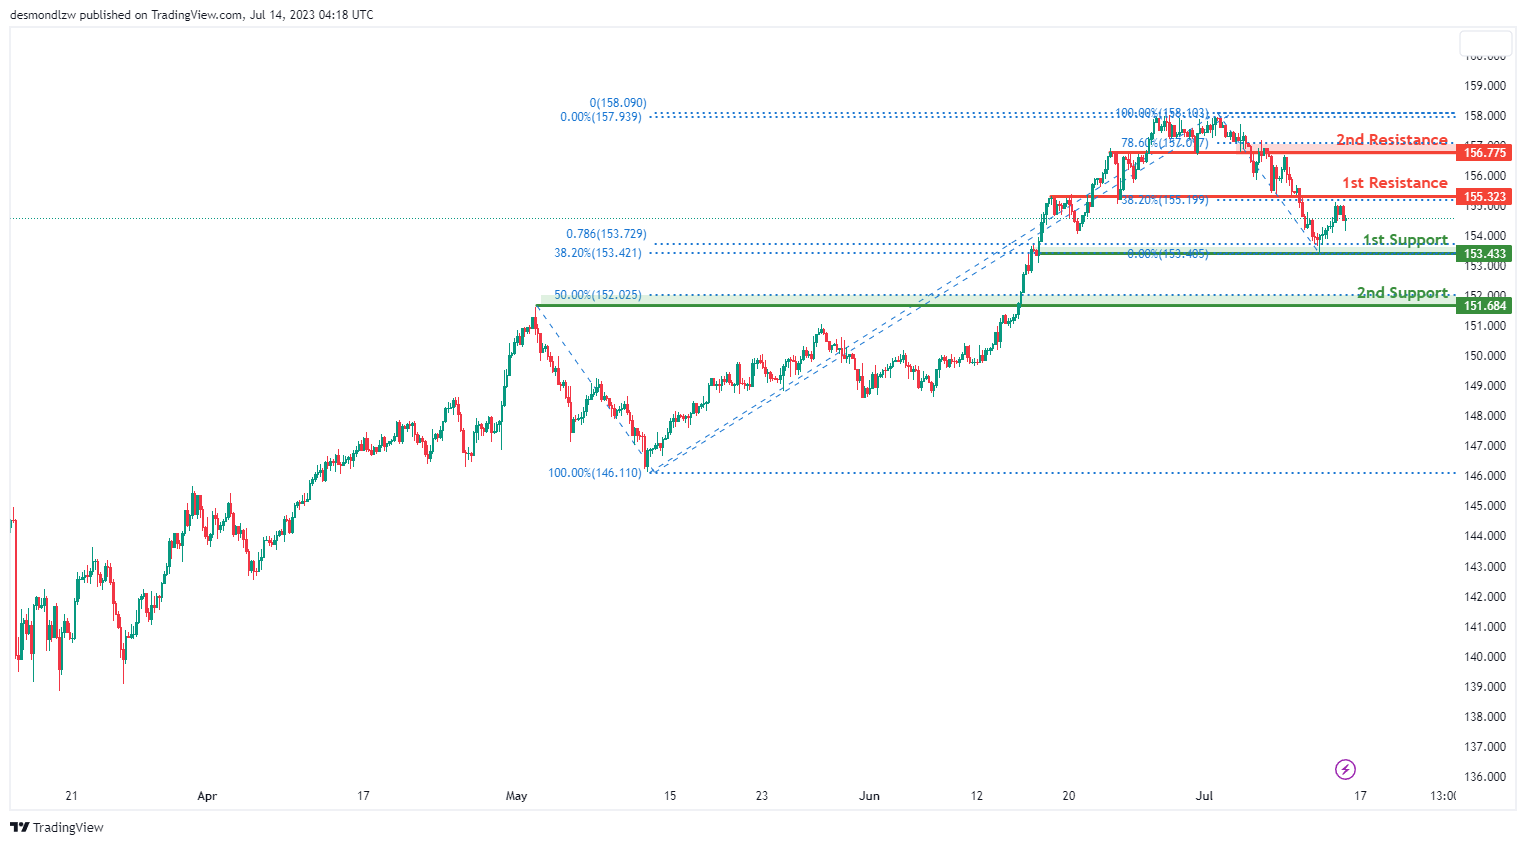
The EUR/JPY instrument is currently showing a bearish overall momentum. There is a possibility of a bearish continuation, indicating that the price could potentially move further downwards towards the first support level.
The 1st support level is located at 153.43 and is considered good due to its characteristics as a multi-swing low support. Additionally, it aligns with the 38.20% Fibonacci retracement and 78.60% Fibonacci projection, indicating Fibonacci confluence.
The 2nd support level is positioned at 151.68 and is recognized as an overlap support, further strengthening its significance. It corresponds to the 50% Fibonacci retracement level.
Moving on to the resistance levels, the 1st resistance is found at 155.32 and is considered good as it represents an overlap resistance. It also aligns with the 38.20% Fibonacci retracement level. The 2nd resistance level is located at 156.77 and is recognized as an overlap resistance. It corresponds to the 78.60% Fibonacci retracement level.
EUR/GBP:
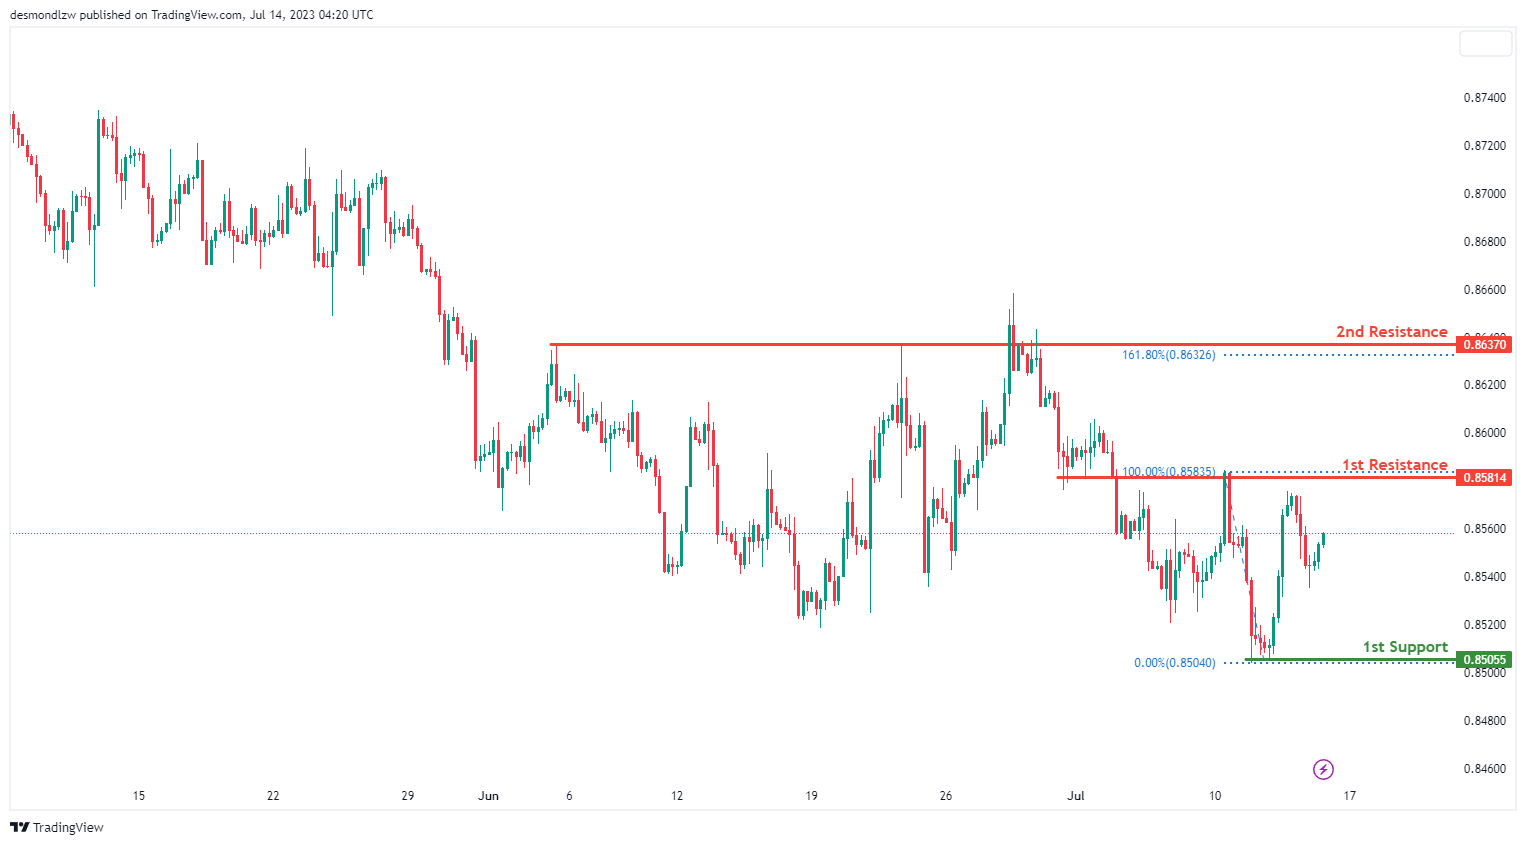
The EUR/GBP instrument is currently demonstrating a bearish momentum. There is a potential for a bearish reaction off the 1st resistance level, leading to a drop towards the 1st support level.
The 1st support level is situated at 0.8505 and is considered good as it represents a swing low support. This level has historically acted as a support area in the price movement.
On the other hand, the 1st resistance level is located at 0.8581 and is recognized as an overlap resistance. It indicates a significant price level where selling pressure may increase.
Additionally, there is a 2nd resistance level at 0.8637, which is also an overlap resistance. This level is further strengthened by the presence of the 161.80% Fibonacci extension.
GBP/USD:
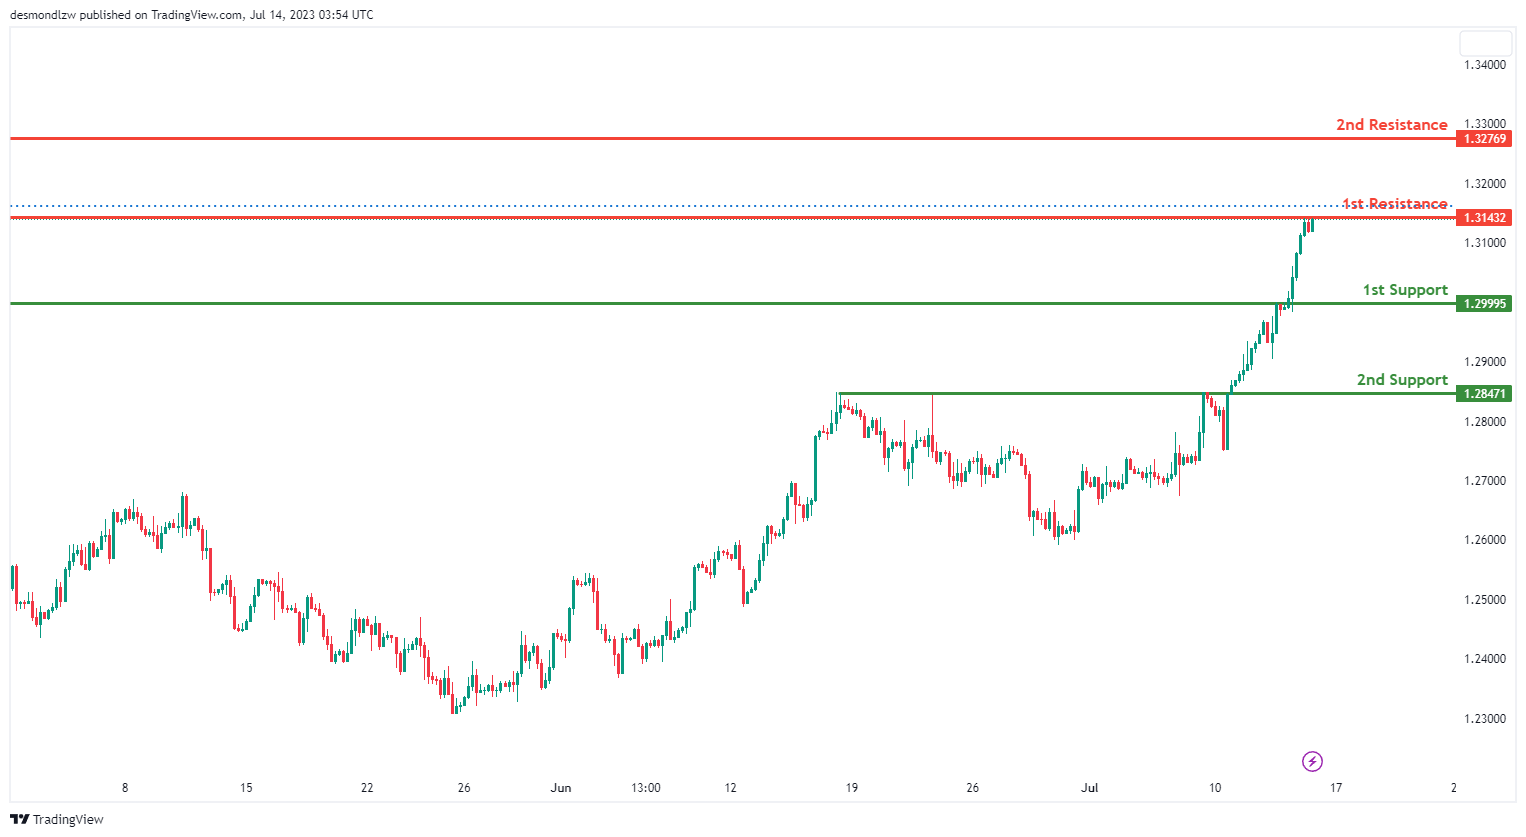
The GBP/USD chart is currently showing a bullish momentum. However, the price could potentially react off the 1st resistance and drop towards the 1st support level.
The 1st support level is at 1.2999. This level could be significant as it acts as a pullback support, suggesting that the price could find buying interest here, potentially bouncing upwards.
The 2nd support level is at 1.2847. This level could also act as a pullback support, suggesting another possible level where the market could find buyers and bounce.
The 1st resistance level is at 1.3143. This is a multi-swing high resistance level, suggesting that the price could face selling pressure at this point, potentially reversing its direction.
The 2nd resistance level is at 1.3276. This is an overlap resistance level, suggesting that this could be another point of potential price reversal due to selling pressure.
GBP/JPY:
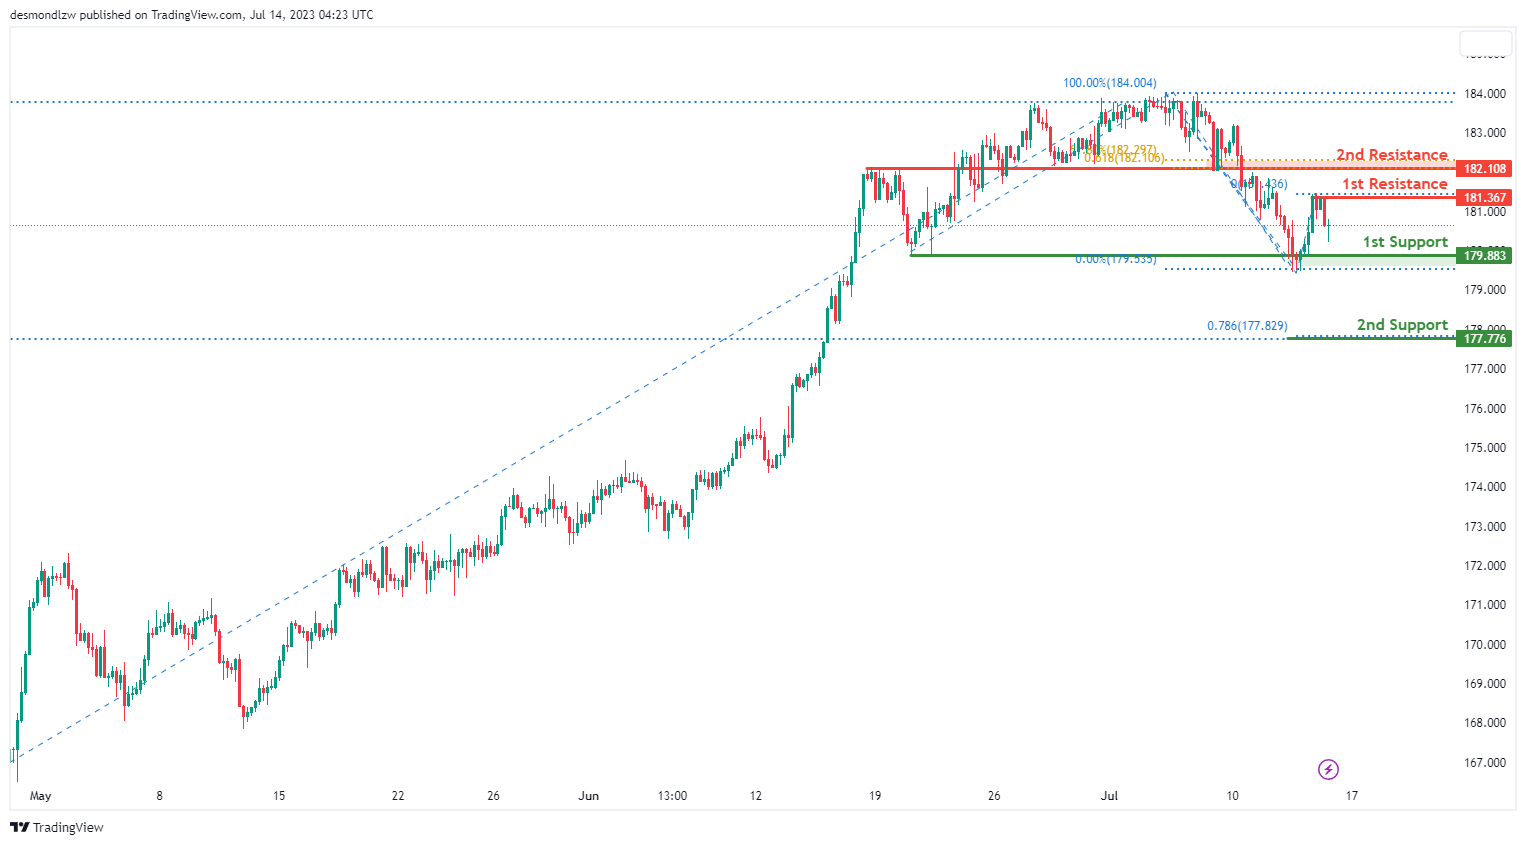
The GBP/JPY instrument is currently demonstrating a bearish momentum. There is a potential for a bearish reaction off the 1st resistance level, leading to a drop towards the 1st support level.
The 1st support level is located at 179.88 and is considered good as it represents a multi-swing low support. This level has historically acted as a support area in the price movement.
Furthermore, there is a 2nd support level at 177.77. This level is strengthened by the presence of both the 78.60% Fibonacci projection and the 23.60% Fibonacci retracement, indicating a potential Fibonacci confluence.
On the upside, the 1st resistance level is situated at 181.36 and is recognized as a swing high resistance. It represents a significant price level where selling pressure may increase.
Additionally, there is a 2nd resistance level at 182.10, which is an overlap resistance. This level is further supported by the presence of both the 61.80% Fibonacci retracement and the 61.80% Fibonacci projection, indicating a potential Fibonacci confluence.
USD/CHF:
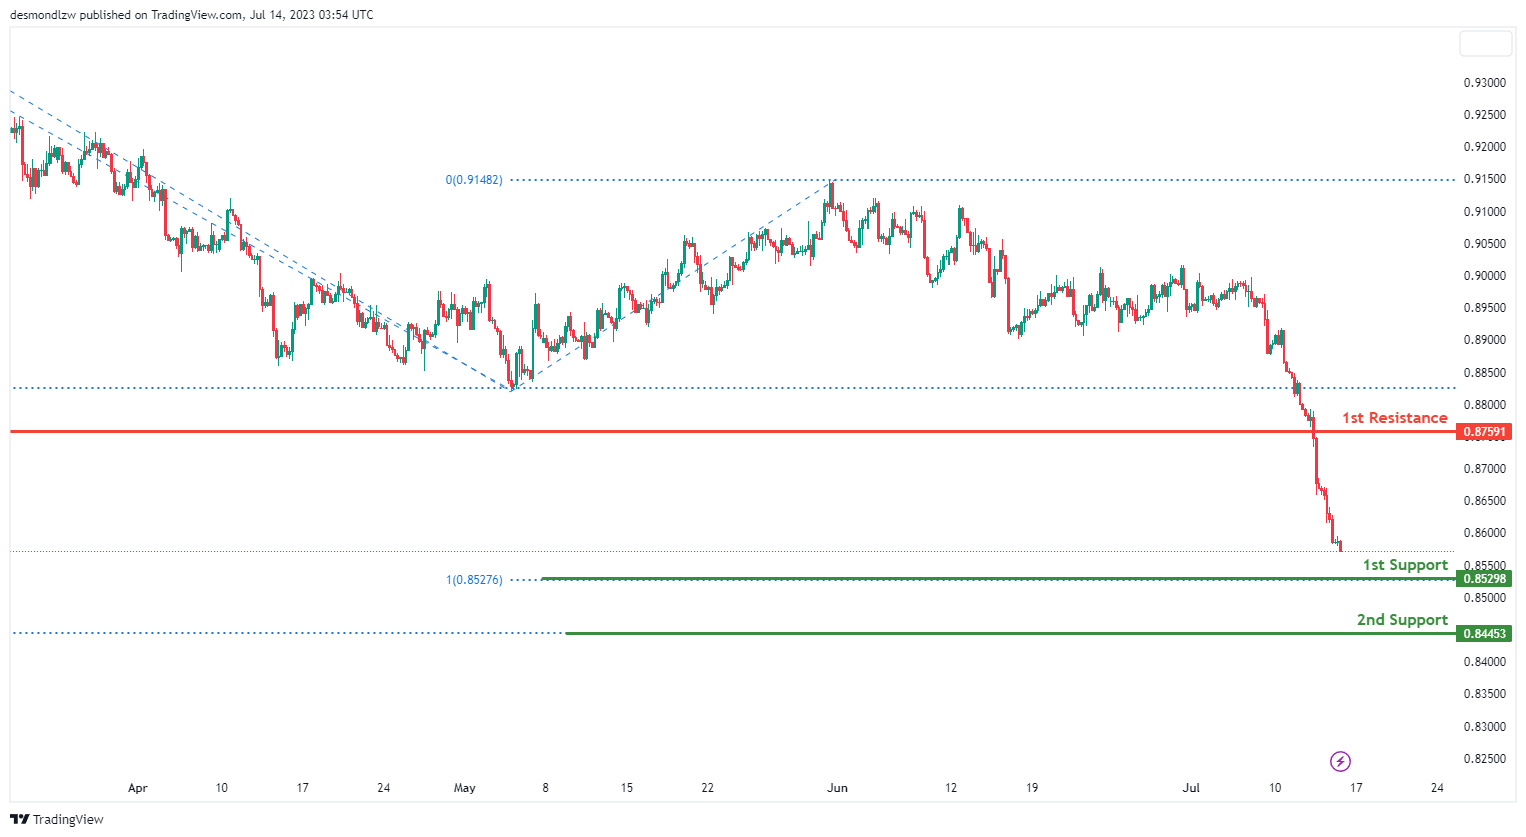
The USD/CHF chart is currently showing a bearish momentum. The market could potentially make a bearish continuation towards the 1st support level.
The 1st support level is at 0.8529. This level is significant as it aligns with a 100% Fibonacci projection, suggesting a price point where the market could find buying interest and potentially bounce upwards.
The 2nd support level is at 0.8445. This level is also significant as it aligns with a -61.8% Fibonacci expansion, another potential level where buyers could enter the market, providing further support.
The 1st resistance level is at 0.8759, which is considered a pullback resistance. This means the price could face selling pressure and potentially reverse its direction when it reaches this level.
Given the bearish momentum, the market may continue its descent towards the 1st support. However, if the price manages to bounce off the support and break past the resistance, we might see a shift in market sentiment.
USD/JPY:
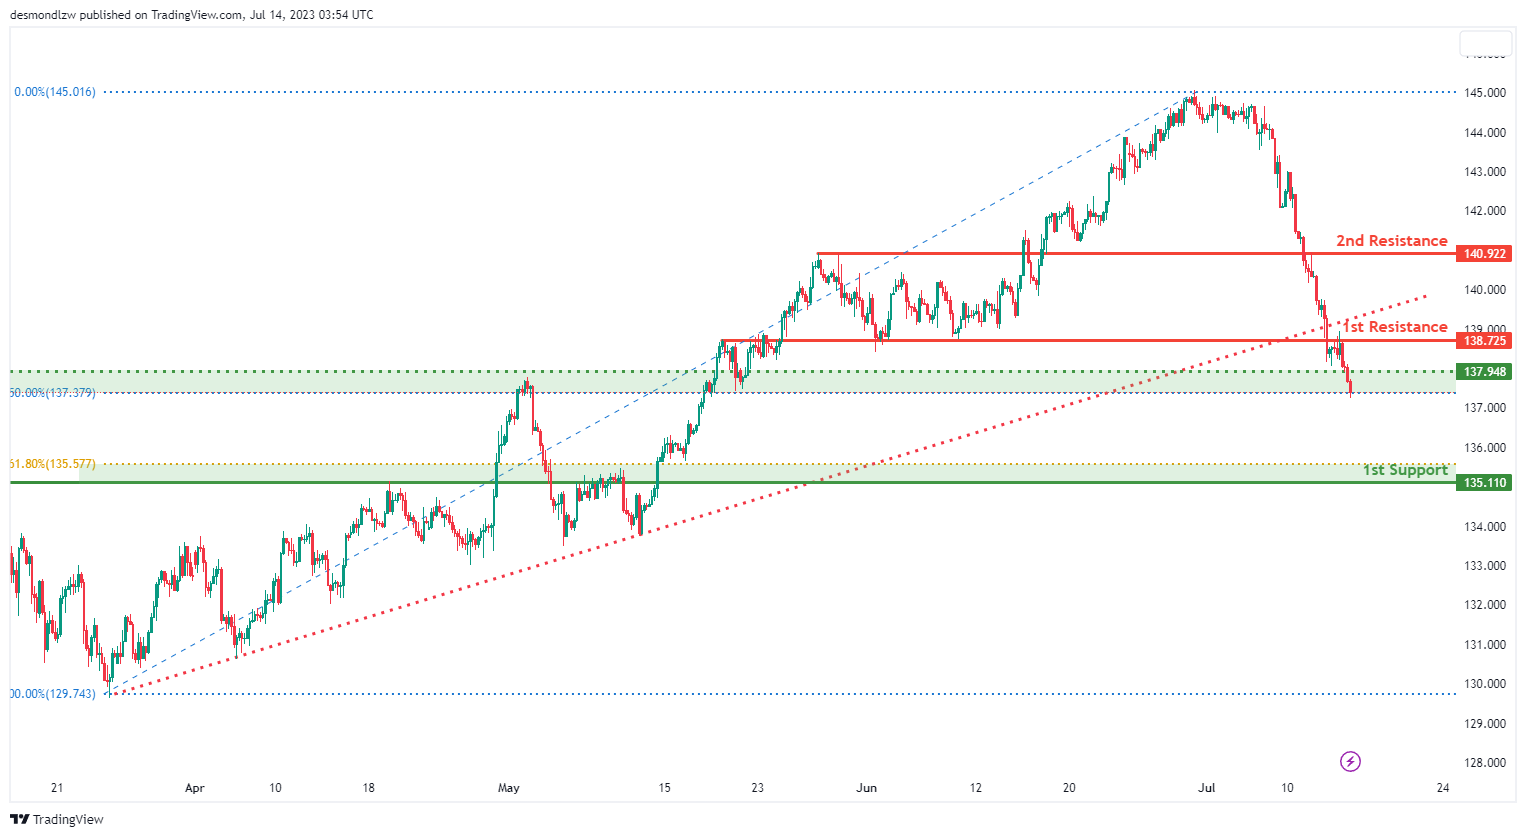
The USD/JPY chart is currently showing a bearish momentum, primarily due to the price breaking below an ascending support line. This break might trigger a potential bearish move. However, the market could potentially make a bullish bounce off the 1st support and head towards the 1st resistance level
The 1st support level is at 0.8529. This level is significant as it aligns with an overlap support and the 50% Fibonacci retracement level. It suggests a price point where the market could find buying interest and potentially bounce upwards.
An intermediate support level is at 0.8445. This level is also significant as it aligns with an overlap support and the 61.80% Fibonacci retracement level. This is another potential level where buyers could enter the market, providing further support.
The 1st resistance level is at 138.7200, which is considered an overlap resistance. This means the price could face selling pressure and potentially reverse its direction when it reaches this level.
The 2nd resistance level is at 140.9200, which is also an overlap resistance.
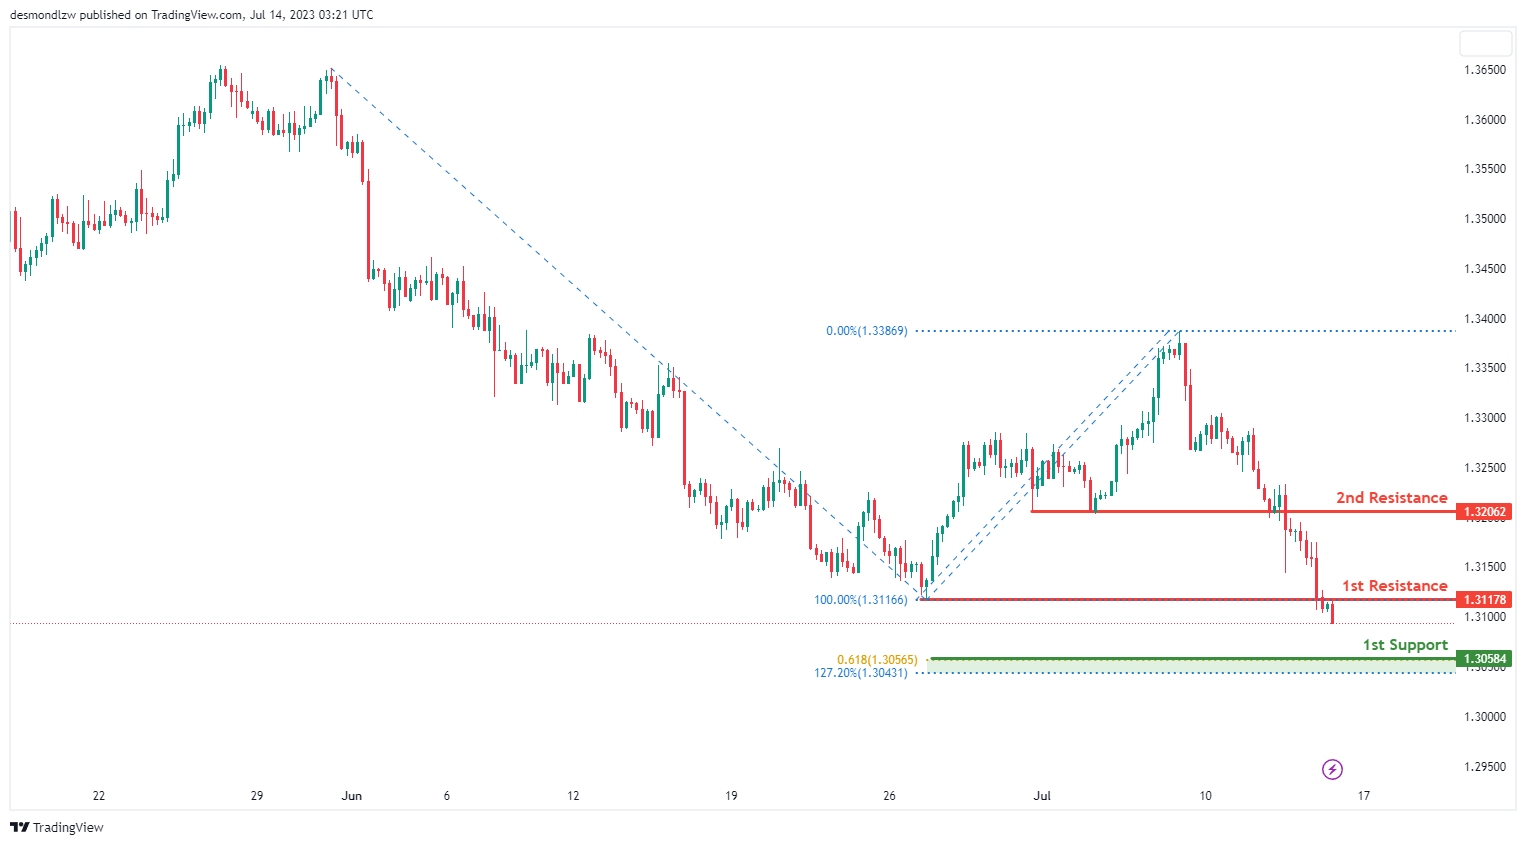
USD/CAD:
The USD/CAD pair currently exhibits a bearish trend, indicating a potential continuation of this bearish momentum towards the 1st support level.
The 1st support level is located at 1.3058 and serves as an overlap support. Moreover, it aligns with the 61.80% Fibonacci projection and 127.20% Fibonacci extension levels, bolstering its significance backed by a confluence of Fibonacci levels.
On the other hand, if the price reverses and ascends, it could encounter the 1st resistance level at 1.3118. This level, recognized as an overlap resistance, could pose a significant barrier to upward price movements. Further upward, the 2nd resistance level is found at 1.3206, another overlap resistance, which could serve as an additional hurdle for further price ascents.
AUD/USD:
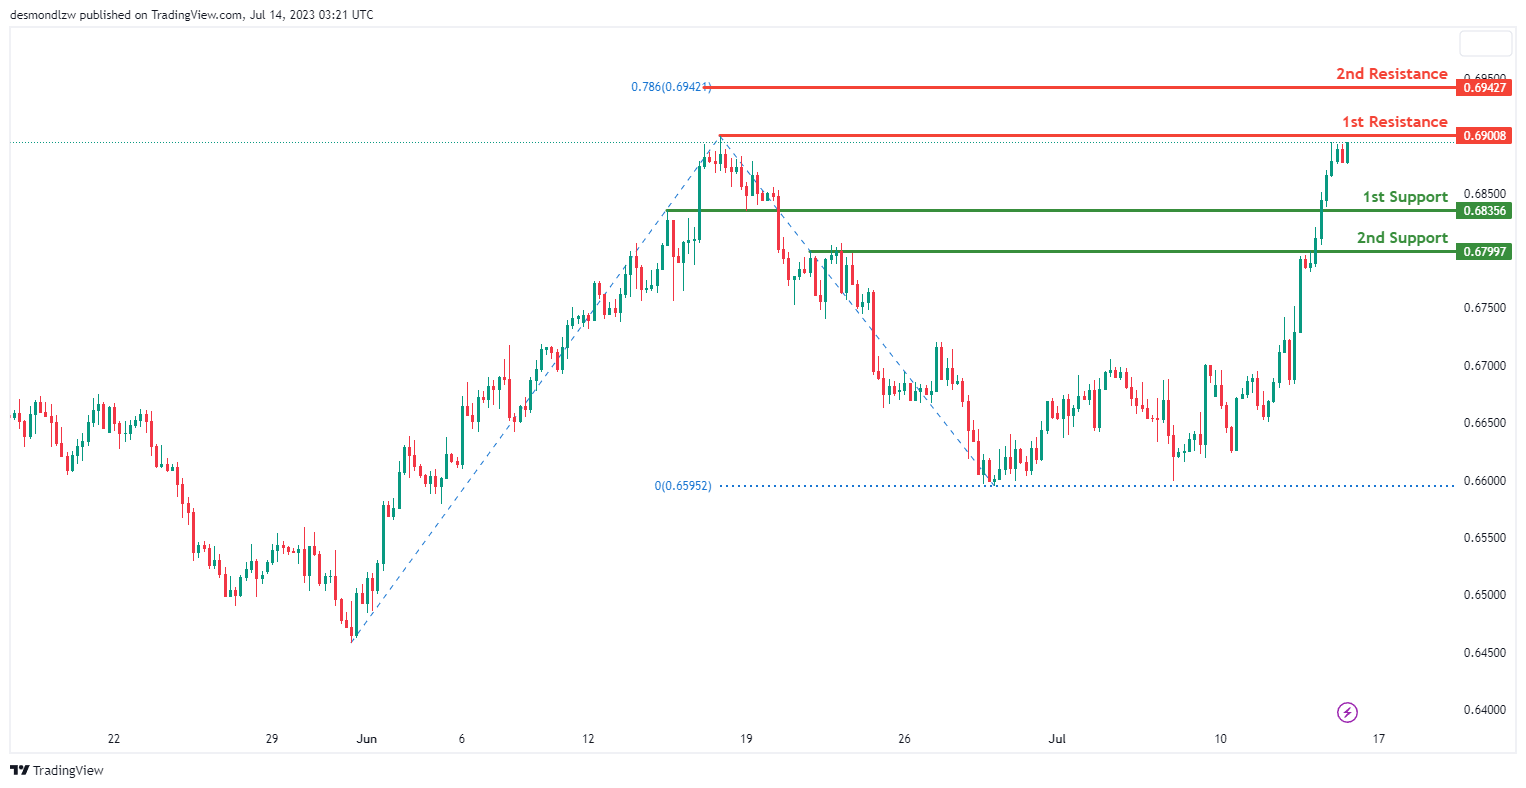
The AUD/USD pair is presently showing a bullish trend, implying a potential continuation of this momentum towards the 1st resistance level.
On the downside, the 1st support level is identified at 0.6836, acting as an overlap support and offering a significant degree of price stability. Further protection against a possible price decline is offered by the 2nd support level, located at 0.6799, also classified as an overlap support.
On the bullish side, the price may continue its upward trajectory towards the 1st resistance level set at 0.6901. This overlap resistance could serve as a significant barrier to upward price movements. If the price manages to breach this level, it could aim for the 2nd resistance level at 0.6943. This overlap resistance coincides with a 78.60% Fibonacci projection level, enhancing its potential to resist further price ascents.
NZD/USD
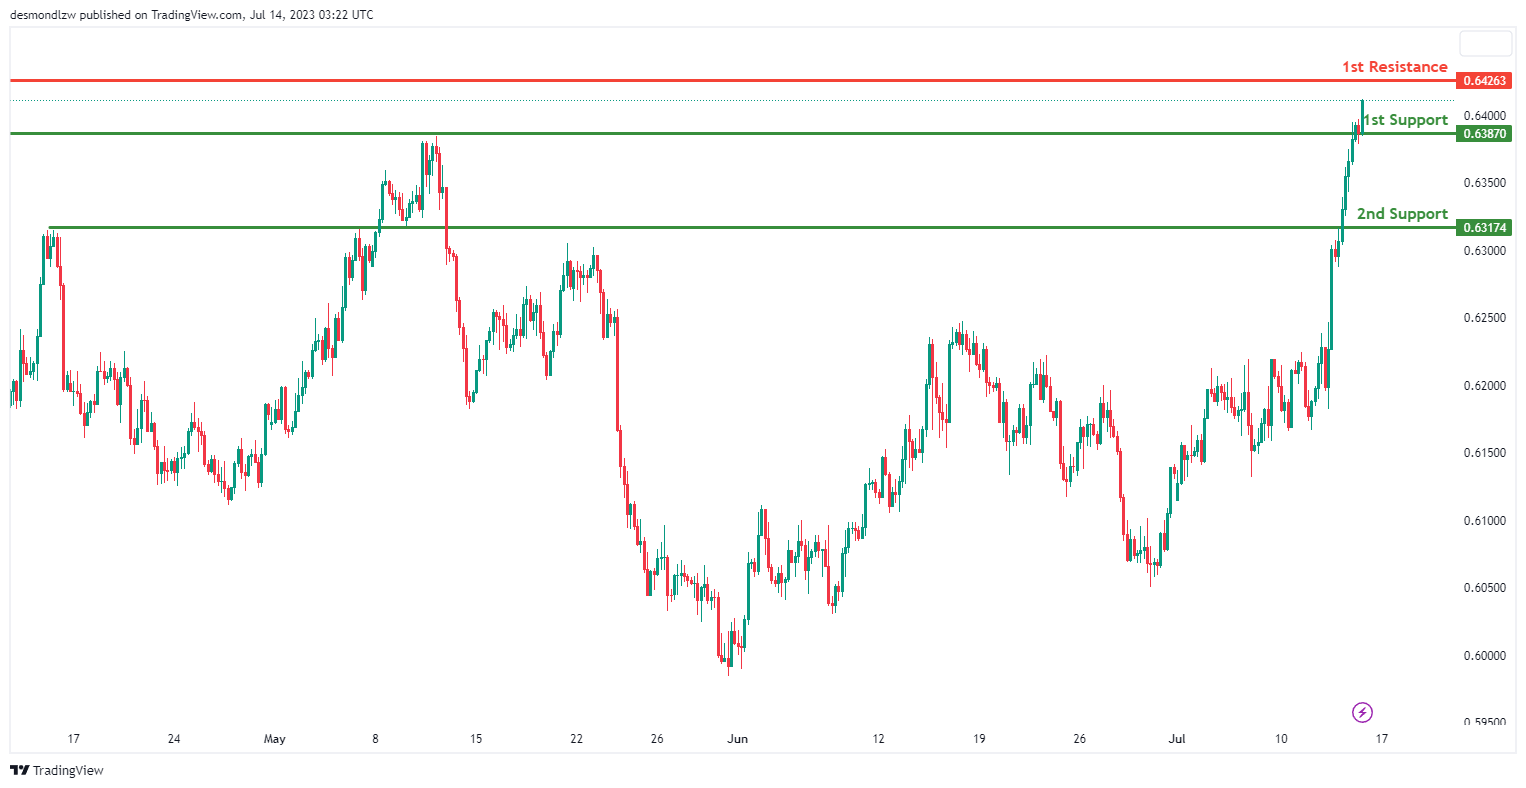
The NZD/USD pair is currently demonstrating a bullish momentum, suggesting a potential bullish continuation towards the 1st resistance level.
On the downside, the 1st support level is identified at 0.6387, acting as an overlap support, providing considerable price stability. Furthermore, a 2nd support level is found at 0.6317, which also functions as an overlap support, offering additional protection for potential downward price movements.
On the upside, the price could potentially continue its bullish trend towards the 1st resistance level situated at 0.6426. This level, characterized as an overlap resistance, could pose a significant hurdle for further price ascension.
DJ30:
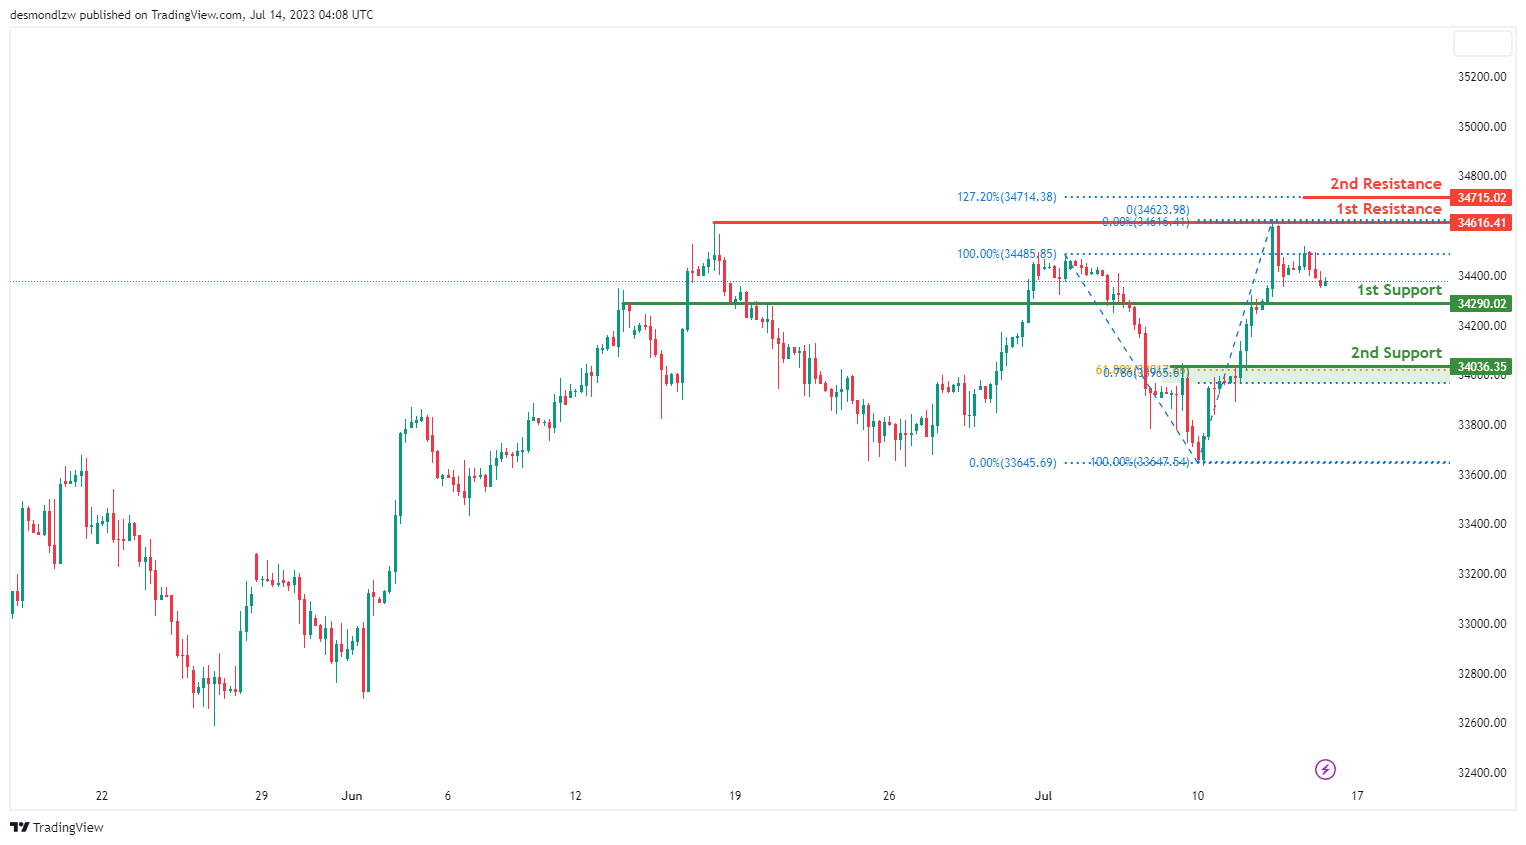
The DJ30 (Dow Jones Industrial Average) chart currently exhibits a bullish momentum. There is potential for the price to make a bullish bounce off the 1st support and head towards the 1st resistance.
The 1st support level is located at 34290.02 and is considered good as it represents a pullback support. The 2nd support level is positioned at 34036.35 and is recognized as an overlap support, along with the presence of a 61.80% Fibonacci retracement and 78.60% Fibonacci projection, indicating Fibonacci confluence.
Moving on to the resistance levels, the 1st resistance is found at 34616.41 and is deemed significant as it represents a multi-swing high resistance. The 2nd resistance level is situated at 34715.02 and is considered noteworthy due to the presence of a 127.20% Fibonacci extension.
GER30:
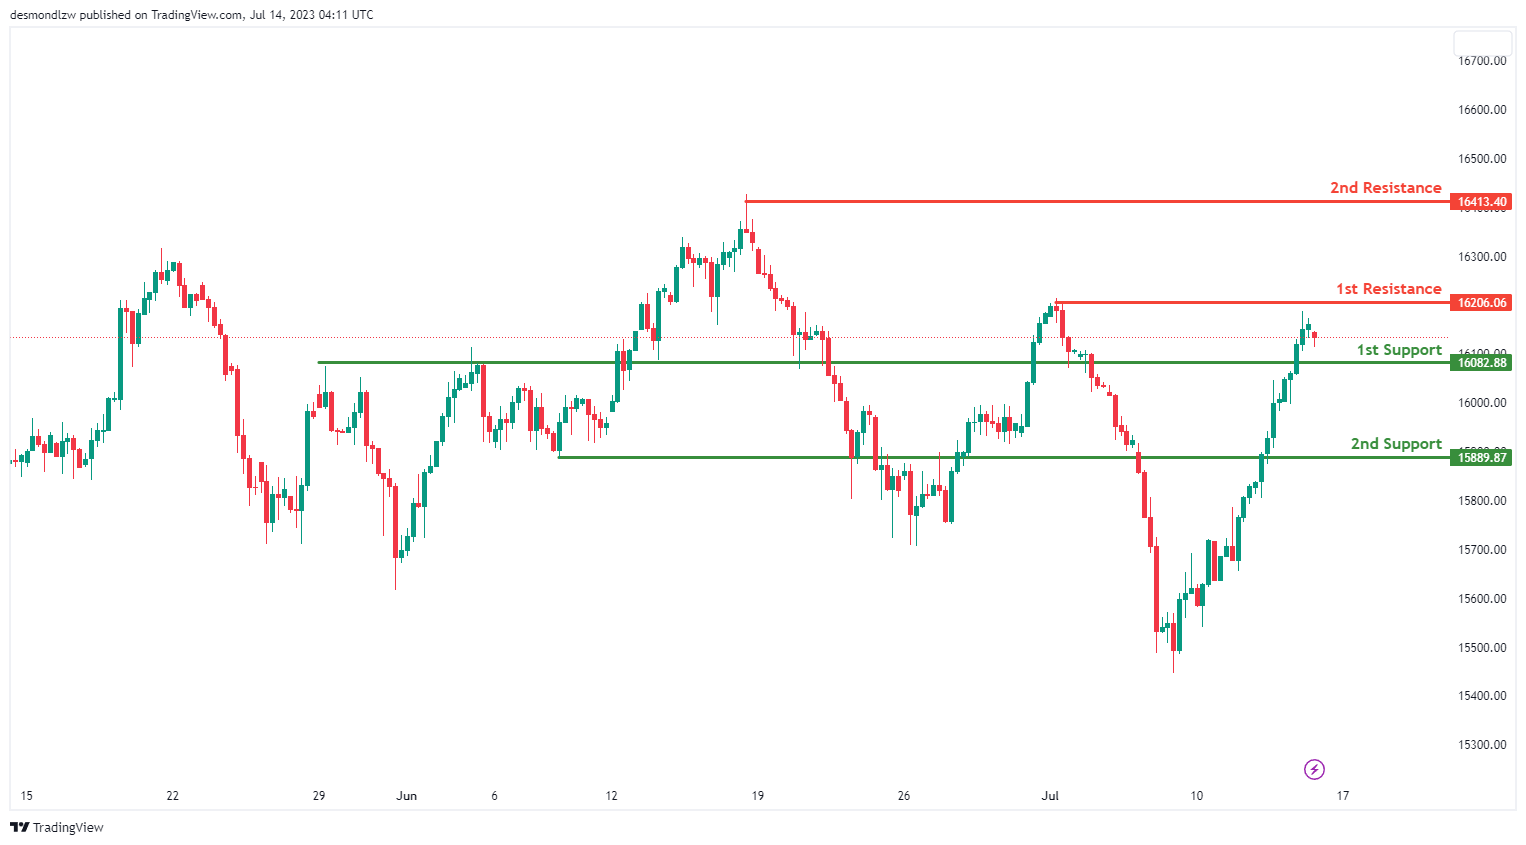
The GER30 (DAX) chart currently exhibits a bullish momentum. There is potential for the price to drop further to the 1st support in the short term before bouncing from there and rising towards the 1st resistance.
The 1st support level is located at 16082.88 and is considered good as it represents a pullback support. The 2nd support level is positioned at 15889.87 and is recognized as an overlap support.
Moving on to the resistance levels, the 1st resistance is found at 16206.06 and is deemed significant as it represents a swing high resistance. The 2nd resistance level is situated at 16413.40 and is also recognized as a swing high resistance.
US500
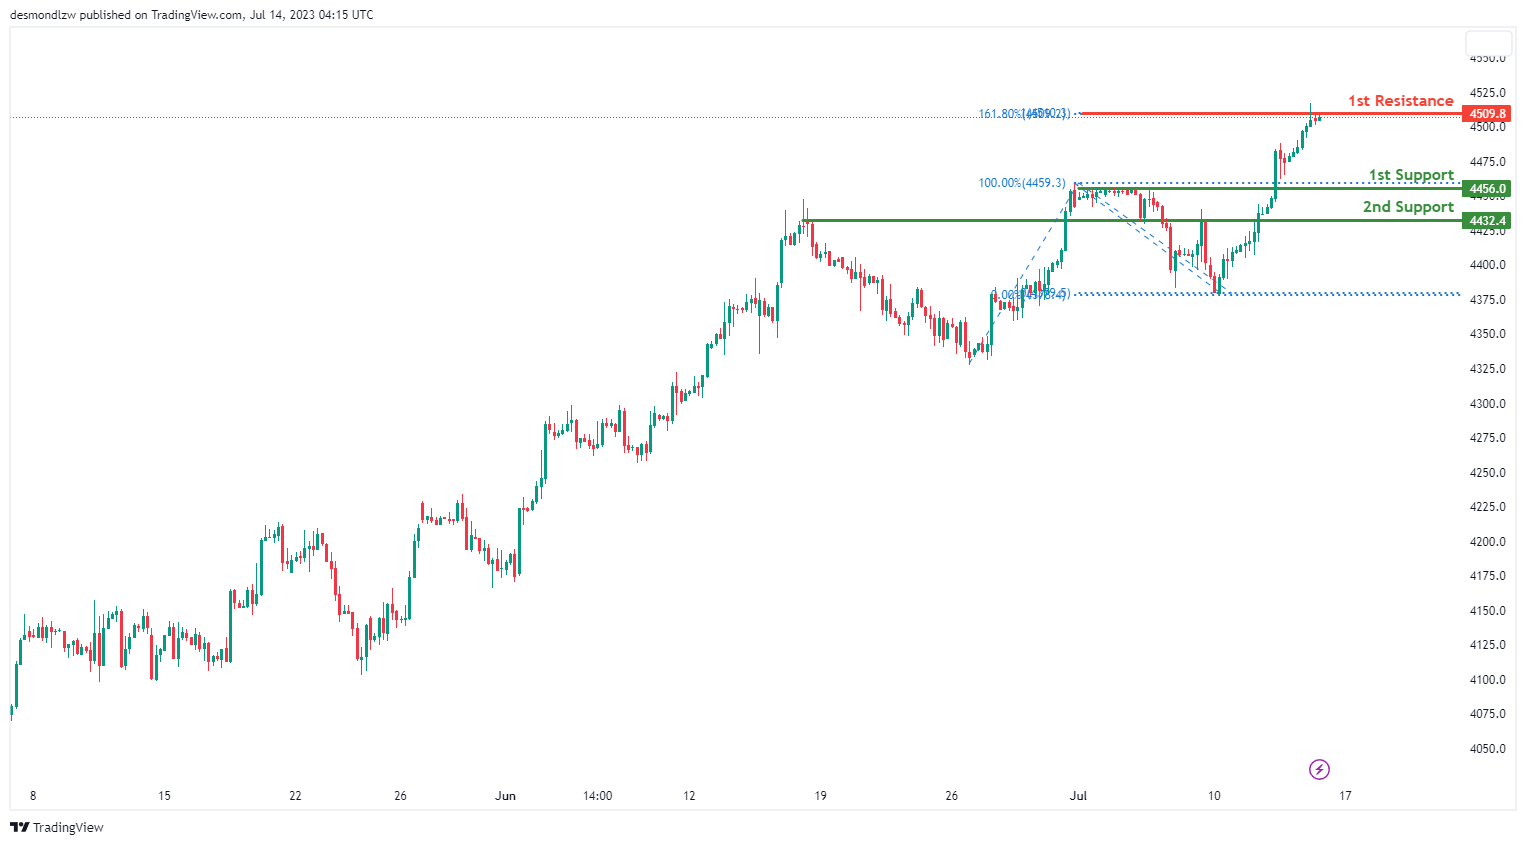
The US500 (S&P 500) chart currently exhibits a bearish momentum. There is potential for the price to experience a bearish reaction off the 1st resistance and drop to the 1st support.
The 1st support level is located at 4456.0 and is considered good as it represents a pullback support. The 2nd support level is positioned at 4432.4 and is recognized as an overlap support.
Moving on to the resistance level, the 1st resistance is found at 4509.8 and is deemed significant due to the presence of a 161.80% Fibonacci extension and 100% Fibonacci expansion, indicating Fibonacci confluence.
BTC/USD:
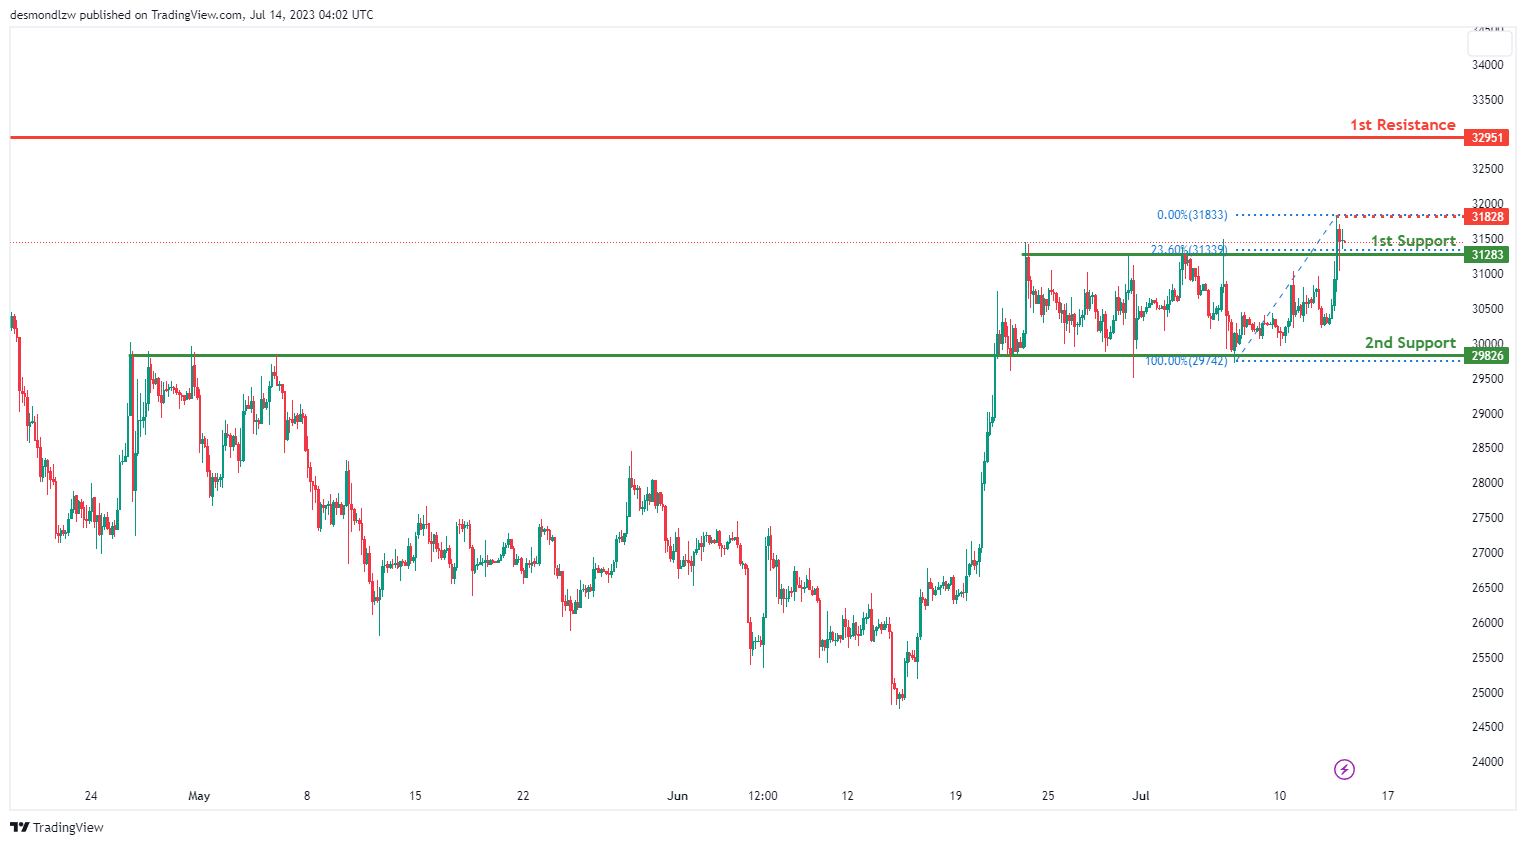
The BTC/USD instrument currently exhibits a bullish momentum. There is potential for the price to make a bullish bounce off the 1st support and head towards the 1st resistance.
The 1st support level is located at 31283 and is considered significant as it represents an overlap support, along with the 23.60% Fibonacci retracement. The 2nd support level is positioned at 29826 and is recognized as another overlap support.
Moving on to the resistance levels, the 1st resistance is found at 32951 and is deemed significant as it represents a swing high resistance. Additionally, there is an intermediate resistance level at 31828.
ETH/USD:
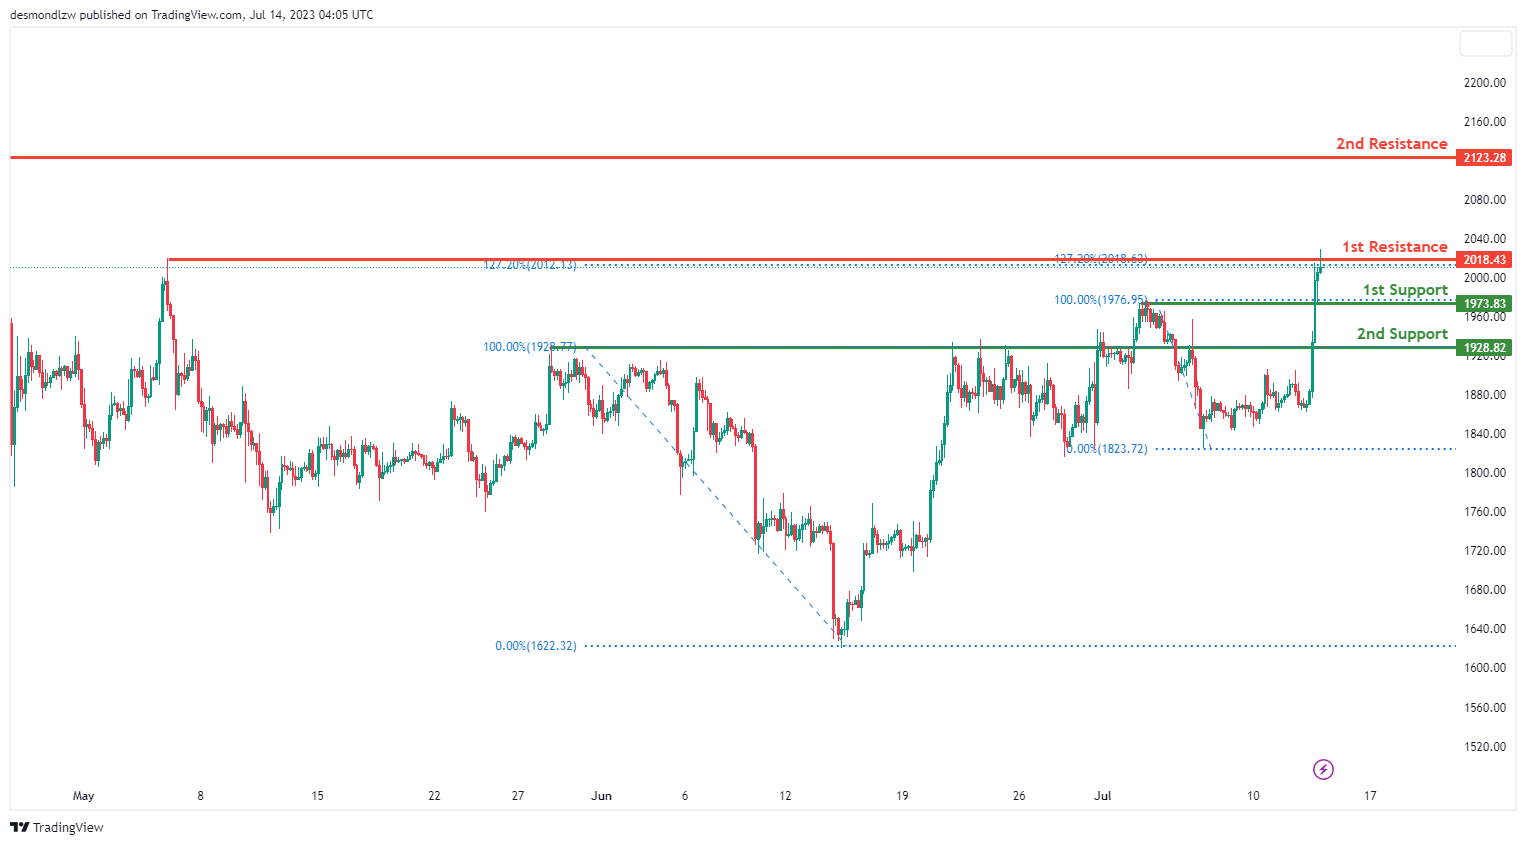
The ETH/USD instrument currently demonstrates a bearish momentum. There is potential for the price to make a bearish reaction off the 1st resistance and drop towards the 1st support.
The 1st support level is located at 1973.83 and is considered good as it represents a pullback support. The 2nd support level is positioned at 1928.82 and is recognized as an overlap support.
Moving on to the resistance levels, the 1st resistance is found at 2018.43 and is deemed significant as it represents a swing high resistance, along with the 127.20% Fibonacci extension. The 2nd resistance level is situated at 2123.28 and is considered noteworthy as it represents a multi-swing high resistance.
WTI/USD:
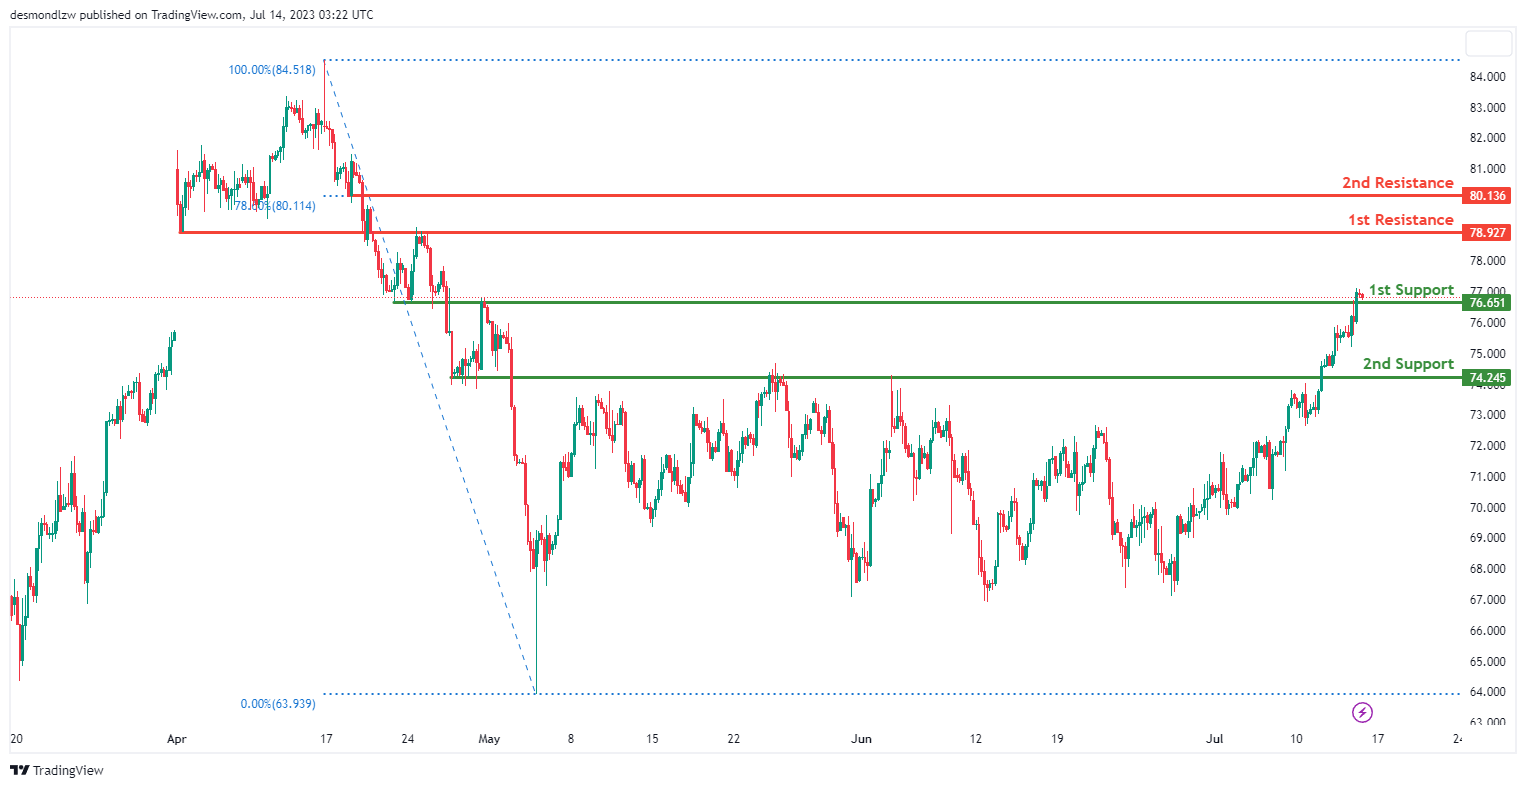
The WTI/USD chart is currently showing weak bullish momentum with low confidence. It’s anticipated that the price could potentially drop to the 1st support level in the short term before bouncing back and rising towards the 1st resistance level.
The 1st support level is at 76.65 and is characterized as an overlap support, offering a considerable level of price stability. Further down, the 2nd support level is found at 74.25, although no specific characteristics are mentioned to emphasize its significance.
On the upside, if the price reverses and ascends, it could encounter the 1st resistance level at 78.93, an overlap resistance, which could serve as a considerable barrier to upward price movements. If the price surpasses this level, it could aim for the 2nd resistance at 80.14, which is also an overlap resistance and aligns with a 78.60% Fibonacci retracement level, further strengthening its role as a potential barrier.
XAU/USD (GOLD):
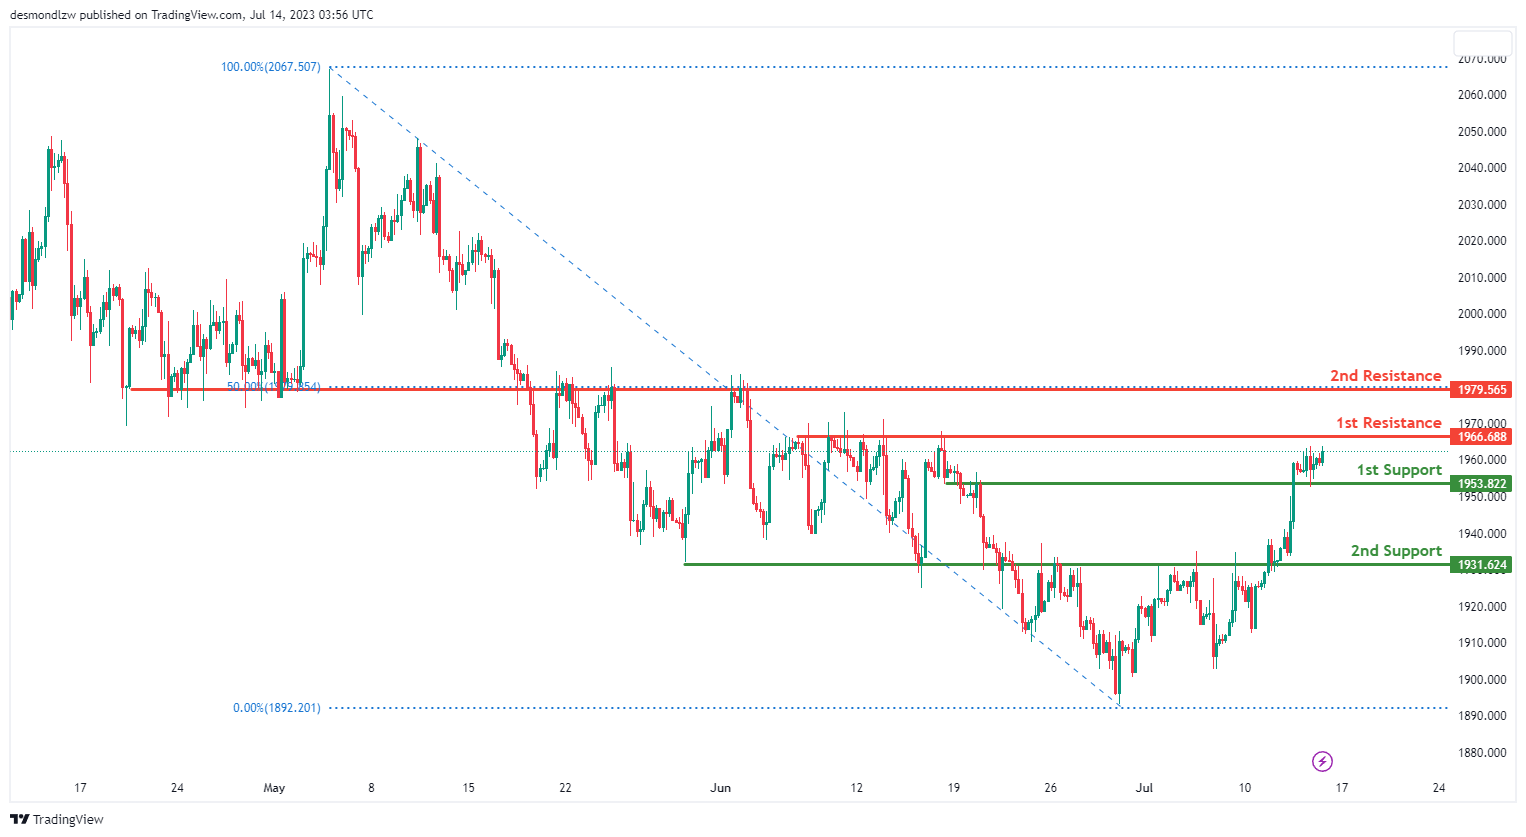
The XAUUSD chart currently shows a neutral momentum, indicating that the price may fluctuate between the 1st resistance and 1st support level.
The 1st support level is at 1953.82. This is an overlap support level which suggests that it might have a concentration of buyers, possibly leading to a price bounce if it reaches this point.
The 2nd support level is at 1931.62. It is also an overlap support, implying another potential area of buying interest that could lead to a price rebound.
The 1st resistance level is at 1966.68. It represents a multi-swing high resistance, which means that the price has faced selling pressure and turned down at this level multiple times in the past, indicating potential future resistance.
The 2nd resistance level is at 1979.56. This is an overlap resistance and also corresponds to the 50% Fibonacci retracement level. Such confluence of technical factors can often make these levels particularly robust.
GBP/USD Daily Outlook
Daily Pivots: (S1) 1.3032; (P) 1.3087; (R1) 1.3190; More...
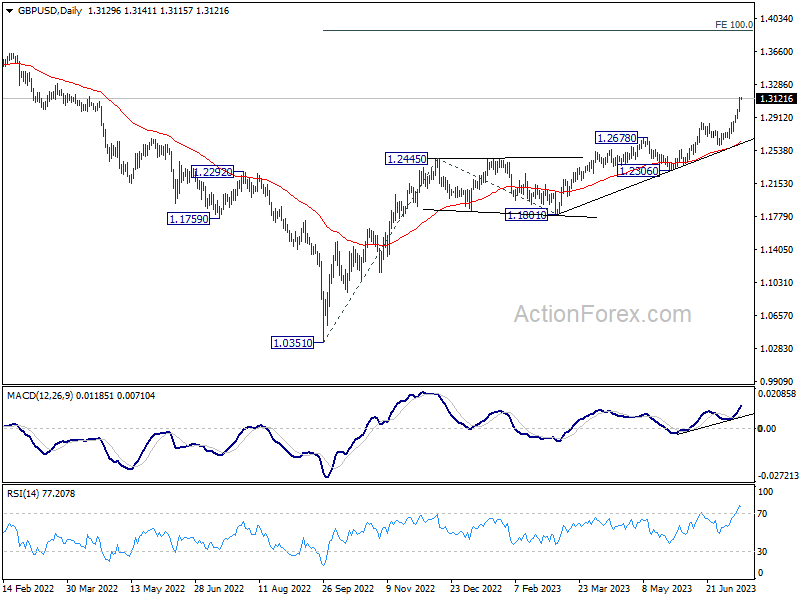
Intraday bias in GBP/USD remains on the upside for the moment. Current rally is part of the up trend from 1.0351. Next target is 100% projection of 1.0351 to 1.2445 from 1.1801 at 1.3895.On the downside, below 1.3043 minor support will turn intraday bias neutral first. But retreat should be contained by 1.2847 resistance turned support to bring another rally.
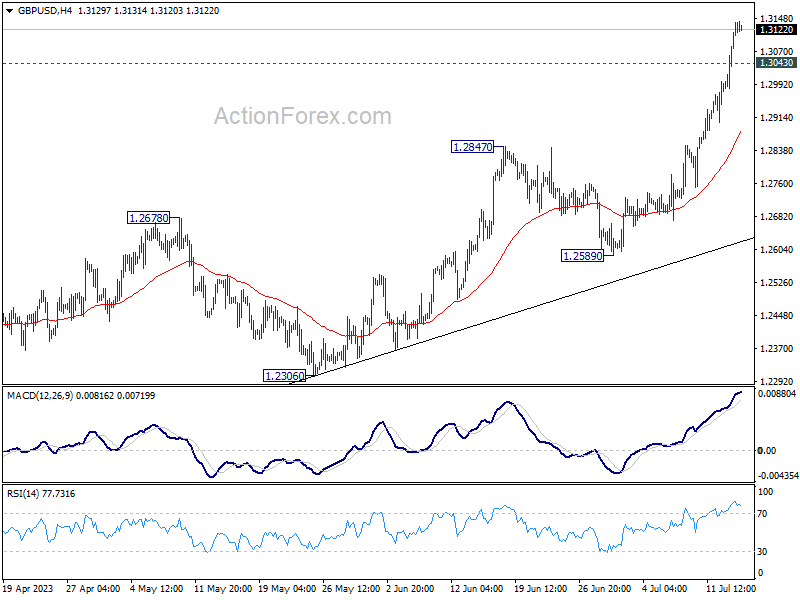
In the bigger picture, the strong support from 55 W EMA (now at 1.2341) is a medium term bullish sign. Outlook will stay bullish as long as 1.2445 resistance turned support holds. Rise from 1.0351 medium term bottom (2022 low) is expected to extend further to retest 1.4248 key resistance (2021 high).